
The Effect of Caloric Restriction with and without n-3 PUFA Supplementation on Bone Turnover Markers in Blood of Subjects with Abdominal Obesity: A Randomized Placebo-Controlled Trial

 , , , ,
Abstract
:1. Introduction
2. Materials and Methods
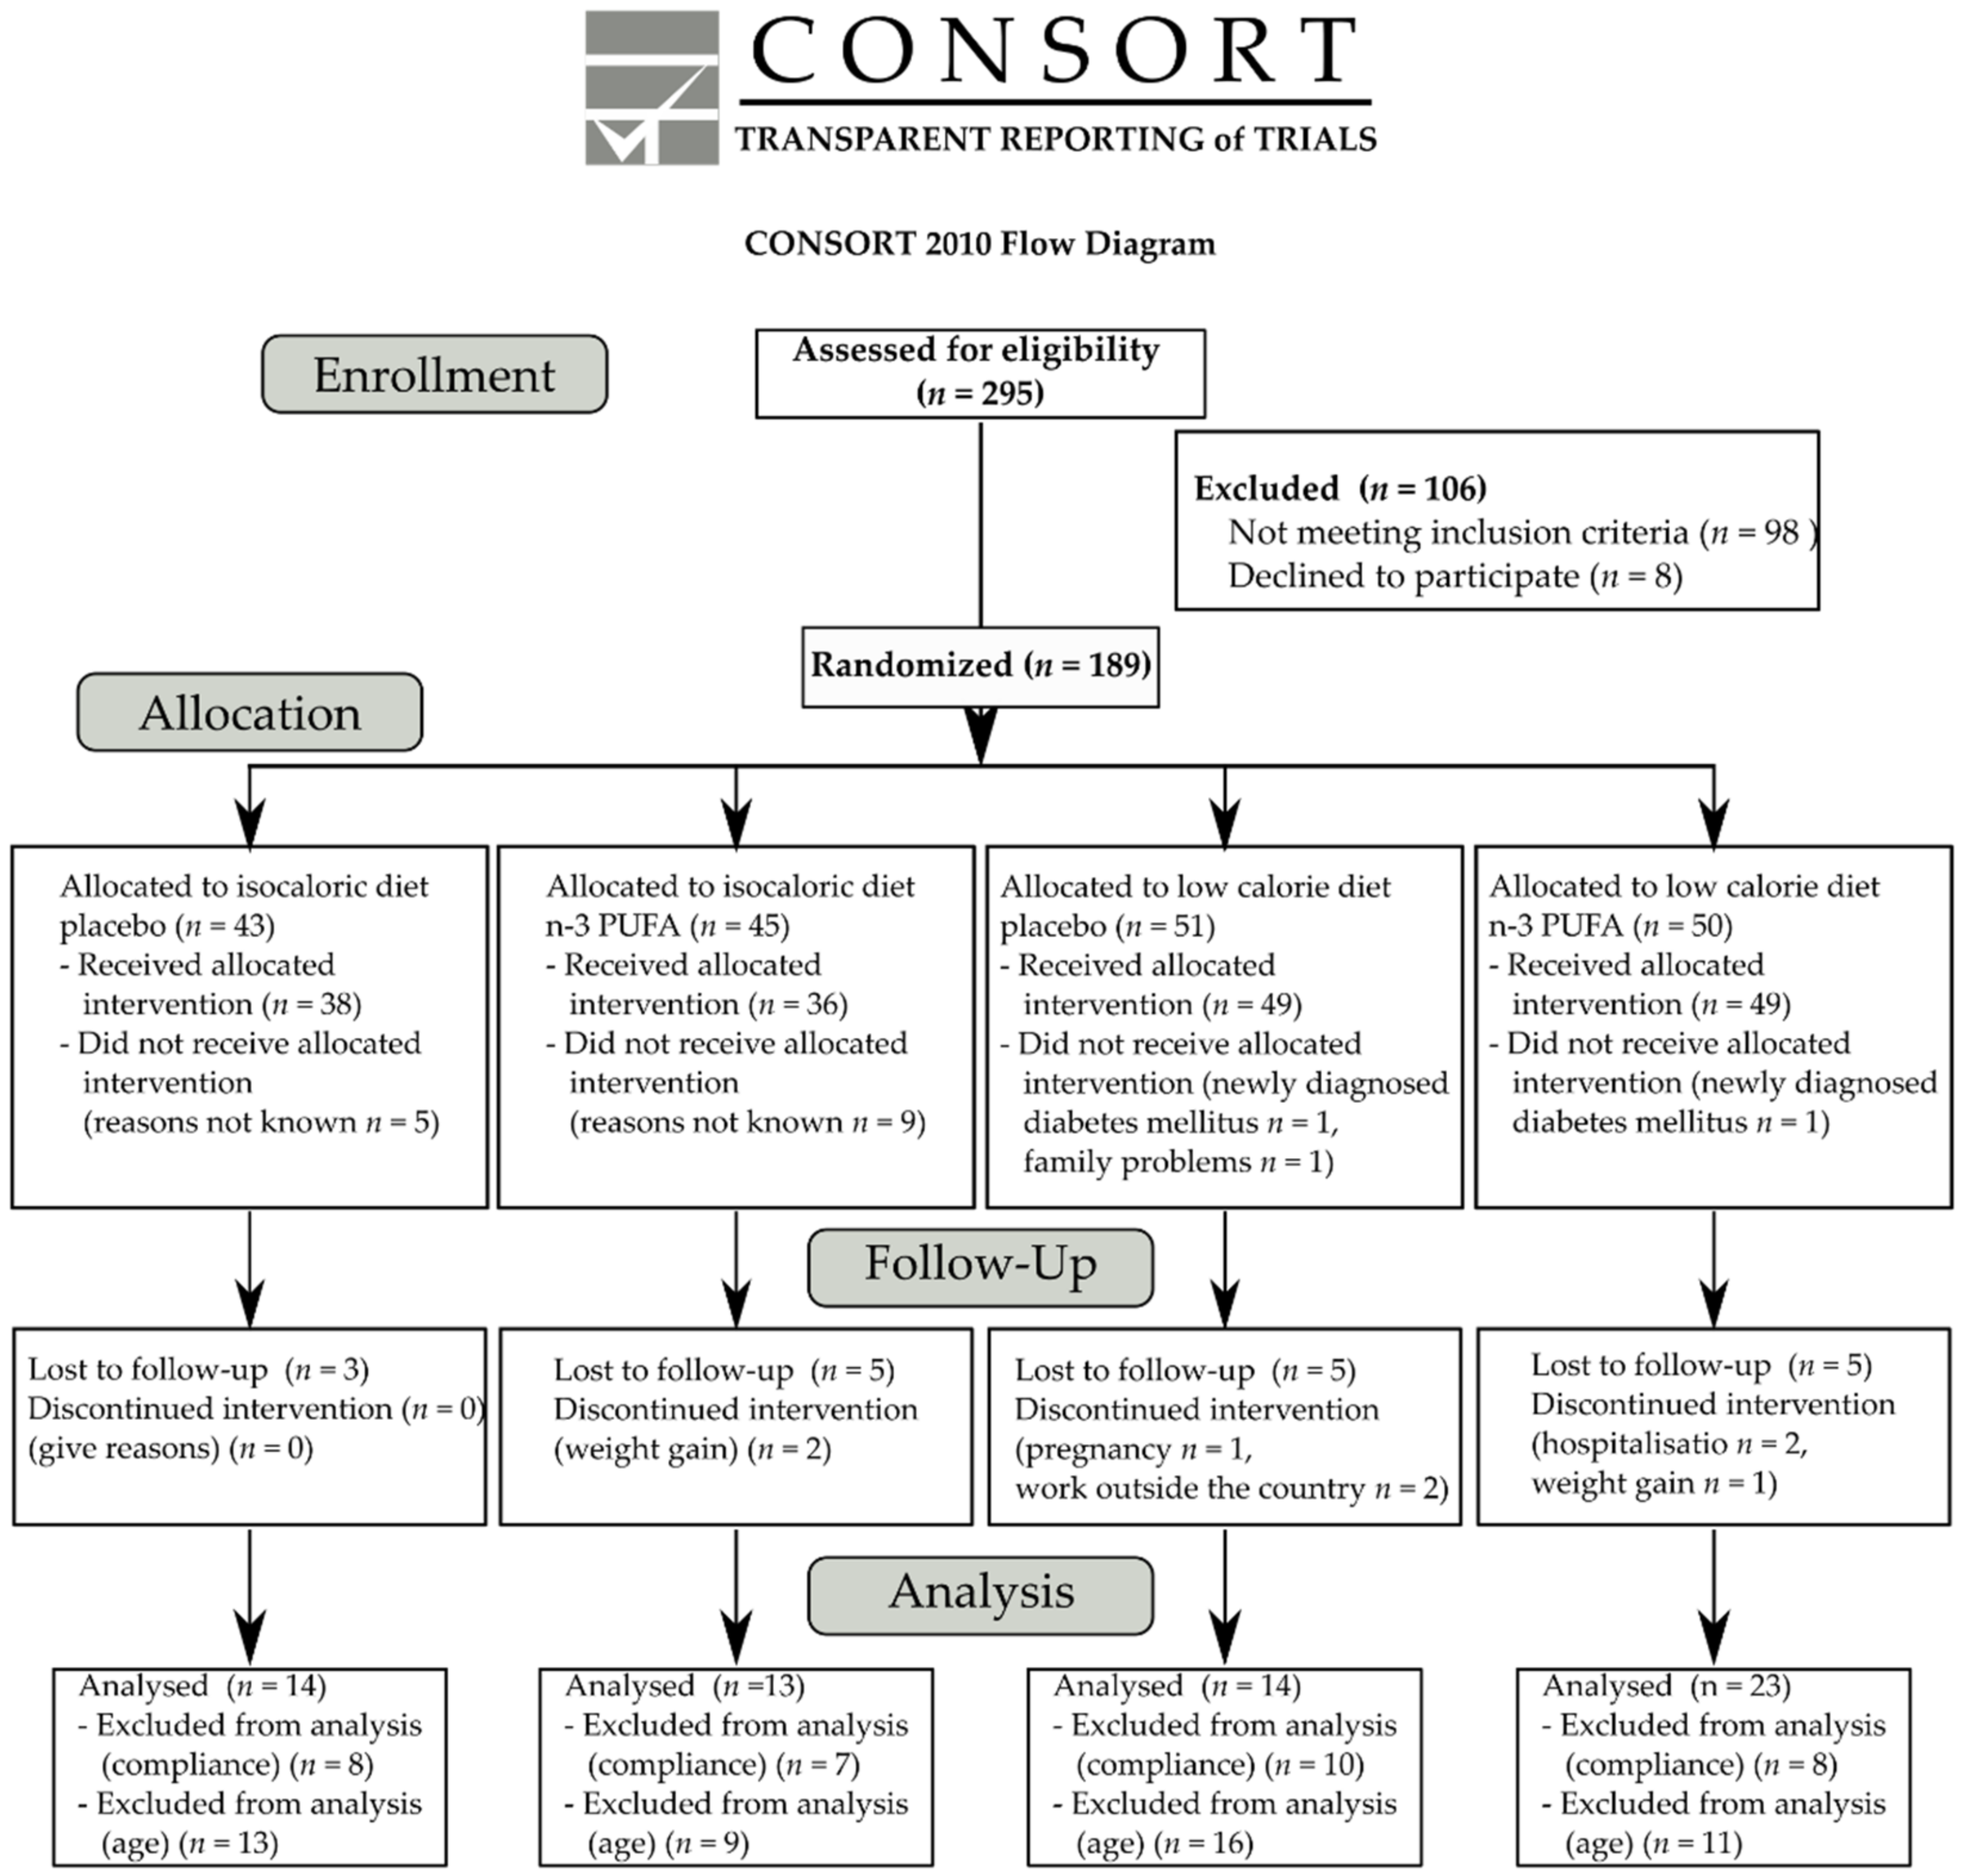
2.1. Participants
2.2. Study Design and Intervention
2.3. Assessment of Compliance
2.4. Outcome Measures
2.4.1. Anthropometric Measures
2.4.2. Secondary Blood Outcome Measures
2.5. Data Analysis
3. Results
4. Discussion
5. Conclusions
Author Contributions
Funding
Institutional Review Board Statement
Informed Consent Statement
Data Availability Statement
Conflicts of Interest
References
- Vecchié, A.; Dallegri, F.; Carbone, F.; Bonaventura, A.; Liberale, L.; Portincasa, P.; Frühbeck, G.; Montecucco, F. Obesity Phenotypes and Their Paradoxical Association with Cardiovascular Diseases. Eur. J. Intern. Med. 2018, 48, 6–17. [Google Scholar] [CrossRef] [PubMed]
- Zorena, K.; Jachimowicz-Duda, O.; Ślęzak, D.; Robakowska, M.; Mrugacz, M. Adipokines and Obesity. Potential Link to Metabolic Disorders and Chronic Complications. Int. J. Mol. Sci. 2020, 21, 3570. [Google Scholar] [CrossRef] [PubMed]
- Leitner, D.; Frühbeck, G.; Yumuk, V.; Schindler, K.; Micic, D.; Woodward, E.; Toplak, H. Obesity and Type 2 Diabetes: Two Diseases with a Need for Combined Treatment Strategies-EASO Can Lead the Way. Obes. Facts 2017, 10, 483–492. [Google Scholar] [CrossRef] [PubMed]
- Riedt, C.; Cifuentes, M.; Stahl, T.; Chowdhury, H.; Schlussel, Y.; Shapses, S. Overweight Postmenopausal Women Lose Bone with Moderate Weight Reduction and 1 G/Day Calcium Intake. J. Bone Miner. Res. 2005, 20, 455–463. [Google Scholar] [CrossRef]
- Compston, J.; Wyman, A.; FitzGerald, G.; Adachi, J.; Chapurlat, R.; Cooper, C.; Díez-Pérez, A.; Gehlbach, S.; Greenspan, S.; Hooven, F.; et al. Increase in Fracture Risk Following Unintentional Weight Loss in Postmenopausal Women: The Global Longitudinal Study of Osteoporosis in Women. J. Bone Miner. Res. 2016, 31, 1466–1472. [Google Scholar] [CrossRef] [Green Version]
- Rector, R.; Loethen, J.; Ruebel, M.; Thomas, T.; Hinton, P. Serum Markers of Bone Turnover Are Increased by Modest Weight Loss with or without Weight-Bearing Exercise in Overweight Premenopausal Women. Appl. Physiol. Nutr. Metab. 2009, 34, 933–941. [Google Scholar] [CrossRef]
- Hinton, P.; Rector, R.; Linden, M.; Warner, S.; Dellsperger, K.; Chockalingam, A.; Whaley-Connell, A.; Liu, Y.; Thomas, T. Weight-Loss-Associated Changes in Bone Mineral Density and Bone Turnover After Partial Weight Regain with or without Aerobic Exercise in Obese Women. Eur. J. Clin. Nutr. 2012, 66, 606–612. [Google Scholar] [CrossRef] [Green Version]
- Riedt, C.; Schlussel, Y.; Thun, N.; Ambia-Sobhan, H.; Stahl, T.; Field, M.; Sherrell, R.; Shapses, S. Premenopausal Overweight Women Do Not Lose Bone During Moderate Weight Loss with Adequate or Higher Calcium Intake. Am. J. Clin. Nutr. 2007, 85, 972–980. [Google Scholar] [CrossRef] [Green Version]
- Abdelhamid, A.; Brown, T.; Brainard, J.; Biswas, P.; Thorpe, G.; Moore, H.; Deane, K.; AlAbdulghafoor, F.; Summerbell, C.; Worthington, H.; et al. Omega-3 Fatty Acids for the Primary and Secondary Prevention of Cardiovascular Disease. Cochrane Database Syst. Rev. 2018, 7, CD003177. [Google Scholar]
- Nicholls, S.; Lincoff, A.; Garcia, M.; Bash, D.; Ballantyne, C.; Barter, P.; Davidson, M.; Kastelein, J.; Koenig, W.; McGuire, D.; et al. Effect of High-Dose Omega-3 Fatty Acids vs Corn Oil on Major Adverse Cardiovascular Events in Patients at High Cardiovascular Risk: The STRENGTH Randomized Clinical Trial. JAMA 2020, 324, 2268–2280. [Google Scholar] [CrossRef]
- Calder, P.C. n-3 Polyunsaturated Fatty Acids, Inflammation, and Inflammatory Diseases. Am. J. Clin. Nutr. 2006, 83, 1505S–1519S. [Google Scholar] [CrossRef]
- Rogero, M.; Calder, P.C. Obesity, Inflammation, Toll-Like Receptor 4 and Fatty Acids. Nutrients. 2018, 10, 432. [Google Scholar] [CrossRef] [Green Version]
- Albracht-Schulte, K.; Kalupahana, N.; Ramalingam, L.; Wang, S.; Rahman, S.; Robert-McComb, J.; Moustaid-Moussa, N. Omega-3 Fatty Acids in Obesity and Metabolic Syndrome: A Mechanistic Update. J. Nutr. Biochem. 2018, 58, 1–16. [Google Scholar] [CrossRef]
- Sun, D.; Krishnan, A.; Zaman, K.; Lawrence, R.; Bhattacharya, A.; Fernandes, G. Dietary N-3 Fatty Acids Decrease Osteoclastogenesis and Loss of Bone Mass in Ovariectomized Mice. J. Bone Miner. Res. 2003, 18, 1206–1216. [Google Scholar] [CrossRef]
- Trebble, T.M. Bone Turnover and Nutritional Status in Crohn’s Disease: Relationship to Circulating Mononuclear Cell Function and Response to Fish Oil and Antioxidants. Proc. Nutr. Soc. 2005, 64, 183–191. [Google Scholar] [CrossRef] [Green Version]
- Claassen, N.; Potgieter, H.; Seppa, M.; Vermaak, W.; Coetzer, H.; Van Papendorp, D.; Kruger, M.C. Supplemented Gamma-Linolenic Acid and Eicosapentaenoic Acid Influence Bone Status in Young Male Rats: Effects on Free Urinary Collagen Crosslinks, Total Urinary Hydroxyproline, and Bone Calcium Content. Bone 1995, 16, 385S–392S. [Google Scholar] [CrossRef]
- Iwami-Morimoto, Y.; Yamaguchi, K.; Tanne, K. Influence of Dietary N-3 Polyunsaturated Fatty Acid on Experimental Tooth Movement in Rats. Angle Orthod. 1999, 69, 365–371. [Google Scholar]
- Nakanishi, A.; Iitsuka, N.; Tsukamoto, I. Fish Oil Suppresses Bone Resorption by Inhibiting Osteoclastogenesis through Decreased Expression of M-CSF, PU.1, MITF and RANK in Ovariectomized Rats. Mol. Med. Rep. 2013, 7, 1896–1903. [Google Scholar] [CrossRef]
- Casado-Díaz, A.; Santiago-Mora, R.; Dorado, G.; Quesada-Gómez, J.M. The Omega-6 Arachidonic Fatty Acid, but Not the Omega-3 Fatty Acids, Inhibits Osteoblastogenesis and Induces Adipogenesis of Human Mesenchymal Stem Cells: Potential Implication in Osteoporosis. Osteoporos. Int. 2013, 24, 1647–1661. [Google Scholar] [CrossRef]
- Chen, Y.; Ho, S.; Lam, S. Higher Sea Fish Intake Is Associated with Greater Bone Mass and Lower Osteoporosis Risk in Postmenopausal Chinese Women. Osteoporos. Int. 2010, 21, 939–946. [Google Scholar] [CrossRef]
- Zhu, M.; Van Dyke, T.; Gyurko, R. Resolvin E1 Regulates Osteoclast Fusion via DC-STAMP and NFATc1. FASEB J. 2013, 27, 3344–3353. [Google Scholar] [CrossRef] [Green Version]
- Funaki, Y.; Hasegawa, Y.; Okazaki, R.; Yamasaki, A.; Sueda, Y.; Yamamoto, A.; Yanai, M.; Fukushima, T.; Harada, T.; Makino, H.; et al. Resolvin E1 Inhibits Osteoclastogenesis and Bone Resorption by Suppressing IL-17-induced RANKL Expression in Osteoblasts and RANKL-Induced Osteoclast Differentiation. Yonago Acta Med. 2018, 61, 8–18. [Google Scholar] [CrossRef] [Green Version]
- Zalloua, P.; Hsu, Y.; Terwedow, H.; Zang, T.; Wu, D.; Tang, G.; Li, Z.; Hong, X.; Azar, S.; Wang, B.; et al. Impact of Seafood and Fruit Consumption on Bone Mineral Density. Maturitas 2007, 56, 1–11. [Google Scholar] [CrossRef]
- Lucey, A.; Paschos, G.; Cashman, K.; Martínéz, J.; Thorsdottir, I.; Kiely, M. Influence of Moderate Energy Restriction and Seafood Consumption on Bone Turnover in Overweight Young Adults. Am. J. Clin. Nutr. 2008, 87, 1045–1052. [Google Scholar] [CrossRef] [Green Version]
- Matthews, D.R.; Hosker, J.P.; Rudenski, A.S.; Naylor, B.A.; Treacher, D.F.; Turner, R.C. Homeostasis Model Assessment: Insulin Resistance and Beta-Cell Function from Fasting Plasma Glucose and Insulin Concentrations in Man. Diabetologia 1985, 28, 412–419. [Google Scholar] [CrossRef] [Green Version]
- Bandarra, N.M.; Palma, P.; Batista, I.; Kiely, M.; Thorsdottir, I. Effect of a Supplemented Diet with Canned Sardine on the Lipid Fraction of Human Plasma and Erythrocytes. J. Aquat. Food Prod. Technol. 2002, 11, 177–185. [Google Scholar] [CrossRef]
- Weinheimer, E.; Sands, L.; Campbell, W. A Systematic Review of the Separate and Combined Effects of Energy Restriction and Exercise on Fat-Free Mass in Middle-Aged and Older Adults: Implications for Sarcopenic Obesity. Nutr. Rev. 2010, 68, 375–388. [Google Scholar] [CrossRef]
- Redman, L.; Rood, J.; Anton, S.; Champagne, C.; Smith, S.; Ravussin, E. Calorie Restriction and Bone Health in Young, Overweight Individuals. Arch. Intern. Med. 2008, 168, 1859–1866. [Google Scholar] [CrossRef]
- Hamilton, K.; Fisher, G.; Roy, J.; Gower, B.; Hunter, G. The Effects of Weight Loss on Relative Bone Mineral Density in Premenopausal Women. Obesity 2013, 21, 441–448. [Google Scholar] [CrossRef] [Green Version]
- Zibellini, J.; Seimon, R.; Lee, C.; Gibson, A.; Hsu, M.; Shapses, S.; Nguyen, T.; Sainsbury, A. Does Diet-Induced Weight Loss Lead to Bone Loss in Overweight or Obese Adults? A Systematic Review and Meta-Analysis of Clinical Trials. J. Bone Miner. Res. 2015, 30, 2168–2178. [Google Scholar] [CrossRef]
- Centi, A.; Booth, S.; Gundberg, C.; Saltzman, E.; Nicklas, B.; Shea, M. Osteocalcin Carboxylation Is Not Associated with Body Weight or Percent Fat Changes During Weight Loss in Post-Menopausal Women. Endocrine 2015, 50, 627–632. [Google Scholar] [CrossRef] [PubMed]
- Wei, W.; Dutchak, P.; Wang, X.; Ding, X.; Wang, X.; Bookout, A.L.; Wan, Y. Fibroblast Growth Factor 21 Promotes Bone Loss by Potentiating the Effects of Peroxisome Proliferator-Activated Receptor γ. Proc. Natl. Acad. Sci. USA 2012, 109, 3143–3148. [Google Scholar] [CrossRef] [PubMed] [Green Version]
- Headland, M.; Clifton, P.; Keogh, J. Effects of Weight Loss on FGF-21 in Human Subjects: An Exploratory Study. Int. J. Environ. Res. Public Health 2019, 16, 4877. [Google Scholar] [CrossRef] [PubMed] [Green Version]
- Naldini, A.; Leali, D.; Pucci, A.; Morena, E.; Carraro, F.; Nico, B.; Ribatti, D.; Presta, M. Cutting Edge: IL-1_ Mediates the Proangiogenic Activity of Osteopontin-Activated Human Monocytes. J. Immunol. 2006, 177, 4267–4270. [Google Scholar] [CrossRef] [PubMed] [Green Version]
- Gómez-Ambrosi, J.; Catalán, V.; Ramírez, B.; Rodríguez, A.; Colina, I.; Silva, C.; Rotellar, F.; Mugueta, C.; Gil, M.; Cienfuegos, J.; et al. Plasma Osteopontin Levels and Expression in Adipose Tissue Are Increased in Obesity. J. Clin. Endocrinol. Metab. 2007, 92, 3719–3727. [Google Scholar] [CrossRef] [PubMed] [Green Version]
- Shapses, S.; Sukumar, D. Bone Metabolism in Obesity and Weight Loss. Annu. Rev. Nutr. 2012, 32, 287–309. [Google Scholar] [CrossRef] [PubMed] [Green Version]
- Yu, E.W.; Thomas, B.J.; Brown, J.K.; Finkelstein, J.S. Simulated Increases in Body Fat and Errors in Bone Mineral Density Measurements by DXA and QCT. J. Bone Miner. Res. 2012, 27, 119–124. [Google Scholar] [CrossRef] [PubMed] [Green Version]
- Weiss, E.; Albert, S.; Reeds, D.; Kress, K.; Ezekiel, U.; McDaniel, J.; Patterson, B.; Klein, S.; Villareal, D. Calorie Restriction and Matched Weight Loss From Exercise: Independent and Additive Effects on Glucoregulation and the Incretin System in Overweight Women and Men Randomized Controlled Trial. Diabetes Care 2015, 38, 1253–1262. [Google Scholar] [CrossRef] [Green Version]
- Strasser, B.; Berger, K.; Fuchs, D. Effects of a Caloric Restriction Weight Loss Diet on Tryptophan Metabolism and Inflammatory Biomarkers in Overweight Adults. Eur. J. Nutr. 2015, 54, 101–107. [Google Scholar] [CrossRef]
- Sola, E.; Jover, A.; Lopez-Ruiz, A.; Jarabo, M.; Vaya, A.; Morillas, C.; Gómez-Balaguer, M.; Hernández-Mijares, A. Parameters of Inflammation in Morbid Obesity: Lack of Effect of Moderate Weight Loss. Obes. Surg. 2009, 19, 571–576. [Google Scholar] [CrossRef]
- Magkos, F.; Fraterrigo, G.; Yoshino, J.; Luecking, C.; Kirbach, K.; Kelly, S.; de Las Fuentes, L.; He, S.; Okunade, A.; Patterson, B.; et al. Effects of Moderate and Subsequent Progressive Weight Loss on Metabolic Function and Adipose Tissue Biology in Humans with Obesity. Cell Metab. 2016, 23, 591–601. [Google Scholar] [CrossRef] [Green Version]
- De Mello, V.; Kolehmainen, M.; Schwab, U.; Mager, U.; Laaksonen, D.; Pulkkinen, L.; Niskanen, L.; Gylling, H.; Atalay, M.; Rauramaa, R.; et al. Effect of Weight Loss on Cytokine Messenger RNA Expression in Peripheral Blood Mononuclear Cells of Obese Subjects with the Metabolic Syndrome. Metabolism 2008, 57, 192–199. [Google Scholar] [CrossRef]
- Vink, R.; Roumans, N.; Fazelzadeh, P.; Tareen, S.; Boekschoten, M.; van Baak, M.; Mariman, E. Adipose Tissue Gene Expression Is Differentially Regulated with Different Rates of Weight Loss in Overweight and Obese Humans. Int. J. Obes. 2017, 41, 309–316. [Google Scholar] [CrossRef]
- Wing, R.; Lang, W.; Wadden, T.; Safford, M.; Knowler, W.; Bertoni, A.; Hill, J.; Brancati, F.; Peters, A.; Wagenknecht, L. Benefits of Modest Weight Loss in Improving Cardiovascular Risk Factors in Overweight and Obese Individuals with Type 2 Diabetes. Diabetes Care 2011, 34, 1481–1486. [Google Scholar] [CrossRef] [Green Version]
- Madsen, E.; Rissanen, A.; Bruun, J.; Skogstrand, K.; Tonstad, S.; Hougaard, D.; Richelsen, B. Weight Loss Larger Than 10% Is Needed for General Improvement of Levels of Circulating Adiponectin and Markers of Inflammation in Obese Subjects: A 3-Year Weight Loss Study. Eur. J. Endocrinol. 2008, 158, 179–187. [Google Scholar] [CrossRef] [Green Version]
- Greco, M.; Chiefari, E.; Montalcini, T.; Accattato, F.; Costanzo, F.; Pujia, A.; Foti, D.; Brunetti, A.; Gulletta, E. Early Effects of a Hypocaloric, Mediterranean Diet on Laboratory Parameters in Obese Individuals. Mediators Inflamm. 2014, 2014, 750860. [Google Scholar] [CrossRef] [Green Version]
- Ricci, T.A.; Chowdhury, H.A.; Heymsfield, S.B.; Stahl, T.; Pierson, R.N.; Shapses, S.A. Calcium Supplementation Suppresses Bone Turnover During Weight Reduction in Postmenopausal Women. J. Bone Miner. Res. 1998, 13, 1045–1050. [Google Scholar] [CrossRef]
- Armamento-Villareal, R.; Sadler, C.; Napoli, N.; Shah, K.; Chode, S.; Sinacore, D.; Qualls, C.; Villareal, D. Weight Loss in Obese Older Adults Increases Serum Sclerostin and Impairs Hip Geometry but Both Are Prevented by Exercise Training. J. Bone Miner. Res. 2012, 27, 1215–1221. [Google Scholar] [CrossRef]
- Sun, L.; Tamaki, H.; Ishimaru, T.; Teruya, T.; Ohta, Y.; Katsuynama, N.; Chinen, I. Inhibition of Osteoporosis Due to Restricted Food Intake by the Fish Oils DHA and EPA and Perilla Oil in the Rat. Biosci. Biotechnol. Biochem. 2004, 68, 2613–2615. [Google Scholar] [CrossRef] [Green Version]
- Gilman, J.; Cashman, K.D. The Effect of Marine Oil-Derived n-3 Fatty Acids on Transepithelial Calcium Transport in Caco-2 Cell Models of Healthy and Inflamed Intestines. Br. J. Nutr. 2007, 97, 281–288. [Google Scholar] [CrossRef] [Green Version]
- Pooneh, S.; Rezaie, A.; Larijani, B.; Abdollahi, M. A Systematic Review of the Impact of N-3 Fatty Acids in Bone Health and Osteoporosis. Med. Sci. Monit. 2008, 14, RA37–RA44. [Google Scholar]
- Dong, H.; Hutchins-Wiese, H.; Kleppinger, A.; Annis, K.; Liva, E.; Lammi-Keefe, C.; Durham, H.; Feinn, R.; Kenny, A.M. Effects of Omega-3 Polyunsaturated Fatty Acid Supplementation on Bone Turnover in Older Women. Int. J. Vitam. Nutr. Res. 2014, 84, 124–132. [Google Scholar] [CrossRef]
- Rajaram, S.; Yip, E.L.; Reghunathan, R.; Mohan, S.; Sabaté, J. Effect of Altering Dietary n-6:n-3 Polyunsaturated Fatty Acid Ratio with Plant and Marine-Based Supplement on Biomarkers of Bone Turnover in Healthy Adults. Nutrients 2017, 9, 1162. [Google Scholar] [CrossRef] [Green Version]
- Hutchins-Wiese, H.; Picho, K.; Watkins, B.; Li, Y.; Tannenbaum, S.; Claffey, K.; Kenny, A. High-Dose Eicosapentaenoic Acid and Docosahexaenoic Acid Supplementation Reduces Bone Resorption in Postmenopausal Breast Cancer Survivors on Aromatase Inhibitors: A Pilot Study. Nutr. Cancer. 2014, 66, 68–76. [Google Scholar] [CrossRef]
- Salamone, L.M.; Cauley, J.A.; Black, D.M.; Simkin-Silverman, L.; Lang, W.; Gregg, E.; Palermo, L.; Epstein, R.; Kuller, L.; Wing, R. Effect of a Lifestyle Intervention on Bone Mineral Density in Premenopausal Women: A Randomized Trial. Am. J. Clin. Nutr. 1999, 70, 97–103. [Google Scholar] [CrossRef]
- Shapses, S.A.; Riedt, C.S. Bone, Body Weight, and Weight Reduction: What Are the Concerns? J. Nutr. 2006, 136, 1453–1456. [Google Scholar] [CrossRef] [Green Version]
- Ricci, T.A.; Heymsfield, S.B.; Pierson, R.N.; Stahl, T.; Chowdhury, H.A.; Shapses, S.A. Moderate Energy Restriction Increases Bone Resorption in Obese Postmenopausal Women. Am. J. Clin. Nutr. 2001, 73, 347–352. [Google Scholar] [CrossRef] [Green Version]
- Christakos, S.; Veldurthy, V.; Patel, N.; Wei, R. Intestinal Regulation of Calcium: Vitamin D and Bone Physiology. Adv. Exp. Med. Biol. 2017, 1033, 3–12. [Google Scholar]
- Kershaw, E.; Flier, J. Adipose Tissue as an Endocrine Organ. J. Clin. End Met. 2004, 89, 2548–2556. [Google Scholar] [CrossRef]
- Matsubara, M.; Maruoka, S.; Katayose, S. Inverse Relationship between Plasma Adiponectin and Leptin Concentrations in Normal-Weight and Obese Women. Eur. J. Endocrinol. 2002, 147, 173–180. [Google Scholar] [CrossRef] [Green Version]
- Russell, M.; Mendes, N.; Miller, K.; Rosen, C.; Lee, H.; Klibanski, A.; Misra, M. Visceral Fat Is a Negative Predictor of Bone Density Measures in Obese Adolescent Girls. J. Clin. Endocrinol. Metab. 2010, 95, 1247–1255. [Google Scholar] [CrossRef] [PubMed]
- Cawthorn, W.; Scheller, E.; Learman, B.; Parlee, S.; Simon, B.; Mori, H.; Ning, X.; Bree, A.; Schell, B.; Broome, D.; et al. Bone Marrow Adipose Tissue Is an Endocrine Organ That Contributes to Increased Circulating Adiponectin During Caloric Re-Striction. Cell Metab. 2014, 20, 368–375. [Google Scholar] [CrossRef] [PubMed] [Green Version]
- Devlin, M.; Cloutier, A.; Thomas, N.; Panus, D.; Lotinun, S.; Pinz, I.; Baron, R.; Rosen, C.; Bouxsein, M. Caloric Restriction Leads to High Marrow Adiposity and Low Bone Mass in Growing Mice. J. Bone Miner. Res. 2010, 25, 2078–2088. [Google Scholar] [CrossRef] [PubMed]
- Ecklund, K.; Vajapeyam, S.; Feldman, H.; Buzney, C.; Mulkern, R.; Kleinman, P.; Rosen, C.; Gordon, C. Bone Marrow Changes in Adolescent Girls with Anorexia Nervosa. J. Bone Miner. Res. 2010, 25, 298–304. [Google Scholar] [CrossRef] [Green Version]
- Cohen, A.; Dempster, D.; Stein, E.; Nickolas, T.; Zhou, H.; McMahon, D.; Müller, R.; Kohler, T.; Zwahlen, A.; Lappe, J.; et al. Increased Marrow Adiposity in Premenopausal Women with Idiopathic Osteoporosis. J. Clin. Endocrinol. Metab. 2012, 97, 2782–2791. [Google Scholar] [CrossRef]
- Sayers, A.; Timpson, N.J.; Sattar, N.; Deanfield, J.; Hingorani, A.D.; Davey-Smith, G.; Tobias, J.H. Adiponectin and Its Association with Bone Mass Accrual in Childhood. J. Bone Miner. Res. 2010, 25, 2212–2220. [Google Scholar] [CrossRef]
- Zhu, J.; Liu, C.; Jia, J.; Zhang, C.; Yuan, W.; Leng, H.; Xu, Y.; Song, C. Short-Term Caloric Restriction Induced Bone Loss in Both Axial and Appendicular Bones by Increasing Adiponectin. Ann. N. Y. Acad. Sci. 2020, 1474, 47–60. [Google Scholar] [CrossRef]
- Naot, D.; Watson, M.; Callon, K.; Tuari, D.; Musson, D.; Choi, A.; Sreenivasan, D.; Fernandez, J.; Tu, P.T.; Dickinson, M.; et al. Reduced Bone Density and Cortical Bone Indices in Female Adiponectin-Knockout Mice. Endocrinology 2016, 157, 3550–3561. [Google Scholar] [CrossRef]
- Tohidi, M.; Akbarzadeh, S.; Larijani, B.; Kalantarhormozi, M.; Ostovar, A.; Assadi, M.; Vahdat, K.; Farrokhnia, M.; Sanjdideh, Z.; Amirinejad, R.; et al. Omentin-1, Visfatin and Adiponectin Levels in Relation to Bone Mineral Density in Iranian Postmenopausal Women. Bone 2012, 51, 876–881. [Google Scholar] [CrossRef] [Green Version]
- Kajimura, D.; Lee, H.; Riley, K.; Arteaga-Solis, E.; Ferron, M.; Zhou, B.; Clarke, C.H.; Hannun, Y.; DePinho, R.; Guo, E.; et al. Adiponectin Regulates Bone Mass Accrual through Two Opposite Mechanisms, One Local and One Central, That Both Rely on FoxO1. Cell Metab. 2013, 17, 901–915. [Google Scholar] [CrossRef] [Green Version]


| Parameter | All Subjects (n = 64) | IS + Placebo (n = 14) | IS + n-3 PUFA (n = 13) | CR + Placebo (n = 14) | CR + n-3 PUFA (n = 23) | p-Value * |
|---|---|---|---|---|---|---|
| Age (years) | 41.0 ± 9.9 | 43 ± 11 1 | 39 ± 5 | 37 ± 10 | 44 ± 10 | 0.203 |
| Sex, female (%) | 55 (n = 35) | 50 (n = 7) | 54 (n = 7) | 72 (n = 10) | 48 (n = 11) | >0.05 |
| EPA in plasma PC (weight%) | 2.43 ± 2.00 | 1.49 (1.12, 2.76) 2 | 2.42 (1.49, 4.25) | 1.49 (1.11, 2.13) | 1.47 (1.19, 2.67) | 0.241 |
| DHA in plasma PC (weight%) | 3.78 ± 1.32 | 3.52 (3.03, 4.88) | 4.45 (3.08, 4.74) | 3.69 (2.87, 5.07) | 3.36 (2.68, 4.12) | 0.445 |
| EPA in RBC membranes (weight%) | 1.16 ± 0.65 | 1.01 (0.74, 1.54) | 0.96 (0.89, 1.51) | 1.050 (0.77, 1.27) | 1.00 (0.83, 1.23) | 0.861 |
| DHA in RBC membranes (weight%) | 4.29 ± 1.20 | 4.15 ± 1.30 | 4.34 ± 1.21 | 4.50 ± 1.44 | 4.22 ± 1.03 | 0.884 |
| Omega-3 index (weight%) | 5.45 ± 1.67 | 5.15 (4.58, 6.01) | 5.73 (4.84, 6.21) | 5.50 (3.97, 6.78) | 5.16 (4.90, 5.69) | 0.865 |
| Weight (kg) | 96.05 ± 14.29 | 92.20 ± 12.69 | 90.65 ± 16.73 | 100.51 ± 9.69 | 98.73 ± 15.33 | 0.168 |
| BMI (kg/m2) | 32.98 ± 4.01 | 31.56 ± 3.75 | 30.84 ± 3.48 | 35.26 ± 3.14 * | 33.67 ± 4.18 | 0.008 |
| Waist circumference Females (cm) | 95.1 ± 13.6 | 96.0 (90.0, 101.5) | 94.0 (88.0, 99.0) | 102.0 (99.0, 106.5) | 95.0 (88.0, 98.0) | 0.161 |
| Waist circumference Males (cm) | 111.7 ± 9.4 | 105.4 ± 13.9 | 112.0 ± 9.0 | 115.0 ± 4.8 | 114.5 ± 5.7 | 0.206 |
| WHR | 0.90 ± 0.12 | 0.89 (0.82, 0.96) | 0.95 (0.85, 0.98) | 0.86 (0.82, 0.96) | 0.90 (0.82, 0.99) | 0.909 |
| WHR females | 0.82 ± 0.10 | 0.82 (0.80, 0.83) | 0.83 (0.82, 0.91) | 0.84 (0.80, 0.85) | 0.82 (0.80, 0.83) | 0.345 |
| WHR males | 0.99 ± 0.05 | 0.99 ± 0.06 | 0.98 ± 0.02 | 1.01 ± 0.06 | 1.00 ± 0.04 | 0.852 |
| Adipose tissue (%) | 35.16 ± 6.58 | 33.71 ± 7.15 | 31.90 ± 4.99 | 38.75 ± 6.88 | 35.85 ± 6.14 | 0.073 |
| Total cholesterol (mmol/L) | 5.29 ± 0.94 | 5.47 ± 1.20 | 5.36 ± 0.83 | 4.85 ± 0.98 | 5.40 ± 0.75 | 0.267 |
| HDL-cholesterol (mmol/L) | 1.25 ± 0.22 | 1.31 ± 0.23 | 1.20 ± 0.18 | 1.21 ± 0.22 | 1.25 ± 0.24 | 0.552 |
| LDL-cholesterol (mmol/L) | 3.36 ± 0.83 | 3.55 ± 0.90 | 3.58 ± 0.86 | 2.99 ± 0.78 | 3.35 ± 0.77 | 0.233 |
| NEFAs (mmol/L) | 0.74 ± 0.27 | 0.81 ± 0.32 | 0.65 ± 0.22 | 0.74 ± 0.28 | 0.75 ± 0.27 | 0.535 |
| TGs (mmol/L) | 1.54 ± 0.82 | 1.11 (0.87, 1.24) | 1.17 (0.88, 1.70) | 1.34 (1.04, 1.77) | 1.71 (1.11, 2.57) | 0.152 |
| Glucose (mmol/L) | 5.24 ± 0.54 | 4.85 (4.80, 5.63) | 4.95 (4.80, 5.35) | 5.08 (4.91, 5.31) | 5.35 (5.05, 5.80) | 0.109 |
| Insulin (µIU/mL) | 15.84 ± 8.32 | 14.67 ± 6.41 | 12.55 ± 5.16 | 19.84 ± 11.29 | 15.78 ± 8.01 | 0.145 |
| HOMA-IR | 3.74 ± 2.10 | 3.50 ± 1.86 | 2.84 ± 1.29 | 4.52 ± 2.63 | 3.88 ± 2.14 | 0.182 |
| GIP (pg/mL) | 32.54 ± 23.28 | 33.16 ± 13.58 | 22.95 ± 13.41 | 38.59 ± 33.40 | 33.52 ± 24.05 | 0.157 |
| Leptin (ng/mL) | 30.89 ± 22.30 | 26.86 ± 16.90 | 23.62 ± 13.61 | 42.12 ± 21.68 | 30.61 ± 27.48 | 0.125 |
| Leptin females (ng/mL) | 42.71 ± 23.33 | 36.73 ± 15.01 | 31.79 ± 13.20 | 16.70 ± 6.61 | 45.79 ± 33.57 | 0.242 |
| Leptin males (ng/mL) | 16.62 ± 8.53 | 17.00 ± 12.88 | 14.09 ± 5.75 | 19.56 ± 10.38 | 16.70 ± 6.61 | 0.815 |
| Adiponectin (µg/mL) | 5.81 ± 3.04 | 6.37 ± 4.21 | 6.59 ± 2.35 | 4.96 ± 2.48 | 5.56 ± 2.87 | 0.468 |
| IL-6 (pg/mL) | 1.47 ± 1.07 | 1.38 (1.01, 1.73) | 0.81 (0.71, 0.99) | 1.40 (1.10, 2.27) | 1.08 (0.87, 1.68) | 0.107 |
| CRP (mg/L) | 2.43 ± 2.14 | 0.90 (0.61, 3.65) | 1.30 (0.63, 2.28) | 3.28 (0.74, 5.04) | 2.20 (0.66, 4.24) | 0.331 |
| Resistin (ng/mL) | 9.49 ± 3.14 | 9.42 ± 3.81 | 9.01 ± 2.15 | 9.26 ± 3.08 | 9.96 ± 3.34 | 0.835 |
| Visfatin (ng/mL) | 1.16 ± 0.94 | 1.14 ± 0.35 | 0.95 ± 0.61 | 1.12 ± 0.67 | 1.33 ± 0.98 | 0.411 |
| sE-selectin (pg/mL) | 39.09 ± 15.30 | 45.13 ± 10.64 | 31.81 ± 12.69 | 37.66 ± 12.70 | 40.35 ± 18.92 | 0.170 |
| MCP-1 (pg/mL) | 352.99 ± 94.63 | 411.04 ± 95.39 | 301.49 ± 59.90 | 336.98 ± 65.71 | 356.78 ± 109.10 | 0.098 |
| sVCAM-1 (ng/mL) | 591.50 ± 140.37 | 558.32 ± 132.29 | 586.84 ± 123.74 | 581.90 ± 167.67 | 618.54 ± 139.05 | 0.657 |
| sPECAM-1 (ng/mL) | 69.17 ± 15.47 | 73.73 ± 15.59 | 69.93 ± 13.64 | 71.01 ± 18.41 | 65.08 ± 14.33 | 0.405 |
| FGF-21 (pg/mL) | 251.49 ± 162.01 | 241.04 ± 134.40 | 271.97 ± 218.01 | 257.66 ± 145.80 | 242.53 ± 159.93 | 0.886 |
| Vitamin D (ng/mL) | 14.77 ± 6.40 | 14.57 ± 5.70 | 17.15 ± 6.28 | 12.41 ± 5.71 | 14.99 ± 7.10 | 0.297 |
| Osteopontin (ng/mL) | 49.65 ± 11.06 | 49.86 ± 9.60 | 47.00 ± 11.60 | 51.50 ± 12.62 | 49.94 ± 11.04 | 0.772 |
| PINP (ng/mL) | 7.84 ± 2.10 | 7.06 (6.35, 8.39) | 7.64 (6.73, 7.95) | 8.05 (7.33, 8.42) | 7.41 (6.20, 8.82) | 0.334 |
| CTX-I (ng/mL) | 0.32 ± 0.13 | 0.29 (0.20, 0.43) | 0.30 (0.22, 0.34) | 0.29 (0.24, 0.32) | 0.28 (0.23, 0.33) | 0.647 |
| Gla-OC (ng/mL) | 10.52 ± 3.54 | 10.26 ± 2.66 | 9.81 ± 1.63 | 11.26 ± 3.90 | 10.55 ± 4.18 | 0.815 |
| Glu-OC (ng/mL) | 3.58 ± 2.61 | 3.38 ± 2.00 | 2.74 ± 1.61 | 3.46 ± 1.77 | 4.25 ± 3.60 | 0.420 |
| % Glu-OC | 24.40 ± 12.12 | 23.15 ± 10.26 | 21.17 ± 9.36 | 23.37 ± 9.30 | 27.27 ± 15.39 | 0.740 |
| Total-OC (ng/mL) | 14.09 ± 4.22 | 13.48 ± 3.47 | 12.52 ± 2.09 | 14.72 ± 4.79 | 14.80 ± 4.93 | 0.267 |
| Group | Time | EPA in Plasma PC (weight%) | DHA in Plasma PC (weight%) | EPA in RBC Membranes (weight%) | DHA in RBC Membranes (weight%) | Omega-3 Index (weight%) | BMI (kg/m2) | Adipose Tissue (%) |
|---|---|---|---|---|---|---|---|---|
| IS + placebo (n = 14) | Baseline | 2.77 ± 3.14 | 3.91 ± 1.57 | 1.47 ± 1.16 | 4.15 ± 1.30 | 5.60 ± 2.30 | 31.56 ± 3.75 | 33.71 ± 7.15 |
| After 3 months | 1.83 ± 1.04 | 3.59 ± 1.39 | 1.04 ± 0.58 | 4.21 ± 0.95 | 5.26 ± 1.41 | 30.87 ± 3.19 | 30.70 ± 7.31 | |
| IS + n-3 PUFA (n = 13) | Baseline | 2.95 ± 1.73 | 4.08 ± 1.15 | 1.15 ± 0.43 | 4.34 ± 1.21 | 5.49 ± 1.51 | 30.84 ± 3.48 | 31.90 ± 4.99 |
| After 3 months | 3.69 ± 1.51 | 6.37 ± 2.07 | 2.00 ± 0.55 | 7.12 ± 1.08 | 9.13 ± 1.55 | 31.03 ± 3.43 | 30.93 ± 6.93 | |
| CR + placebo (n = 14) | Baseline | 2.03 ± 1.51 | 3.95 ± 1.69 | 1.06 ± 0.44 | 4.50 ± 1.44 | 5.56 ± 1.80 | 35.26 ± 3.14 | 38.75 ± 6.88 |
| After 3 months | 1.57 ± 0.63 | 4.12 ± 1.66 | 0.92 ± 0.40 | 4.43 ± 1.40 | 5.35 ± 1.76 | 32.54 ± 4.22 | 37.12 ± 7.96 | |
| CR + n-3 PUFA (n = 23) | Baseline | 2.15 ± 1.46 | 3.44 ± 1.01 | 1.06 ± 0.38 | 4.22 ± 1.03 | 5.28 ± 1.29 | 33.67 ± 4.18 | 35.85 ± 6.14 |
| After 3 months | 3.55 ± 2.34 | 6.62 ± 2.11 | 1.97 ± 0.90 | 7.64 ± 1.11 | 9.61 ± 1.75 | 31.43 ± 3.94 | 32.25 ± 7.44 | |
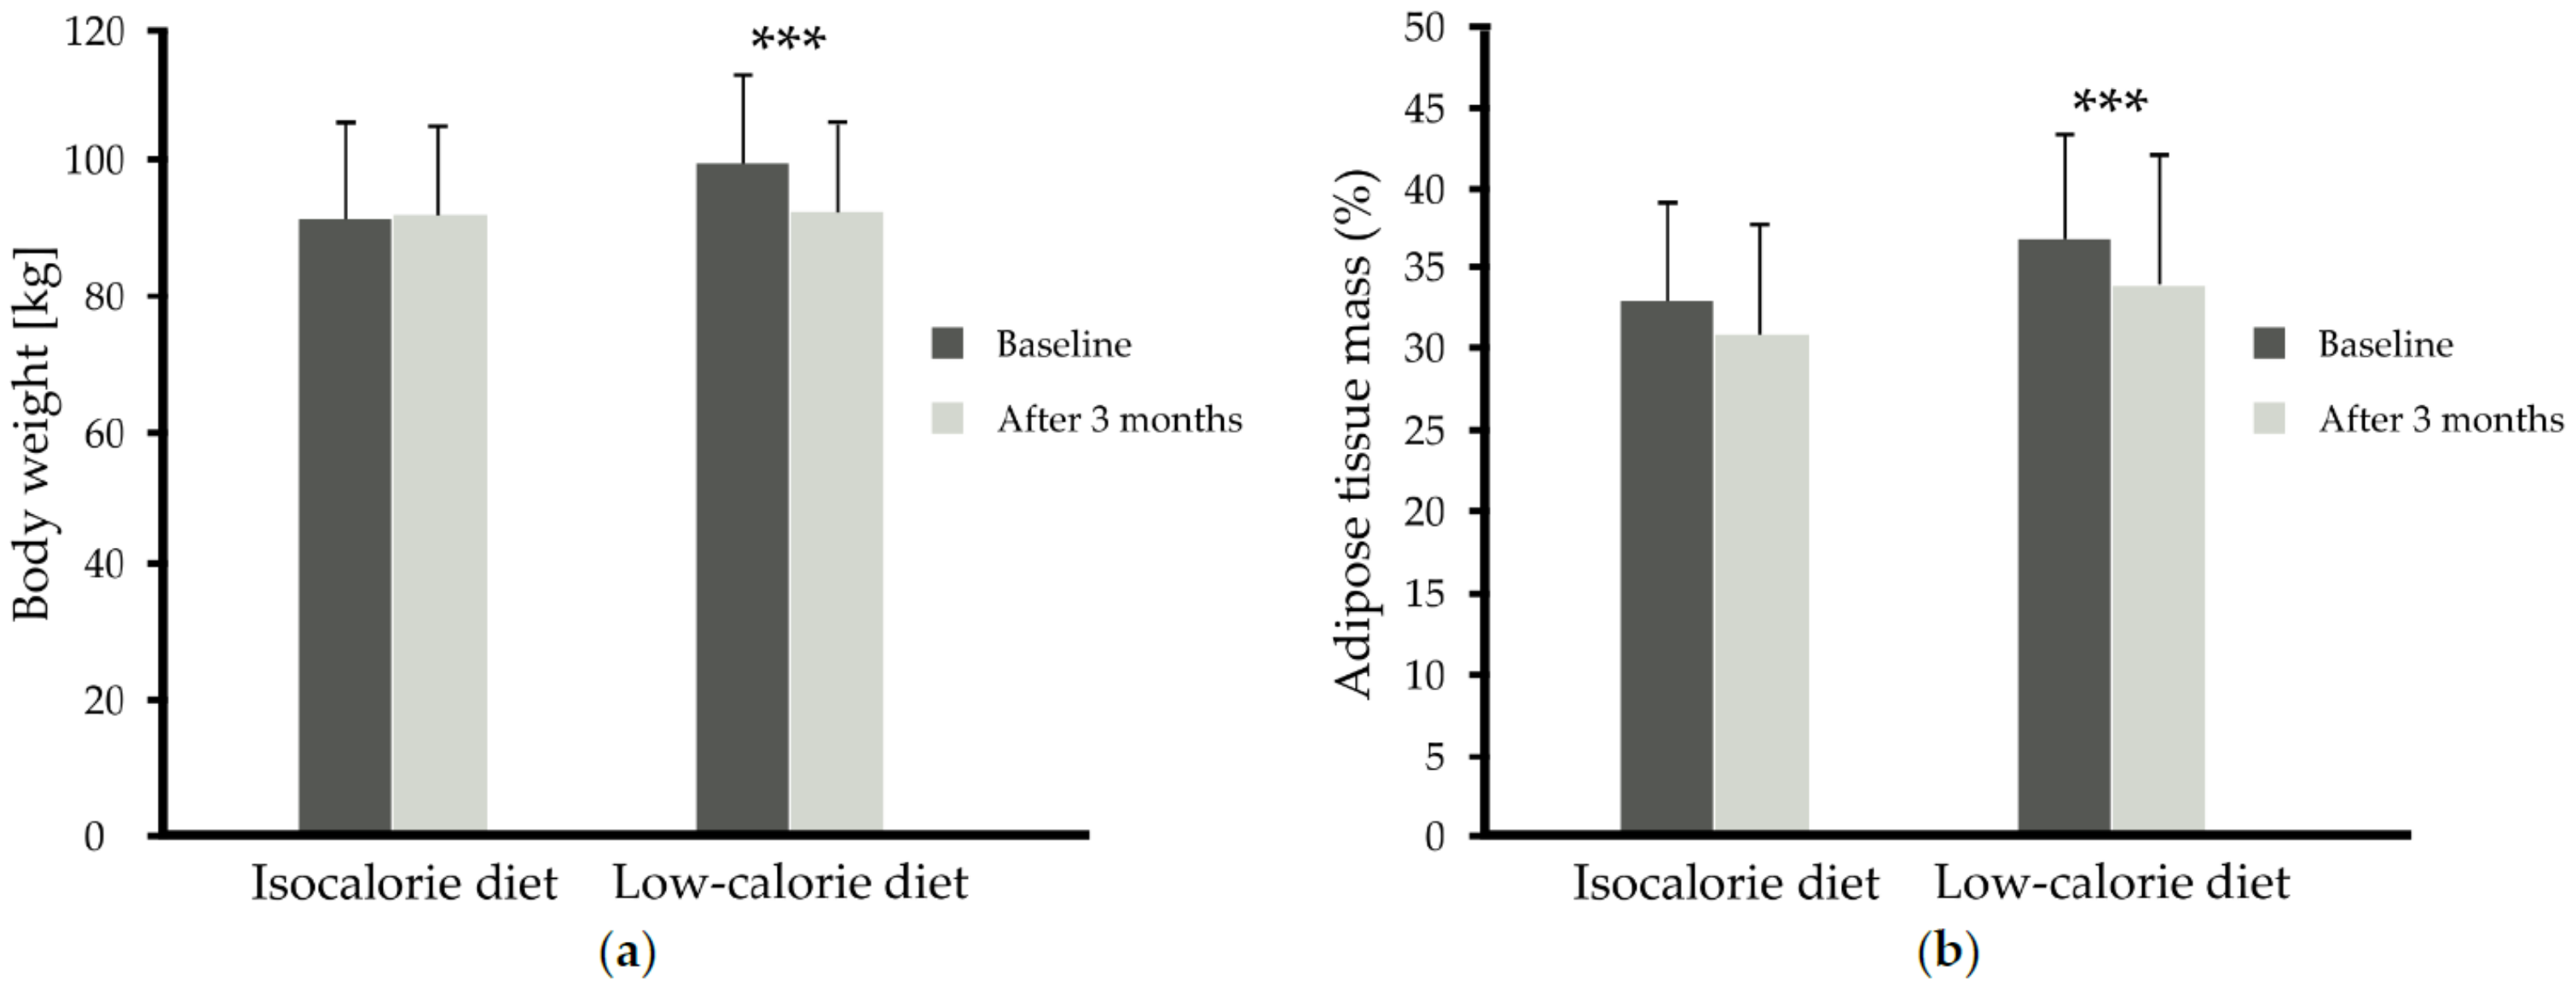
| p-Value time x diet | 0.212 | <0.001 | 0.491 | 0.342 | 0.704 | <0.001 | 0.050 | |
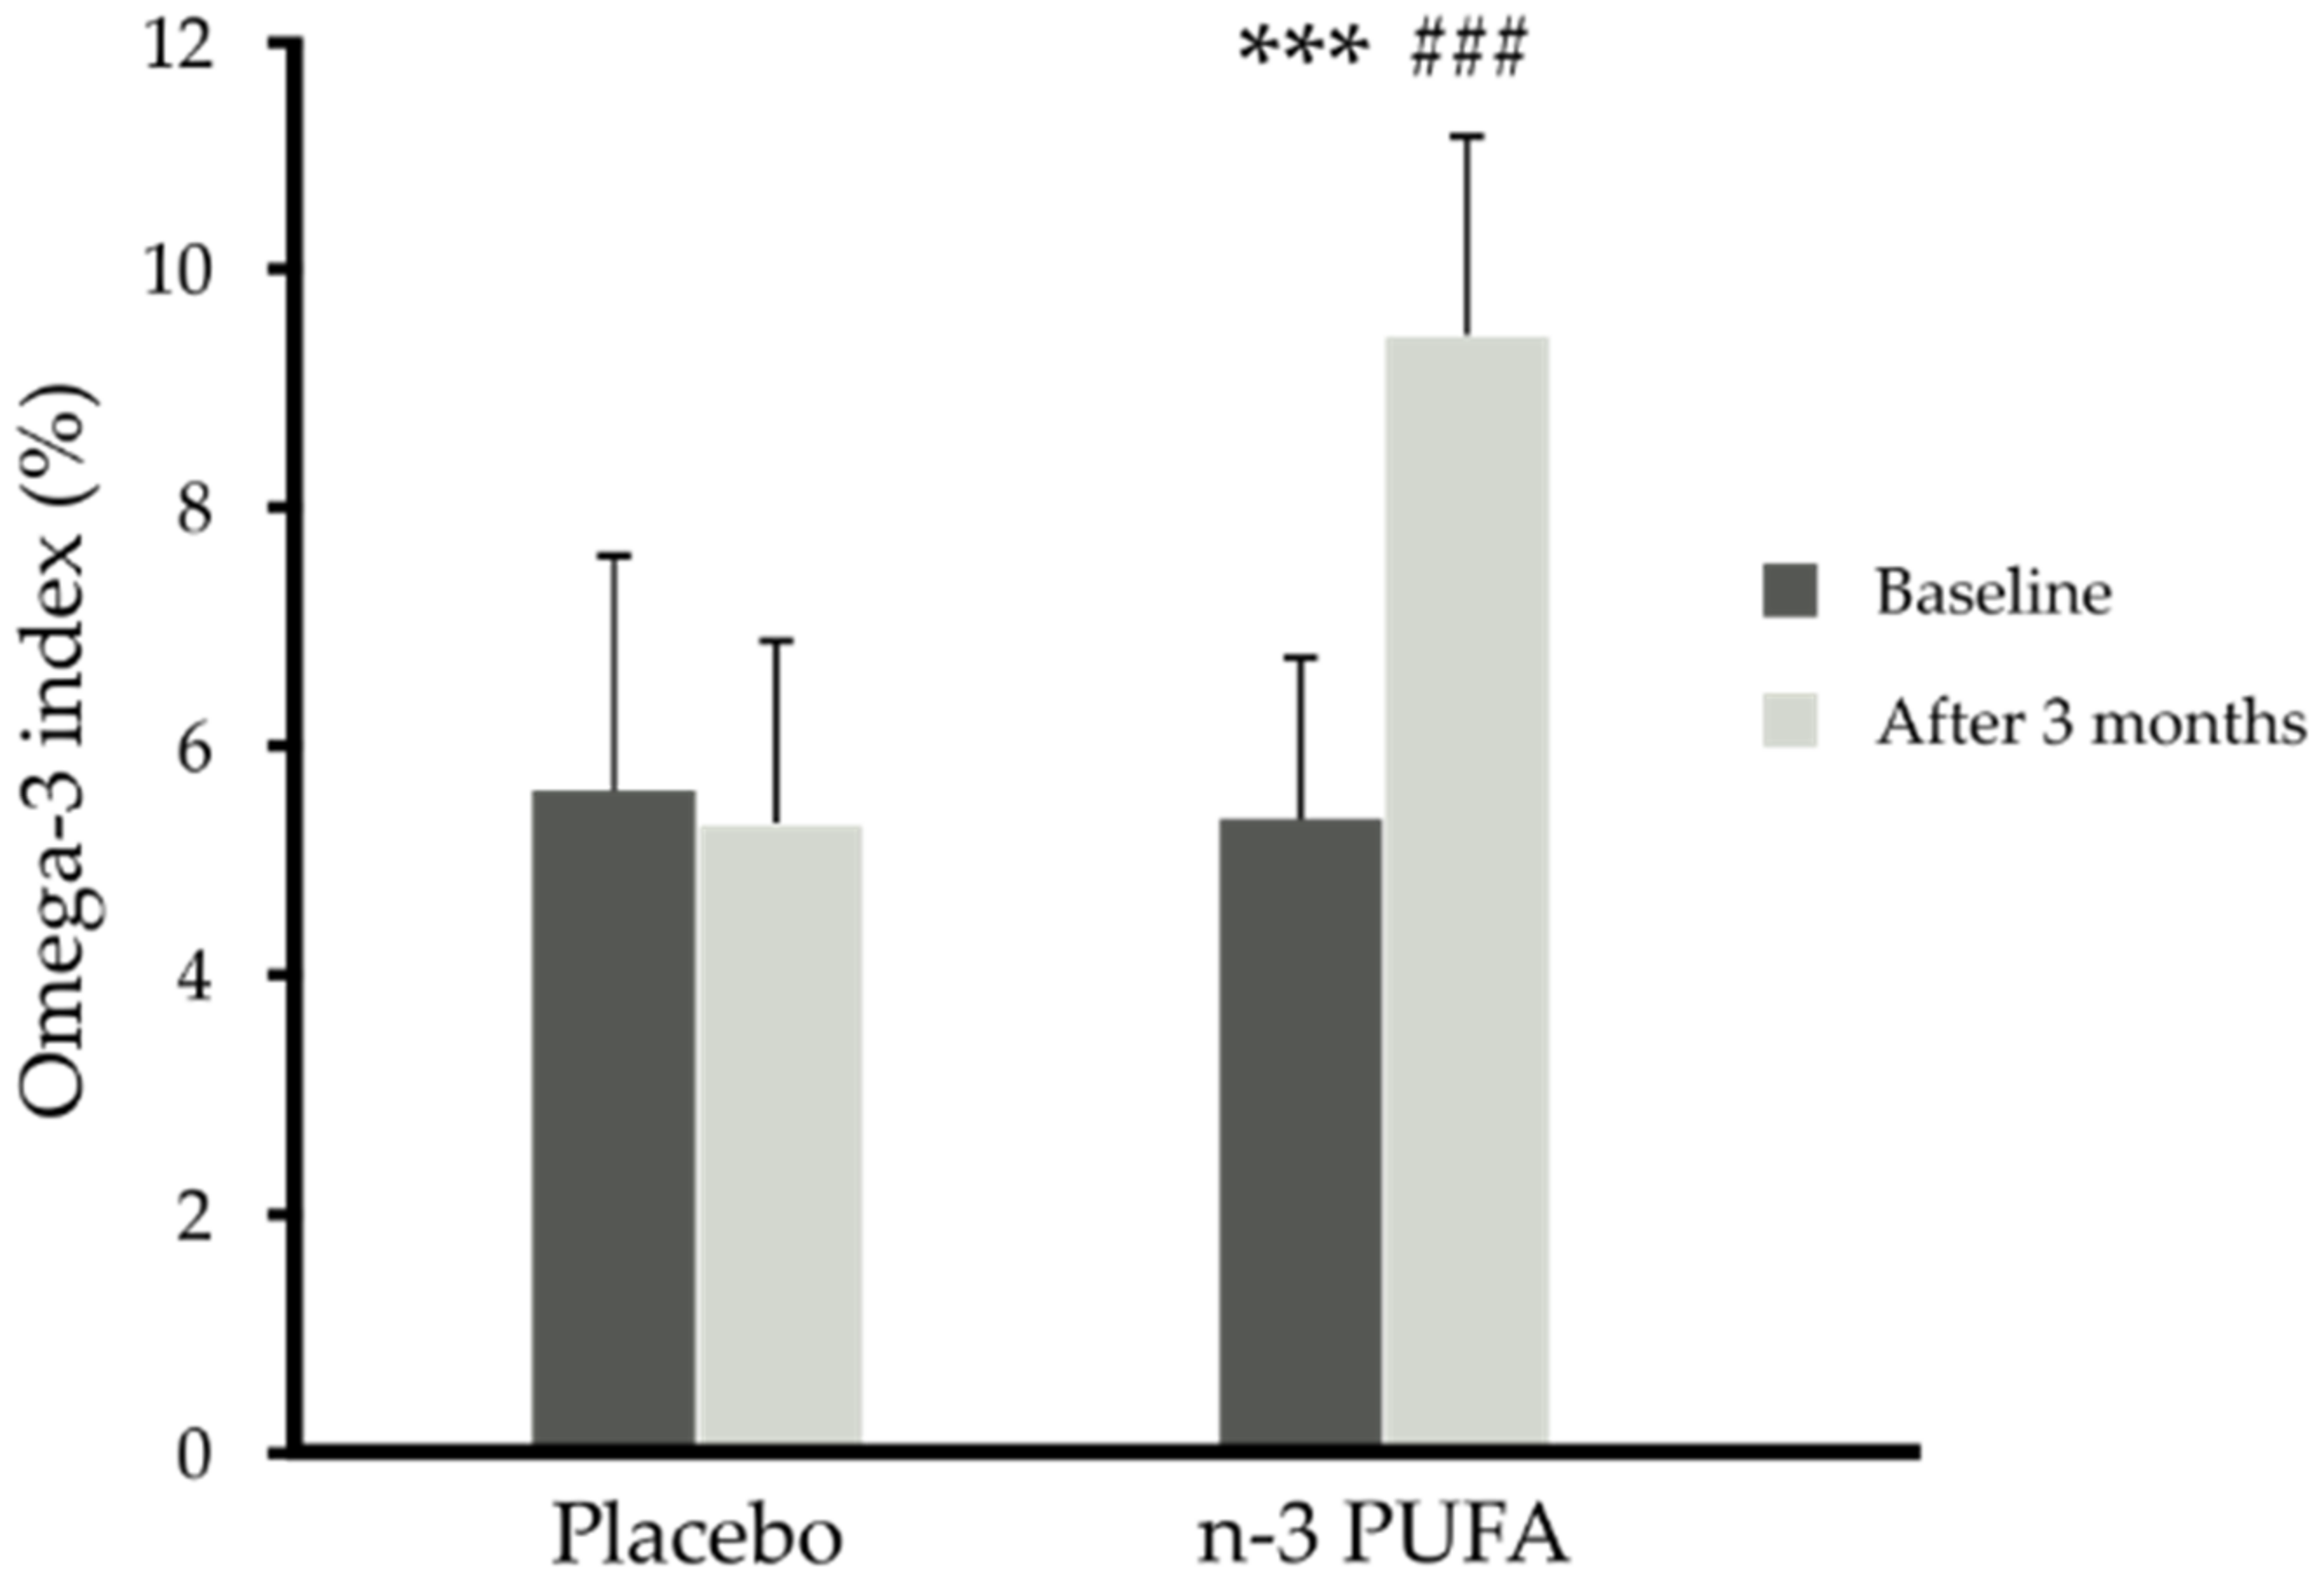
| p-Value time x supplementation | <0.001 | <0.001 | <0.001 | <0.001 | <0.001 | 0.525 | 0.853 | |
| p-Value time x diet x supplementation | 0.483 | 0.590 | 0.604 | 0.148 | 0.568 | 0.879 | 0.602 | |
| Group | Time | Total Cholesterol (mmol/L) | HDL- Cholesterol (mmol/L) | LDL- Cholesterol (mmol/L) | NEFAs (mmol/L) | TGs (mmol/L) | Glucose (mmol/L) | Insulin (µIU/mL) | HOMA-IR | GIP (pg/mL) |
|---|---|---|---|---|---|---|---|---|---|---|
| IS + placebo (n = 14) | Baseline | 5.47 ± 1.20 | 1.31 ± 0.23 | 3.55 ± 0.90 | 0.81 ± 0.32 | 1.34 ± 0.89 | 5.21 ± 0.72 | 14.67 ± 6.41 | 3.50 ± 1.86 | 33.2 ± 13.6 |
| After 3 months | 5.15 ± 1.01 | 1.32 ±0.23 | 3.15 ± 0.76 | 0.82 ± 0.28 | 1.51 ± 0.80 | 5.47 ± 0.67 | 15.14 ± 6.60 | 3.80 ± 2.10 | 34.9 ± 17.4 | |
| IS + n-3 PUFA (n = 13) | Baseline | 5.36 ± 0.83 | 1.20 ± 0.18 | 3.58 ± 0.86 | 0.65 ± 0.22 | 1.29 ± 0.53 | 5.06 ± 0.33 | 12.55 ± 5.16 | 2.84 ± 1.29 | 22.9 ± 13.4 |
| After 3 months | 5.44 ± 0.70 | 1.27 ± 0.17 | 3.56 ± 0.69 | 0.56 ± 0.17 | 1.26 ± 0.63 | 5.15 ± 0.36 | 12.52 ± 4.53 | 2.86 ± 1.03 | 19.36 ± 8.77 | |
| CR + placebo (n = 14) | Baseline | 4.85 ± 0.98 | 1.21 ± 0.22 | 2.99 ± 0.78 | 0.74 ± 0.28 | 1.43 ± 0.54 | 5.09 ± 0.42 | 19.84 ± 11.29 | 4.51 ±2.63 | 38.6 ± 33.4 |
| After 3 months | 4.52 ± 0.90 | 1.28 ± 0.34 | 2.67 ± 0.62 | 0.84 ± 0.32 | 1.27 ± 0.40 | 5.17 ± 0.35 | 18.05 ± 8.22 | 4.22 ± 2.10 | 34.6 ± 17.6 | |
| CR + n-3 PUFA (n = 23) | Baseline | 5.40 ± 0.75 | 1.25 ± 0.24 | 3.35 ± 0.77 | 0.75 ± 0.27 | 1.87 ± 0.98 | 5.44 ± 0.53 | 15.78 ± 8.01 | 3.88 ± 2.14 | 33.5 ± 24.1 |
| After 3 months | 5.09 ± 0.99 | 1.24 ± 0.19 | 3.22 ± 1.01 | 0.72 ± 0.23 | 1.52 ±0.98 | 5.29 ± 0.53 | 13.54 ± 5.57 | 3.25 ± 1.60 | 28.9 ± 24.5 | |
| p-Value time x diet | 0.837 | 0.987 | 0.824 | 0.214 | 0.003 | 0.054 | 0.101 | 0.056 | 0.743 | |
| p-Value time x supplementation | 0.812 | 0.893 | 0.564 | 0.106 | 0.141 | 0.060 | 0.664 | 0.409 | 0.219 | |
| p-Value time x diet x supplementation | 0.484 | 0.627 | 0.834 | 0.823 | 0.748 | 0.541 | 0.745 | 0.661 | 0.824 | |
| Group | Time | Leptin (ng/mL) | Adiponectin (µg/mL) | Resistin (ng/mL) | Visfatin (ng/mL) | IL-6 (pg/mL) | CRP (mg/L) | sE-Selectin (pg/mL) | MCP-1 (pg/mL) | sPECAM-1 (ng/mL) | sVCAM-1 (ng/mL) |
|---|---|---|---|---|---|---|---|---|---|---|---|
| IS + placebo (n = 14) | Baseline | 26.86 ± 16.90 | 6.37 ± 4.21 | 9.42 ± 3.81 | 1.14 ± 0.35 | 1.67 ± 1.02 | 2.12 ± 2.18 | 45.13 ± 10.64 | 411 ± 95 | 73.73 ± 15.59 | 558.3 ± 132.3 |
| After 3 months | 24.67 ± 15.95 | 5.92 ± 4.20 | 10.04 ± 3.70 | 1.07 ± 0.61 | 1.24 ± 0.49 | 1.62 ± 1.29 | 43.12 ± 11.42 | 374 ± 79 | 65.59 ± 16.53 | 544.3 ± 122.4 | |
| IS + n-3 PUFA (n = 13) | Baseline | 23.62 ± 13.61 | 6.59 ± 2.35 | 9.01 ± 2.15 | 0.95 ± 0.61 | 0.95 ± 0.44 | 1.51 ± 1.19 | 31.81 ± 12.69 | 302 ± 60 | 69.93 ± 13.63 | 586.8 ± 123.7 |
| After 3 months | 21.71 ± 13.06 | 6.49 ± 2.36 | 9.08 ± 2.25 | 0.76 ± 0.39 | 0.84 ± 0.38 | 1.35 ± 1.02 | 31.05 ± 12.49 | 282 ± 60 | 63.86 ± 17.41 | 569.2 ± 124.2 | |
| CR + placebo (n = 14) | Baseline | 42.12 ± 21.68 | 4.96 ± 2.48 | 9.26 ± 3.08 | 1.12 ± 0.67 | 1.75 ± 0.93 | 3.35 ± 2.41 | 37.66 ± 12.70 | 337 ± 66 | 71.01 ± 18.41 | 581.9 ± 167.7 |
| After 3 months | 34.69 ± 23.31 | 5.43 ± 3.20 | 9.50 ± 3.12 | 0.92 ± 0.68 | 1.38 ± 0.72 | 2.36 ± 1.55 | 30.52 ± 10.56 | 324 ± 60 | 63.15 ± 15.12 | 594.5 ± 174.7 | |
| CR + n-3 PUFA (n = 23) | Baseline | 30.61 ± 27.48 | 5.56 ± 2.87 | 9.96 ± 3.34 | 1.33 ± 0.98 | 1.49 ± 1.35 | 2.62 ± 2.25 | 40.35 ± 18.92 | 357 ± 109 | 65.08 ± 14.33 | 618.5 ± 139.0 |
| After 3 months | 21.89 ± 16.51 | 5.87 ± 2.51 | 10.42 ± 3.02 | 1.27 ± 1.23 | 1.25 ± 0.66 | 1.52 ± 1.50 | 36.23 ± 16.18 | 337 ± 105 | 60.64 ± 13.52 | 606.9 ± 130.7 | |
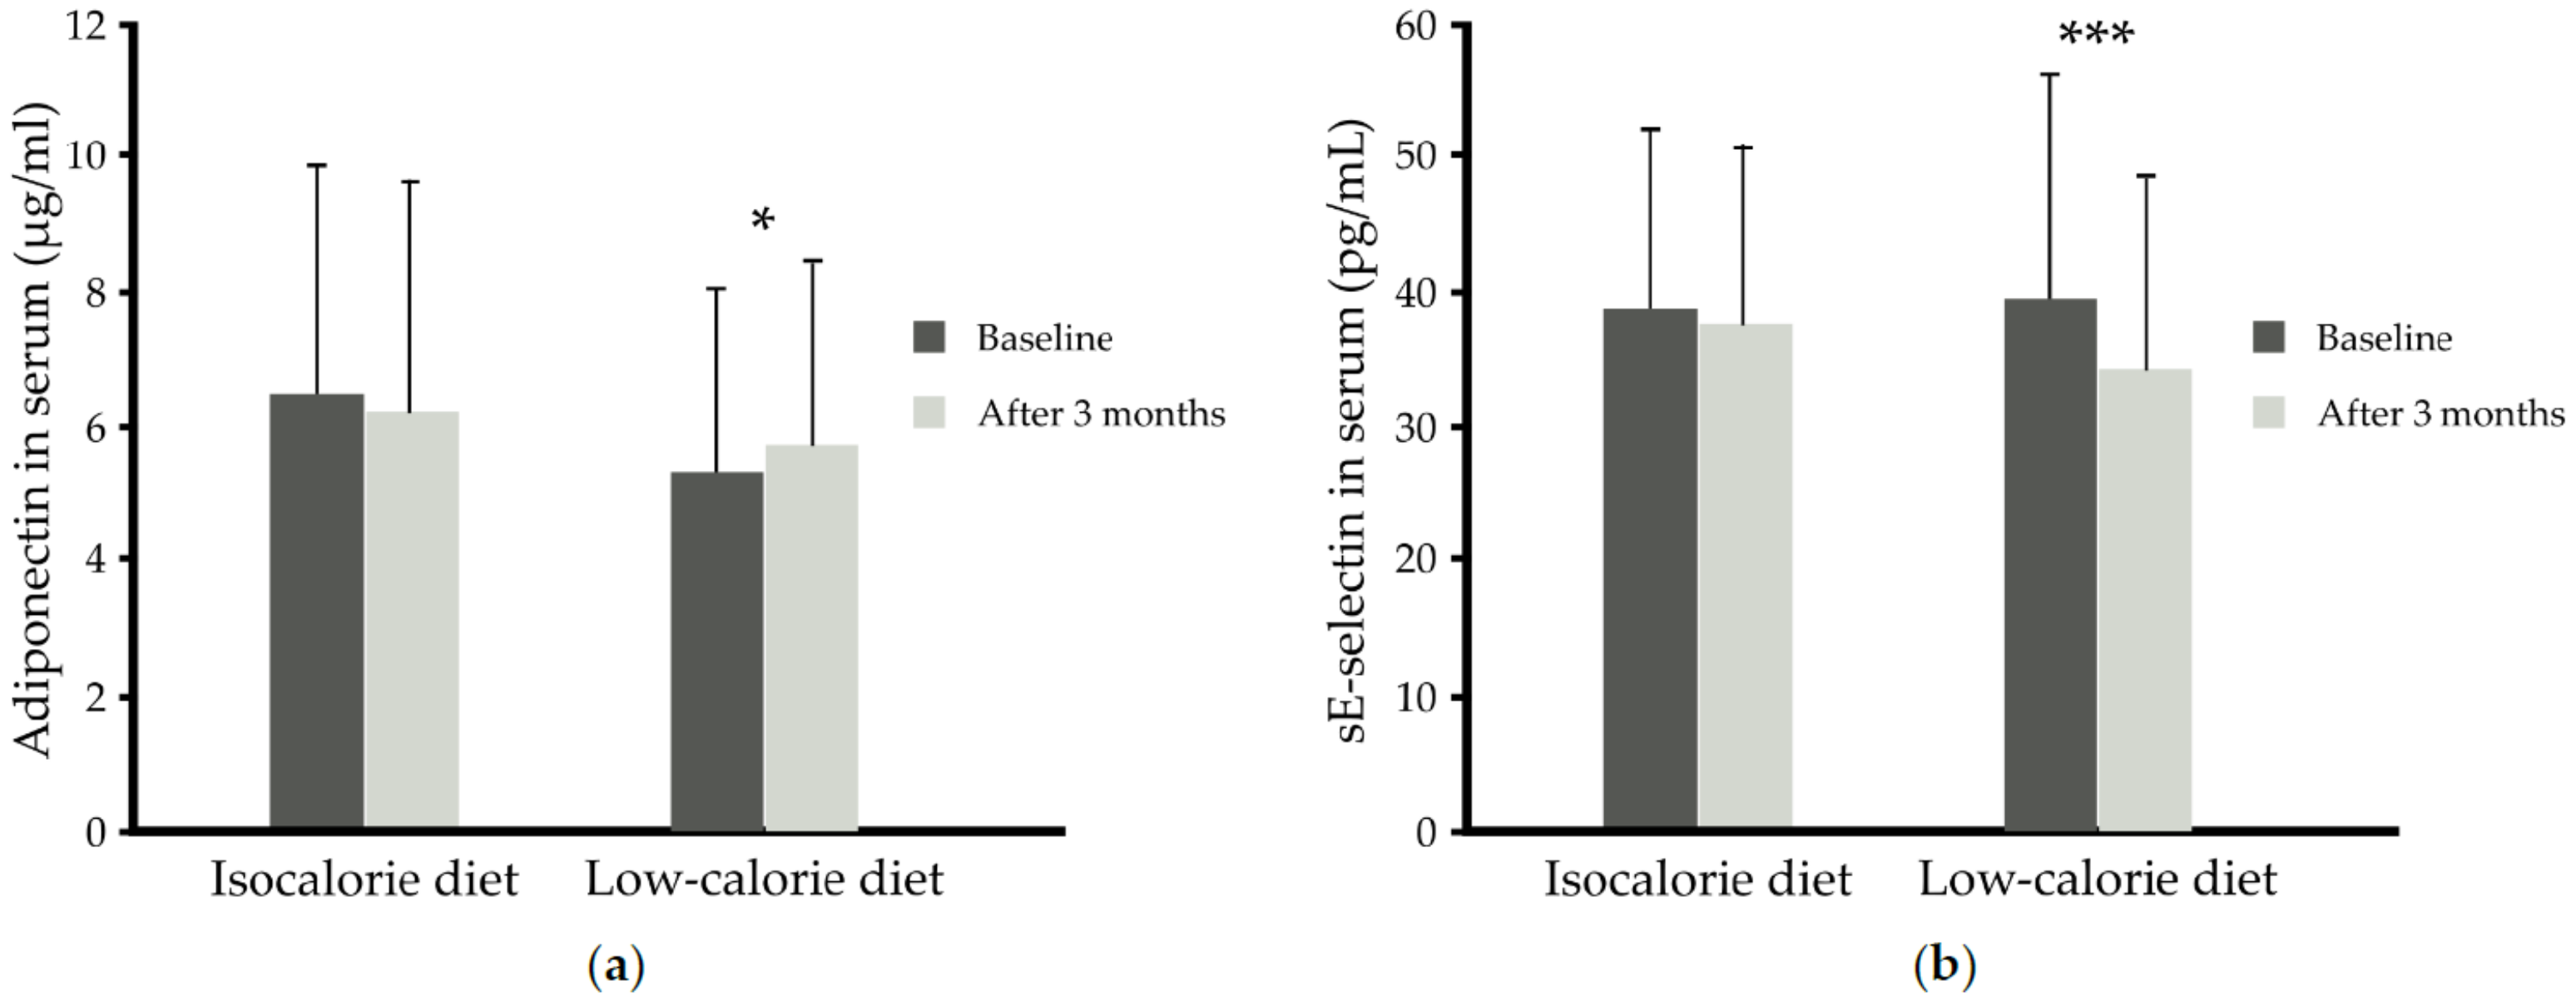
| p-Value time x diet | 0.054 | 0.008 | 0.998 | 0.316 | 0.857 | 0.324 | 0.010 | 0.435 | 0.662 | 0.306 | |
| p-Value time x supplementation | 0.908 | 0.385 | 0.715 | 0.442 | 0.318 | 0.764 | 0.187 | 0.992 | 0.206 | 0.433 | |
| p-Value time x diet x suplementation | 0.699 | 0.580 | 0.367 | 0.359 | 0.846 | 0.410 | 0.580 | 0.580 | 0.754 | 0.617 | |
| Group | Time | Vitamin D (ng/mL) | FGF-21 (pg/mL) | Osteopontin (ng/mL) | PINP (ng/mL) | CTX-I (ng/mL) | Gla-OC (ng/mL) | Glu-OC (ng/mL) | Total-OC (ng/mL) |
|---|---|---|---|---|---|---|---|---|---|
| IS + placebo (n = 14) | Baseline | 14.57 ± 5.70 | 241.04 ± 134.40 | 49.86 ± 9.60 | 7.61 ± 1.85 | 0.32 ± 0.15 | 10.26 ± 2.66 | 3.38 ± 2.00 | 13.48 ± 3.48 |
| After 3 months | 14.51 ± 4.12 | 206.39 ± 130.46 | 49.38 ± 9.66 | 7.64 ± 1.46 | 0.31 ± 0.16 | 10.68 ± 2.95 | 2.95 ± 1.37 | 13.63 ± 3.70 | |
| IS + n-3 PUFA (n = 13) | Baseline | 17.15 ± 6.28 | 271.97 ± 218.01 | 47.00 ± 11.60 | 7.44 ± 1.23 | 0.32 ± 0.17 | 9.81 ± 1.63 | 2.74 ± 1.61 | 12.52 ± 2.09 |
| After 3 months | 16.69 ± 6.24 | 239.89 ± 218.96 | 44.15 ± 9.37 | 7.73 ± 1.52 | 0.28 ± 0.15 | 10.29 ± 1.83 | 2.61 ± 1.59 | 12.71 ± 1.99 | |
| CR + placebo (n = 14) | Baseline | 12.41 ± 5.71 | 257.66 ± 145.80 | 51.50 ± 12.62 | 8.38 ± 2.36 | 0.34 ± 0.16 | 11.26 ± 3.90 | 3.46 ± 1.77 | 14.72 ± 4.79 |
| After 3 months | 13.17 ± 5.87 | 211.27 ± 82.91 | 49.81 ± 11.05 | 8.04 ± 1.74 | 0.40 ± 0.20 | 11.53 ± 3.57 | 3.35 ± 1.88 | 14.87 ± 4.72 | |
| CR + n-3 PUFA (n = 23) | Baseline | 14.99 ± 7.10 | 242.53 ± 159.93 | 49.94 ± 11.04 | 7.87 ± 2.48 | 0.30 ± 0.09 | 10.55 ± 4.18 | 4.25 ± 3.60 | 14.80 ± 4.93 |
| After 3 months | 15.28 ± 6.97 | 200.41 ± 147.24 | 52.84 ± 13.13 | 8.05 ± 1.55 | 0.36 ± 0.15 | 11.74 ± 5.23 | 3.88 ± 3.20 | 15.62 ± 5.57 | |
| p-Value time x diet | 0.528 | 0.764 | 0.249 | 0.699 | <0.001 | 0.817 | 0.813 | 0.773 | |
| p-Value time x supplementation | 0.822 | 0.879 | 0.571 | 0.273 | 0.572 | 0.463 | 0.895 | 0.587 | |
| p-Value time x diet x suplementation | 0.885 | 0.799 | 0.080 | 0.524 | 0.710 | 0.592 | 0.734 | 0.685 | |
| Parameter | ∆ CTX-I (ng/mL) | |
|---|---|---|
| rho | p | |
| ∆BMI (kg/m2) | −0.50 | <0.001 |
| ∆Leptin (ng/mL) | −0.26 | 0.036 |
| ∆Adiponectin (µg/mL) | 0.25 | 0.043 |
Publisher’s Note: MDPI stays neutral with regard to jurisdictional claims in published maps and institutional affiliations. |
© 2021 by the authors. Licensee MDPI, Basel, Switzerland. This article is an open access article distributed under the terms and conditions of the Creative Commons Attribution (CC BY) license (https://creativecommons.org/licenses/by/4.0/).
Share and Cite
Razny, U.; Goralska, J.; Calder, P.C.; Gruca, A.; Childs, C.E.; Kapusta, M.; Slowinska-Solnica, K.; Dembinska-Kiec, A.; Solnica, B.; Malczewska-Malec, M. The Effect of Caloric Restriction with and without n-3 PUFA Supplementation on Bone Turnover Markers in Blood of Subjects with Abdominal Obesity: A Randomized Placebo-Controlled Trial. Nutrients 2021, 13, 3096. https://doi.org/10.3390/nu13093096
Razny U, Goralska J, Calder PC, Gruca A, Childs CE, Kapusta M, Slowinska-Solnica K, Dembinska-Kiec A, Solnica B, Malczewska-Malec M. The Effect of Caloric Restriction with and without n-3 PUFA Supplementation on Bone Turnover Markers in Blood of Subjects with Abdominal Obesity: A Randomized Placebo-Controlled Trial. Nutrients. 2021; 13(9):3096. https://doi.org/10.3390/nu13093096
Chicago/Turabian StyleRazny, Urszula, Joanna Goralska, Philip C. Calder, Anna Gruca, Caroline E. Childs, Maria Kapusta, Krystyna Slowinska-Solnica, Aldona Dembinska-Kiec, Bogdan Solnica, and Malgorzata Malczewska-Malec. 2021. "The Effect of Caloric Restriction with and without n-3 PUFA Supplementation on Bone Turnover Markers in Blood of Subjects with Abdominal Obesity: A Randomized Placebo-Controlled Trial" Nutrients 13, no. 9: 3096. https://doi.org/10.3390/nu13093096