
Effect of a Ketogenic Diet on the Nutritional Parameters of Obese Patients: A Systematic Review and Meta-Analysis

 , , , and
Abstract
:1. Introduction
2. Materials and Method
2.1. Design of the Review
2.2. Criteria for Study Inclusion
2.3. Search Strategy
2.4. Study Selection
2.5. Data Extraction
2.6. Quality Assessment
2.7. Data Synthesis
3. Results
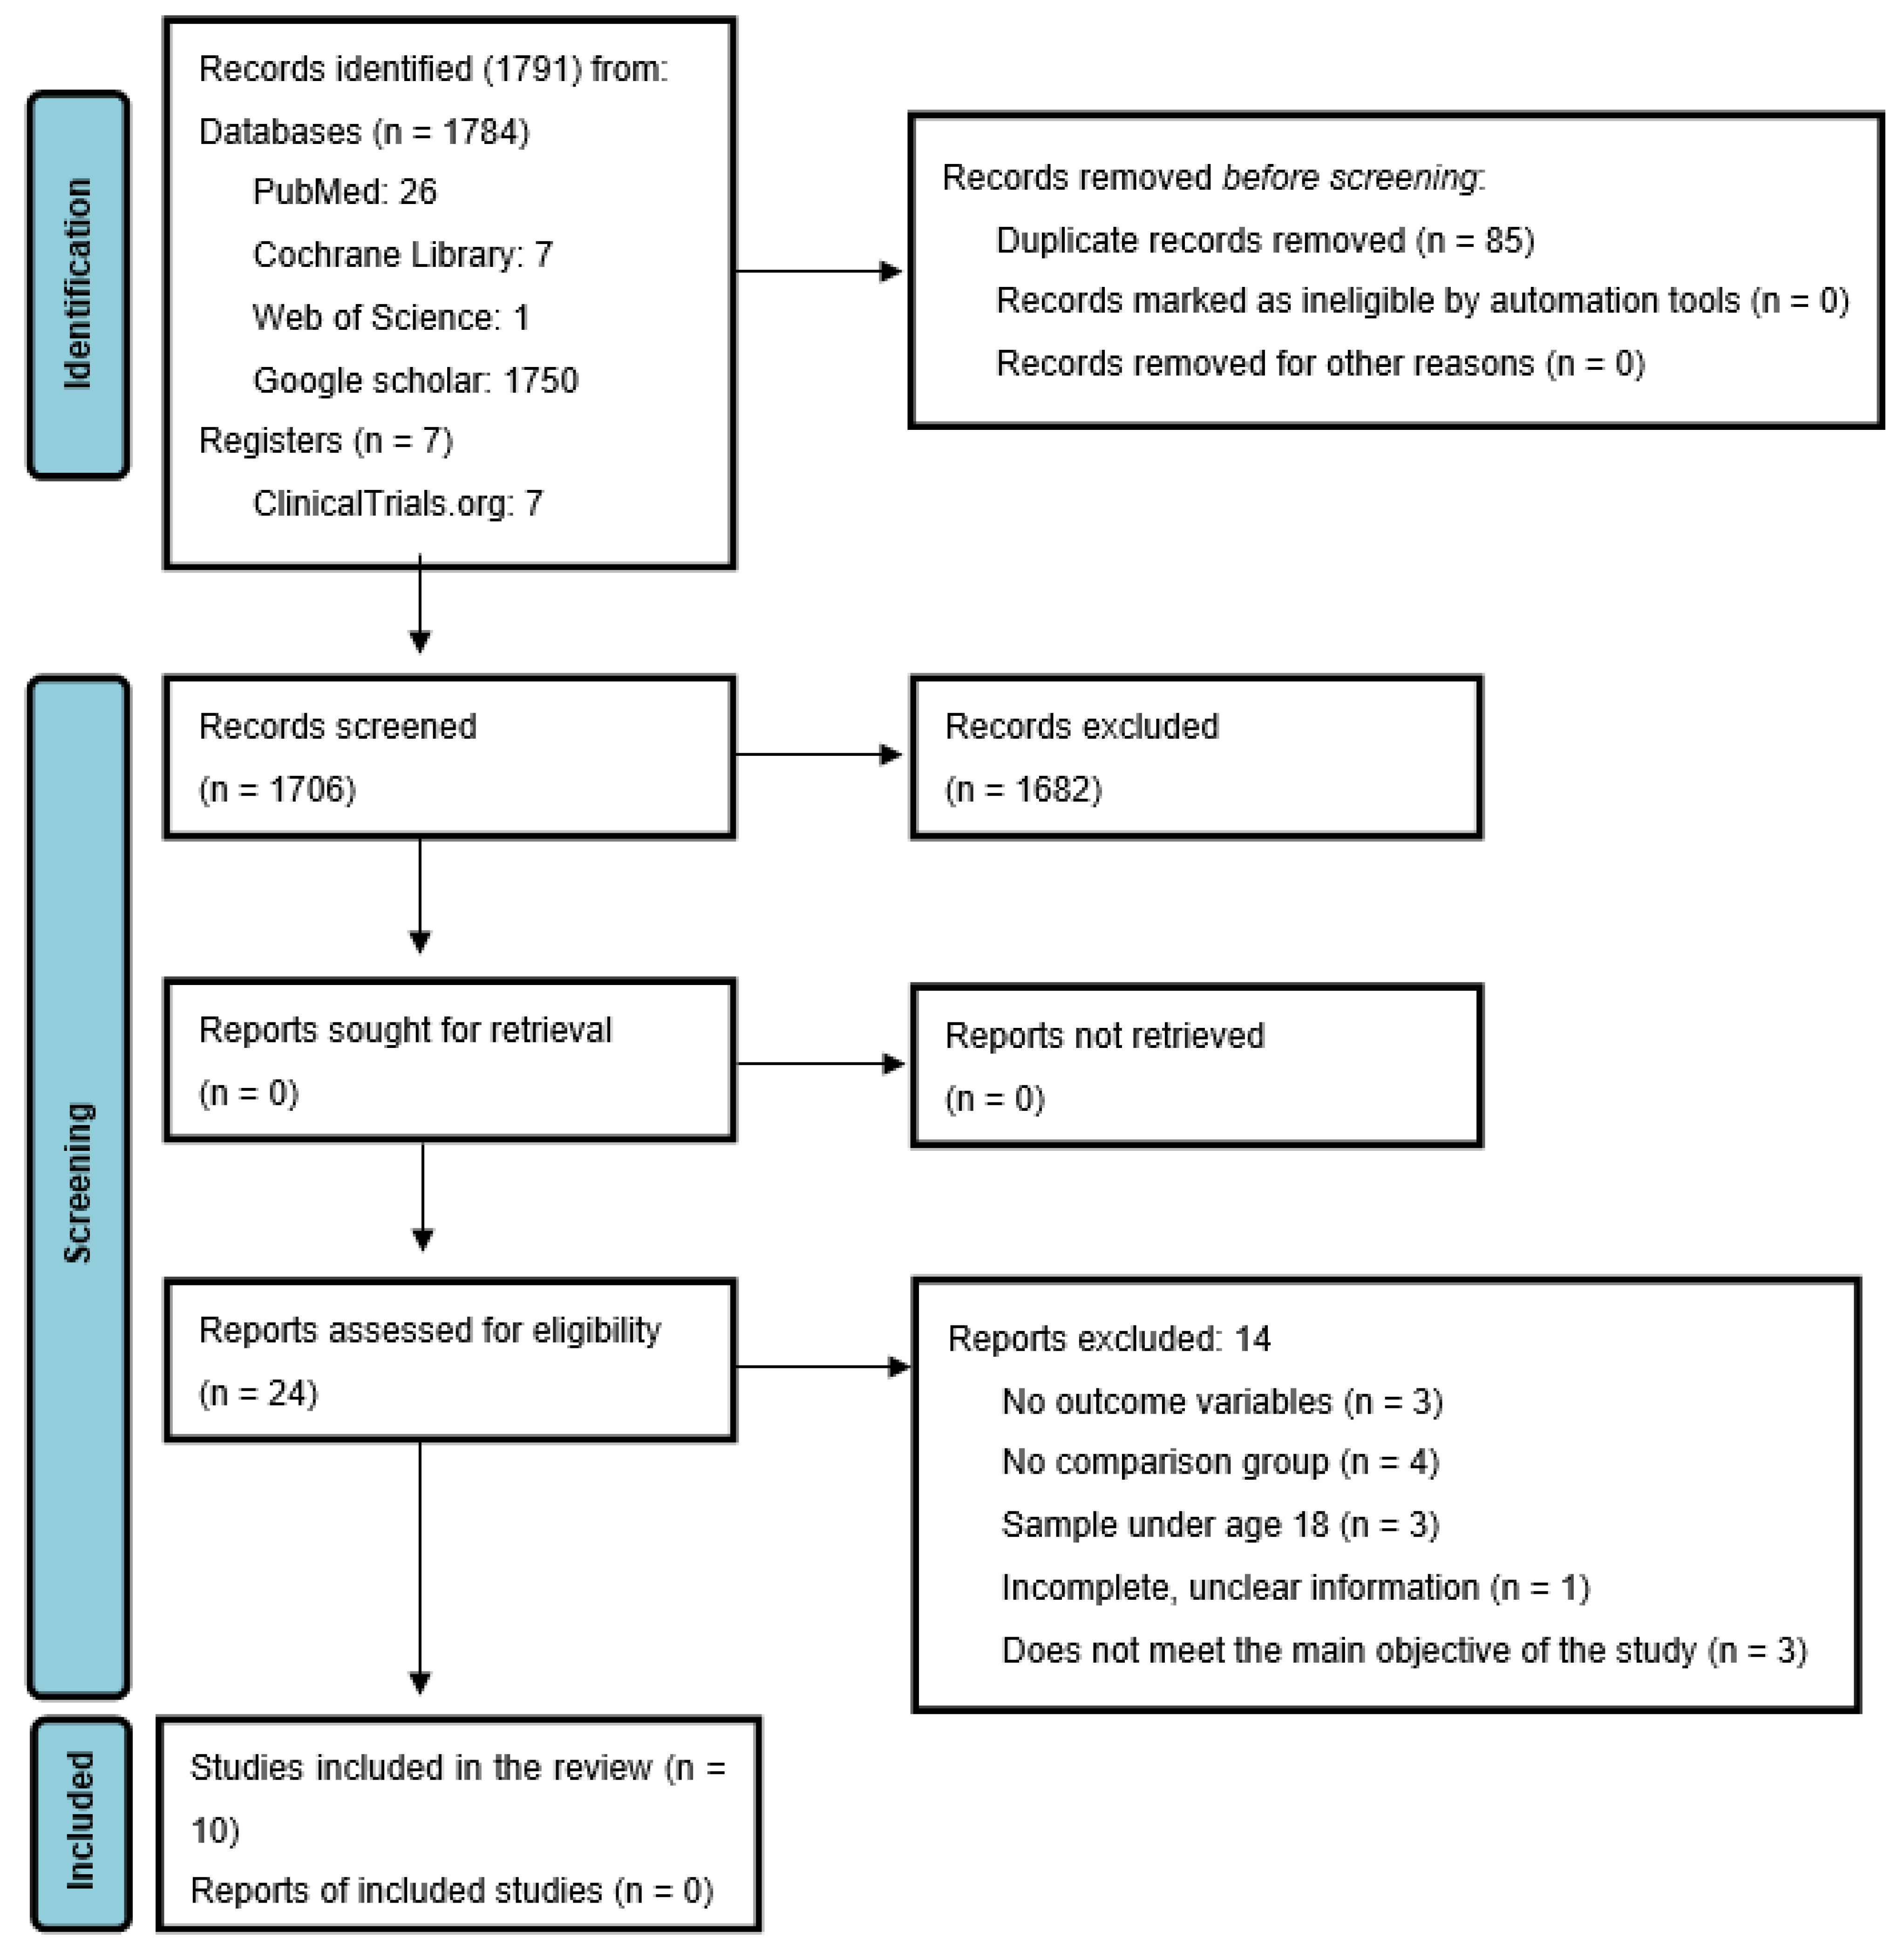
3.1. Search Results
3.2. Characteristics of Included Studies
3.3. Assessment of Risk of Bias
3.4. Results of Included Studies
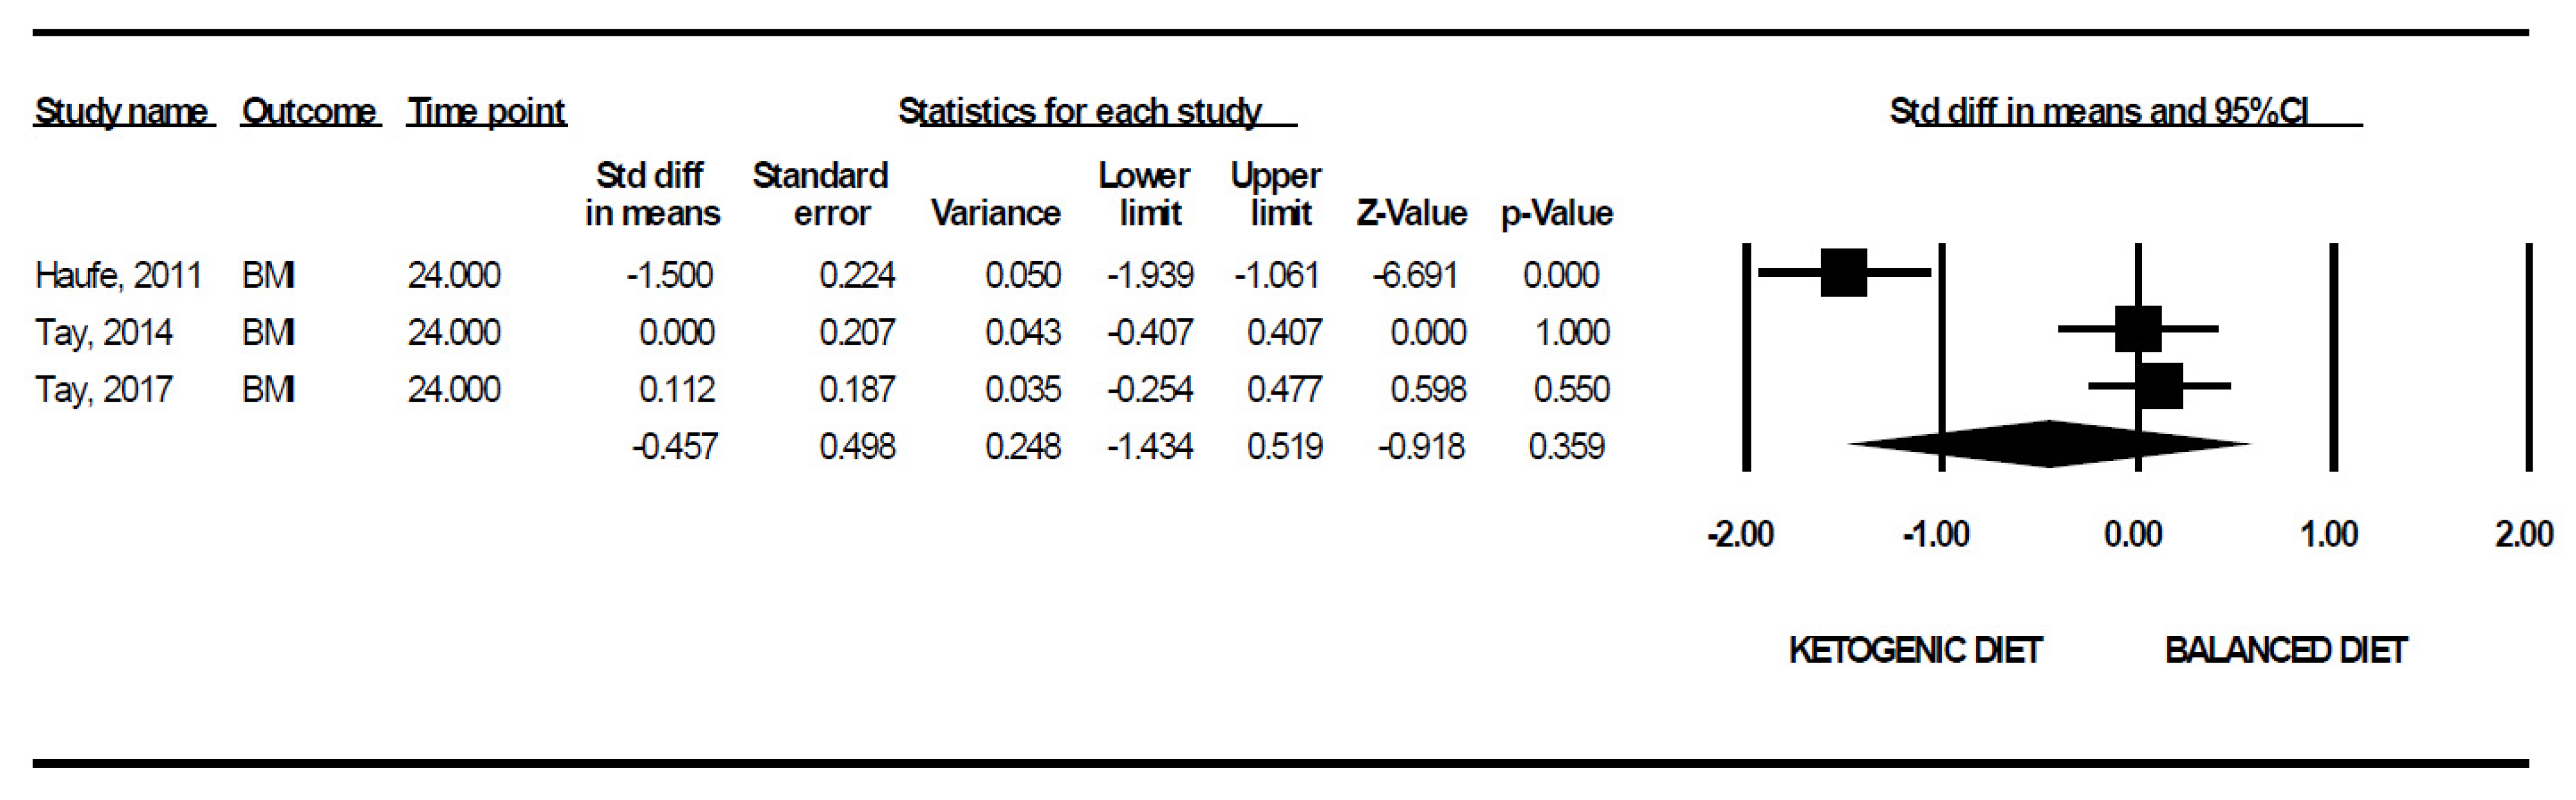
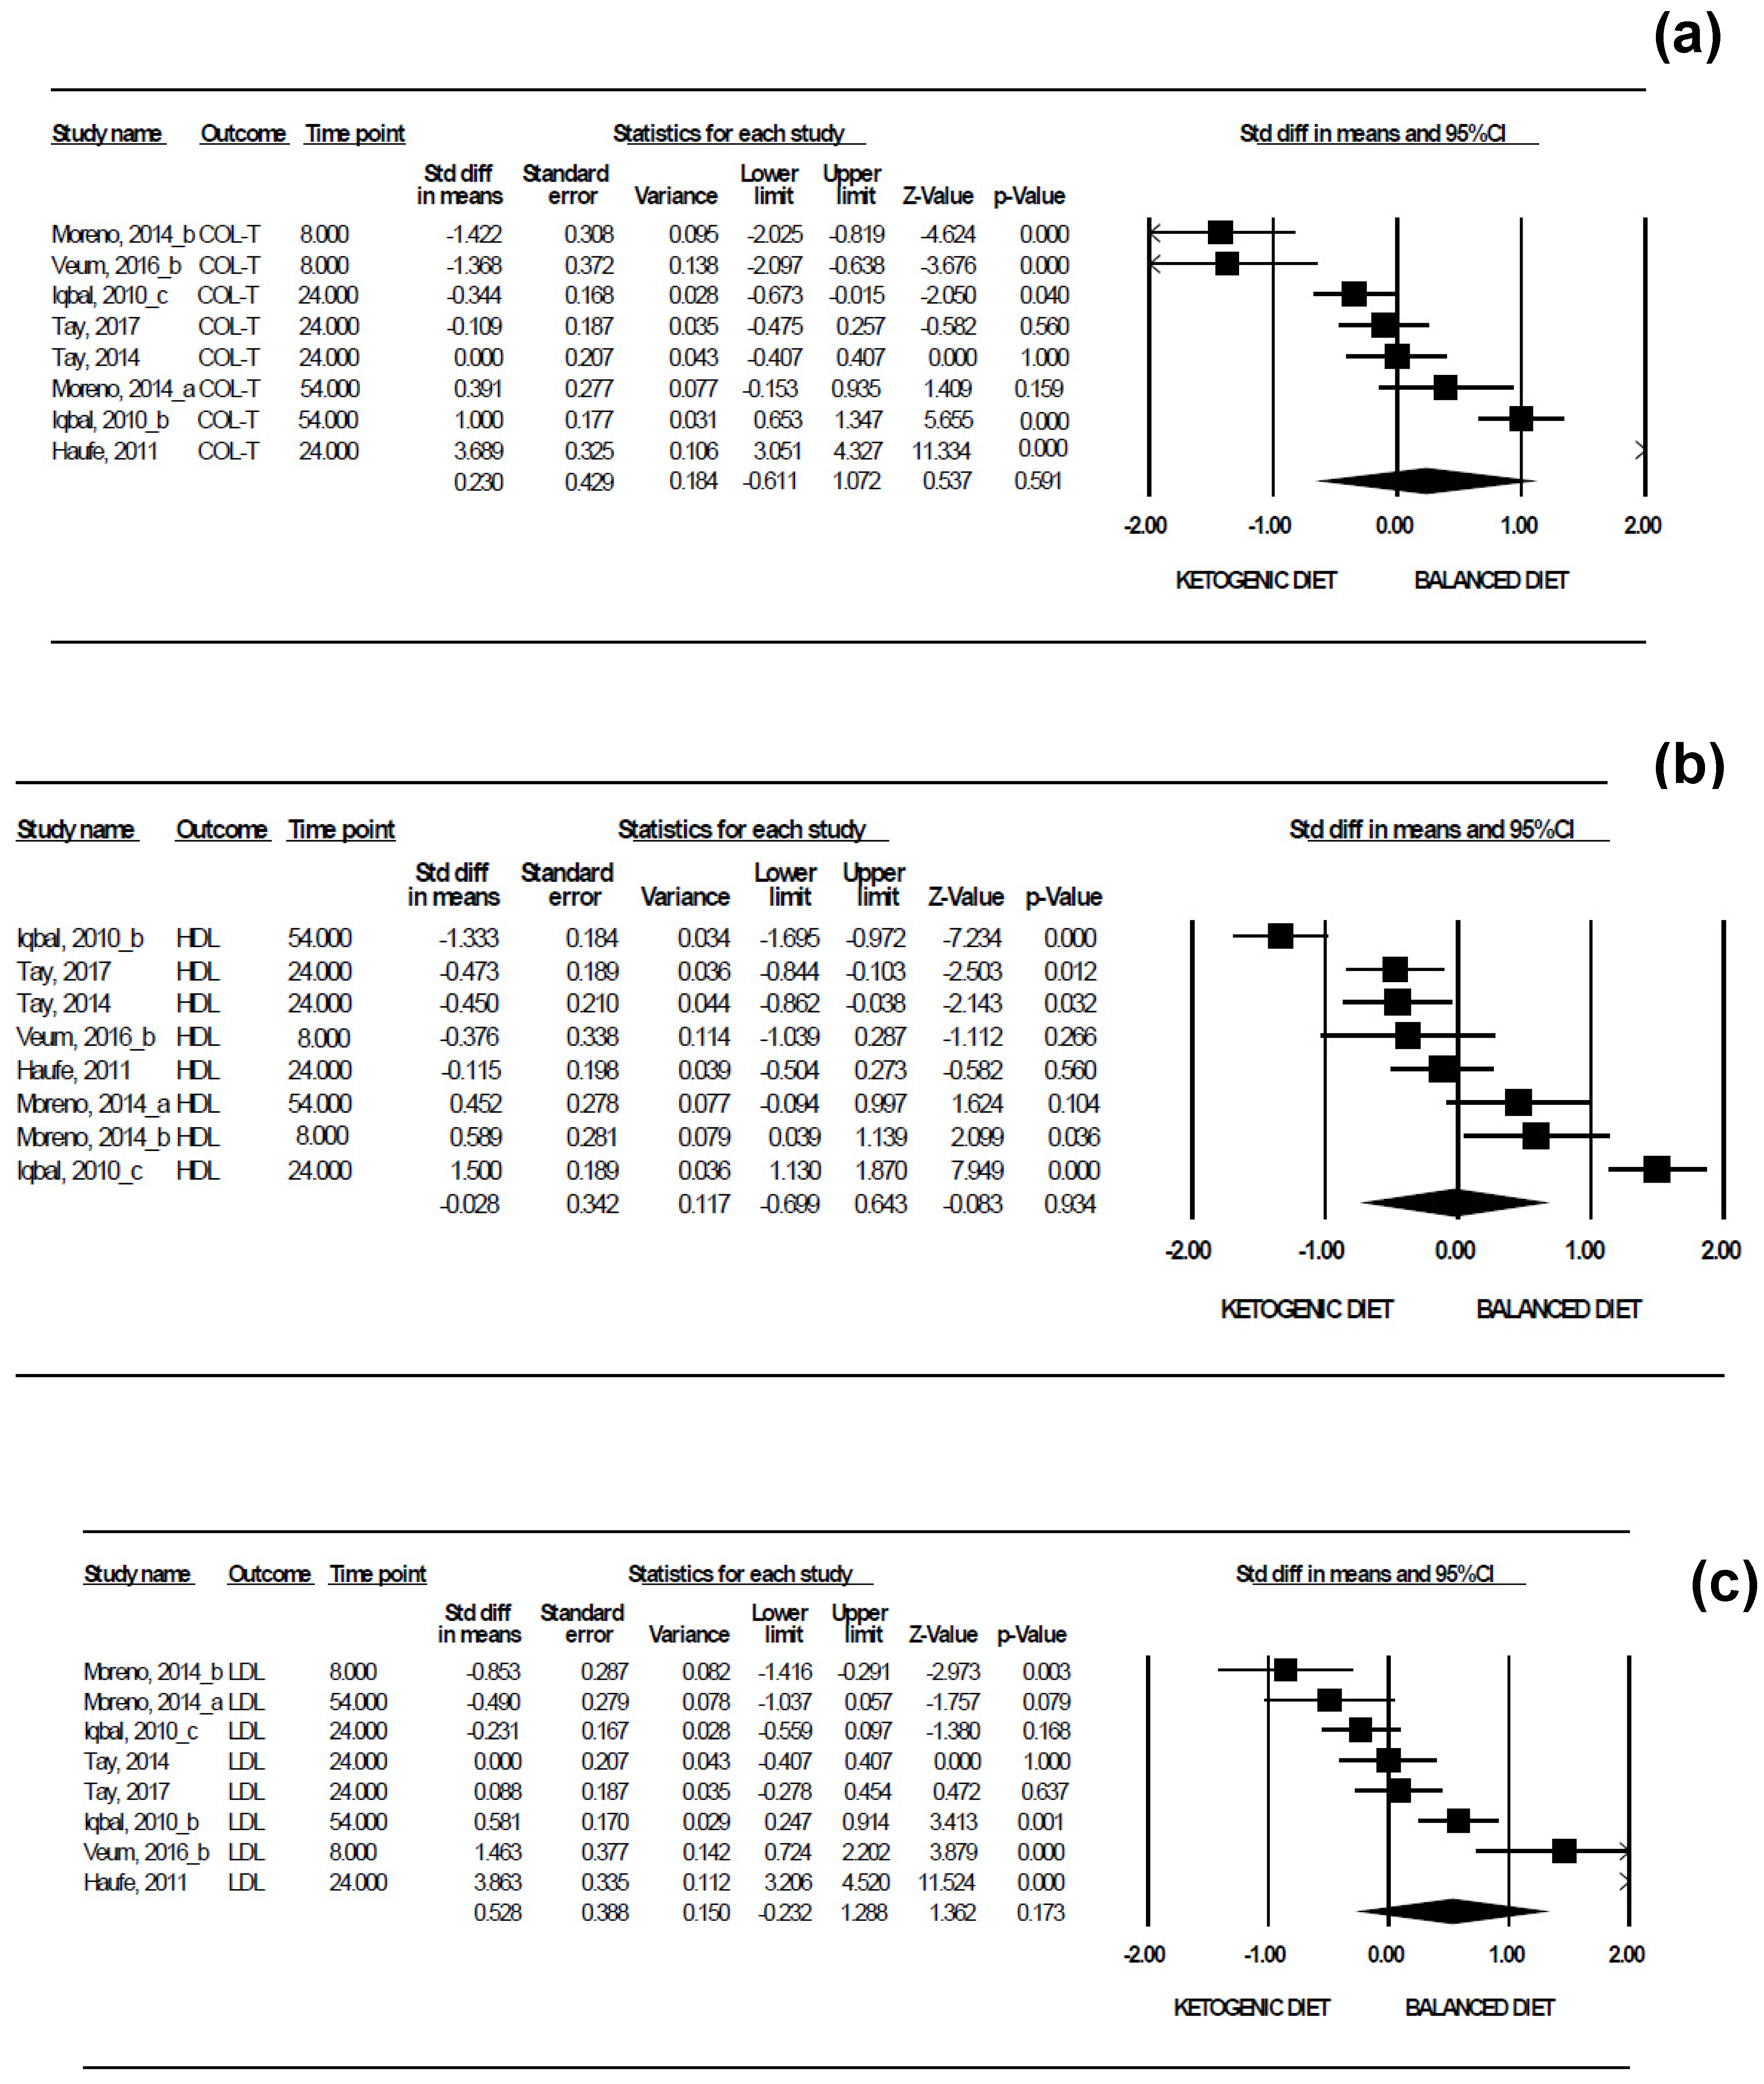
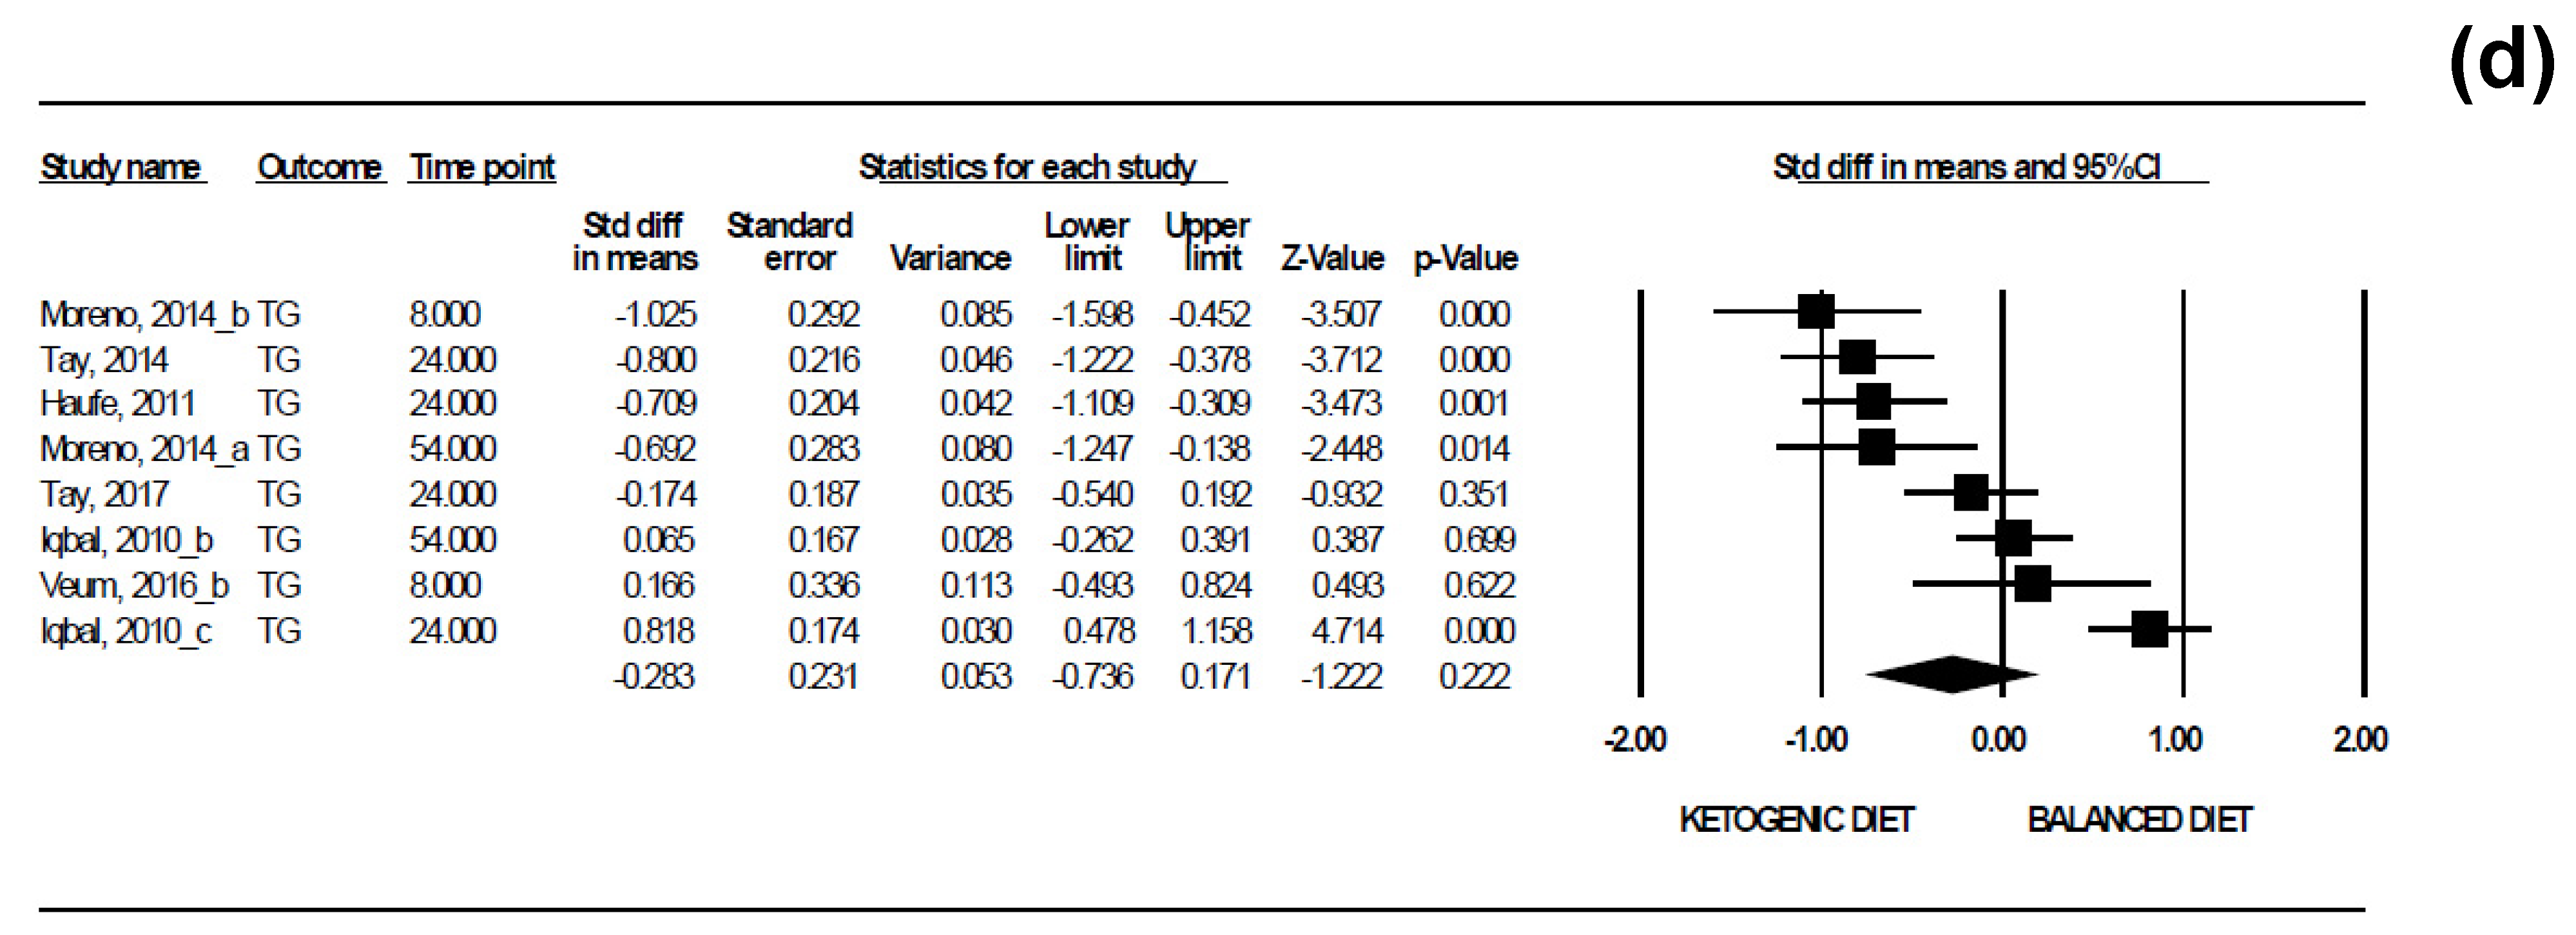
3.5. Results of the Meta-Analyses
4. Discussion
Supplementary Materials
Author Contributions
Funding
Institutional Review Board Statement
Informed Consent Statement
Data Availability Statement
Conflicts of Interest
References
- He, S.; Wang, J.; Zhang, J.; Xu, J. Intermittent versus continuous energy restriction for weight loss and metabolic improvement: A meta-analysis and systematic review. Obesity 2021, 29, 108–115. Available online: https://onlinelibrary.wiley.com/doi/10.1002/oby.23023 (accessed on 1 July 2021). [CrossRef]
- Chawla, S.; Tessarolo-Silva, F.; Amaral-Medeiros, S.; Mekary, R.A.; Radenkovic, D. The effect of low-fat and low-carbohydrate diets on weight loss and lipid levels: A systematic review and meta-analysis. Nutrients 2020, 12, 3774. Available online: https://www.mdpi.com/2072-6643/12/12/3774 (accessed on 2 July 2021). [CrossRef] [PubMed]
- Bardova, K.; Funda, J.; Pohl, R.; Cajka, T.; Hensler, M.; Kuda, O.; Janovska, P.; Adamcova, K.; Irodenko, I.; Lenkova, L.; et al. Additive effects of Omega-3 fatty acids and thiazolidinediones in mice fed a high-fat diet: Triacylglycerol/fatty acid cycling in adipose tissue. Nutrients 2020, 12, 3737. Available online: https://www.mdpi.com/2072-6643/12/12/3737 (accessed on 2 July 2021). [CrossRef] [PubMed]
- Hadi, S.; Momenan, M.; Cheraghpour, K.; Hafizi, N.; Pourjavidi, N.; Malekahmadi, M.; Foroughi, M.; Alipour, M. Abdominal volume index: A predictive measure in relationship between depression/anxiety and obesity. Afr. Health Sci. 2020, 20, 257–265. Available online: https://www.ajol.info/index.php/ahs/article/view/195016 (accessed on 1 July 2021). [CrossRef] [PubMed]
- Rojo-Tirado, M.A.; Benito, P.J.; Ruiz, J.R.; Ortega, F.B.; Romero-Moraleda, B.; Butragueño, J.; Bermejo, L.M.; Castro, E.A.; Gómez-Candela, C. Body composition changes after a weight loss intervention: A 3-year follow-up study. Nutrients 2021, 13, 164. Available online: https://www.mdpi.com/2072-6643/13/1/164 (accessed on 2 July 2021). [CrossRef]
- Calvert, S.; Barwick, K.; Par, M.; Ni Tan, K.; Borges, K. A pilot study of add-on oral triheptanoin treatment for children with medically refractory epilepsy. Eur. J. Paediatr. Neurol. 2018, 22, 1074–1080. Available online: https://linkinghub.elsevier.com/retrieve/pii/S1090379818301211 (accessed on 2 July 2021). [CrossRef] [Green Version]
- de Brito Sampaio, L. Ketogenic diet for epilepsy treatment. Arq. Neuropsiquiatr. 2016, 74, 842–848. [Google Scholar] [CrossRef] [Green Version]
- Ruberto, M.; Monda, V.; Precenzano, F.; Di-Maio, G.; Messina, A.; Lanzara, V.; Merolla, E.; Tartaglia, N.; Ambrosi, A.; Monda, M.; et al. Physical activity, ketogenic diet, and epilepsy: A mini-review. Sport Mont. 2021, 19, 109–113. [Google Scholar] [CrossRef]
- Caprio, M.; Infante, M.; Moriconi, E.; Armani, A.; Fabbri, A.; Mantovani, G.; Mariani, S.; Lubrano, C.; Poggiogalle, E.; Migliaccio, S.; et al. Very-low-calorie ketogenic diet (VLCKD) in the management of metabolic diseases: Systematic review and consensus statement from the italian society of endocrinology (SIE). J. Endocrinol. Investig. 2019, 42, 1365–1386. [Google Scholar] [CrossRef]
- Ari, C.; Kovács, Z.; Murdun, C.; Koutnik, A.P.; Goldhagen, C.R.; Rogers, C.; Diamond, D.; D’Agostino, D.P. Nutritional ketosis delays the onset of isoflurane induced anesthesia. BMC Anesthesiol. 2018, 18, 85. Available online: https://bmcanesthesiol.biomedcentral.com/articles/10.1186/s12871-018-0554-0 (accessed on 2 July 2021). [CrossRef] [Green Version]
- Dhamija, R.; Eckert, S.; Wirrell, E. Ketogenic Diet. Can. J. Neurol. Sci. 2013, 40, 158–167. Available online: https://www.cambridge.org/core/product/identifier/S0317167100013676/type/journal_article (accessed on 2 July 2021). [CrossRef] [Green Version]
- Iacovides, S.; Meiring, R.M. The effect of a ketogenic diet versus a high-carbohydrate, low-fat diet on sleep, cognition, thyroid function, and cardiovascular health independent of weight loss: Study protocol for a randomized controlled trial. Trials 2018, 19, 62. Available online: https://trialsjournal.biomedcentral.com/articles/10.1186/s13063-018-2462-5 (accessed on 2 July 2021). [CrossRef] [Green Version]
- Valenzano, A.; Polito, R.; Trimigno, V.; Di Palma, A.; Moscatelli, F.; Corso, G.; Sessa, F.; Salerno, M.; Montana, A.; Di Nunno, N.; et al. Effects of very low calorie ketogenic diet on the orexinergic system, visceral adipose tissue, and ROS production. Antioxidants 2019, 8, 643. [Google Scholar] [CrossRef] [Green Version]
- Bueno, N.B.; de Melo, I.S.V.; de Oliveira, S.L.; da Rocha Ataide, T. Very-low-carbohydrate ketogenic diet V. Low-fat diet for long-term weight loss: A meta-analysis of randomised controlled trials. Br. J. Nutr. 2013, 110, 1178–1187. [Google Scholar] [CrossRef] [Green Version]
- di Rosa, C.; Lattanzi, G.; Taylor, S.F.; Manfrini, S.; Khazrai, Y.M. Very low calorie ketogenic diets in overweight and obesity treatment: Effects on anthropometric parameters, body composition, satiety, lipid profile and microbiota. Obes. Res. Clin. Pract. 2020, 14, 491–503. [Google Scholar] [CrossRef] [PubMed]
- Dashti, H.M.; Mathew, T.C.; Hussein, T.; Asfar, S.K.; Behbahani, A.; Khoursheed, M.A.; Al-Sayer, H.M.; Bo-Abbas, Y.Y.; Al-Zaid, N.S. Long-Term Effects of a ketogenic diet in obese patients. Exp. Clin. Cardiol. 2004, 9, 200–205. Available online: http://www.embase.com/search/results?subaction=viewrecord&from=export&id=L39600023 (accessed on 2 July 2021). [PubMed]
- Moher, D.; Liberati, A.; Tetzlaff, J.; Altman, D.G. Preferred reporting items for systematic reviews and meta-analyses: The PRISMA statement. PLoS Med. 2009, 6, e1000097. [Google Scholar] [CrossRef] [Green Version]
- UNITSLAB.COM. Available online: http://unitslab.com/ (accessed on 15 April 2021).
- Higgins, J.; Green, S. Cochrane handbook for systematic reviews of interventions [Manual Cochrane de revisiones sistemáticas de intervenciones]. Cochrane Collab. 2011, 1–639. Available online: www.cochrane-handbook.org (accessed on 15 April 2021). (In Spanish).
- Review Manager (RevMan). Available online: https://training.cochrane.org/online-learning/core-software-cochrane-reviews/revman (accessed on 3 May 2021).
- Borenstein, M.; Higgins, J.P.T.; Hedges, L.V.; Rothstein, H.R. Basics of meta-analysis: I2 is not an absolute measure of heterogeneity. Res. Synth. Methods 2017, 8, 5–18. [Google Scholar] [CrossRef] [Green Version]
- Moreno, B.; Bellido, D.; Sajoux, I.; Goday, A.; Saavedra, D.; Crujeiras, A.B.; Casanueva, F.F. Comparison of a very low-calorie-ketogenic diet with a standard low-calorie diet in the treatment of obesity. Endocrine 2014, 47, 793–805. [Google Scholar] [CrossRef] [PubMed]
- Iqbal, N.; Vetter, M.L.; Moore, R.H.; Chittams, J.L.; Dalton-Bakes, C.V.; Dowd, M.; Williams-Smith, C.; Cardillo, S.; Wadden, T.A. Effects of a low-intensity intervention that prescribed a low-carbohydrate vs. a low-fat diet in obese, diabetic participants. Obesity 2010, 18, 1733–1738. [Google Scholar] [CrossRef]
- Veum, V.L.; Laupsa-Borge, J.; Eng, Ø.; Rostrup, E.; Larsen, T.H.; Nordrehaug, J.E.; Nygård, O.K.; Sagen, J.V.; Gudbrandsen, O.A.; Dankel, S.N.; et al. Visceral adiposity and metabolic syndrome after very high–fat and low-fat isocaloric diets: A randomized controlled trial. Am. J. Clin. Nutr. 2017, 105, 85–99. [Google Scholar] [CrossRef] [Green Version]
- Page, M.J.; McKenzie, J.E.; Bossuyt, P.M.; Boutron, I.; Hoffmann, T.C.; Mulrow, C.D.; Shamseer, L.; Tetzlaff, J.M.; Akl, E.A.; Brennan, S.E.; et al. The PRISMA 2020 statement: An updated guideline for reporting systematic reviews. BMJ 2021, 372, 71. [Google Scholar] [CrossRef]
- Moreno, B.; Crujeiras, A.B.; Bellido, D.; Sajoux, I.; Casanueva, F.F. Obesity treatment by very low-calorie-ketogenic diet at two years: Reduction in visceral fat and on the burden of disease. Endocrine 2016, 54, 681–690. [Google Scholar] [CrossRef] [PubMed]
- Gutiérrez-Repiso, C.; Hernández-García, C.; García-Almeida, J.M.; Bellido, D.; Martín-Núñez, G.M.; Sánchez-Alcoholado, L.; Alcaide-Torres, J.; Sajoux, I.; Tinahones, F.J.; Moreno-Indias, I. Effect of synbiotic supplementation in a very-low-calorie ketogenic diet on weight loss achievement and gut microbiota: A randomized controlled pilot study. Mol. Nutr. Food Res. 2019, 63, 1900167. [Google Scholar] [CrossRef]
- Westman, E.C.; Yancy, W.S.; Olsen, M.K.; Dudley, T.; Guyton, J.R. Effect of a low-carbohydrate, ketogenic diet program compared to a low-fat diet on fasting lipoprotein subclasses. Int. J. Cardiol. 2006, 110, 212–216. [Google Scholar] [CrossRef] [PubMed]
- Yancy, W.S.; Olsen, M.K.; Guyton, J.R.; Bakst, R.P.; Westman, E.C. A low-carbohydrate, ketogenic diet versus a low-fat diet to treat obesity and hyperlipidemia. Ann. Intern. Med. 2004, 140, 769. [Google Scholar] [CrossRef]
- Tay, J.; Thompson, C.H.; Luscombe-Marsh, N.D.; Wycherley, T.P.; Noakes, M.; Buckley, J.D.; Wittert, G.A.; Yancy, W.S., Jr.; Brinkworth, G.D. Effects of an energy-restricted low-carbohydrate, high unsaturated fat/low saturated fat diet versus a high-carbohydrate, low-fat diet in type 2 diabetes: A 2-year randomized clinical trial. Diabetes Obes. Metab. 2018, 20, 858–871. [Google Scholar] [CrossRef] [PubMed]
- Tay, J.; Luscombe-Marsh, N.D.; Thompson, C.H.; Noakes, M.; Buckley, J.D.; Wittert, G.A.; Yancy, W.S., Jr.; Brinkworth, G.D. A very low-carbohydrate, low–saturated fat diet for type 2 diabetes management: A randomized trial. Diabetes Care 2014, 37, 2909–2918. [Google Scholar] [CrossRef] [Green Version]
- Haufe, S.; Engeli, S.; Kast, P.; Böhnke, J.; Utz, W.; Haas, V.; Hermsdorf, M.; Mähler, A.; Wiesner, S.; Birkenfeld, A.L.; et al. Randomized comparison of reduced fat and reduced carbohydrate hypocaloric diets on intrahepatic fat in overweight and obese human subjects. Hepatology 2011, 53, 1504–1514. [Google Scholar] [CrossRef] [PubMed]
- De Luis, D.A.; Aller, R.; Izaola, O.; González Sagrado, M.; Conde, R. Efectos de una dieta baja en grasas frente a una dieta rica en proteínas y grasa en pacientes obesos [Effects of a low-fat diet versus a diet high in protein and fat in obese patients]. Med. Clin. 2009, 132, 203–207. [Google Scholar] [CrossRef] [PubMed]
- Martin, C.K.; Rosenbaum, D.; Han, H.; Geiselman, P.J.; Wyatt, H.R.; Hill, J.O.; Brill, C.; Bailer, B.; Miller, B.V.; Stein, R.; et al. Change in food cravings, food preferences, and appetite during a low-carbohydrate and low-fat diet. Obesity 2011, 19, 1963–1970. [Google Scholar] [CrossRef] [PubMed] [Green Version]
- Michalczyk, M.M.; Maszczyk, A.; Stastny, P. The effects of low-energy moderate-carbohydrate (MCD) and mixed (MixD) diets on serum lipid profiles and body composition in middle-aged men: A randomized controlled parallel-group clinical trial. Int. J. Environ. Res. Public Health 2020, 17, 1332. [Google Scholar] [CrossRef] [PubMed] [Green Version]
- D’Abbondanza, M.; Ministrini, S.; Pucci, G.; Migliola, E.N.; Martorelli, E.E.; Gandolfo, V.; Siepi, D.; Lupattelli, G.; Vaudo, G. Very low-carbohydrate ketogenic diet for the treatment of severe obesity and associated non-alcoholic fatty liver disease: The role of sex differences. Nutrients 2020, 12, 2748. [Google Scholar] [CrossRef] [PubMed]
- Cockcroft, D.W.; Nair, P.J. Methacholine test and the diagnosis of asthma. Allergy Clin. Immunol. 1998, 130, 556. [Google Scholar] [CrossRef]
- Momeni, Z.; Dehghani, A.; Fallahzadeh, H.; Koohgardi, M.; Dafei, M.; Mohammadi, M. Effects of low-dose contraceptive pills on the risk factors of cardiovascular diseases among 15-35-year-old women: A retrospective cohort. Int. J. Reprod. Biomed. 2019, 17, 841–850. [Google Scholar] [CrossRef]
- Valsdottir, T.D.; Øvrebø, B.; Falck, T.M.; Litleskare, S.; Johansen, E.I.; Henriksen, C.; Jensen, J. Low-carbohydrate high-fat diet and exercise: Effect of a 10-week intervention on body composition and cvd risk factors in overweight and obese women—A randomized controlled trial. Nutrients 2021, 13, 110. [Google Scholar] [CrossRef]
- Paoli, A.; Rubini, A.; Volek, J.S.; Grimaldi, K.A. Beyond weight loss: A review of the therapeutic uses of very-low-carbohydrate (Ketogenic) Diets. Eur. J. Clin. Nutr. 2013, 67, 789–796. [Google Scholar] [CrossRef] [Green Version]
- Michalczyk, M.M.; Klonek, G.; Maszczyk, A.; Zajac, A. The effects of a low calorie ketogenic diet on glycaemic control variables in hyperinsulinemic overweight/obese females. Nutrients 2020, 12, 1854. [Google Scholar] [CrossRef] [PubMed]
- Feinman, R.D. The biochemistry of low-carbohydrate and ketogenic diets. Curr. Opin. Endocrinol. Diabetes Obes. 2020, 27, 261–268. [Google Scholar] [CrossRef] [PubMed]
- Watanabe, M.; Tuccinardi, D.; Ernesti, I.; Basciani, S.; Mariani, S.; Genco, A.; Manfrini, S.; Lubrano, C.; Gnessi, L. Scientific evidence underlying contraindications to the ketogenic diet: An update. Obes. Rev. 2020, 21, e13053. [Google Scholar] [CrossRef] [PubMed]
- Landry, M.J.; Crimarco, A.; Perelman, D.; Durand, L.R.; Petlura, C.; Aronica, L.; Robinson, J.L.; Kim, S.H.; Gardner, C.D. Adherence to ketogenic and mediterranean study diets in a crossover trial: The keto–med randomized trial. Nutrients 2021, 13, 967. [Google Scholar] [CrossRef] [PubMed]
- Correa, R.; Cardoso, P.M. Ketogenic diets in weight loss: A systematic review under physiological and biochemical aspects of nutrition. Rev. Chil. Nutr. 2019, 46, 606–613. [Google Scholar] [CrossRef] [Green Version]
- Chacón-Moscoso, S.; Sanduvete-Chaves, S.; Sánchez-Martín, M. The development of a checklist to enhance methodological quality in intervention programs. Front. Psychol. 2016, 7, 1811. [Google Scholar] [CrossRef] [PubMed]
- López-Espinoza, M.Á.; Lozano-Lozano, J.A.; Prieto-Merino, D. A Method to estimate the efficacy vs. effectiveness in meta-analysis of clinical trials with different adherence scenarios: A monte carlo simulation study in nutrition. Nutrients 2021, 13, 2352. [Google Scholar] [CrossRef]


| First Author, Year | Design | Study Population | Intervention | Control | Duration of Intervention | ITT |
|---|---|---|---|---|---|---|
| Moreno, 2016 [26] | An open, prospective, randomized, controlled nutritional intervention clinical trial. | Initial sample Intervention: 22 Control: 23 Mean age ± SD: Intervention: 44.6 ± 7.8 Control: 45.6 ± 9.6 Percentage of women Intervention: 77.3 Control: 95.7 Madrid, Spain | Very low-calorie ketogenic diet (VLCKD): Pronokal method. Three stages. Active stage: 600–800 kcal/day CHO: <50 g/day Protein: 0.80–1.2 g per kilo of ideal weight (only high biological value). In reeducation stage: ketone bodies were evaluated by a physician, and a low-calorie diet was begun, with a progressive incorporation of food. In maintenance: progression to a balanced diet plan. | Low-Calorie Diet (LCD) 10% of the total calories calculated per individual: 1440–1800 kcal/day. Lipids: 25–35% CHO: 45–55% Protein: 15–25% Fiber: 20–40 g/day | 24 months | Yes43% total dropout (not specified and cannot be deduced per group) |
| Moreno, 2014 [22] | An open, prospective, randomized, controlled nutritional intervention clinical trial. | Initial sample Intervention: 27 Control: 26 Mean age ± SD: Intervention: 44.4 ± 8.6 Control: 46.3 ± 9.3 Percentage of women: Intervention: 81.4 Control: 96.1 Madrid, Spain | VLCKD: Pronokal method. | LCD: 10% of the total calories calculated per individual | 12 months | Yes Dropout rate Intervention: 30.8% Control: 35.0% |
| Gutiérrez-Repiso, 2019 [27] | A single-blind, randomized, controlled nutritional intervention clinical trial. | Initial sample Intervention: 15 Control: 9 Mean age ± SD: Intervention: 48.67 ± 9.16 Control: 38.22 ± 11.27 Percentage of women: Intervention: 81.4 Control: 66.6 Málaga, Spain | VLCKD: Pronokal method, plus symbiotic supplements in the form of capsules (2 months) + LCD for 2 months + symbiotics. | Placebo | 4 months | Unclear Dropout rate Not reported and cannot be deduced |
| Westman, 2006 [28] | Two-armed randomized trial | Sample: Intervention: 59 Control: 60 Mean age ± SD: Intervention: 44.4 ± 10.1 Control: 45.6 ± 9.0 Percentage of women: Intervention: 75% Control: 78% North Carolina, USA | Low-carbohydrate, ketogenic diet (initially <20 g of carbohydrates/day) plus nutritional supplements | Low-fat, low-calorie diet | 6 months | Unclear Dropout rate: 0.84% total dropout (not specified and cannot be deduced per group) However, the authors consider the initial and final sample to be the same number of participants. |
| Tay, 2018 [30] | Two-armed randomized trial. | Initial sample Intervention: 58 Control: 57 Mean age ± SD: Intervention: 58 Control: 58 Percentage of women: Intervention: 64% Control: 54% Adelaide, Australia | Low-carbohydrate diet, high in unsaturated fats and low in saturated fats: CHO: 14% (<50 g/day) Protein: 28% Lipids: 58% (35% monounsaturated and 13% polyunsaturated fats) | CHO: 53% (processed foods are discouraged). Protein: 17% Lipids: 30% (15% monounsaturated and 9% polyunsaturated fats) | 24 months | Yes Dropout rate: Intervention: 13.8% Control: 15.8% |
| Veum, 2017 [24] | Two-armed randomized trial. | Initial sample Intervention: 18 Control: 20 Mean age ± SD: Intervention: 40.2 ± 4.5 Control: 40.3 ± 5.5 The study only considered men. Bergen, Norway | High-fat, low-carbohydrate diet: Lipids: 73% CHO: 10% | Low-fat, high-carbohydrate diet: Lipids: 30% CHO: 53% | 12 weeks (3 months) | Yes (per protocol principle was also reported) Dropout rate: 17.4% total dropout (not specified and cannot be deduced per group) |
| Tay, 2014 [31] | Two-armed parallel randomized trial. | Initial sample Intervention: 58 Control: 57 Mean age ± SD: Intervention: 58 ± 7 Control: 58 ± 7 Percentage of women: Intervention: 36.2% Control: 49.1% Adelaide, Australia | Low-carbohydrate diet, high in unsaturated fats and low in saturated fats: CHO: 14% (<50 g/day) Protein: 28% Lipids: 58% (35% monounsaturated and 13% polyunsaturated fats) | CHO: 53% (processed foods are discouraged). Protein: 17% Lipids: 30% (15% monounsaturated and 9% polyunsaturated fats) Saturated fatty acids were restricted to 10% in both groups. | 24 weeks (6 months) | Unclear Dropout rate: Intervention: 21% Control: 18% |
| Haufe, 2011 [32] | Two-armed randomized trial. | Initial sample Intervention: 84 Control: 86 Mean age: Intervention: 43.2 Control: 45.1 Percentage of women: Intervention: 84.6% Control: 80.0% Germany | 1200 cal/day diet CHO: 90 g/day Protein: 0.80 g-Kg/day Lipids: >30% | Control diet: Protein: 0.80 g-Kg/day Lipids: 20% | 6 months | Yes Dropout rate: Intervention: 38.1% Control: 41.8% |
| Iqbal, 2010 [23] | Randomized controlled trial | Initial sample Intervention: 70 Control: 74 Mean age: Intervention: 60.0 ± 8.9 Control: 60.0 ± 9.5 Percentage of women: Intervention: 15.7% Control: 5.4% Philadelphia, USA | Low-carbohydrate (high-fat) diet: CHO: <30 g/day Subjects were advised to consume whole and high fiber content foods. Fat intake was not restricted (subjects were advised to consume healthy sources of fat). | Low-fat control diet, <30% of calories/day. Subjects were encouraged to consume healthy fats: <7% of total calories from saturated fat, <300 mg of cholesterol, and to increase intake of fruits and vegetables. | 24 months | Yes Dropout rate: Intervention: 60.0% Control: 46.0% |
| Yancy, 2004 [29] | Two-armed randomized trial | Initial sample Intervention: 60 Control: 60 Mean age: Intervention: 45.6 ± 9.0 Control: 44.2 ± 10.0 Percentage of women: Intervention: 78% Control: 75% North Carolina, USA | Low-carbohydrate diet CHO: <20 g/day (in the beginning) + nutritional supplements + exercise recommendation + group meetings (4 times/month in the beginning and then monthly for three months) | Low-fat diet: Lipids: <30% of energy from fat, <300 mg cholesterol/day, and deficit of 500 to 1000 cal/day + recommendation of exercise + group meetings (4 times/month in the beginning and then monthly for three months). | 24 weeks | Unclear Dropout rate: Intervention: 24.0% Control: 43.0% |
| First Author, Year | BMI | COL-T | HDL | LDL | TG | Side Effects |
|---|---|---|---|---|---|---|
| Gutiérrez-Repiso, 2019 [27] | Proteobacteria and BMI reduction: β = 0.362; p < 0.038 | --- | -- | -- | -- | Not reported |
| Haufe, 2011 [32] | I(post-pre): −2.7 ± 0.2 | I(post-pre): −0.08 ± 0.09 | I(post-pre): −0.09 ± 0.1 | I(post-pre): −0.04 ± 0.07 | I(post-pre): −0.19 ± 0.06 | Not reported |
| C(post-pre): −2.4 ± 0.2 | C(post-pre): −0.45 ± 0.11 | C(post-pre): −0.1 ± 0.07 | C(post-pre): −0.33 ± 0.08 | C(post-pre): −0.14 ± 0.08 | ||
| Westman, 2006 [28] | -- | I(post-pre): −0.21 | I(post-pre): 0.14 | I(post-pre): 0.04 | I(post-pre): −0.84 | Not reported |
| C(post-pre): −0.35 | C(post-pre): −0.04 | C(post-pre): −0.19 | C(post-pre): −0.32 | |||
| Moreno, 2014 [22] | 54 weeks I(post-pre): −7.0 ± 3.9 C(post-pre): −2.6 ± 2.2 | 54 weeks | 54 weeks | 54 weeks | 54 weeks | Statistically significant symptoms: After 2 weeks: asthenia, headache, muscle weakness, constipation, hyperuricemia, nausea, heaviness, and fatigue in the legs. At 4 months: Hair loss, constipation. At 12 months: Constipation. |
| I1: 5.36 ± 0.99 | I1: 1.57 ± 0.47 | I1: 3.08 ± 0.93 | I1: 1.56 ± 1.01 | |||
| I2: 4.99 ± 1.18 | I2: 1.77 ± 0.39 | I2: 2.72 ± 0.87 | I2: 1.01 ± 1.13 | |||
| C1: 4.81 ± 0.99 | C1: 1.38 ± 0.33 | C1: 2.92 ± 0.75 | C1: 1.09 ± 0.40 | |||
| C2: 4.76 ± 1.01 | C2: 1.44 ± 0.37 | C2: 2.87 ± 0.67 | C2: 0.99 ± 0.51 | |||
| 8 weeks | 8 weeks | 8 weeks | 8 weeks | |||
| I1: 5.36 ± 0.99 | I1: 1.57 ± 0.47 | I1: 3.08 ± 0.93 | I1: 1.56 ± 1.01 | |||
| I2: 4.1 ± 0.76 | I2: 1.24 ± 0.27 | I2: 2.41 ± 0.62 | I2: 1.01 ± 0.40 | |||
| C1: 4.81 ± 0.99 | C1: 1.38 ± 0.33 | C1: 2.92 ± 0.75 | C1: 1.09 ± 0.40 | |||
| C2: 4.56 ± 0.76 | C2: 1.23 ± 0.35 | C2: 2.80 ± 0.78 | C2: 1.16 ± 0.44 | |||
| 16 weeks | 16 weeks | 16 weeks | 16 weeks | |||
| I1: 5.36 ± 0.99 | I1: 1.57 ± 0.47 | I1: 3.08 ± 0.93 | I1: 1.56 ± 1.01 | |||
| I2: 4.55 ± 0.77 | I2: 1.39 ± 0.33 | I2: 2.77 ± 0.63 | I2: 0.87 ± 0.26 | |||
| C1: 4.81 ± 0.99 | C1: 1.38 ± 0.33 | C1: 2.92 ± 0.75 | C1: 1.09 ± 0.40 | |||
| C2: 4.63 ± 1.00 | C2: 1.28 ± 0.35 | C2: 2.84 ± 0.87 | C2: 1.14 ± 0.47 | |||
| Moreno, 2016 [26] | I: −4.4 C: −1.9 | -- | -- | -- | -- | Asthenia, fatigue, headaches, constipation, and nausea. |
| Iqbal, 2010 [23] | -- | 96 weeks | 96 weeks | 96 weeks | 96 weeks | Two deaths in the intervention group and three deaths in the control group. |
| I(post-pre): −0.31 ± 0.18 | I(post-pre): 0.02 ± 0.03 | I(post-pre): −0.2 1 ± 0.16 | I(post-pre): −0.29 ± 0.14 | |||
| C(post-pre): | C(post-pre): | C(post-pre): | C(post-pre): | |||
| −0.34 ± 0.16 | 0.02 ± 0.03 | −0.16 ± 0.14 | −0.15 ± 0.14 | |||
| 54 weeks | 54 weeks | 54 weeks | 54 weeks | |||
| I(post-pre): −0.02 ± 0.19 | I(post-pre): 0.07 ± 0.03 | I(post-pre): −0.12 ± 0.16 | I(post-pre): −0.14 ± 0.16 | |||
| C(post-pre): | C(post-pre): | C(post-pre): | C(post-pre): | |||
| −0. 21 ± 0.19 | 0.03 ± 0.03 | −0.21 ± 0.15 | −0.15 ± 0.15 | |||
| 24 weeks | 24 weeks | 24 weeks | 24 weeks | |||
| I(post-pre): 0.03 ± 0.14 | I(post-pre): 0.01 ± 0.04 | I(post-pre): 0.02 ± 0.13 | I(post-pre): −0.01 ± 0.11 | |||
| C(post-pre): | C(post-pre): | C(post-pre): | C(post-pre): | |||
| −0.02 ± 0.15 | 0.07 ± 0.04 | −0.05 ± 0.13 | −0.1 ± 0.11 | |||
| Tay, 2014 [31] | I(post-pre): −4.0 ± 2.0 | I(post-pre): −0.3 ± 0.7 | I(post-pre): 0.03 ± 0.2 | I(post-pre): −0.3 ± 0.5 | I(post-pre): −0.5 ± 0.5 | Intervention group: Constipation and diverticulitis; prostate cancer. |
| C(post-pre): −4.0 ± 1.8 | C(post-pre): −0.3 ± 0.9 | C(post-pre): −0.06 ± 0.2 | C(post-pre): −0.3 ± 0.7 | C(post-pre): −0.1 ± 0.5 | Control group: Esophageal ulcer. | |
| Tay, 2018 [30] | I(post-pre): | I(post-pre): | I(post-pre): | I(post-pre): | I(post-pre): | Not reported. |
| −2.1 (−2.8; −1.5) ** | 0.2 (−0.1; 0.6) ** | 0.02 (−0.05; 0.1) | 0.2 (−0.1; 0.5) | −0.1 (−0.3; 0.2) | ||
| C(post-pre): | C(post-pre): | C(post-pre): | C(post-pre): | C(post-pre): | ||
| −2.3 (−3.0; −1.6) ** | 0.1 (−0.3 to 0.4) ** | −0.1 (−0.1; 0.01) ** | 0.1 (−0.2; 0.4) ** | 0.1 (−0.2; 0.3) ** | ||
| Veum, 2017 [24] | I(post-pre)–C(post-pre): −3.6 (−4.04; −3.18) ** | I(post-pre): | I(post-pre): | I(post-pre): | I(post-pre): | Not reported. |
| −0.13 (−0.29; 0.55) | 0.14 (0.06; 0.22) | 0.26 (−0.08; 0.60) | −0.53 (−0.68; −0.37) | |||
| C(post-pre): | C(post-pre): | C(post-pre): | C(post-pre): | |||
| −0.96 (−1.23; −0.69) ** | −0.01 (−0.10; 0.07) ** | −0.78 (−1.08; −0.49) ** | −0.41 (−0.60; −0.21) ** | |||
| 8 weeks | 8 weeks | 8 weeks | 8 weeks | |||
| I1: 5.35 ± 1.17 | I1: 1.05 ± 0.3 | I1: 3.65 ± 1.14 | I1: 1.52 ± 0.6 | |||
| I2: 5.78 ± 1.22 | I2: 1.13 ± 0.27 | I2: 4.19 ± 1.18 | I2: 1.26 ± 0.57 | |||
| C1: 5.42 ± 1.14 | C1: 1.23 ± 0.24 | C1: 3.68 ± 1.07 | C1: 1.45 ± 0.53 | |||
| C2: 4.64 ± 0.95 | C2: 1.23 ± 0.27 | C2: 2.98 ± 0.89 | C2: 1.12 ± 0.37 | |||
| 4 weeks | 4 weeks | 4 weeks | 4 weeks | |||
| I1: 5.35 ± 1.17 | I1: 1.05 ± 0.3 | I1: 3.65 ± 1.14 | I1: 1.52 ± 0.6 | |||
| I2: 5.56 ± 1.23 | I2: 1.1 ± 0.21 | I2: 3.99 ± 1.15 | I2: 1.22 ± 0.48 | |||
| C1: 5.42 ± 1.14 | C1: 1.23 ± 0.00.24 | C1: 3.68 ± 1.07 | C1: 1.45 ± 0.53 | |||
| C2: 4.6 ± 0.94 | C2: 1.23 ± 0.29 | C2: 2.99 ± 0.86 | C2: 1.18 ± 0.54 | |||
| Yancy, 2004 [29] | -- | I(post-pre): | I(post-pre): | I(post-pre): | I(post-pre): | Intervention group: |
| −0.21 | 0.14 | 0.04 | −0.84 | Constipation, headache, halitosis, muscle cramps, diarrhea, general weakness, and skin rash. | ||
| C(post-pre): | C(post-pre): | C(post-pre): | C(post-pre): | Control group: | ||
| −0.35 | −0.04 | −0.19 | −0.31 | One patient developed heart disease. |
| Outcome | Number of Studies | Tau 2 | Prediction Intervals |
|---|---|---|---|
| BMI | 3 | 0.9487 | −14.360; 13.446 |
| Col-T | 8 | 1.4040 | −2.854; 3.314 |
| HDL | 8 | 0.8756 | −2.466; 2.401 |
| LDL | 8 | 1.1399 | −2.251; 3.307 |
| TG | 8 | 0.3735 | −1.882; 1.316 |
Publisher’s Note: MDPI stays neutral with regard to jurisdictional claims in published maps and institutional affiliations. |
© 2021 by the authors. Licensee MDPI, Basel, Switzerland. This article is an open access article distributed under the terms and conditions of the Creative Commons Attribution (CC BY) license (https://creativecommons.org/licenses/by/4.0/).
Share and Cite
López-Espinoza, M.Á.; Chacón-Moscoso, S.; Sanduvete-Chaves, S.; Ortega-Maureira, M.J.; Barrientos-Bravo, T. Effect of a Ketogenic Diet on the Nutritional Parameters of Obese Patients: A Systematic Review and Meta-Analysis. Nutrients 2021, 13, 2946. https://doi.org/10.3390/nu13092946
López-Espinoza MÁ, Chacón-Moscoso S, Sanduvete-Chaves S, Ortega-Maureira MJ, Barrientos-Bravo T. Effect of a Ketogenic Diet on the Nutritional Parameters of Obese Patients: A Systematic Review and Meta-Analysis. Nutrients. 2021; 13(9):2946. https://doi.org/10.3390/nu13092946
Chicago/Turabian StyleLópez-Espinoza, Miguel Ángel, Salvador Chacón-Moscoso, Susana Sanduvete-Chaves, María José Ortega-Maureira, and Tamara Barrientos-Bravo. 2021. "Effect of a Ketogenic Diet on the Nutritional Parameters of Obese Patients: A Systematic Review and Meta-Analysis" Nutrients 13, no. 9: 2946. https://doi.org/10.3390/nu13092946
APA StyleLópez-Espinoza, M. Á., Chacón-Moscoso, S., Sanduvete-Chaves, S., Ortega-Maureira, M. J., & Barrientos-Bravo, T. (2021). Effect of a Ketogenic Diet on the Nutritional Parameters of Obese Patients: A Systematic Review and Meta-Analysis. Nutrients, 13(9), 2946. https://doi.org/10.3390/nu13092946