The Effect of Low-Fat and Low-Carbohydrate Diets on Weight Loss and Lipid Levels: A Systematic Review and Meta-Analysis


Abstract
1. Introduction
2. Materials and Methods
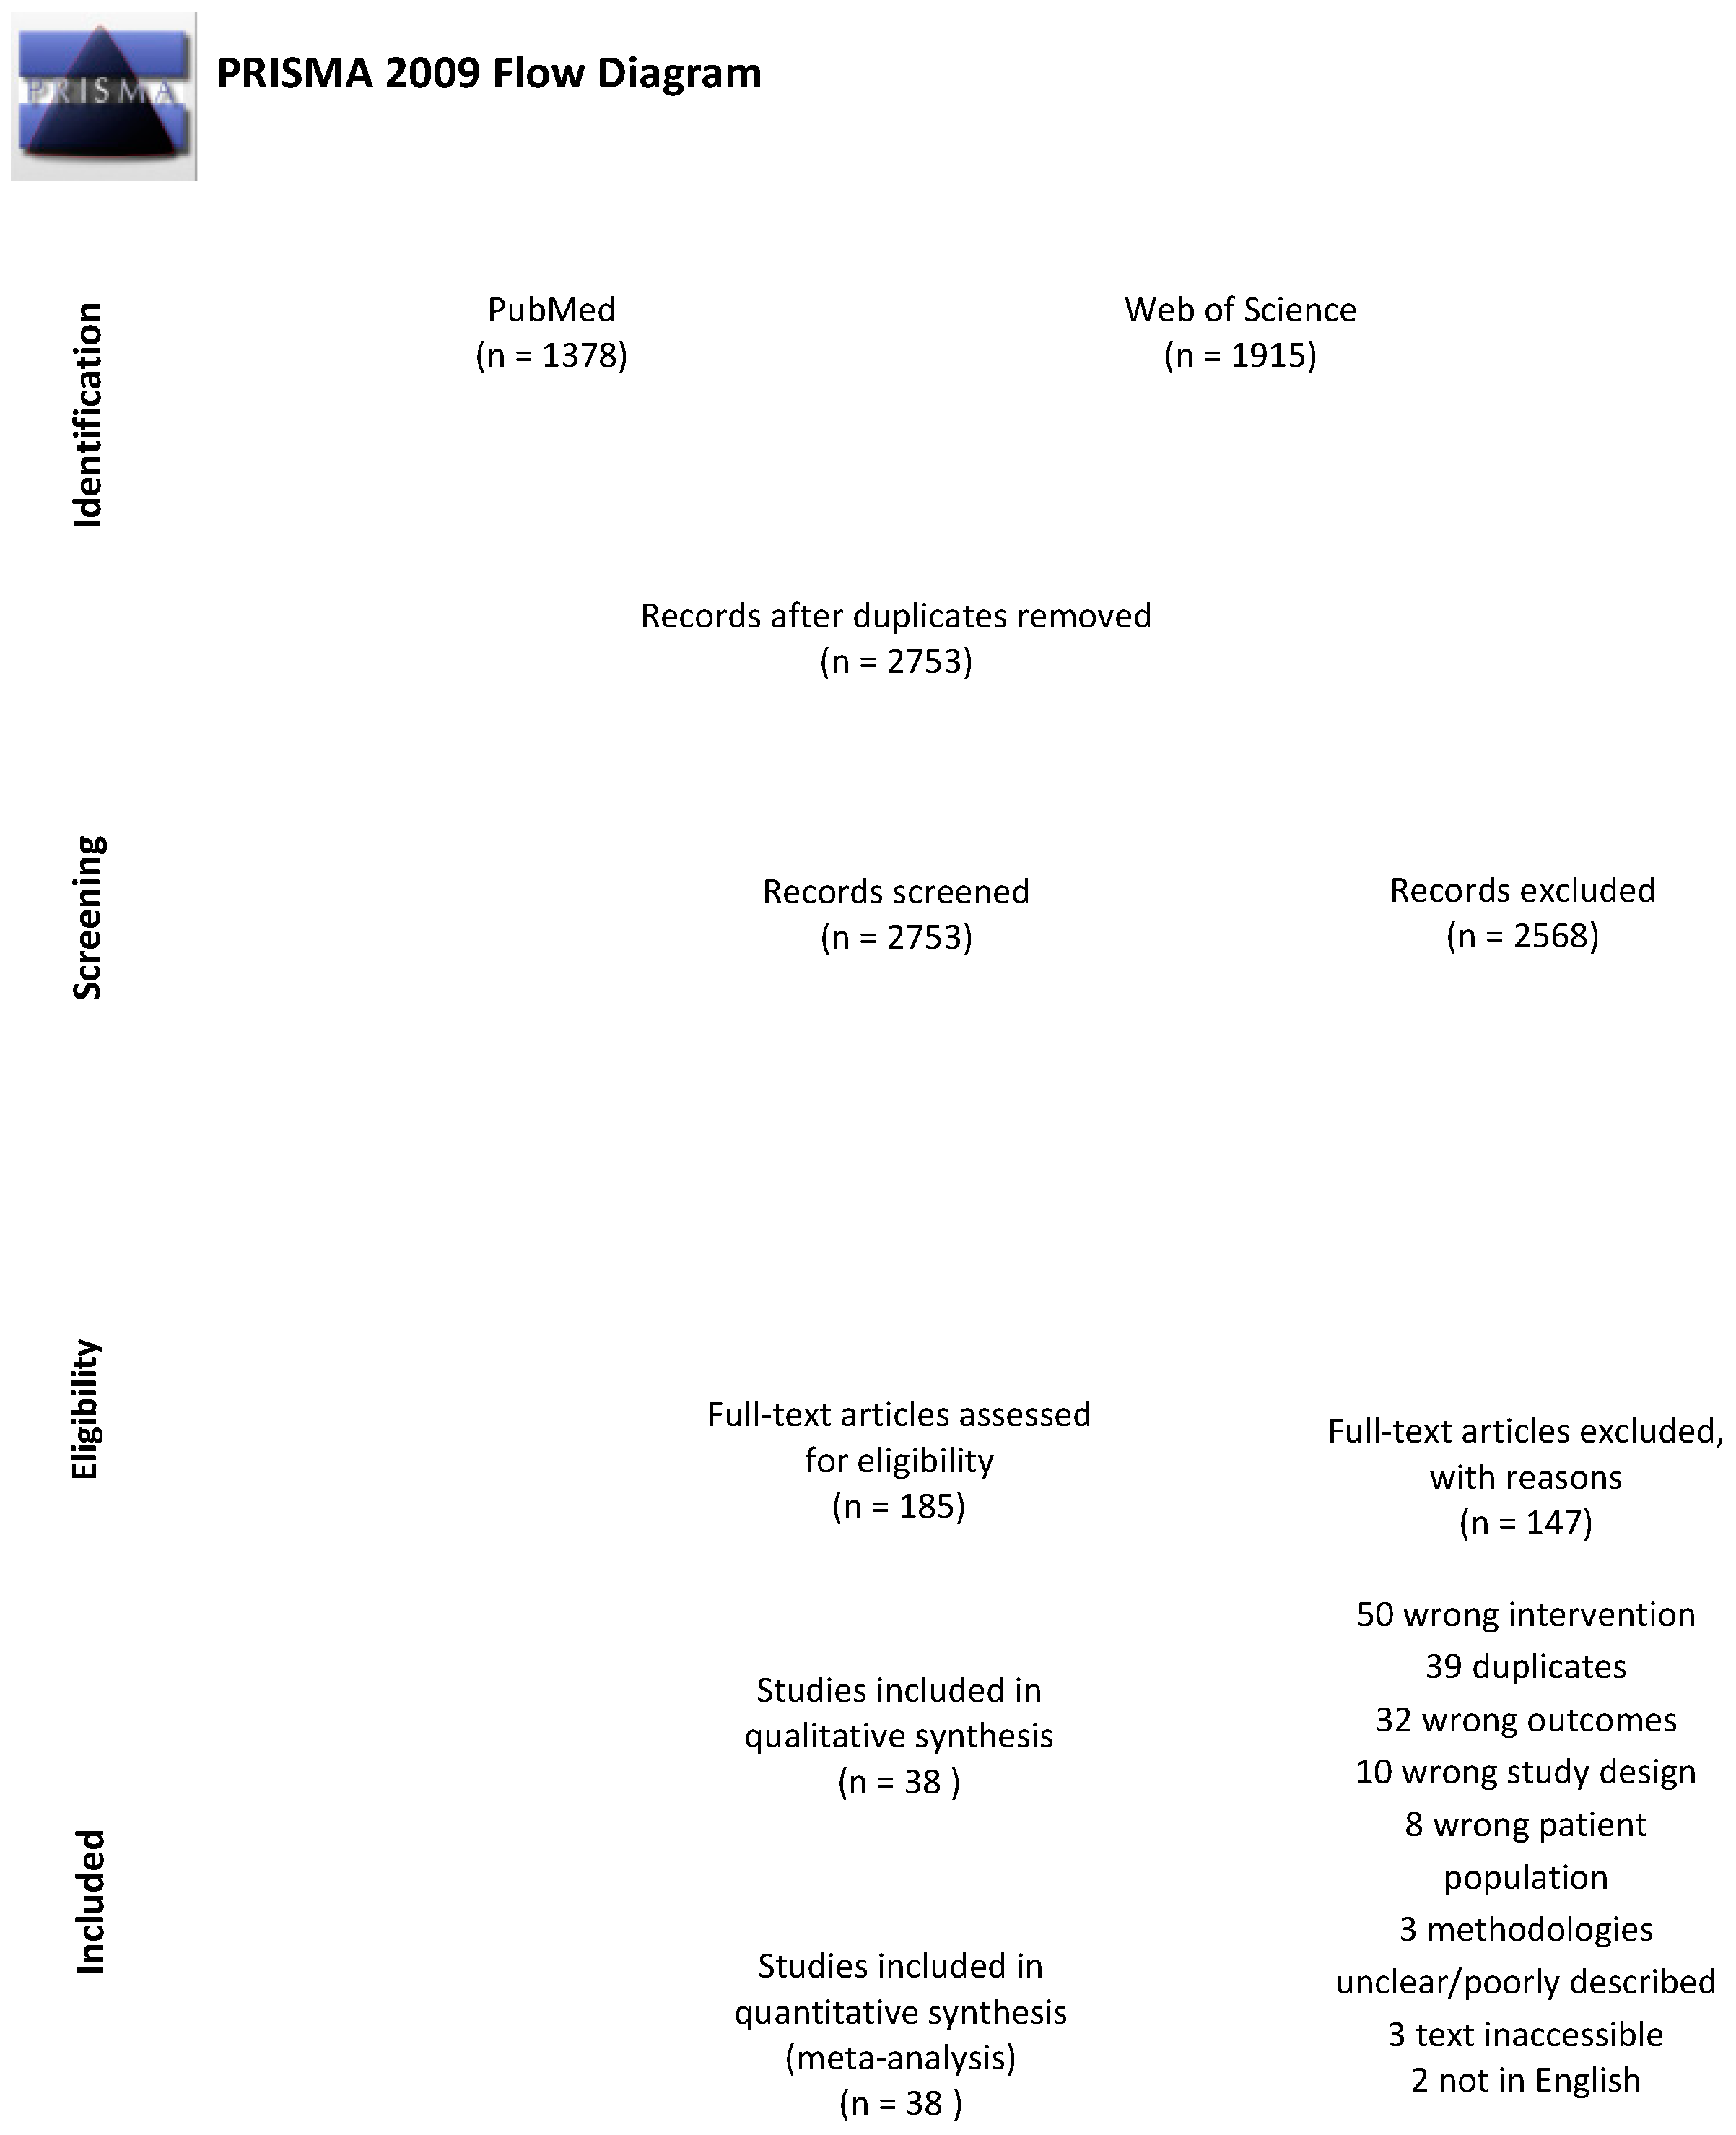
2.1. Search Strategy
2.2. Study Selection, Inclusion and Exclusion Criteria
2.3. Data Extraction
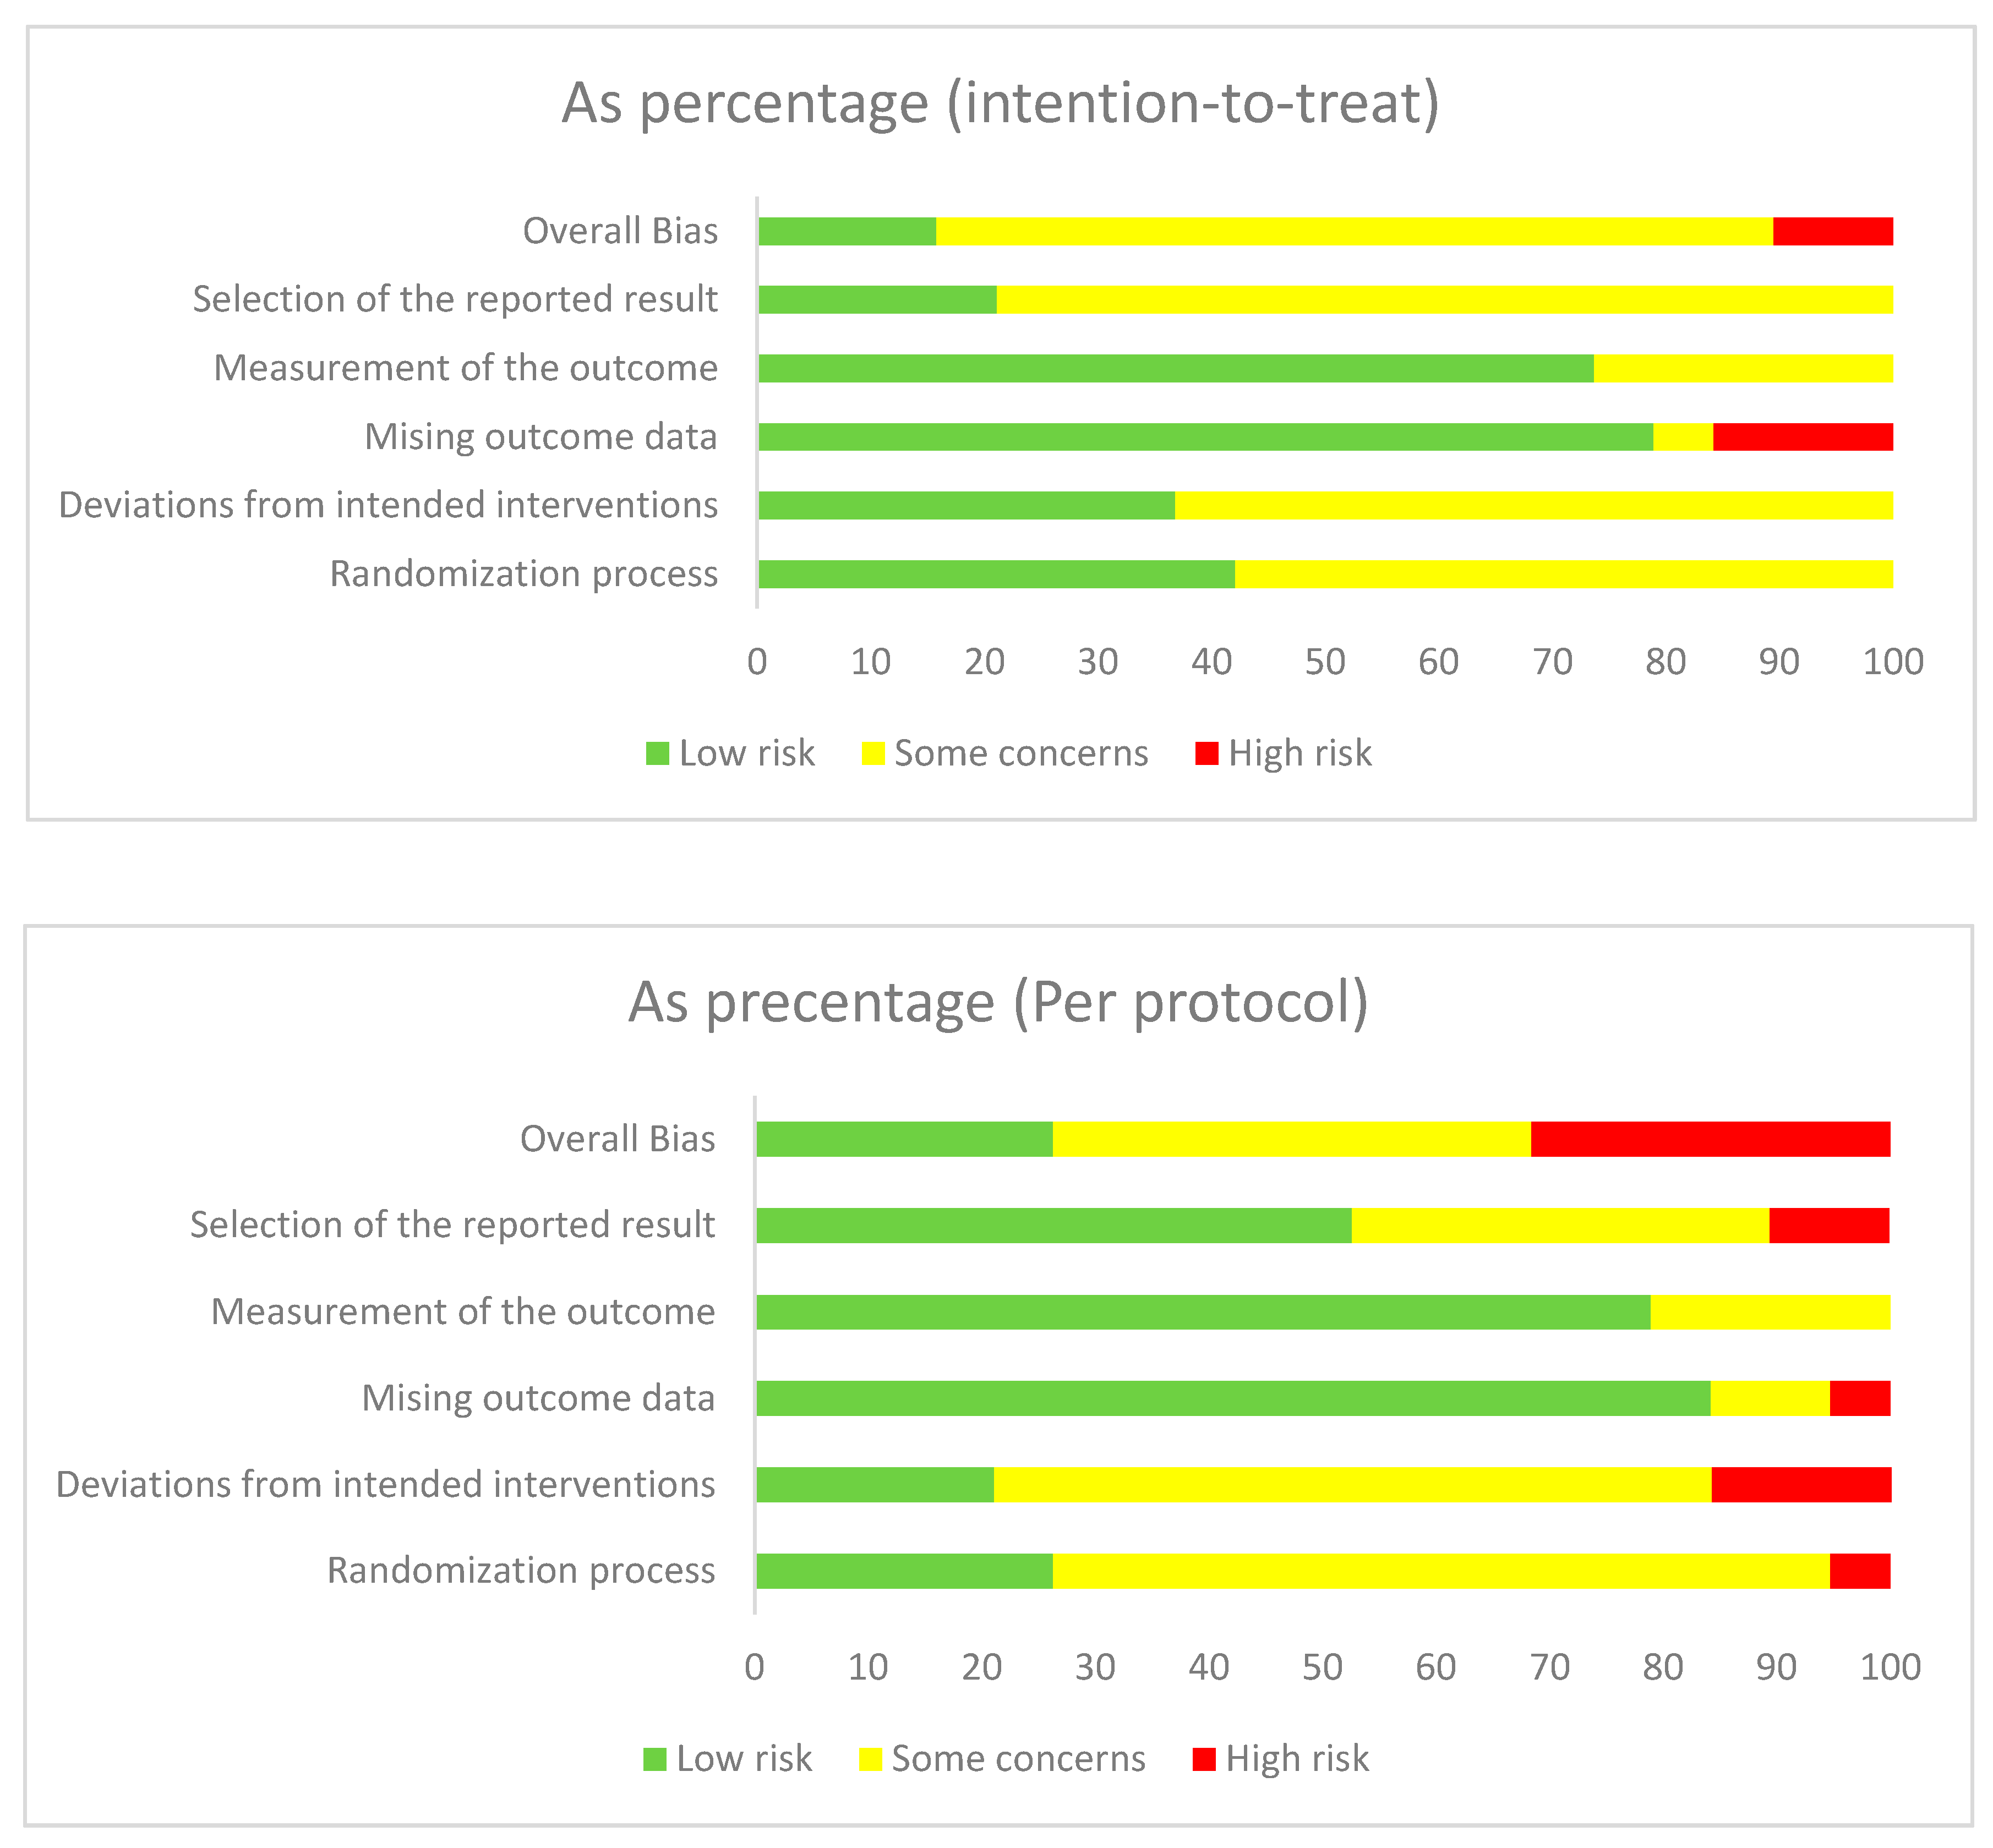
2.4. Risk of Bias Assessment
2.5. Data Analysis
3. Results
3.1. Characteristics of Included Trials
3.2. Weight Loss (kg)
3.3. Lipids
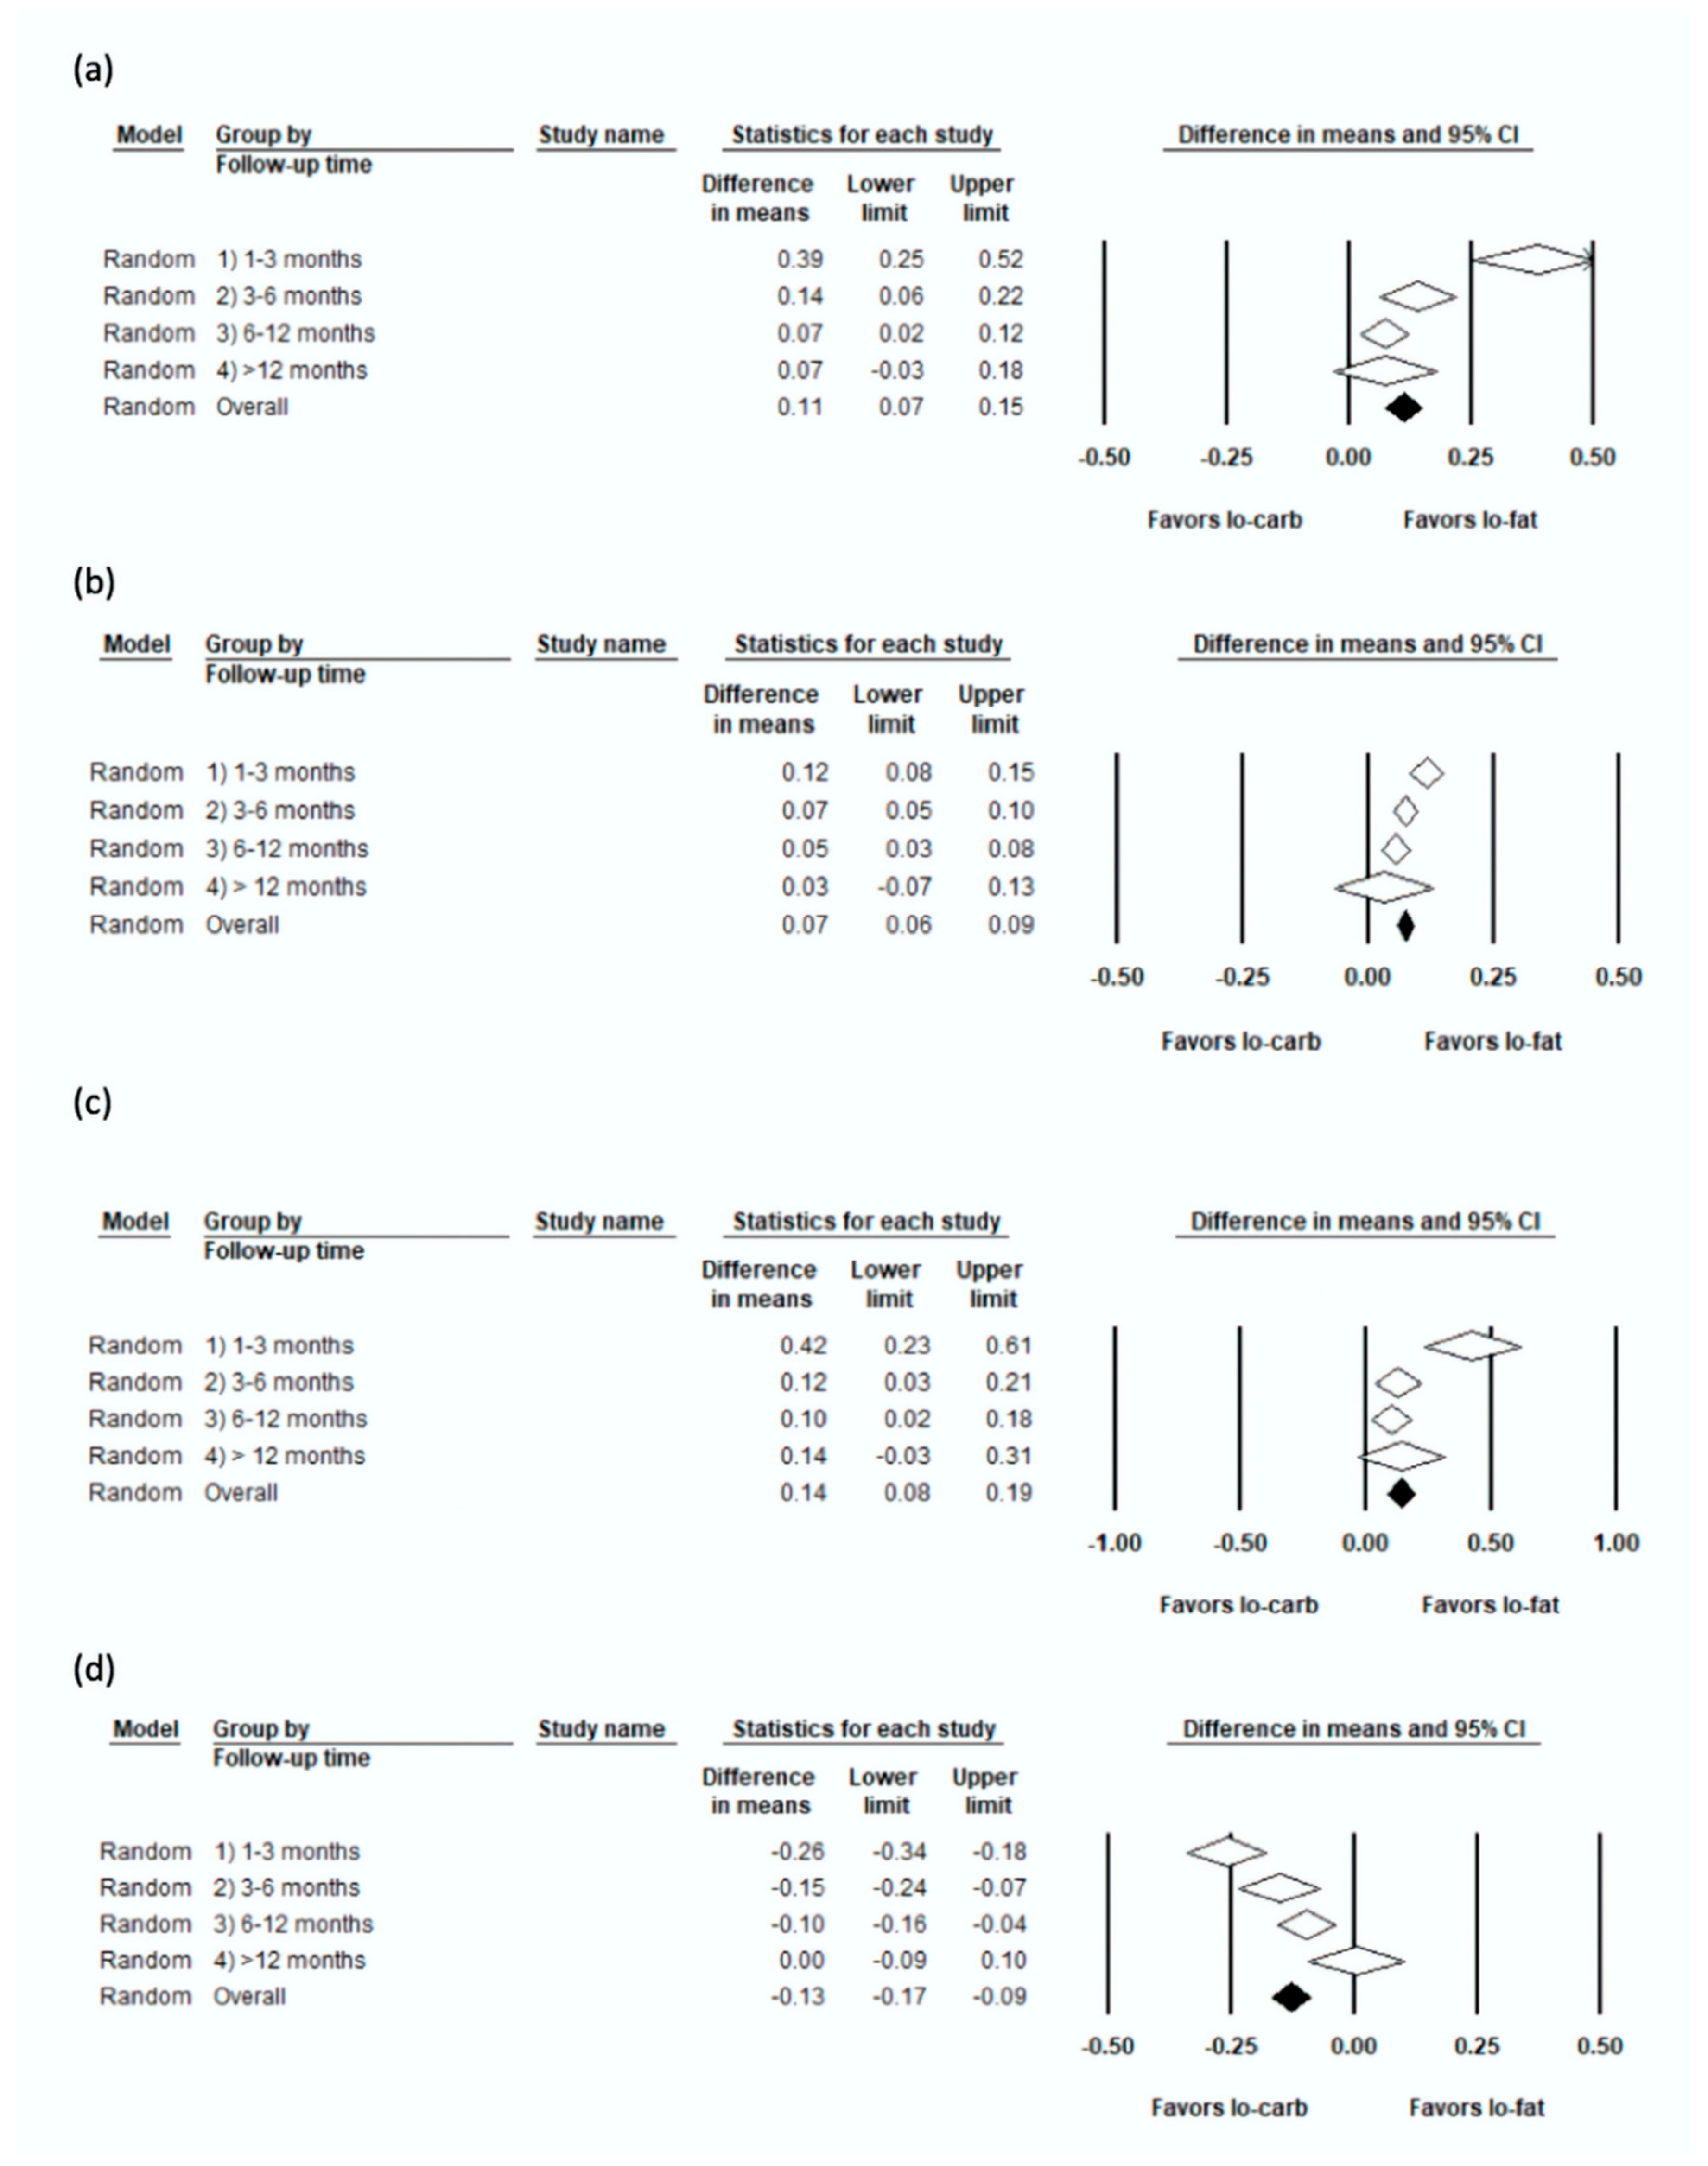
3.4. LDL (mmol/L)
3.5. HDL (mmol/L)
3.6. TC (mmol/L)
3.7. TG (mmol/L)
3.8. Risk of Bias and Publication Bias
4. Discussion
4.1. Quality of Evidence Used
4.2. Strengths and Limitations
5. Conclusions
Supplementary Materials
Author Contributions
Funding
Acknowledgments
Conflicts of Interest
References
- Pi-Sunyer, X. The Medical Risks of Obesity. Postgrad. Med. 2009, 121, 21–33. [Google Scholar] [CrossRef]
- Riaz, H.; Khan, M.S.; Siddiqi, T.J.; Usman, M.S.; Shah, N.; Goyal, A.; Khan, S.S.; Mookadam, F.; Krasuski, R.A.; Ahmed, H. Association Between Obesity and Cardiovascular Outcomes: A Systematic Review and Meta-analysis of Mendelian Randomization Studies. JAMA Netw. Open 2018, 1, e183788. [Google Scholar] [CrossRef]
- Poirier, P.; Giles, T.D.; Bray, G.A.; Hong, Y.; Stern, J.S.; Pi-Sunyer, F.X.; Eckel, R.H. Obesity and Cardiovascular Disease: Pathophysiology, Evaluation, and Effect of Weight Loss. Arterioscler. Thromb. Vasc. Biol. 2006, 26, 968–976. [Google Scholar] [CrossRef] [PubMed]
- Organisation, W.H. Obesity and Overweight. Available online: https://www.who.int/news-room/fact-sheets/detail/obesity-and-overweight (accessed on 16 June 2020).
- Saeedi, P.; Petersohn, I.; Salpea, P.; Malanda, B.; Karuranga, S.; Unwin, N.; Colagiuri, S.; Guariguata, L.; Motala, A.A.; Ogurtsova, K.; et al. Global and regional diabetes prevalence estimates for 2019 and projections for 2030 and 2045: Results from the International Diabetes Federation Diabetes Atlas, 9th edition. Diabetes Res. Clin. Pract. 2019, 157, 107843. [Google Scholar] [CrossRef] [PubMed]
- Huang, P.L. A comprehensive definition for metabolic syndrome. Dis. Model. Mech. 2009, 2, 231–237. [Google Scholar] [CrossRef] [PubMed]
- Sacks, F.M.; Bray, G.A.; Carey, V.J.; Smith, S.R.; Ryan, D.H.; Anton, S.D.; McManus, K.; Champagne, C.M.; Bishop, L.M.; Laranjo, N.; et al. Comparison of weight-loss diets with different compositions of fat, protein, and carbohydrates. N. Engl. J. Med. 2009, 360, 859–873. [Google Scholar] [CrossRef] [PubMed]
- Van Horn, L.; Carson, J.A.; Appel, L.; Burke, L.; Economos, C.; Karmally, W.; Lancaster, K.; Lichtenstein, A.; Johnson, R.; Thomas, R.; et al. Recommended Dietary Pattern to Achieve Adherence to the American Heart Association/American College of Cardiology (AHA/ACC) Guidelines: A Scientific Statement From the American Heart Association. Circulation 2016, 134, e505–e529. [Google Scholar] [CrossRef]
- National Institute for Health and Care Excellence. Obesity: Maintaining a Healthy Weight and Preventing Excess Weight Gain; National Institute for Health and Care Excellence: London, UK, 2015. [Google Scholar]
- National Institute for Health and Care Excellence. Myocardial Infarction: Cardiac Rehabilitation and Prevention of Further Cardiovascular Disease; National Institute for Health and Care Excellence: London, UK, 2013. [Google Scholar]
- Jenkins, D.J.A.; Wong, J.M.W.; Kendall, C.W.C.; Esfahani, A.; Ng, V.W.Y.; Leong, T.C.K.; Faulkner, D.A.; Vidgen, E.; Paul, G.; Mukherjea, R.; et al. Effect of a 6-month vegan low-carbohydrate (‘Eco-Atkins’) diet on cardiovascular risk factors and body weight in hyperlipidaemic adults: A randomised controlled trial. BMJ Open 2014, 4, 3505. [Google Scholar] [CrossRef]
- Dietary Goals for the United States/Prepared by the Staff of the Select Committee on Nutrition and Human Needs; United States Senate: Washington, DC, USA, 1977.
- Lichtenstein, A.H.; Appel, L.J.; Brands, M.; Carnethon, M.; Daniels, S.; Franch, H.A.; Franklin, B.; Kris-Etherton, P.; Harris, W.S.; Howard, B.; et al. Diet and lifestyle recommendations revision 2006: A scientific statement from the American Heart Association Nutrition Committee. Circulation 2006, 114, 82–96. [Google Scholar] [CrossRef]
- Centers for Disease Control and Prevention. Prevalence of Overweight, Obesity, and Extreme Obesity among Adults: United States, 1960–1962 through 2011–2012; Centers for Disease Control and Prevention: Atlanta, GA, USA, 2014.
- Katz, D.L.; Meller, S. Can we say what diet is best for health? Annu. Rev. Public Health 2014, 35, 83–103. [Google Scholar] [CrossRef]
- Diabetes UK. Position Statement: Low-Carb Diets for People with Diabetes; Diabetes UK: London, UK, 2017. [Google Scholar]
- Heart, U.K. HEART UK’s Very Low Fat Eating Plan. Available online: https://www.heartuk.org.uk/very-low-fat-diet/introduction (accessed on 29 September 2019).
- Nordmann, A.J.; Nordmann, A.; Briel, M.; Keller, U.; Yancy, W.S.; Brehm, B.J.; Bucher, H.C. Effects of Low-Carbohydrate vs Low-Fat Diets on Weight Loss and Cardiovascular Risk Factors: A Meta-analysis of Randomized Controlled Trials. Arch. Intern. Med. 2006, 166, 285–293. [Google Scholar] [CrossRef] [PubMed]
- Lichtenstein, A.H.; Van Horn, L. Very Low Fat Diets. Circulation 1998, 98, 935–939. [Google Scholar] [CrossRef] [PubMed]
- Mirrahimi, A.; Chiavaroli, L.; Srichaikul, K.; Augustin, L.S.A.; Sievenpiper, J.L.; Kendall, C.W.C.; Jenkins, D.J.A. The role of glycemic index and glycemic load in cardiovascular disease and its risk factors: A review of the recent literature. Curr. Atheroscler. Rep. 2014, 16, 381. [Google Scholar] [CrossRef] [PubMed]
- Higgins, P.T.J.; Altman, G.D.; Gøtzsche, P.C.; Jüni, P.; Moher, D.; Oxman, D.A.; Savović, J.; Schulz, K.F.; Weeks, L.; Sterne, J.A.C. The Cochrane Collaboration’s tool for assessing risk of bias in randomised trials. BMJ 2011, 343, d5928. [Google Scholar] [CrossRef] [PubMed]
- Begg, C.B.; Mazumdar, M. Operating characteristics of a rank correlation test for publication bias. Biometrics 1994, 50, 1088–1101. [Google Scholar] [CrossRef]
- Egger, M.; Smith, G.D.; Schneider, M.; Minder, C. Bias in meta-analysis detected by a simple, graphical test. BMJ 1997, 315, 629. [Google Scholar] [CrossRef]
- Foster, G.D.; Wyatt, H.R.; Hill, J.O.; McGuckin, B.G.; Brill, C.; Mohammed, B.S.; Szapary, P.O.; Rader, D.J.; Edman, J.S.; Klein, S. A randomized trial of a low-carbohydrate diet for obesity. N. Engl. J. Med. 2003, 348, 2082–2090. [Google Scholar] [CrossRef]
- Halyburton, A.K.; Brinkworth, G.D.; Wilson, C.J.; Noakes, M.; Buckley, J.D.; Keogh, J.B.; Clifton, P.M. Low- and high-carbohydrate weight-loss diets have similar effects on mood but not cognitive performance. Am. J. Clin. Nutr. 2007, 86, 580–587. [Google Scholar] [CrossRef]
- Kirk, E.; Reeds, D.N.; Finck, B.N.; Mayurranjan, M.S.; Patterson, B.W.; Klein, S. Dietary Fat and Carbohydrates Differentially Alter Insulin Sensitivity During Caloric Restriction. Gastroenterology 2009, 136, 1552–1560. [Google Scholar] [CrossRef]
- Ruth, M.R.; Port, A.M.; Shah, M.; Bourland, A.C.; Istfan, N.W.; Nelson, K.P.; Gokce, N.; Apovian, C.M. Consuming a hypocaloric high fat low carbohydrate diet for 12 weeks lowers C-reactive protein, and raises serum adiponectin and high density lipoprotein-cholesterol in obese subjects. Metabolism 2013, 62, 1779–1787. [Google Scholar] [CrossRef]
- DerSimonian, R.; Laird, N. Meta-analysis in clinical trials. Control. Clin. Trials 1986, 7, 177–188. [Google Scholar] [CrossRef]
- De Luis, D.A.; Izaola, O.; Aller, R.; de la Fuente, B.; Bachiller, R.; Romero, E. Effects of a high-protein/low carbohydrate versus a standard hypocaloric diet on adipocytokine levels and insulin resistance in obese patients along 9months. J. Diabetes Complicat. 2015, 29, 950–954. [Google Scholar] [CrossRef] [PubMed]
- Bazzano, L.A.; Hu, T.; Reynolds, K.; Yao, L.; Bunol, C.; Liu, Y.; Chen, C.-S.; Klag, M.J.; Whelton, P.K.; He, J. Effects of low-carbohydrate and low-fat diets: A randomized trial. Ann. Intern. Med. 2014, 161, 309–318. [Google Scholar] [CrossRef] [PubMed]
- Bradley, U.; Spence, M.; Courtney, C.H.; McKinley, M.C.; Ennis, C.N.; McCance, D.R.; McEneny, J.; Bell, P.M.; Young, I.S.; Hunter, S.J. Low-fat versus low-carbohydrate weight reduction diets: Effects on weight loss, insulin resistance, and cardiovascular risk: A randomized control trial. Diabetes 2009, 58, 2741–2748. [Google Scholar] [CrossRef] [PubMed]
- Brehm, B.J.; Seeley, R.J.; Daniels, S.R.; D’Alessio, D.A. A Randomized Trial Comparing a Very Low Carbohydrate Diet and a Calorie-Restricted Low Fat Diet on Body Weight and Cardiovascular Risk Factors in Healthy Women. J. Clin. Endocrinol. Metab. 2003, 88, 1617–1623. [Google Scholar] [CrossRef]
- Brehm, B.J.; Spang, S.E.; Lattin, B.L.; Seeley, R.J.; Daniels, S.R.; D’Alessio, D.A. The Role of Energy Expenditure in the Differential Weight Loss in Obese Women on Low-Fat and Low-Carbohydrate Diets. J. Clin. Endocrinol. Metab. 2005, 90, 1475–1482. [Google Scholar] [CrossRef] [PubMed]
- Brinkworth, G.D.; Noakes, M.; Buckley, J.D.; Keogh, J.B.; Clifton, P.M. Long-term effects of a very-low-carbohydrate weight loss diet compared with an isocaloric low-fat diet after 12 mo. Am. J. Clin. Nutr. 2009, 90, 23–32. [Google Scholar] [CrossRef]
- Cornier, M.-A.; Donahoo, W.T.; Pereira, R.; Gurevich, I.; Westergren, R.; Enerback, S.; Eckel, P.J.; Goalstone, M.L.; Hill, J.O.; Eckel, R.H.; et al. Insulin sensitivity determines the effectiveness of dietary macronutrient composition on weight loss in obese women. Obes. Res. 2005, 13, 703–709. [Google Scholar] [CrossRef] [PubMed]
- Dale, K.S.; McAuley, K.A.; Taylor, R.W.; Williams, S.M.; Farmer, V.L.; Hansen, P.; Vorgers, S.M.; Chisholm, A.W.; Mann, J.I. Determining optimal approaches for weight maintenance: A randomized controlled trial. Can. Med. Assoc. J. 2009, 180, E39–E46. [Google Scholar] [CrossRef][Green Version]
- Dansinger, M.L.; Gleason, J.A.; Griffith, J.L.; Selker, H.P.; Schaefer, E.J. Comparison of the Atkins, Ornish, Weight Watchers, and Zone Diets for Weight Loss and Heart Disease Risk Reduction: A Randomized Trial. JAMA 2005, 293, 43–53. [Google Scholar] [CrossRef]
- Foraker, R.E.; Pennell, M.; Sprangers, P.; Vitolins, M.Z.; DeGraffinreid, C.; Paskett, E.D. Effect of a low-fat or low-carbohydrate weight-loss diet on markers of cardiovascular risk among premenopausal women: A randomized trial. J. Women’s Health (Larchmt.) 2014, 23, 675–680. [Google Scholar] [CrossRef] [PubMed]
- Foster, G.D.; Wyatt, H.R.; Hill, J.O.; Makris, A.P.; Rosenbaum, D.L.; Brill, C.; Stein, R.I.; Mohammed, B.S.; Miller, B.; Rader, D.J.; et al. Weight and metabolic outcomes after 2 years on a low-carbohydrate versus low-fat diet: A randomized trial. Ann. Intern. Med. 2010, 153, 147–157. [Google Scholar] [CrossRef] [PubMed]
- Frisch, S.; Zittermann, A.; Berthold, H.K.; Götting, C.; Kuhn, J.; Kleesiek, K.; Stehle, P.; Körtke, H. A randomized controlled trial on the efficacy of carbohydrate-reduced or fat-reduced diets in patients attending a telemedically guided weight loss program. Cardiovasc. Diabetol. 2009, 8, 36. [Google Scholar] [CrossRef]
- Gardner, C.D.; Kiazand, A.; Alhassan, S.; Kim, S.; Stafford, R.S.; Balise, R.R.; Kraemer, H.C.; King, A.C. Comparison of the Atkins, Zone, Ornish, and LEARN Diets for Change in Weight and Related Risk Factors Among Overweight Premenopausal Women: The A TO Z Weight Loss Study: A Randomized Trial. JAMA 2007, 297, 969–977. [Google Scholar] [CrossRef] [PubMed]
- Gardner, C.D.; Offringa, L.C.; Hartle, J.C.; Kapphahn, K.; Cherin, R. Weight loss on low-fat vs. low-carbohydrate diets by insulin resistance status among overweight adults and adults with obesity: A randomized pilot trial. Obesity 2016, 24, 79–86. [Google Scholar] [CrossRef]
- Gardner, C.D.; Trepanowski, J.F.; Del Gobbo, L.C.; Hauser, M.E.; Rigdon, J.; Ioannidis, J.P.A.; Desai, M.; King, A.C. Effect of Low-Fat vs. Low-Carbohydrate Diet on 12-Month Weight Loss in Overweight Adults and the Association With Genotype Pattern or Insulin Secretion: The DIETFITS Randomized Clinical Trial. JAMA 2018, 319, 667–679. [Google Scholar] [CrossRef] [PubMed]
- Keogh, J.B.; Brinkworth, G.D.; Clifton, P.M. Effects of weight loss on a low-carbohydrate diet on flow-mediated dilatation, adhesion molecules and adiponectin. Br. J. Nutr. 2007, 98, 852–859. [Google Scholar] [CrossRef]
- McAuley, K.; McAuley, K.; Hopkins, C.; Hopkins, C.; Smith, K.; Smith, K.; McLay, R.; McLay, R.; Williams, S.; Williams, S.; et al. Comparison of high-fat and high-protein diets with a high-carbohydrate diet in insulin-resistant obese women. Diabetologia 2005, 48, 8–16. [Google Scholar] [CrossRef]
- McLaughlin, T.; Carter, S.; Lamendola, C.; Abbasi, F.; Yee, G.; Schaaf, P.; Basina, M.; Reaven, G. Effects of moderate variations in macronutrient composition on weight loss and reduction in cardiovascular disease risk in obese, insulin-resistant adults. Am. J. Clin. Nutr. 2006, 84, 813–821. [Google Scholar] [CrossRef]
- Meckling, K.A.; O’Sullivan, C.; Saari, D. Comparison of a Low-Fat Diet to a Low-Carbohydrate Diet on Weight Loss, Body Composition, and Risk Factors for Diabetes and Cardiovascular Disease in Free-Living, Overweight Men and Women. J. Clin. Endocrinol. Metab. 2004, 89, 2717–2723. [Google Scholar] [CrossRef]
- Nickols-Richardson, S.M.; Coleman, M.D.; Volpe, J.J.; Hosig, K.W. Perceived Hunger Is Lower and Weight Loss Is Greater in Overweight Premenopausal Women Consuming a Low-Carbohydrate/High-Protein vs High-Carbohydrate/Low-Fat Diet. J. Am. Diet. Assoc. 2005, 105, 1433–1437. [Google Scholar] [CrossRef] [PubMed]
- Phillips, S.A.; Jurva, J.W.; Syed, A.Q.; Syed, A.Q.; Kulinski, J.P.; Pleuss, J.; Hoffmann, R.G.; Gutterman, D.D. Benefit of Low-Fat Over Low-Carbohydrate Diet on Endothelial Health in Obesity. Hypertension 2008, 51, 376–382. [Google Scholar] [CrossRef] [PubMed]
- Samaha, F.F.; Iqbal, N.; Seshadri, P.; Chicano, K.L.; Daily, D.A.; McGrory, J.; Williams, T.; Williams, M.; Gracely, E.J.; Stern, L. A Low-Carbohydrate as Compared with a Low-Fat Diet in Severe Obesity. N. Engl. J. Med. 2003, 348, 2074–2081. [Google Scholar] [CrossRef] [PubMed]
- Sharman, M.J.; Gomez, A.L.; Kraemer, W.J.; Volek, J.S. Very Low-Carbohydrate and Low-Fat Diets Affect Fasting Lipids and Postprandial Lipemia Differently in Overweight Men1. J. Nutr. 2004, 134, 880. [Google Scholar] [CrossRef]
- Soenen, S.; Bonomi, A.G.; Lemmens, S.G.T.; Scholte, J.; Thijssen, M.A.M.A.; van Berkum, F.; Westerterp-Plantenga, M.S. Relatively high-protein or ‘low-carb’ energy-restricted diets for body weight loss and body weight maintenance? Physiol. Behav. 2012, 107, 374–380. [Google Scholar] [CrossRef]
- Stern, L.; Iqbal, N.; Seshadri, P.; Chicano, K.L.; Daily, D.A.; McGrory, J.; Williams, M.; Gracely, E.J.; Samaha, F.F. The Effects of Low-Carbohydrate versus Conventional Weight Loss Diets in Severely Obese Adults: One-Year Follow-up of a Randomized Trial. Ann. Intern. Med. 2004, 140, 778–785. [Google Scholar] [CrossRef]
- Varady, K.A.; Bhutani, S.; Klempel, M.C.; Phillips, S.A. Improvements in vascular health by a low-fat diet, but not a high-fat diet, are mediated by changes in adipocyte biology. Nutr. J. 2011, 10, 8. [Google Scholar] [CrossRef]
- Veum, V.L.; Laupsa-Borge, J.; Eng, Ø.; Rostrup, E.; Larsen, T.H.; Nordrehaug, J.E.; Nygård, O.K.; Sagen, J.V.; Gudbrandsen, O.A.; Dankel, S.N.; et al. Visceral adiposity and metabolic syndrome after very high–fat and low-fat isocaloric diets: A randomized controlled trial. Am. J. Clin. Nutr. 2017, 105, 85–99. [Google Scholar] [CrossRef]
- Volek, J.S.; Sharman, M.J.; Gόmez, A.L.; Scheett, T.P.; Kraemer, W.J. An Isoenergetic Very Low Carbohydrate Diet Improves Serum HDL Cholesterol and Triacylglycerol Concentrations, the Total Cholesterol to HDL Cholesterol Ratio and Postprandial Lipemic Responses Compared with a Low Fat Diet in Normal Weight, Normolipidemic W. J. Nutr. 2003, 133, 2756–2761. [Google Scholar] [CrossRef]
- Volek, J.S.; Sharman, M.J.; Gómez, A.L.; DiPasquale, C.; Roti, M.; Pumerantz, A.; Kraemer, W.J. Comparison of a Very Low-Carbohydrate and Low-Fat Diet on Fasting Lipids, LDL Subclasses, Insulin Resistance, and Postprandial Lipemic Responses in Overweight Women. J. Am. Coll. Nutr. 2004, 23, 177–184. [Google Scholar] [CrossRef]
- Vander Wal, J.S.; Mcburney, M.I.; Moellering, N.; Marth, J.; Dhurandhar, N.V. Moderate-carbohydrate low-fat versus low-carbohydrate high-fat meal replacements for weight loss. Int. J. Food Sci. Nutr. 2007, 58, 321–329. [Google Scholar] [CrossRef] [PubMed]
- Wood, R.J.; Gregory, S.M.; Sawyer, J.; Milch, C.M.; Matthews, T.D.; Headley, S.A.E. Preservation of fat-free mass after two distinct weight loss diets with and without progressive resistance exercise. Metab. Syndr. Relat. Disord. 2012, 10, 167–174. [Google Scholar] [CrossRef] [PubMed]
- Haufe, S.; Engeli, S.; Kast, P.; Böhnke, J.; Utz, W.; Haas, V.; Hermsdorf, M.; Mähler, A.; Wiesner, S.; Birkenfeld, A.L.; et al. Randomized comparison of reduced fat and reduced carbohydrate hypocaloric diets on intrahepatic fat in overweight and obese human subjects. Hepatology 2011, 53, 1504–1514. [Google Scholar] [CrossRef] [PubMed]
- Public Health England in association with the Welsh Government, F.S.S. and the F.S.A. Northern Ireland The Eatwell Guide; Public Health England: London, UK, 2016.
- Mansoor, N.; Vinknes, K.J.; Veierød, M.B.; Retterstøl, K. Effects of low-carbohydrate diets v. low-fat diets on body weight and cardiovascular risk factors: A meta-analysis of randomised controlled trials. Br. J. Nutr. 2016, 115, 466–479. [Google Scholar] [CrossRef] [PubMed]
- Hu, T.; Mills, K.T.; Yao, L.; Demanelis, K.; Eloustaz, M.; Jr, W.S.Y.; Kelly, T.N.; He, J.; Bazzano, L.A. Effects of Low-Carbohydrate Diets Versus Low-Fat Diets on Metabolic Risk Factors: A Meta-Analysis of Randomized Controlled Clinical Trials. Am. J. Epidemiol. 2012, 176, S44. [Google Scholar] [CrossRef] [PubMed]
- Boden, G.; Sargrad, K.; Homko, C.; Mozzoli, M.; Stein, T.P. Effect of a low-carbohydrate diet on appetite, blood glucose levels, and insulin resistance in obese patients with type 2 diabetes. Ann. Intern. Med. 2005, 142, 403–411. [Google Scholar] [CrossRef] [PubMed]
- Wolever, T.M. Dietary carbohydrates and insulin action in humans. Br. J. Nutr. 2000, 83 (Suppl. S1), 97. [Google Scholar] [CrossRef] [PubMed]
- Holt, S.H.; Miller, J.B. Increased insulin responses to ingested foods are associated with lessened satiety. Appetite 1995, 24, 43–54. [Google Scholar] [CrossRef]
- Velasquez-Mieyer, P.A.; Cowan, P.A.; Arheart, K.L.; Buffington, C.K.; Spencer, K.A.; Connelly, B.E.; Cowan, G.W.; Lustig, R.H. Suppression of insulin secretion is associated with weight loss and altered macronutrient intake and preference in a subset of obese adults. Int. J. Obes. Relat. Metab. Disord. J. Int. Assoc. Study Obes. 2003, 27, 219–226. [Google Scholar] [CrossRef]
- Rodin, J.; Wack, J.; Ferrannini, E.; DeFronzo, R.A. Effect of insulin and glucose on feeding behavior. Metab. Clin. Exp. 1985, 34, 826–831. [Google Scholar] [CrossRef]
- Ebbeling, C.B.; Feldman, H.A.; Klein, G.L.; Wong, J.M.W.; Bielak, L.; Steltz, S.K.; Luoto, P.K.; Wolfe, R.R.; Wong, W.W.; Ludwig, D.S. Effects of a low carbohydrate diet on energy expenditure during weight loss maintenance: Randomized trial. BMJ 2018, 363, k4583. [Google Scholar] [CrossRef] [PubMed]
- Mach, F.; Baigent, C.; Catapano, A.L.; Koskinas, K.C.; Casula, M.; Badimon, L.; Chapman, M.J.; De Backer, G.G.; Delgado, V.; Ference, B.A.; et al. 2019 ESC/EAS Guidelines for the management of dyslipidaemias: Lipid modification to reduce cardiovascular riskThe Task Force for the management of dyslipidaemias of the European Society of Cardiology (ESC) and European Atherosclerosis Society (EAS). Eur. Heart J. 2020, 41, 111–188. [Google Scholar] [CrossRef] [PubMed]
- Arora, S.K.; McFarlane, S.I. The case for low carbohydrate diets in diabetes management. Nutr. Metab. (Lond.) 2005, 2, 16. [Google Scholar] [CrossRef] [PubMed]
- Parks, E.J. Effect of Dietary Carbohydrate on Triglyceride Metabolism in Humans. J. Nutr. 2001, 131, 2772S–2774S. [Google Scholar] [CrossRef]
- Hage, M.P.; Azar, S.T. Treating low high-density lipoprotein cholesterol: What is the evidence? Ther. Adv. Endocrinol. Metab. 2014, 5, 10–17. [Google Scholar] [CrossRef]
- Santos, F.L.; Esteves, S.S.; da Costa Pereira, A.; Yancy Jr, W.S.; Nunes, J.P.L. Systematic review and meta-analysis of clinical trials of the effects of low carbohydrate diets on cardiovascular risk factors. Obes. Rev. 2012, 13, 1048–1066. [Google Scholar] [CrossRef]
- Bueno, N.B.; de Melo, I.S.V.; de Oliveira, S.L.; da Rocha Ataide, T. Very-low-carbohydrate ketogenic diet v. low-fat diet for long-term weight loss: A meta-analysis of randomised controlled trials. Br. J. Nutr. 2013, 110, 1178–1187. [Google Scholar] [CrossRef]
- Wadhera, R.K.; Steen, D.L.; Khan, I.; Giugliano, R.P.; Foody, J.M. A review of low-density lipoprotein cholesterol, treatment strategies, and its impact on cardiovascular disease morbidity and mortality. J. Clin. Lipidol. 2015, 10, 472–489. [Google Scholar] [CrossRef]
- Abdullah, S.M.; Defina, L.F.; Leonard, D.; Barlow, C.E.; Radford, N.B.; Willis, B.L.; Rohatgi, A.; McGuire, D.K.; de Lemos, J.A.; Grundy, S.M.; et al. Long-Term Association of Low-Density Lipoprotein Cholesterol With Cardiovascular Mortality in Individuals at Low 10-Year Risk of Atherosclerotic Cardiovascular Disease. Circulation 2018, 138, 2315–2325. [Google Scholar] [CrossRef]
- Nozue, T. Lipid Lowering Therapy and Circulating PCSK9 Concentration. J. Atheroscler. Thromb. 2017, 24, 895–907. [Google Scholar] [CrossRef]
- Tobias, D.K.; Chen, M.; Manson, J.E.; Ludwig, D.S.; Willett, W.; Hu, F.B. Effect of Low-Fat vs. Other Diet Interventions on Long-Term Weight Change in Adults: A Systematic Review and Meta-Analysis. Lancet Diabetes Endocrinol. 2015, 3, 968–979. [Google Scholar] [CrossRef]
- Srour, B.; Fezeu, L.K.; Kesse-Guyot, E.; Allès, B.; Méjean, C.; Andrianasolo, R.M.; Chazelas, E.; Deschasaux, M.; Hercberg, S.; Galan, P.; et al. Ultra-processed food intake and risk of cardiovascular disease: Prospective cohort study (NutriNet-Santé). BMJ 2019, 365, l1451. [Google Scholar] [CrossRef] [PubMed]
- Juul, F.; Hemmingsson, E. Trends in consumption of ultra-processed foods and obesity in Sweden between 1960 and 2010. Public Health Nutr. 2015, 18, 3096–3107. [Google Scholar] [CrossRef] [PubMed]
- Pan American Health Organization. Ultra-Processed Food and Drink Products in Latin America: Trends, Impact on Obesity, Policy Implications; Pan American Health Organization: Washington, DC, USA, 2015. [Google Scholar]
- Adams, J.; White, M. Characterisation of UK diets according to degree of food processing and associations with socio-demographics and obesity: Cross-sectional analysis of UK National Diet and Nutrition Survey (2008–12). Int. J. Behav. Nutr. Phys. Act. 2015, 12, 160. [Google Scholar] [CrossRef]


| First Author | Randomised Participants | Country | Low-Fat Intervention | Low-Carb Intervention | Follow-Up Duration (Months) |
|---|---|---|---|---|---|
| Antonio De Luis, 2015 [29] | 331 | Spain | Standard protein hypocaloric: 55% carbohydrates, 27% fat, 20% protein | High Protein hypocaloric: 33% carbohydrate, 33% fat, 34% protein | 9 |
| Bazzano, 2014 [30] | 148 | USA | National Cholesterol Education Program Guidelines (<30% fat, 55% carbohydrates) | Low-carbohydrate diet | 12 |
| Bradley, 2009 [31] | 27 | UK | 20% fat, 60% carbohydrate; ~500 kcal calorie deficit | 60% fat, 20% carbohydrate; ~500 kcal calorie deficit | 1.84 |
| Brehm, 2003 [32] | 53 | USA | Energy-restricted, moderately low-fat diet with 55% carbohydrate, 15% protein, and 30% fat. | Ad libitum low carb, <20g carbohydrate/day; increase to 40–60 g/day if still in ketosis. | 6 |
| Brehm, 2005 [33] | 50 | USA | Energy-restricted, moderately low-fat diet with 55% carbohydrate, 15% protein, and 30% fat. | Ad libitum low carb, <20 g carbohydrate/day; increase to 40–60 g/day if still in ketosis. | 4 |
| Brinkworth, 2009 [34] | 118 | Australia | 30% fat; isocaloric | Energy restricted (6–7 megajoules) low-carbohydrate (4%, 35%, and 61% of energy as carbohydrate, protein, and fat) | 12 |
| Cornier, 2005 [35] | 44 | USA | 60% CHO, 20% fat, and 20% protein (high carbohydrate/low fat); energy restricted 400 kcal deficit | 40% carbohydrate 40% fat, and 20% protein (low carbohydrate/ high fat); energy restricted 400kcal deficit | 3.68 |
| Dale, 2009 [36] | 200 | New Zealand | High-monounsaturated fat diet; 25% protein, 21% monounsaturated fat, 40% carbohydrate (Nurse supported or Intensive supported) | 55% carbohydrates, 15–20% protein and 25–30% fat; encouraged to consume low-glycaemic food (Nurse supported or Intensive supported) | 24 |
| Dansinger, 2005 [37] | 160 | USA | Ornish, vegetarian diet containing 10% of calories from fat. | Atkins diet group, <20 g/day with gradual increase to 50 g/day | 12 |
| Foraker, 2014 [38] | 79 | USA | 60% carbohydrates, 20% fat, 20% protein | 40% carbohydrates, 30% fat, 30% protein | 18 |
| Foster, 2003 [24] | 63 | USA | 60% carbohydrate, 25% fat, and 15% protein | Atkins diet group, 20 g/day with gradual increase until stable | 12 |
| Foster, 2010 [39] | 307 | USA | 55% carbohydrates, 30% fat, 15% protein | Atkins diet group, 20 g/day for first 12 weeks with gradual of 5 g/day per week after | 24 |
| Frisch, 2009 [40] | 200 | Germany | >55% carbohydrate, <30% fat, 15% protein | <40% carbohydrates, >35% fat, 25% protein | 12 |
| Gardner, 2007 [41] | 311 | USA | (1) LEARN The LEARN group was instructed to follow a prudent diet that included 55% to 60% energy from carbohydrate <10% saturated fat (2) Ornish <10% fat | Atkins, <20 g/d or less of carbohydrate for “induction” (usually 2–3 months) and 50 g/d or less of carbohydrate for the subsequent “ongoing weight loss” phase. | 12 |
| Gardner, 2016 [42] | 31 | USA | Reduced intake of fat to 20 g/day to achieve lowest level of fat during first 8 weeks; in the second stage slowly add fat in increments of 5 g/d and hold for 1–4 weeks before adding another 5 g/day; third stage to identify lowest level they could maintain long term. | Reduced intake of carbohydrates to 20g/day to achieve lowest level of carbohydrates during first 8 weeks; in the second stage slowly add carbohydrates in increments of 5 g/d and hold for 1–4 weeks before adding another 5 g/day; third stage to identify lowest level they could maintain long term. | 6 |
| Gardner, 2018 [43] | 632 | USA | Reduced intake of fat to 20 g/day during first 8 weeks; slowly add carbohydrates in increments of 5–15 g/d per week until they reached lowest level of intake they could maintain indefinitely | Reduced intake of carbohydrates to 20 g/day during first 8 weeks; slowly add carbohydrates in increments of 5–15 g/d per week until they reached lowest level of intake they could maintain indefinitely | 12 |
| Halyburton, 2007 [44] | 121 | Australia | 46% carbohydrate, 30% fat, 245 protein | 4% carbohydrate, 61% fat (20% saturated fat), 35% protein | 1.84 |
| Haufe, 2011 [60] | 174 | Germany | 20% fat, 0.8 g protein/kg body weight, and the remaining energy content provided by carbohydrates in the reduced fat group | 90 g carbohydrates, 0.8 g protein/kg body weight, and a minimum of 30% fat in the reduced carbohydrate group | 6 |
| Jenkins, 2014 [11] | 50 | Canada USA | High-carbohydrate lacto-ovo vegetarian diet 58% carbohydrate, 25% fat, 16% protein | Low-carbohydrate vegan diet with 265% carbohydrates, 43% fat, 31% vegetable proteins | 6 |
| Keogh, 2007 [44] | 44 | Australia | 60% carbohydrate, 20% fat, 20% protein | 33% carbohydrate, 27% fat, 40% protein | 3 |
| Kirk, 2009 [26] | 22 | USA | ≥180 g carbohydrates, 20% fat, 15% protein | ≤50 g carbohydrates/day, 10% carbohydrates, 75% fat, 15% protein | 2.75 |
| McAuley, 2005 [45] | 96 | New Zealand | High-carbohydrate, high-fibre diet (control group) based on that recommended by Diabetes and Nutrition Study Group (DNSG) of the European Association for the Study of Diabetes (EASD) and the diet was implemented using the national healthy eating guidelines, with slight modifications | Atkins, in first 2 weeks <20 g/day of carbohydrates; during weeks 3 to 8 of the weight loss phase, carbohydrate was reintroduced by the addition of 5 g/day each week, so that a maximum of 50 g of carbohydrate per day was consumed by week 8. | 3.68 |
| McLaughlin, 2006 [46] | 65 | USA | 16 week calorie restriction 60% carbohydrates, 25% fat, 15% protein Then 2 week weight maintenance with eucaloric diet based on weight and macronutrient content similar to hypocaloric diet | 16 week calorie restriction 40% carbohydrates, 45% fat, 15% protein Then 2 week weight maintenance with eucaloric diet based on weight and macronutrient content similar to hypocaloric diet | 4.14 |
| Meckling, 2004 [47] | 40 | Canada | Low fat diet, eliminated high-fat dairy products and substitute with no-fat or low fat alternatives. | The goal of the low carbohydrate diet was to restrict carbohydrates to 50–70 g/d by gradually restricting carbohydrate intake from 100 g on d 0 to 50–70 g by d 5. | 2.3 |
| Nickols-Richardson, 2005 [48] | 28 | USA | 60% carbohydrate, 25% fat, 15% protein | Atkins Nutritional Approach: during the first 2 weeks, consumed <20 g carbohydrate/day; thereafter, they increased their carbohydrate intake by 5 g/week to 40 g carbohydrate/day at week 6. | 1.38 |
| Phillips, 2008 [49] | 28 | USA | 30% fat modelled after an American Heart Association diet | Atkins-style diet with 20 g/day carbohydrates supplemented with protein and fat content according to the Atkins’ diet recommendations | 1.38 |
| Ruth, 2013 [27] | 55 | USA | 60% complex carbohydrates, 25% fat, 15% protein | ≤40 g/day carbohydrates, 60% fat, 15% protein | 12 |
| Sacks, 2009 [7] | 811 | USA | Low Fat High Protein 55% carbohydrate, 20% fat, 25% protein Low Fat Average Protein 65% carbohydrate, 205 fat, 15% protein | High fat high protein 35% carbohydrate, 20% fat, 15% protein (High fat average protein group did not meet criteria) | 24 |
| Samaha, 2003 [50] | 132 | USA | Received instruction in accordance with the obesity-management guidelines of the National Heart, Lung, and Blood Institute, including caloric restriction to create a deficit of 500 calories/day, with ≤30% of total calories derived from fat. | ≤30 g/day carbohydrates, no instruction on reducing total fat intake | 6 |
| Sharman, 2004 [51] * | 15 | USA | ~55% carbohydrate, 25% fat, 20% protein | 10% carbohydrates, 60% fat, 30% protein | 1.5 |
| Soenen, 2012 [52] | 139 | The Netherlands | High protein normal carbohydrate 50% carbohydrate, 30% fat, 20% protein (Additionally had a normal protein normal carbohydrate group that did not match selection criteria) | (1) High protein low carbohydrate 25% carbohydrate, 55% fat, 20% protein (2) Normal protein low carbohydrate 25% carbohydrate, 65% fat, 10% protein | 12 |
| Stern, 2004 [53] | 132 | USA | Reduced caloric intake by 500 calories per day, with less than 30% of calories derived from fat | <30 g/day carbohydrate | 12 |
| Varady, 2011 [54] | 20 | USA | 55% carbohydrate, 25% fat, 20% protein | 5% carbohydrate, 60% fat, 35% protein | 1.5 |
| Veum, 2017 [55] | 46 | Norway | 53% carbohydrate, 30% fat, 17% protein | 10% carbohydrate, 73% fat, 17% protein | 3 |
| Volek, 2003 [56] * | 10 | USA | Subjects consumed each diet for 4 weeks followed by a 4-week break before crossing over to the other diet. 55% carbohydrate, 25% protein, 20% fat | Subjects consumed each diet for 4 weeks followed by a 4-week break before crossing over to the other diet. 10% carbohydrate, 60% fat, 30% protein | 1 |
| Volek, 2004 [57] * | 13 | USA | 55% carbohydrate, 25% protein, 20% fat | 10% carbohydrate, 60% fat, 30% protein | 1 |
| Wal, 2007 [58] | 125 | USA | Moderate carbohydrate group | The Low carbohydrate group | 3 |
| Wood, 2012 [59] | 42 | USA | <30% fat with <10% saturated fat and <300mg/day dietary cholesterol | <50 g of carbohydrate per day, with no specific restrictions provided with respect to total or saturated fat consumption or dietary cholesterol consumption. | 3 |
| First Author, Year | Age (Years) Low-Carb | Age (Years) Low-Fat | BMI (kg/m2) Low-Carb | BMI (kg/m2) Low-Fat | Calorie Restriction (Y/N) | Food Provision (Y/N) | Physical Activity Prescribed (Y/N) |
|---|---|---|---|---|---|---|---|
| Antonio De Luis, 2015 [29] | 50.5 | 49.9 | 35.4 | 35.1 | Y | N | Y |
| Bazzano, 2014 [30] | 45.8 | 47.8 | 35.2 | 35.6 | N | N | N |
| Brehm, 2003 [32] | 44.2 | 43.1 | 33.17 | 34.04 | Y (low-fat only) | N | N |
| Brehm, 2005 [33] | 44.8 | 41.4 | 32.8 | 33.5 | Y (low-fat only) | N | N |
| Brinkworth, 2009 [34] | 51.5 | 51.4 | 33.6 | 33.3 | Y | Y | N |
| Cornier, 2005 [35] § | 41.3 | 43.5 | 33.1 | 30.8 | Y | Y | N |
| Cornier, 2005 [35] § | 43.6 | 36.8 | 32.2 | 33 | Y | Y | N |
| Dale, 2009 [36] | 45 | 45 | 31.9 | 31.8 | N | N | Y |
| Dansinger, 2005 [37] | 47 | 49 | 35 | 35 | N | N | Y |
| Foraker, 2014 [38] | 41.9 | 40.9 | 30.1 | 30.5 | Y | N | Y |
| Foster, 2003 [24] | 44 | 44.2 | 33.9 | 34.4 | Y (low-fat only) | N | N |
| Foster, 2010 [39] | 46.2 | 44.9 | 36.1 | 36.1 | Y (low-fat only) | N | Y |
| Frisch, 2009 [40] | 47 | 47 | 33.5 | 33.8 | Y | N | N |
| Gardner, 2007 [41] || | 42 | 40 | 32 | 31 | N | N | Y |
| Gardner, 2007 [41] || | 42 | 42 | 32 | 32 | N | N | Y |
| Gardner, 2016 [42] † | 42 | 44 | 34.2 | 35 | N | N | Y |
| Gardner, 2016 [42] † | 43 | 41 | 31.2 | 32.6 | N | N | Y |
| Gardner, 2018 [43] | 40.2 | 39.3 | 33.3 | 33.4 | N | N | Y |
| Halyburton, 2007 [25] | 50.6 | 49.8 | 33.3 | 33.8 | Y | Y | N |
| Haufe, 2011 [60] | NA | NA | NA | NA | Y | N | N |
| Jenkins, 2014 [11] | 57.6 | 55.3 | 31.1 | 31.1 | Y | N | N |
| Keogh, 2007 [44] | 50·1 | 46.9 | 32·6 | 33.2 | Y | N | N |
| Kirk, 2009 [26] | 41.8 | 45.4 | 36.1 | 36.9 | Y | N | N |
| McAuley, 2005 [45] | 45 | 45 | 36 | 36.6 | N | N | N |
| McLaughlin, 2006 [46] | 48 | 53 | 32.3 | 33 | Y | N | N |
| Meckling, 2004 [47] | 41.2 | 43.2 | 32.2 | 32.2 | Y (low-fat only) | N | N |
| Nickols-Richardson, 2005 [48] | 38.8 | 40.1 | 31.1 | 30.3 | Y (low-fat only) | N | N |
| Phillips, 2008 [49] | 33 | 38 | 34 | 33.8 | Y | N | N |
| Ruth, 2013 [27] | 43.5 | 41.5 | 37.1 | 35.9 | Y | N | N |
| Sacks, 2009 [7] # | 51 | 50 | 33 | 33 | Y | N | Y |
| Sacks, 2009 [7] # | 51 | 51 | 33 | 33 | Y | N | Y |
| Samaha, 2003 [50] | 53 | 54 | 42.9 | 42.9 | Y (low-carb only) | N | N |
| Sharman, 2004 [51] | 33.2 | 33.2 | 34.3 | 34.3 | Y | N | N |
| Soenen, 2012 [52] ¶ | NA | NA | 36.6 | 37.5 | N | N | N |
| Soenen, 2012 [52] ¶ | NA | NA | 37 | 37.5 | N | N | N |
| Stern, 2004 [53] | 55 | 55 | 43.6 | 42.3 | Y (low-fat only) | N | N |
| Varady, 2011 [54] | 35 | 36 | 33 | 34 | Y | Y | N |
| Veum, 2017 [55] * | 40.3 | 40.2 | 34.1 | 33.6 | N* | N | N |
| Volek, 2003 [56] | 26.3 | 26.3 | 22 | 22 | N | N | N |
| Volek, 2004 [57] | 34 | 34 | 29.6 | 29.6 | Y | N | N |
| Wal, 2007 [58] | 50.5 | g49.6 | 33.1 | 37.3 | Y | Y | N |
| Wood, 2012 [59] ‡ | 58.6 | 58.4 | 34 | 35.2 | N (low-fat only) | N | Y ‡ |
Publisher’s Note: MDPI stays neutral with regard to jurisdictional claims in published maps and institutional affiliations. |
© 2020 by the authors. Licensee MDPI, Basel, Switzerland. This article is an open access article distributed under the terms and conditions of the Creative Commons Attribution (CC BY) license (http://creativecommons.org/licenses/by/4.0/).
Share and Cite
Chawla, S.; Tessarolo Silva, F.; Amaral Medeiros, S.; Mekary, R.A.; Radenkovic, D. The Effect of Low-Fat and Low-Carbohydrate Diets on Weight Loss and Lipid Levels: A Systematic Review and Meta-Analysis. Nutrients 2020, 12, 3774. https://doi.org/10.3390/nu12123774
Chawla S, Tessarolo Silva F, Amaral Medeiros S, Mekary RA, Radenkovic D. The Effect of Low-Fat and Low-Carbohydrate Diets on Weight Loss and Lipid Levels: A Systematic Review and Meta-Analysis. Nutrients. 2020; 12(12):3774. https://doi.org/10.3390/nu12123774
Chicago/Turabian StyleChawla, Shreya, Fernanda Tessarolo Silva, Sofia Amaral Medeiros, Rania A. Mekary, and Dina Radenkovic. 2020. "The Effect of Low-Fat and Low-Carbohydrate Diets on Weight Loss and Lipid Levels: A Systematic Review and Meta-Analysis" Nutrients 12, no. 12: 3774. https://doi.org/10.3390/nu12123774
APA StyleChawla, S., Tessarolo Silva, F., Amaral Medeiros, S., Mekary, R. A., & Radenkovic, D. (2020). The Effect of Low-Fat and Low-Carbohydrate Diets on Weight Loss and Lipid Levels: A Systematic Review and Meta-Analysis. Nutrients, 12(12), 3774. https://doi.org/10.3390/nu12123774