
Evaluation of Measured Resting Metabolic Rate for Dietary Prescription in Ageing Adults with Overweight and Adiposity-Based Chronic Disease


Abstract
:1. Introduction
2. Materials and Methods
2.1. Study Design
2.2. Sample Size Calculation
2.3. Participants
2.4. Randomisation and Allocation
2.5. Treatment Protocol
2.6. Compliance
2.7. Measures
2.8. Statistical Analysis
3. Results
3.1. Participants
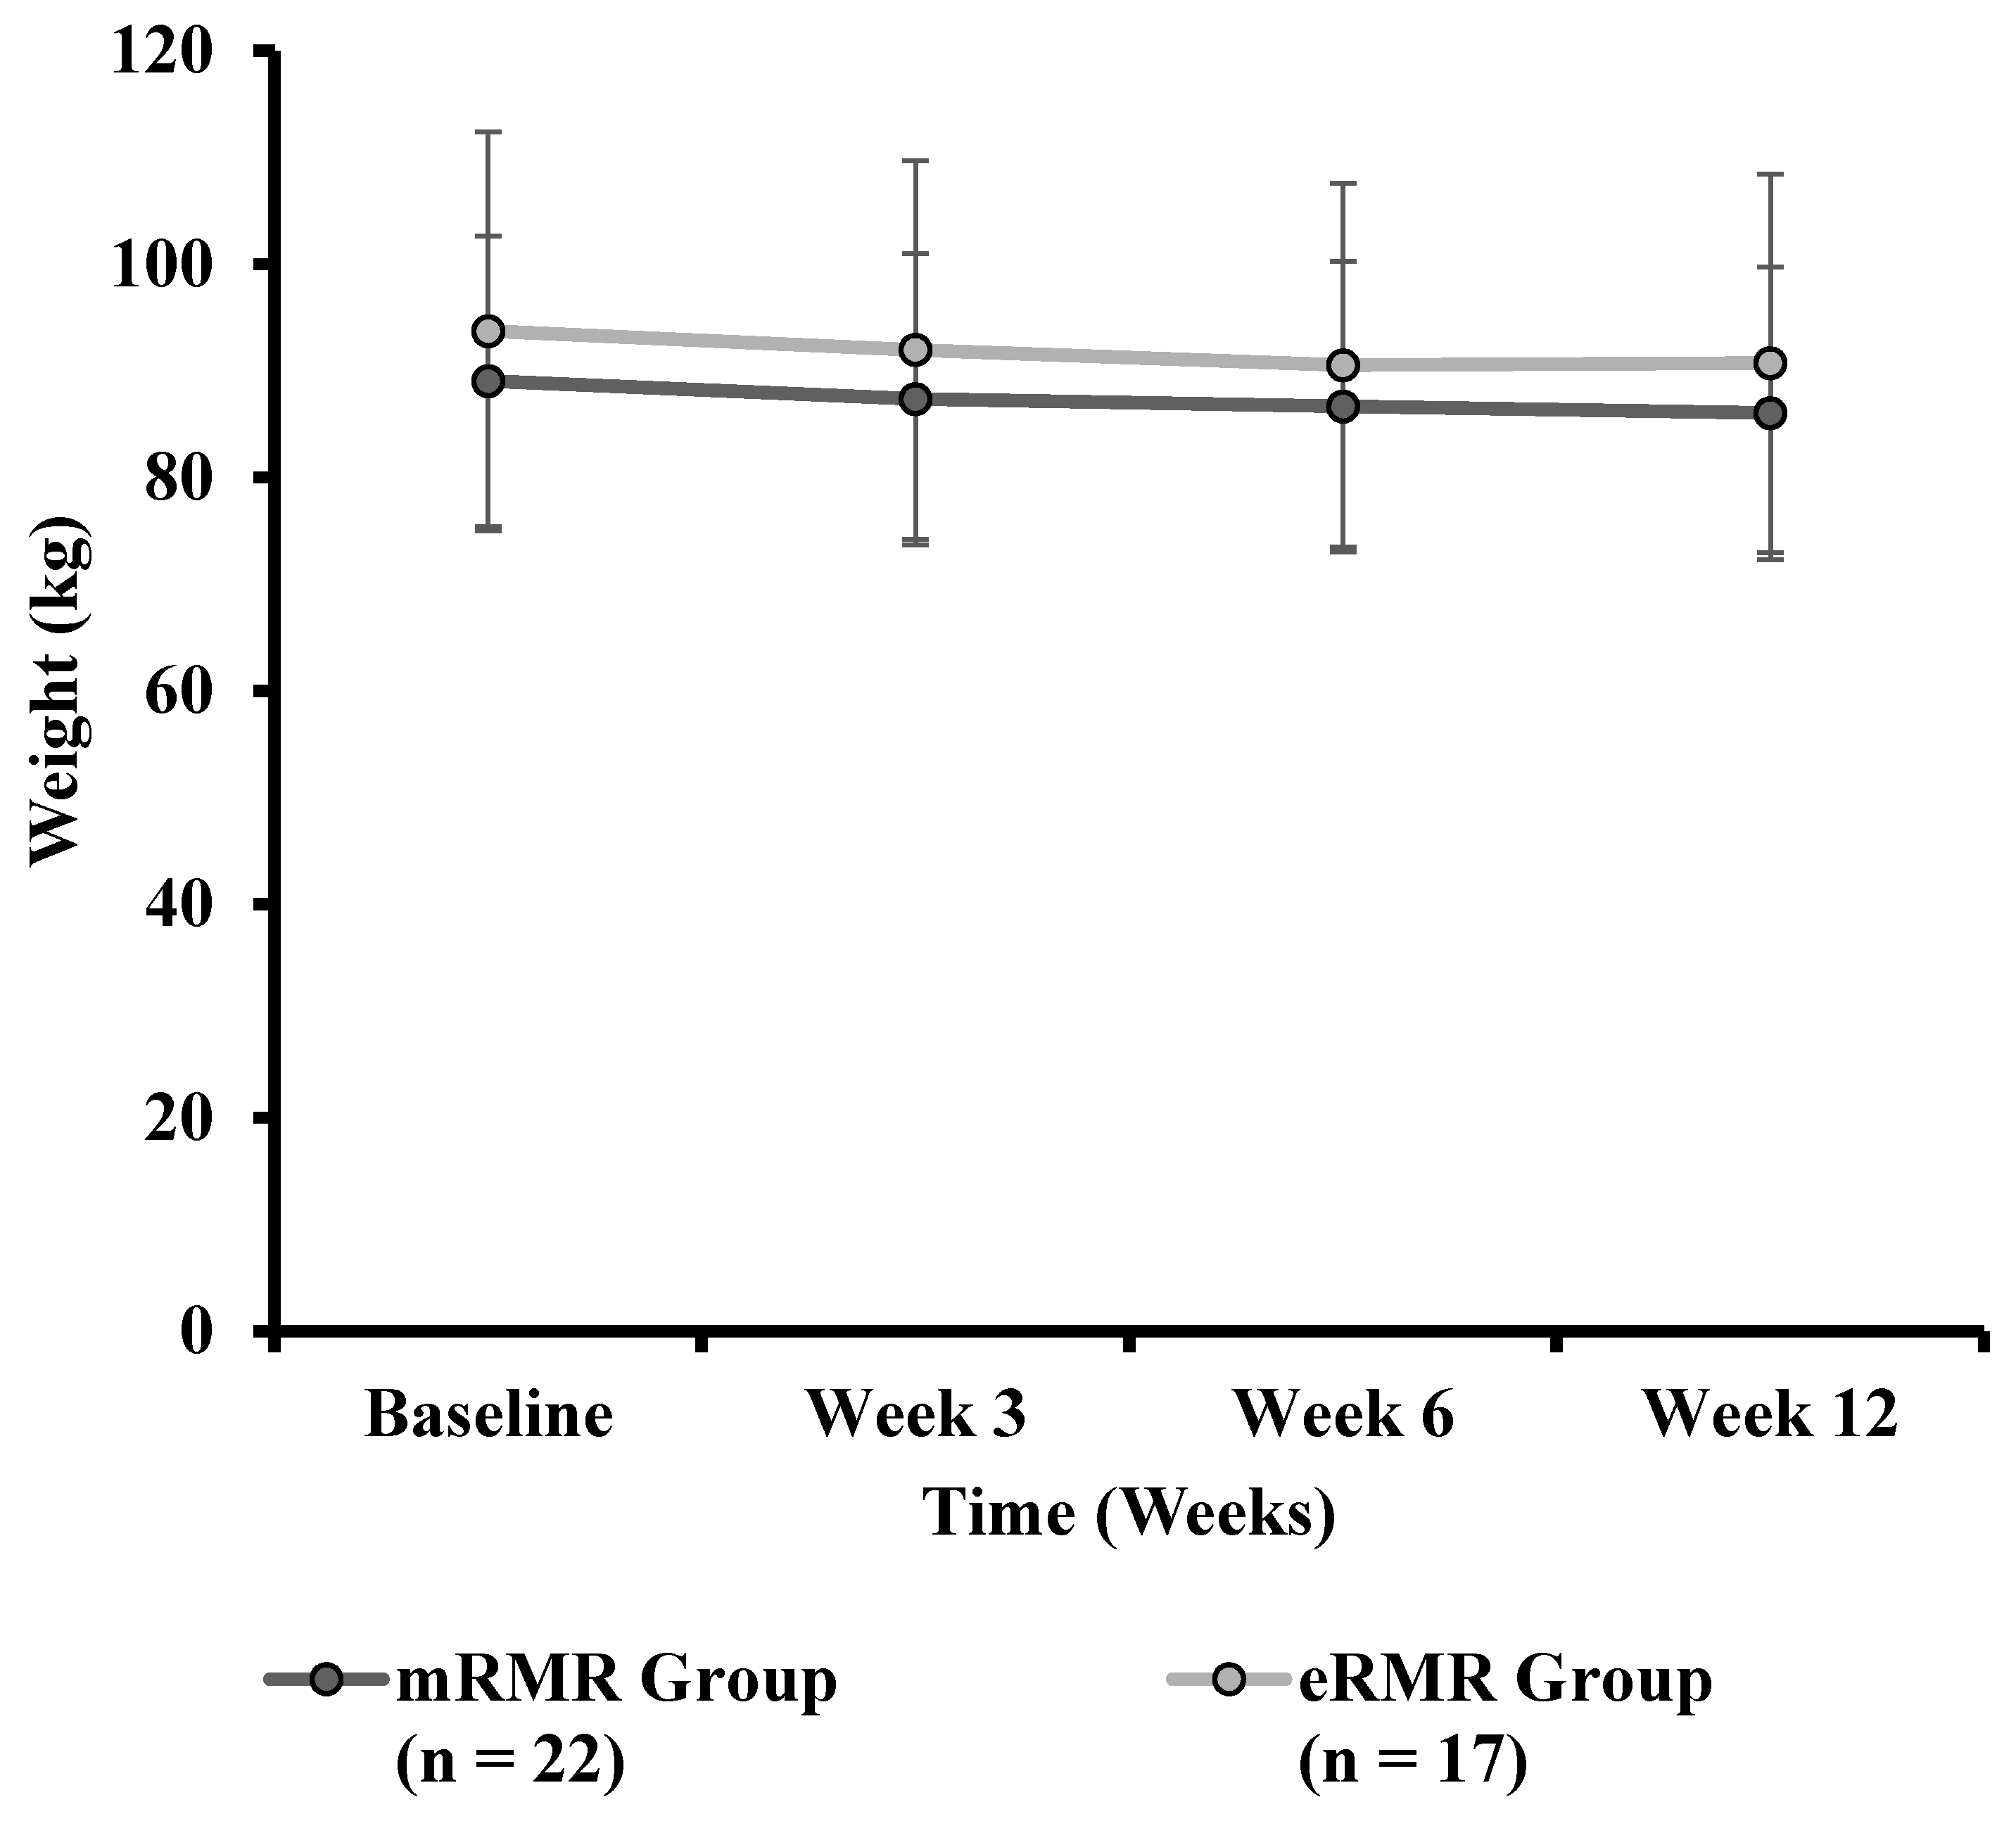
3.2. Weight Change
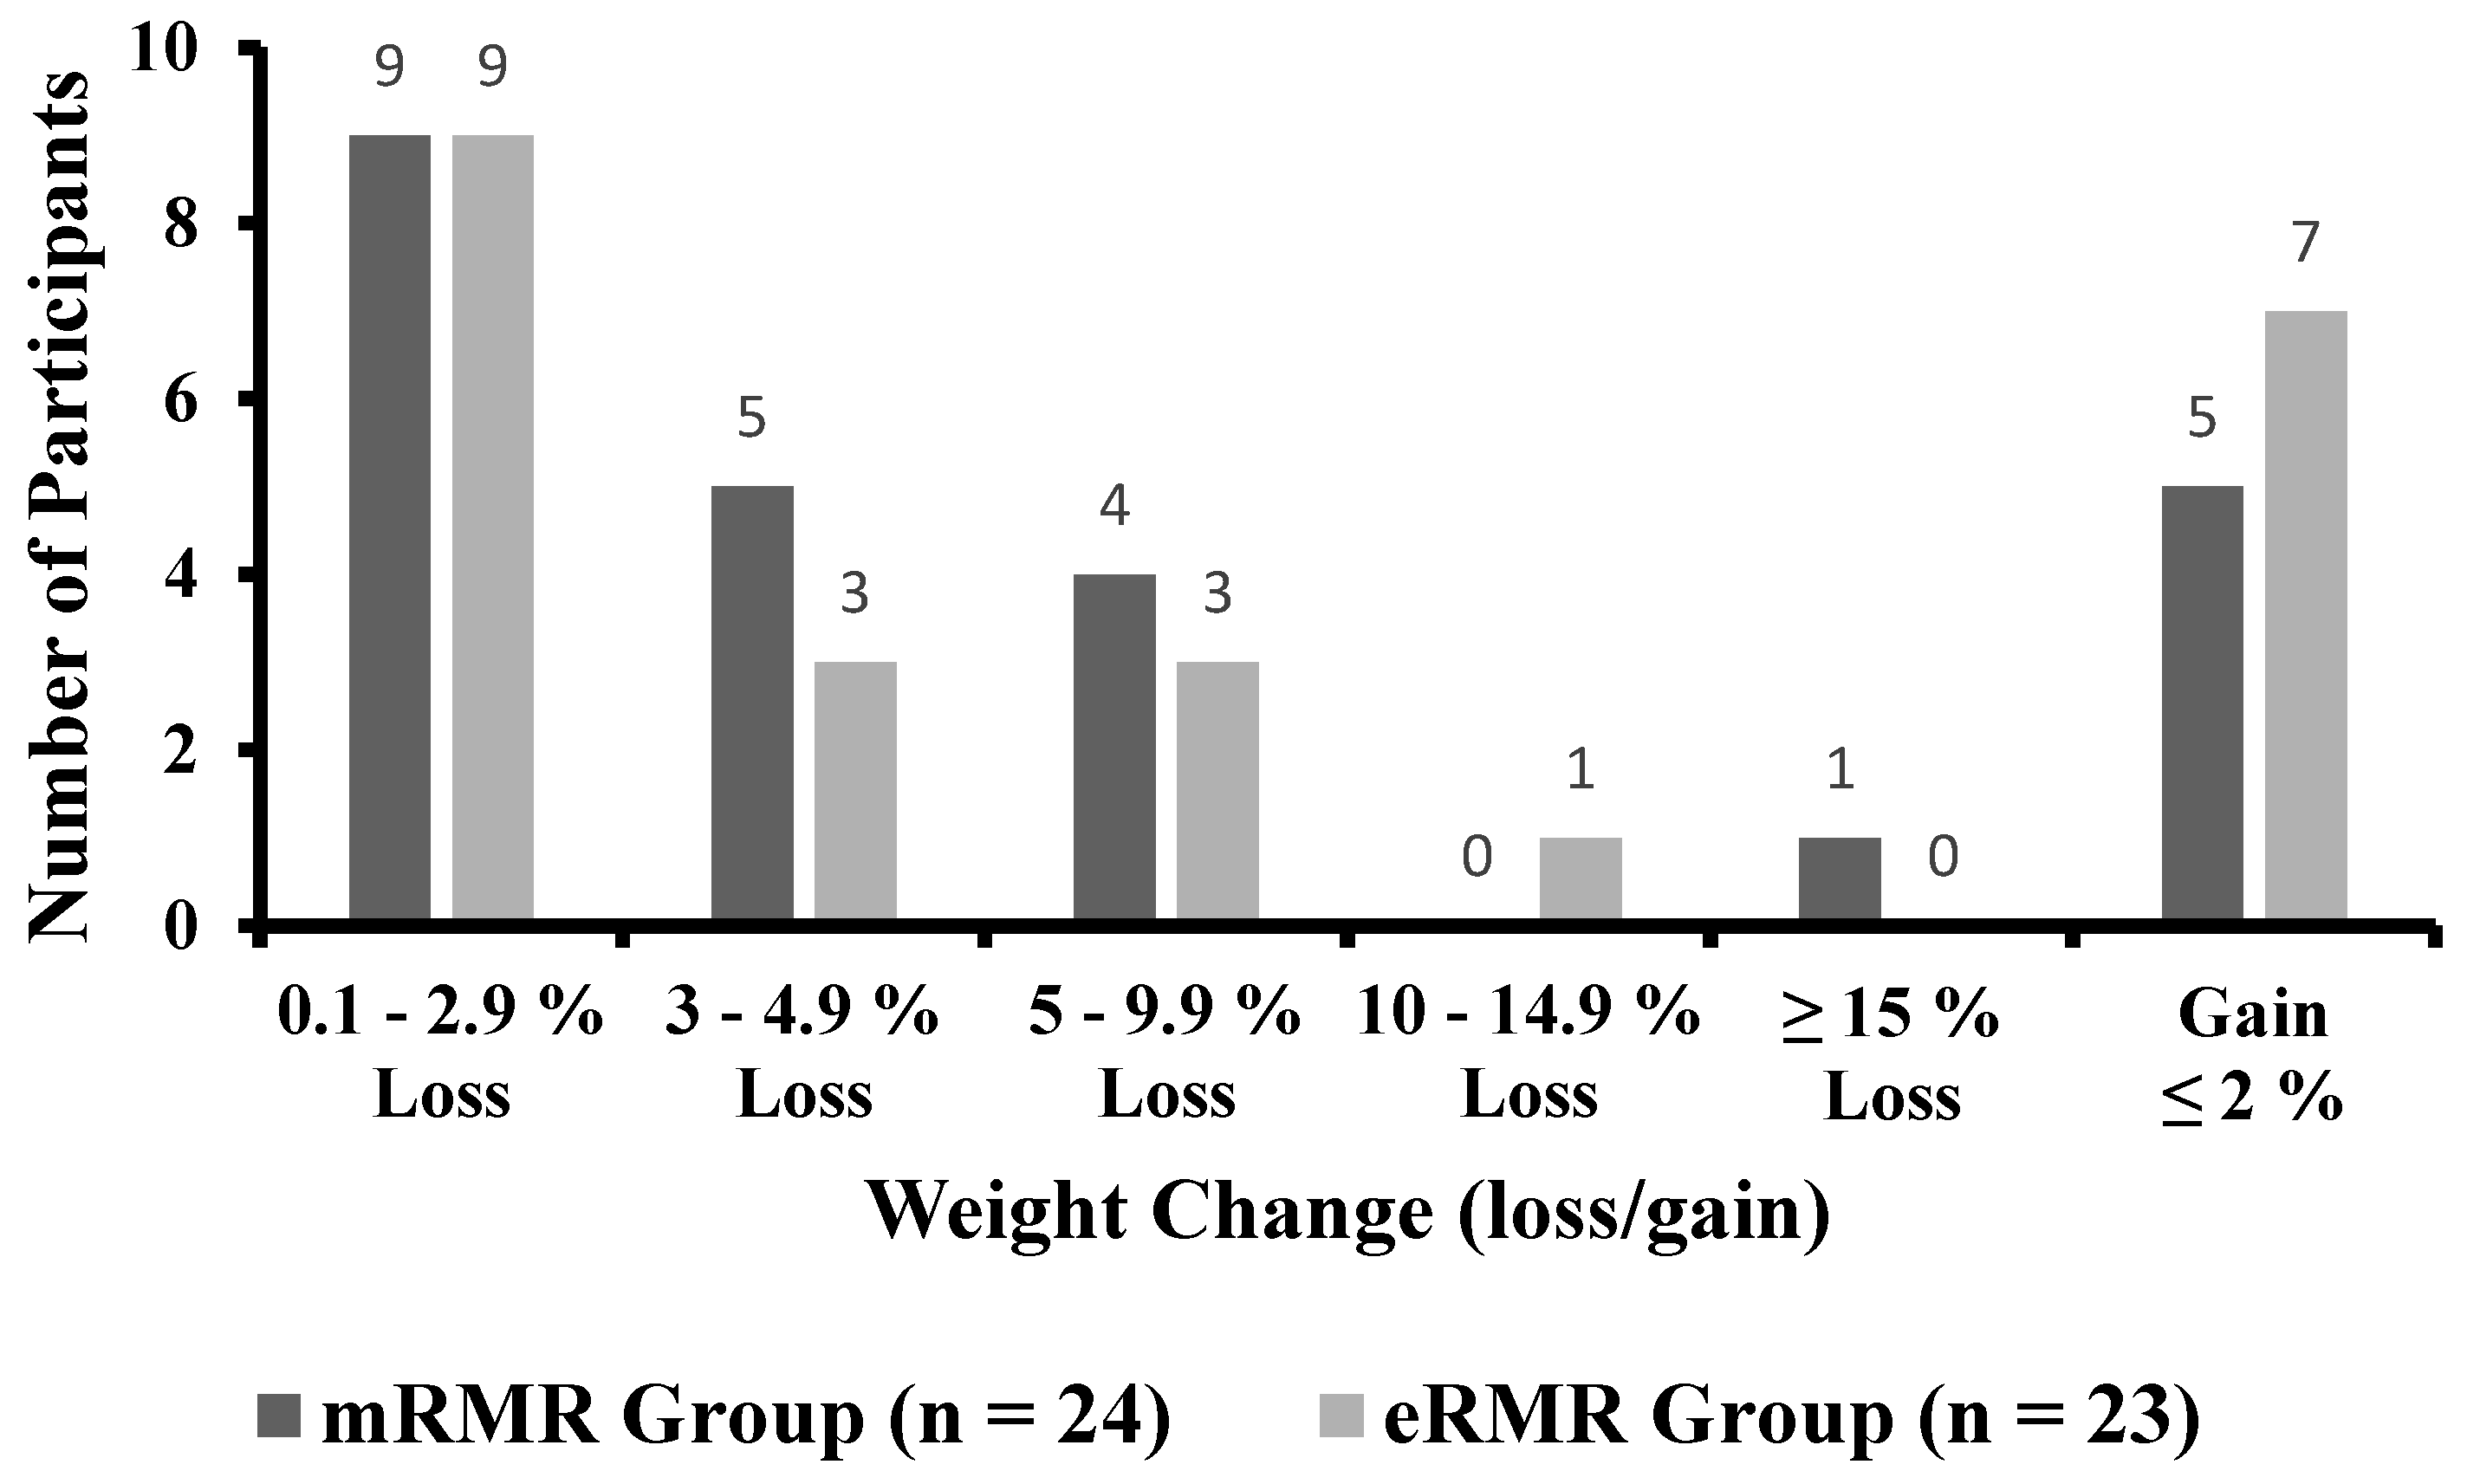
3.3. Individual Response to Weight
3.4. Body Mass Index
3.5. Waist Circumference
3.6. Hip Circumference
3.7. Waist to Hip Ratio
3.8. Percent Body Fat
3.9. Muscle Mass
3.10. Systolic Blood Pressure
3.11. Diastolic Blood Pressure
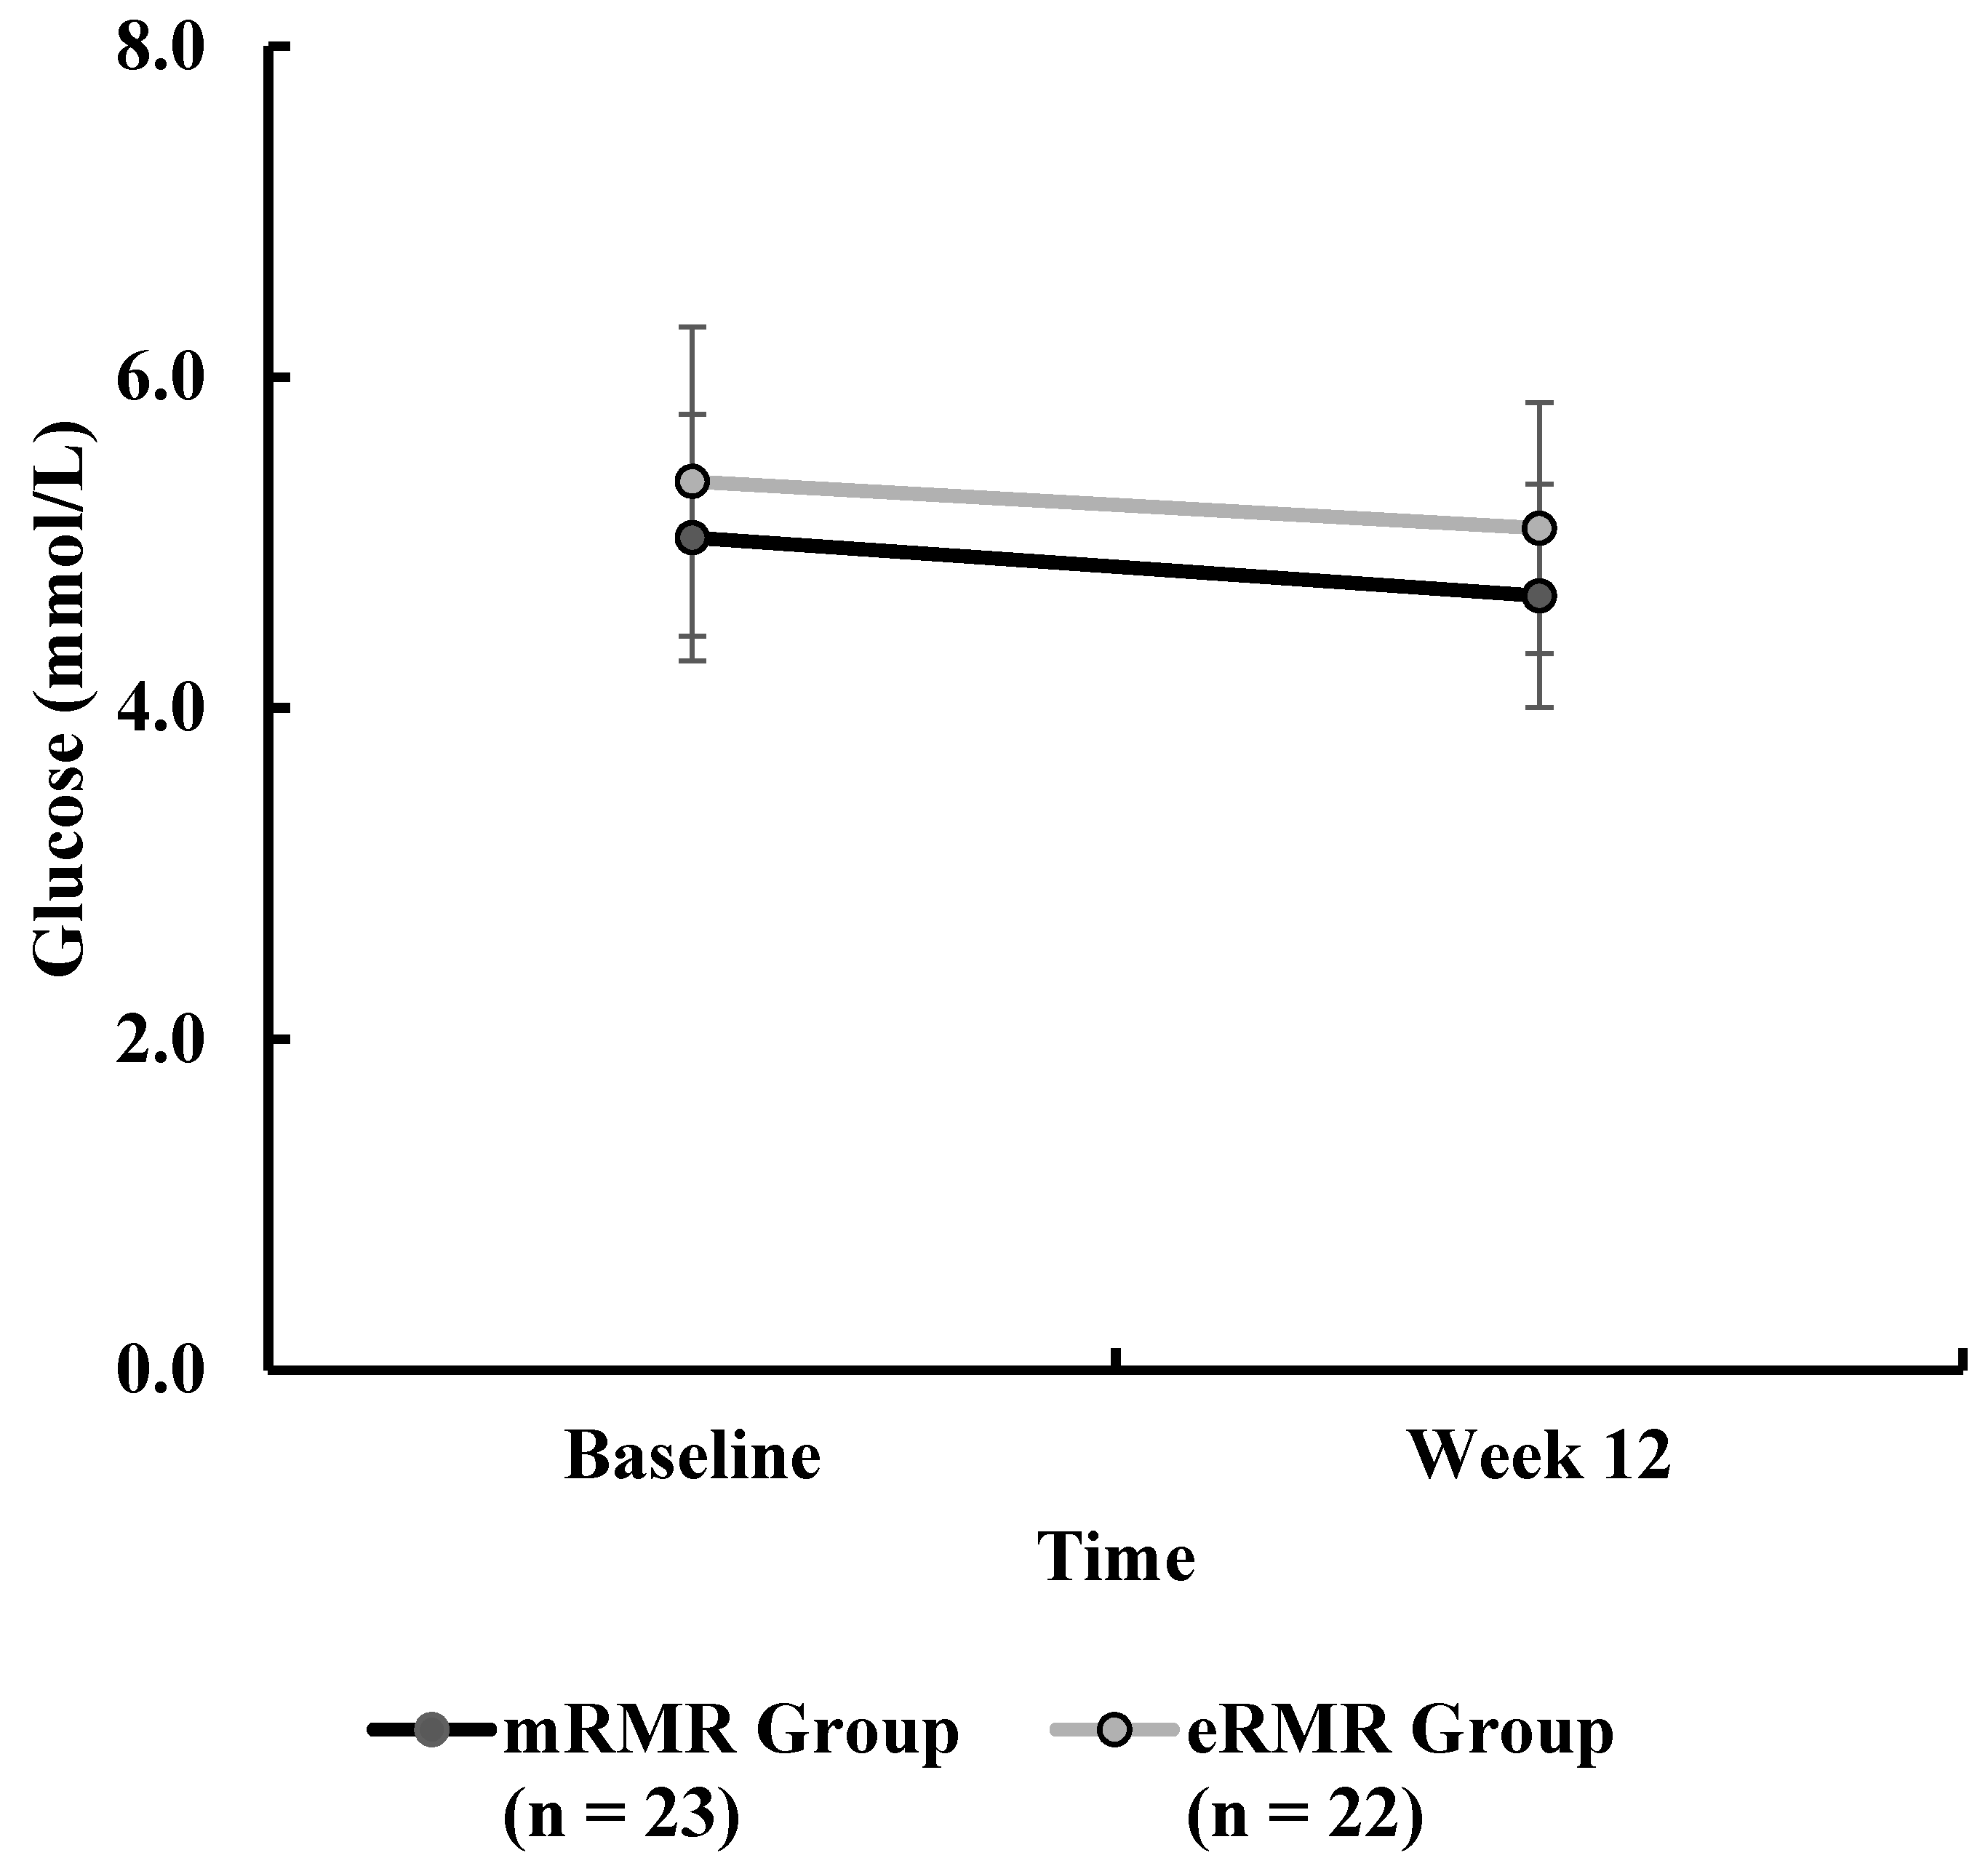
3.12. Blood Glucose
3.13. Total Cholesterol
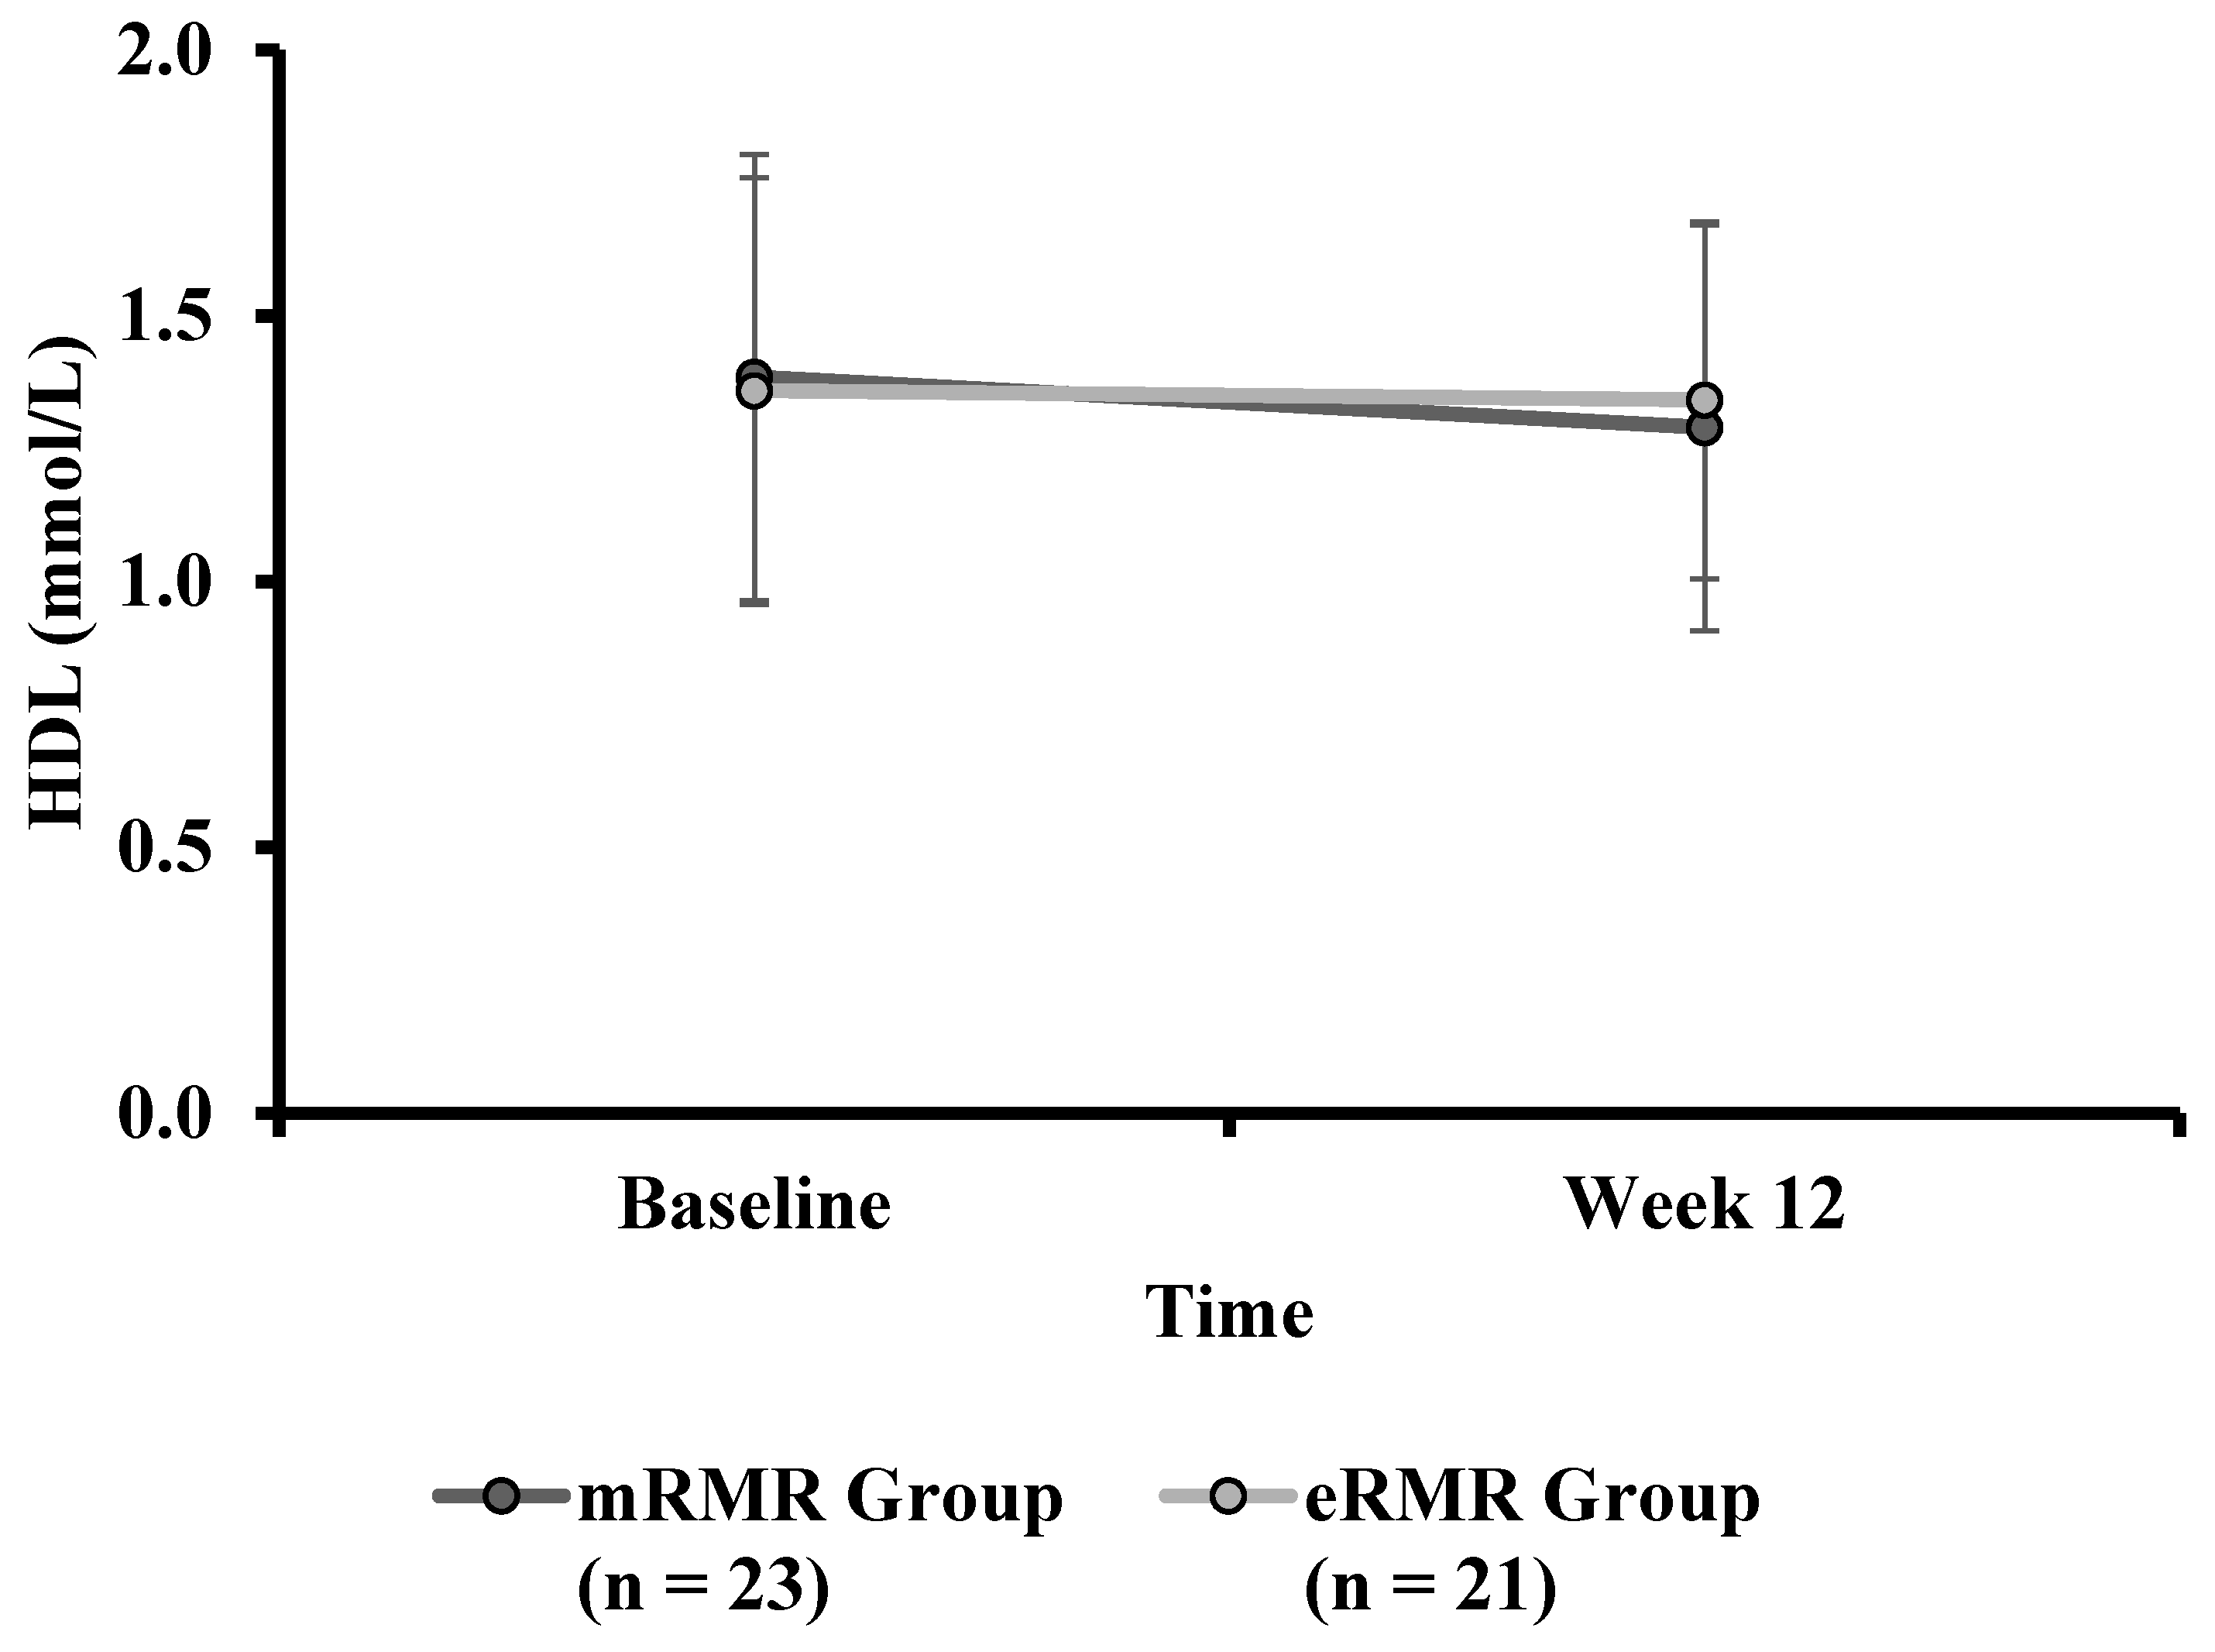
3.14. High-Density Lipoprotein
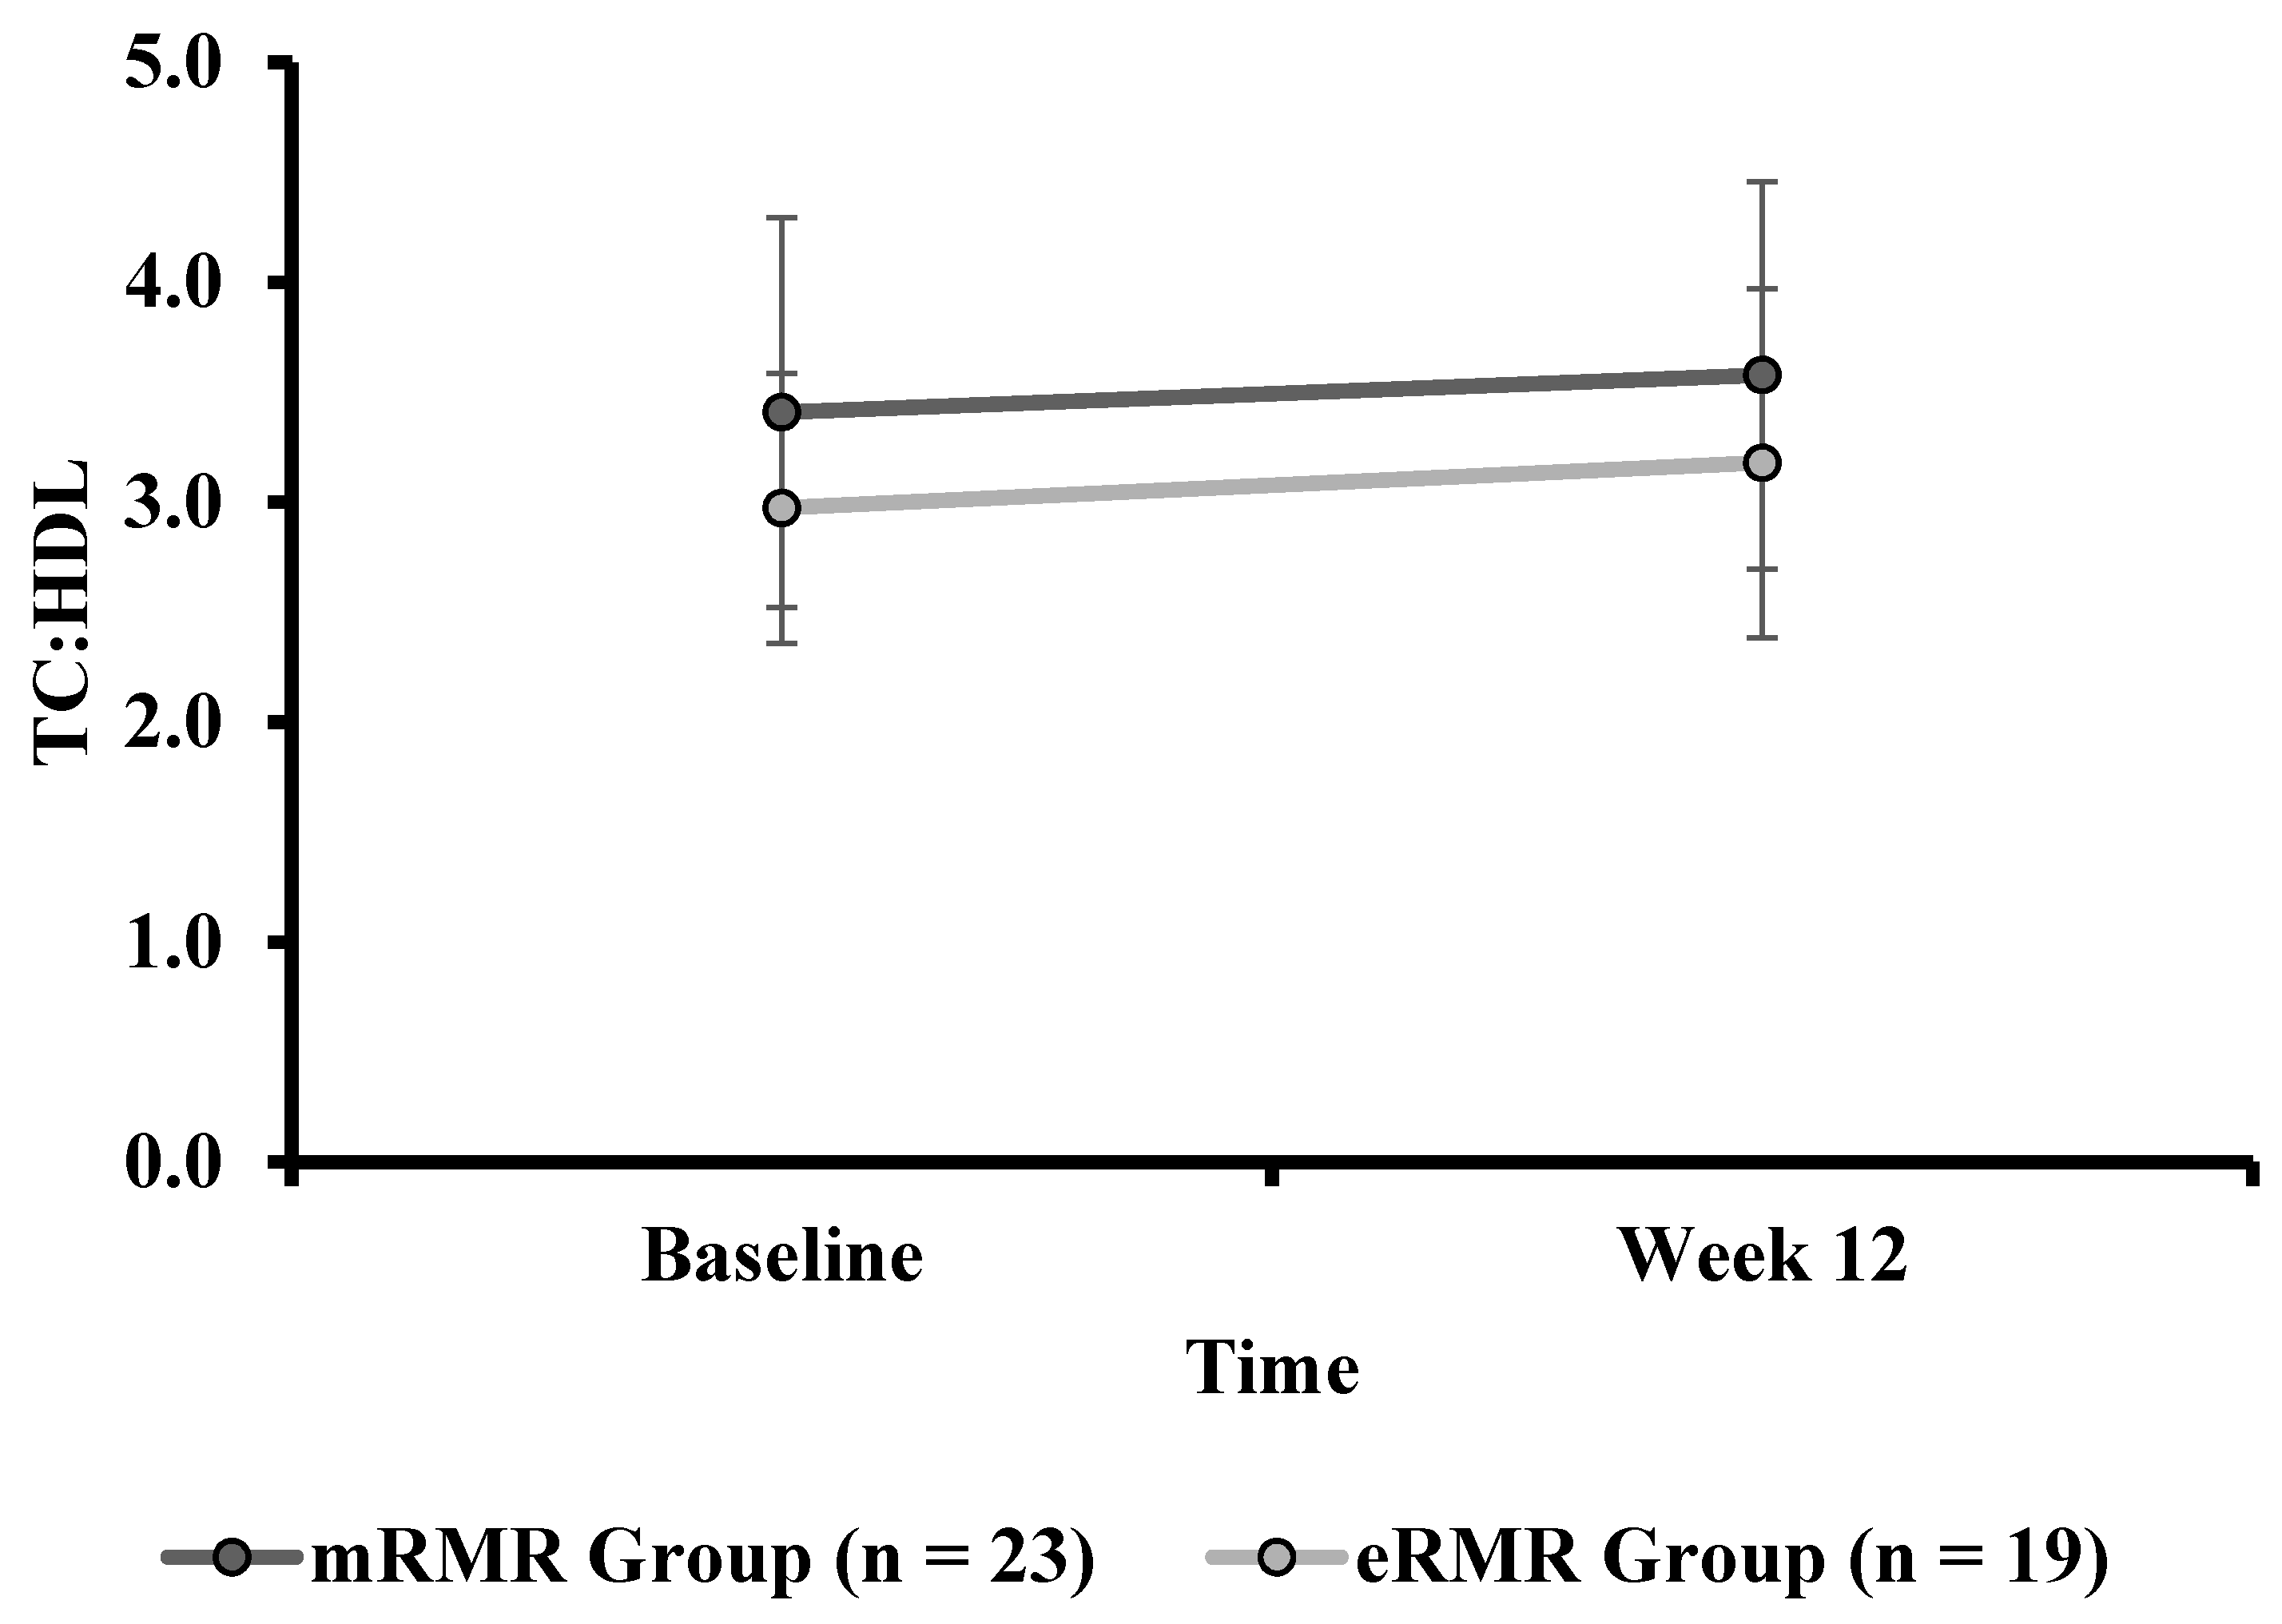
3.15. Total Cholesterol to High-Density Lipoprotein Ratio
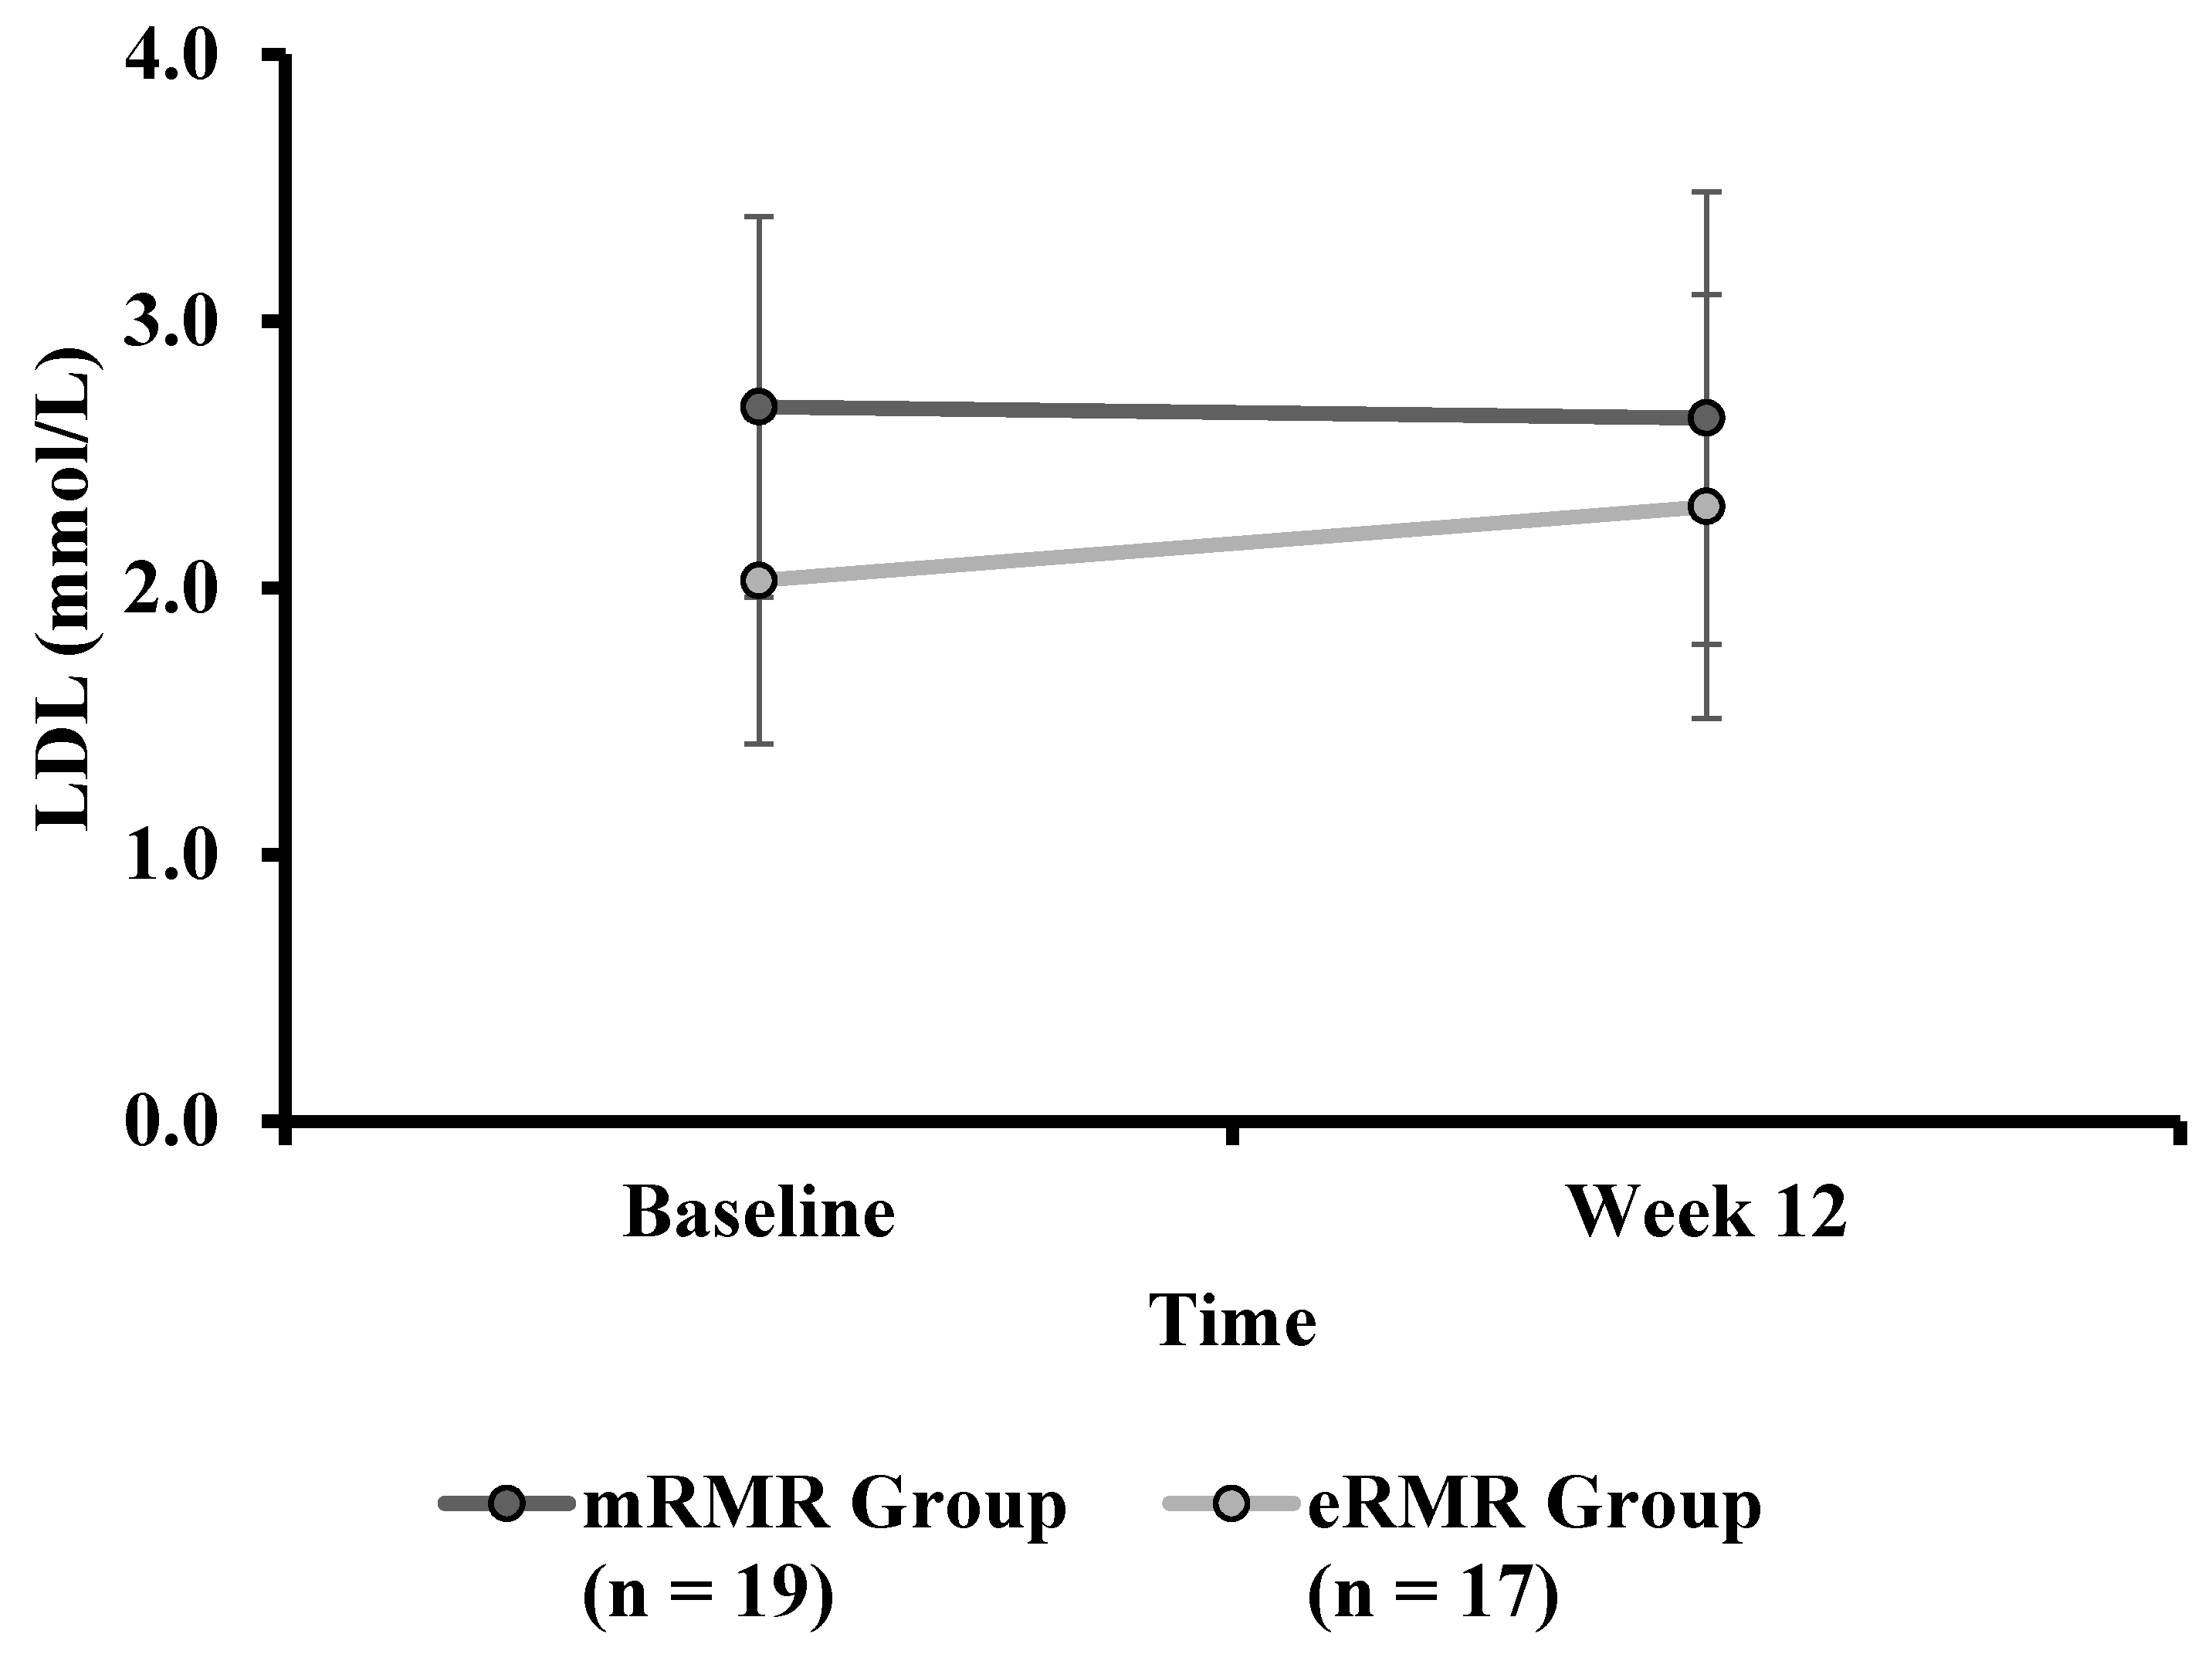
3.16. Low-Density Lipoprotein
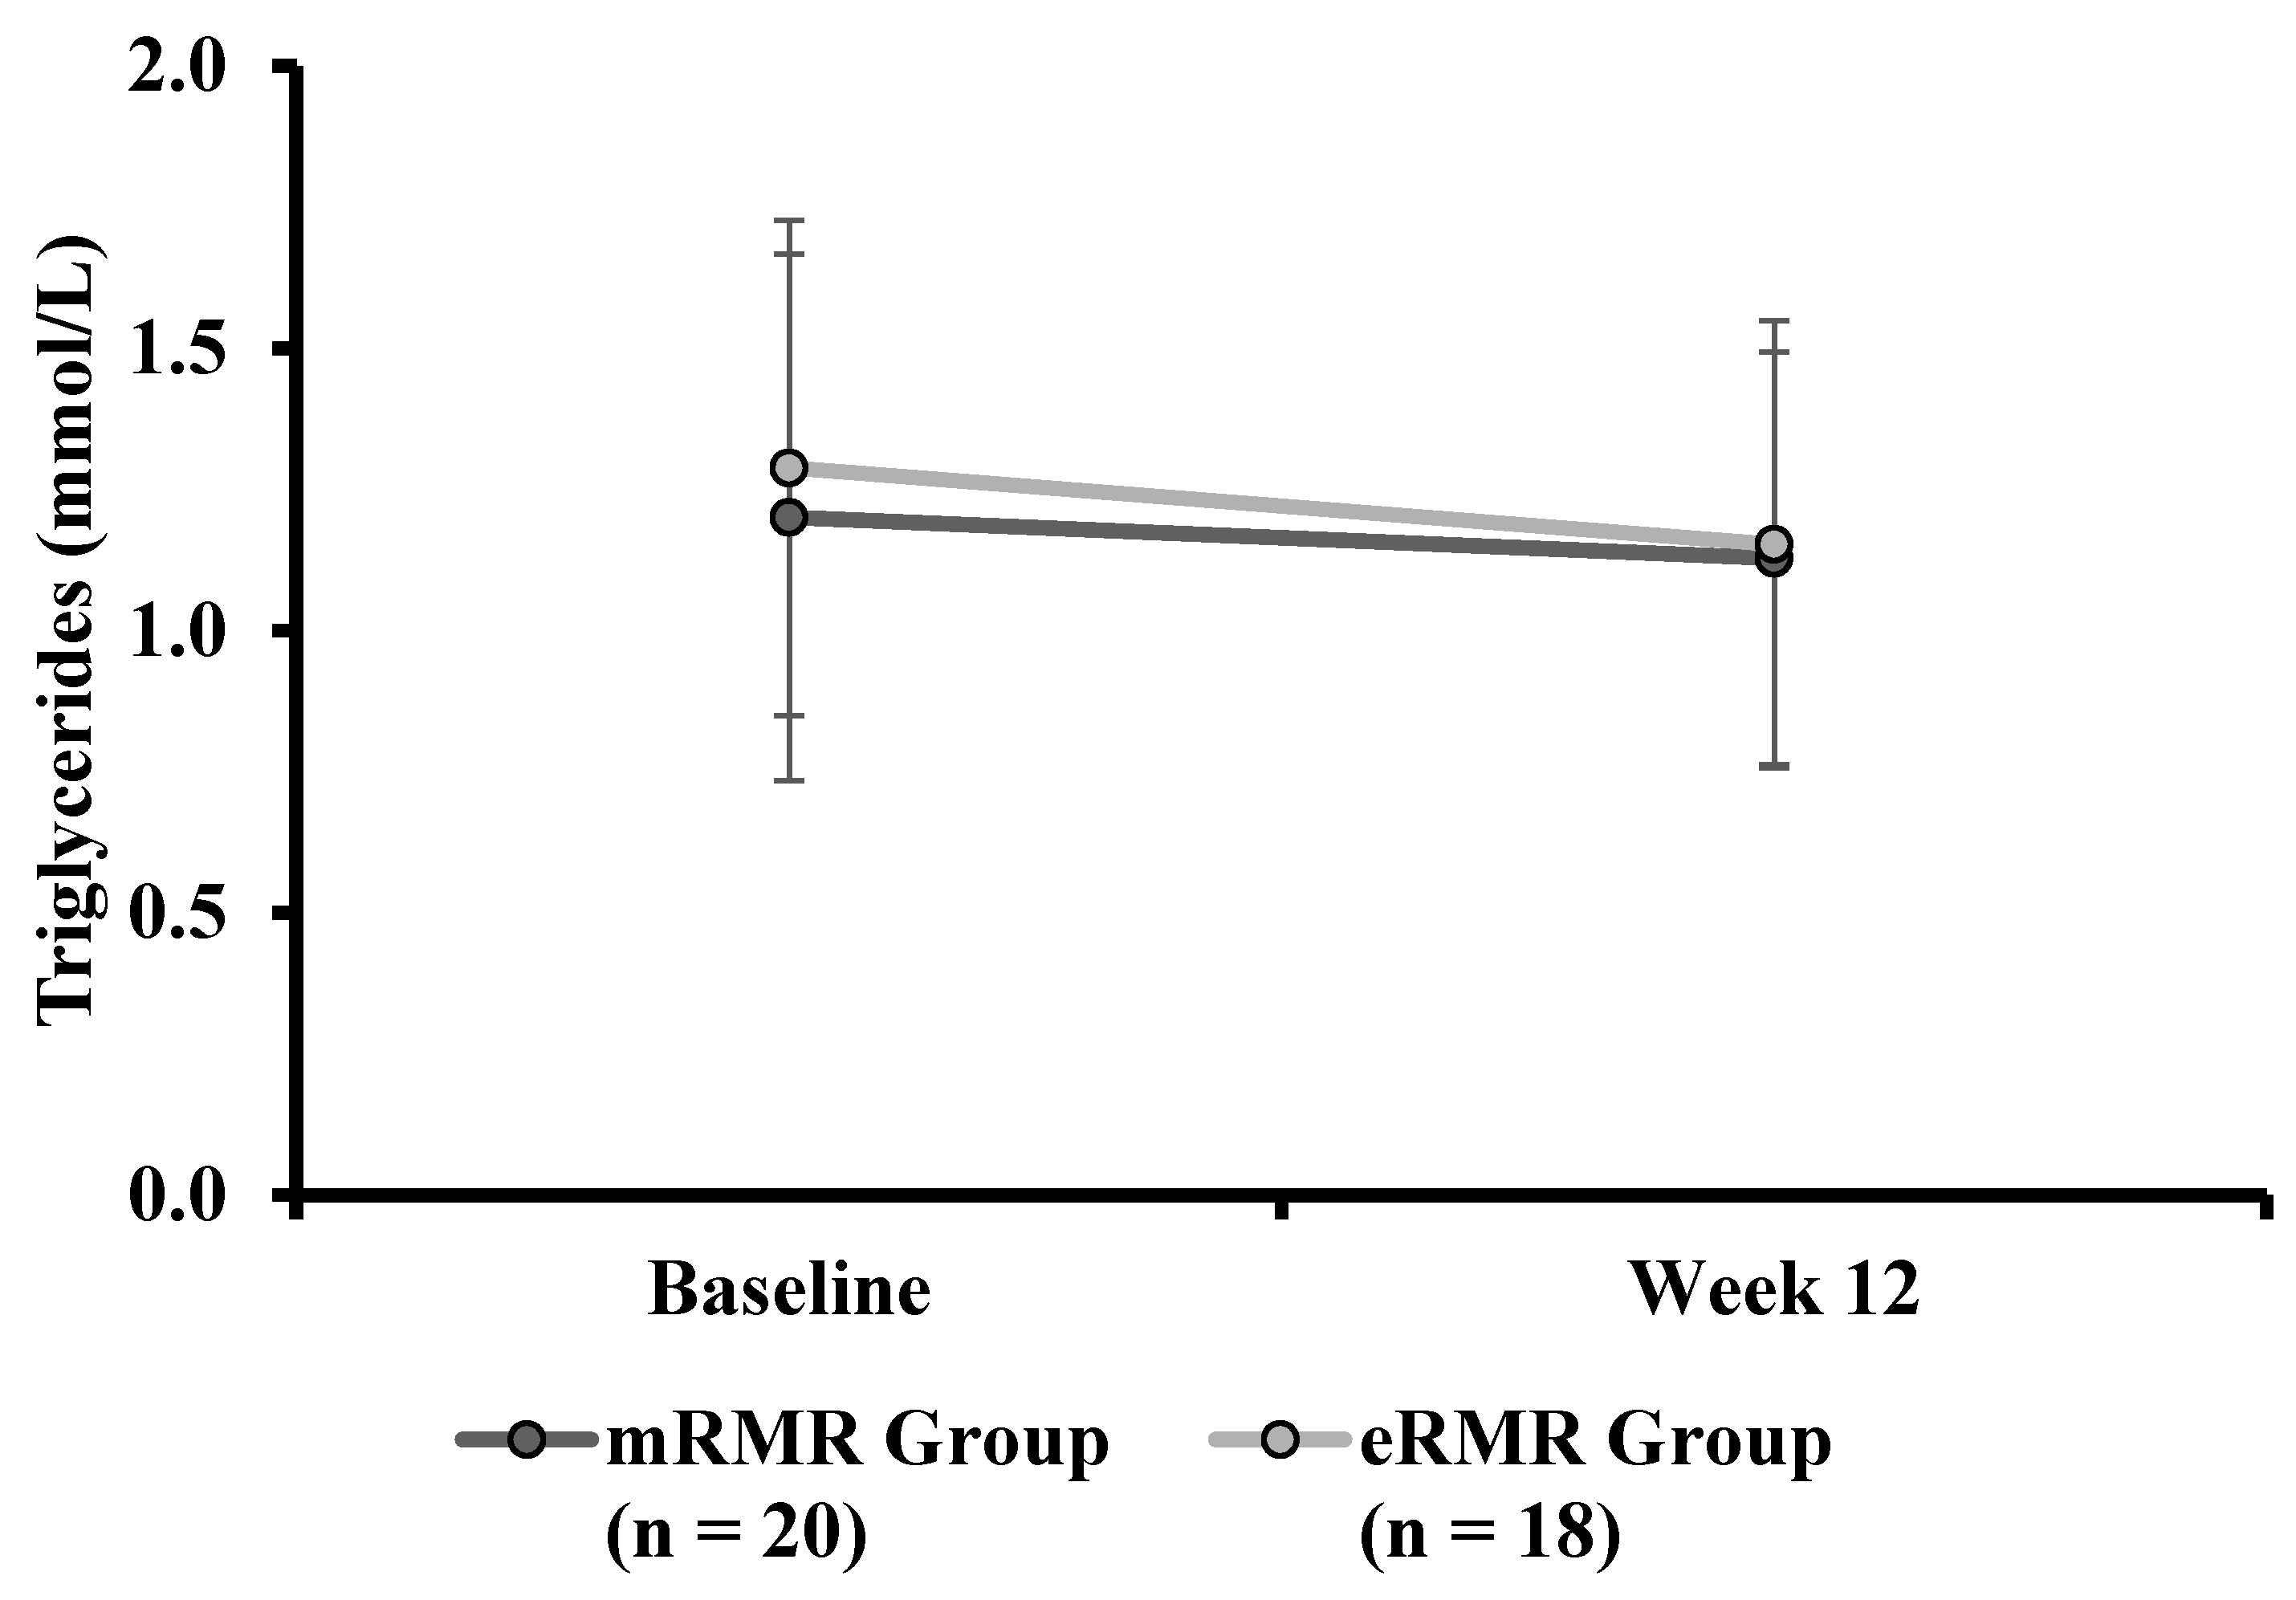
3.17. Triglycerides
3.18. Energy Intake
3.19. Measured Resting Metabolic Rate
3.20. Respiratory Exchange Ratio
3.21. Predicted Resting Metabolic Rate
4. Discussion
4.1. Strengths of Study
4.2. Limitations
4.3. Future Direction
5. Conclusions
Supplementary Materials
Author Contributions
Funding
Institutional Review Board Statement
Informed Consent Statement
Data Availability Statement
Acknowledgments
Conflicts of Interest
References
- Donoghue, O.; Dooley, C.; Feeney, J.; Finucane, C.; Hudson, E.; Kenny, R.A.; Leahy, S.; McCrory, C.; McGarrigle, C.; McHugh, S.; et al. The Over 50s in a Changing Ireland Economic Circumstances, Health and Well-Being; The Irish Longitudinal Study on Ageing: Dublin, Ireland, 2014; pp. 86–103. [Google Scholar]
- Cowley, M.A.; Brown, W.A.; Considine, R.V. Obesity: The problem and its management. In Endocrinology: Adult & Pediatric; Elsevier: Amsterdam, The Netherlands, 2016; pp. 468–478. [Google Scholar]
- Soysal, P.; Bulut, E.A.; Yavuz, I.; Isik, A.T. Decreased Basal Metabolic Rate Can Be an Objective Marker for Sarcopenia and Frailty in Older Males. J. Am. Med Dir. Assoc. 2019, 20, 58–63. [Google Scholar] [CrossRef] [PubMed]
- Lee, T.C.; Jin, Z.; Homma, S.; Nakanishi, K.; Elkind, M.S.; Rundek, T.; Tugcu, A.; Matsumoto, K.; Sacco, R.L.; Di Tullio, M.R. Changes in Left Ventricular Mass and Geometry in the Older Adults: Role of Body Mass and Central Obesity. J. Am. Soc. Echocardiogr. 2019, 32, 1318–1325. [Google Scholar] [CrossRef]
- Tsigos, C.; Hainer, V.; Basdevant, A.; Finer, N.; Fried, M.; Mathus-Vliegen, E.; Micic, A.; Maislos, M.; Roman, G.; Schutz, Y.; et al. Management of obesity in adults: European clinical practice guidelines. Obes. Facts 2008, 1, 106–116. [Google Scholar] [CrossRef] [PubMed]
- Stegenga, H.; Haines, A.; Jones, K.; Wilding, J.; On behalf of the Guideline Development Group. Identification, assessment, and management of overweight and obesity: Summary of updated NICE guidance. BMJ 2014, 349, g6608. [Google Scholar] [CrossRef] [PubMed] [Green Version]
- Yumuk, V.; Tsigos, C.; Fried, M.P.; Schindler, K.; Busetto, L.; Micic, D.; Toplak, H. European Guidelines for Obesity Management in Adults. Obes. Facts 2015, 8, 402–424. [Google Scholar] [CrossRef]
- Villareal, D.T.; Apovian, C.M.; Kushner, R.F.; Klein, S. Obesity in Older Adults: Technical Review and Position Statement of the American Society for Nutrition and NAASO, The Obesity Society. Obes. Res. 2005, 13, 1849–1863. [Google Scholar] [CrossRef]
- National Institute for Health Care Excellence. Overview | Obesity: Identification, Assessment and Management. Available online: https://www.nice.org.uk/guidance/cg189 (accessed on 7 April 2021).
- Raynor, H.A.; Champagne, C.M. Position of the Academy of Nutrition and Dietetics: Interventions for the Treatment of Overweight and Obesity in Adults. J. Acad. Nutr. Diet. 2016, 116, 129–147. [Google Scholar] [CrossRef]
- Von Loeffelholz, C.; Birkenfeld, A. The Role of Non-Exercise Activity Thermogenesis in Human Obesity, in Endotext. 2018. Available online: https://www.ncbi.nlm.nih.gov/books/NBK279077/ (accessed on 7 April 2021).
- Levine, J.A. Measurement of energy expenditure. Public Heal. Nutr. 2005, 8, 1123–1132. [Google Scholar] [CrossRef] [PubMed]
- Volp, A.C.P.; De Oliveira, F.C.E.; Alves, R.D.M.; Esteves, E.A.; Bressan, J. Energy expenditure: Components and evaluation methods. Nutr. Hosp. 2011, 26, 430–440. [Google Scholar]
- Gupta, R.D.; Ramachandran, R.; Padmanaban Venkatesan, S.A.; Joseph, M.; Thomas, N. Indirect calorimetry: From bench to bedside. Indian J. Endocrinol. Metab. 2017, 21, 594. [Google Scholar]
- Miles-Chan, J.L.; Dulloo, A.G.; Schutz, Y. Fasting substrate oxidation at rest assessed by indirect calorimetry: Is prior die-tary macronutrient level and composition a confounder? Int. J. Obes. 2015, 39, 1114–1117. [Google Scholar] [CrossRef] [Green Version]
- Purdom, T.; Kravitz, L.; Dokladny, K.; Mermier, C. Understanding the factors that effect maximal fat oxidation. J. Int. Soc. Sports Nutr. 2018, 15, 1–10. [Google Scholar] [CrossRef] [Green Version]
- Kelley, D.E. Skeletal muscle fat oxidation: Timing and flexibility are everything. J. Clin. Investig. 2005, 115, 1699–1702. [Google Scholar] [CrossRef] [Green Version]
- Houmard, J.A. Intramuscular lipid oxidation and obesity. Am. J. Physiol. Integr. Comp. Physiol. 2008, 294, R1111–R1116. [Google Scholar] [CrossRef] [PubMed] [Green Version]
- Lanzi, S.; Codecasa, F.; Cornacchia, M.; Maestrini, S.; Salvadori, A.; Brunani, A.; Malatesta, D. Fat Oxidation, Hormonal and Plasma Metabolite Kinetics during a Submaximal Incremental Test in Lean and Obese Adults. PLoS ONE 2014, 9, e88707. [Google Scholar] [CrossRef] [PubMed] [Green Version]
- Rezuş, E.; Burlui, A.; Cardoneanu, A.; Rezuş, C.; Codreanu, C.; Pârvu, M.; Zota, G.R.; Tamba, B.I. Inactivity and Skeletal Muscle Metabolism: A Vicious Cycle in Old Age. Int. J. Mol. Sci. 2020, 21, 592. [Google Scholar] [CrossRef] [PubMed] [Green Version]
- Marra, M.; Scalfi, L.; Contaldo, F.; Pasanisi, F. Fasting Respiratory Quotient as a Predictor of Long-Term Weight Changes in Non-Obese Women. Ann. Nutr. Metab. 2004, 48, 189–192. [Google Scholar] [CrossRef] [PubMed]
- Fabbri, E.; Shaffer, N.C.; Gonzalez-Freire, M.; Shardell, M.D.; Zoli, M.; Studenski, S.A.; Ferrucci, L. Early body composition, but not body mass, is associated with future accelerated decline in muscle quality. J. Cachex Sarcopenia Muscle 2017, 8, 490–499. [Google Scholar] [CrossRef] [Green Version]
- Ruiz, J.R.; Ortega, F.B.; Rodríguez, G.; Alkorta, P.; Labayen, I. Validity of Resting Energy Expenditure Predictive Equations before and after an Energy-Restricted Diet Intervention in Obese Women. PLoS ONE 2011, 6, e23759. [Google Scholar] [CrossRef] [Green Version]
- Alves, V.G.F.; da Rocha EE, M.; Gonzalez, M.C.; da Fonseca RB, V.; do Nascimento Silva, M.H.; Chiesa, C.A. Assessement of resting energy expenditure of obese patients: Comparison of indirect calorimetry with formulae. Clin. Nutr. 2009, 28, 299–304. [Google Scholar] [CrossRef]
- Madden, A.; Mulrooney, H.M.; Shah, S. Estimation of energy expenditure using prediction equations in overweight and obese adults: A systematic review. J. Hum. Nutr. Diet. 2016, 29, 458–476. [Google Scholar] [CrossRef] [Green Version]
- Tallon, J.M.; Narciso, J.; Saavedra, R.; Silva, A.J.; Barros, A.; da Costa, A.M. Comparison of predictive equations for resting metabolic rate in Portuguese women. Motricidade 2020, 16, 74–83. [Google Scholar]
- Weijs, P.J.M. Validity of predictive equations for resting energy expenditure in US and Dutch overweight and obese class I and II adults aged 18–65 y. Am. J. Clin. Nutr. 2008, 88, 959–970. [Google Scholar] [CrossRef] [Green Version]
- Mifflin, M.D.; Jeor, S.T.S.; Hill, L.A.; Scott, B.J.; Daugherty, S.A.; Koh, Y.O. A new predictive equation for resting energy expenditure in healthy individuals. Am. J. Clin. Nutr. 1990, 51, 241–247. [Google Scholar] [CrossRef] [PubMed]
- Frankenfield, D.; Roth-Yousey, L.; Compher, C. Comparison of Predictive Equations for Resting Metabolic Rate in Healthy Nonobese and Obese Adults: A Systematic Review. J. Am. Diet. Assoc. 2005, 105, 775–789. [Google Scholar] [CrossRef] [PubMed]
- Jeor, S.T.S.; Cutter, G.R.; Perumean-Chaney, S.E.; Hall, S.J.; Herzog, H.; Bovee, V. The Practical Use of Charts to Estimate Resting Energy Expenditure in Adults. Top. Clin. Nutr. 2004, 19, 51–56. [Google Scholar] [CrossRef]
- Zampino, M.; Semba, R.D.; Adelnia, F.; Spencer, R.G.; Fishbein, K.W.; Schrack, J.A.; Simonsick, E.M.; Ferrucci, L. Greater Skeletal Muscle Oxidative Capacity Is Associated With Higher Resting Metabolic Rate: Results From the Baltimore Longitudinal Study of Aging. J. Gerontol. Ser. A Boil. Sci. Med Sci. 2020, 75, 2262–2268. [Google Scholar] [CrossRef] [PubMed] [Green Version]
- Knuth, N.D.; Johannsen, D.L.; Tamboli, R.A.; Marks-Shulman, P.A.; Huizenga, R.; Chen, K.Y.; Abumrad, N.N.; Ravussin, E.; Hall, K.D. Metabolic adaptation following massive weight loss is related to the degree of energy imbalance and changes in circulating leptin. Obesity 2014, 22, 2563–2569. [Google Scholar] [CrossRef] [PubMed] [Green Version]
- Geisler, C.; Braun, W.; Pourhassan, M.; Schweitzer, L.; Glüer, C.-C.; Bosy-Westphal, A.; Müller, M.J. Age-Dependent Changes in Resting Energy Expenditure (REE): Insights from Detailed Body Composition Analysis in Normal and Overweight Healthy Caucasians. Nutrients 2016, 8, 322. [Google Scholar] [CrossRef] [Green Version]
- Abizanda, P.; Romero, L.; Sánchez-Jurado, P.M.; Ruano, T.F.; Ríos, S.S.; Sánchez, M.F. Energetics of Aging and Frailty: The FRADEA Study. J. Gerontol. Ser. A Boil. Sci. Med Sci. 2016, 71, 787–796. [Google Scholar] [CrossRef] [Green Version]
- Redman, L.M.; Heilbronn, L.K.; Martin, C.K.; De Jonge, L.; Williamson, D.A.; Delany, J.P.; Ravussin, E.; Pennington CALERIE Team. Metabolic and Behavioral Compensations in Response to Caloric Restriction: Implications for the Maintenance of Weight Loss. PLoS ONE 2009, 4, e4377. [Google Scholar] [CrossRef] [Green Version]
- Galgani, J.E.; Santos, J.L. Insights about weight loss-induced metabolic adaptation. Obesity 2016, 24, 277–278. [Google Scholar] [CrossRef] [Green Version]
- Redman, L.M.; Smith, S.R.; Burton, J.H.; Martin, C.K.; Il’Yasova, D.; Ravussin, E. Metabolic Slowing and Reduced Oxidative Damage with Sustained Caloric Restriction Support the Rate of Living and Oxidative Damage Theories of Aging. Cell Metab. 2018, 27, 805–815.e4. [Google Scholar] [CrossRef] [Green Version]
- Most, J.; Redman, L.M. Impact of calorie restriction on energy metabolism in humans. Exp. Gerontol. 2020, 133, 110875. [Google Scholar] [CrossRef]
- Stiegler, P.; Cunliffe, A. The Role of Diet and Exercise for the Maintenance of Fat-Free Mass and Resting Metabolic Rate During Weight Loss. Sports Med. 2006, 36, 239–262. [Google Scholar] [CrossRef] [PubMed]
- Johnstone, A.M.; Murison, S.D.; Duncan, J.S.; Rance, K.A.; Speakman, J.R. Factors influencing variation in basal metabolic rate include fat-free mass, fat mass, age, and circulating thyroxine but not sex, circulating leptin, or triiodothyronine. Am. J. Clin. Nutr. 2005, 82, 941–948. [Google Scholar] [CrossRef] [PubMed] [Green Version]
- Craig, C.L.; Marshall, A.L.; Sjöström, M.; Bauman, A.E.; Booth, M.L.; Ainsworth, B.E.; Pratt, M.; Ekelund, U.; Yngve, A.; Sallis, J.F.; et al. International Physical Activity Questionnaire: 12-Country Reliability and Validity. Med. Sci. Sports Exerc. 2003, 35, 1381–1395. [Google Scholar] [CrossRef] [Green Version]
- Nutritics. References. 2020. Available online: https://www.nutritics.com/p/home (accessed on 7 April 2021).
- Food Safety Authority of Ireland. Healthy Eating, Food Safety and Food Legislation—A Guide Supporting the Healthy Ireland Food Pyramid; Food Safety Authority of Ireland Healthy Ireland, Department of Health, the Health Service Executive (HSE), Eds.; The Food Safety Authority of Ireland (FSAI): Dublin, Ireland, 2019. [Google Scholar]
- Healthy Ireland and Health Service Executive. Get Ireland Walking: Walk for Health| Walk for Fun| Walk for Life; Healthy Ireland, Health Service Executive: Dublin, Ireland, 2019. [Google Scholar]
- Eston, R.; Reilly, T. Kinanthropometry and Exercise Physiology Laboratory Manual: Test, Procedures and Data, 3rd ed.; Volume One: Anthropometry; Routledge: Oxon, UK, 2009. [Google Scholar]
- Massarini, S.; Ferrulli, A.; Ambrogi, F.; Macrì, C.; Terruzzi, I.; Benedini, S.; Luzi, L. Routine resting energy expenditure measurement increases effectiveness of dietary intervention in obesity. Acta Diabetol. 2018, 55, 75–85. [Google Scholar] [CrossRef] [PubMed]
- McDoniel, S.O.; Nelson, H.A.; Thomson, C.A. Employing RMR Technology in a 90-Day Weight Control Program. Obes. Facts 2008, 1, 298–304. [Google Scholar] [CrossRef] [PubMed]
- Harris, J.A.; Benedict, F.G. A Biometric Study of Human Basal Metabolism. Proc. Natl. Acad. Sci. USA 1918, 4, 370–373. [Google Scholar] [CrossRef] [Green Version]
- Cerra, F.B.; Benitez, M.R.; Blackburn, G.L.; Irwin, R.S.; Jeejeebhoy, K.; Katz, D.P.; Pingleton, S.K.; Pomposelli, J.; Rombeau, J.L.; Shronts, E.; et al. Applied Nutrition in ICU Patients: A Consensus Statement of the American College of Chest Physicians. Chest 1997, 111, 769–778. [Google Scholar] [CrossRef] [Green Version]
- Sabounchi, N.S.; Rahmandad, H.; Ammerman, A. Best-fitting prediction equations for basal metabolic rate: Informing obesity interventions in diverse populations. Int. J. Obes. 2013, 37, 1364–1370. [Google Scholar] [CrossRef] [Green Version]
- Flack, K.D.; Siders, W.A.; Johnson, L.; Roemmich, J.N. Cross-Validation of Resting Metabolic Rate Prediction Equations. J. Acad. Nutr. Diet. 2016, 116, 1413–1422. [Google Scholar] [CrossRef] [Green Version]
- McDoniel, S.O.; Hammond, R.S. A 24-week randomised controlled trial comparing usual care and metabolic-based diet plans in obese adults. Int. J. Clin. Pr. 2010, 64, 1503–1511. [Google Scholar] [CrossRef]
- McDoniel, S.O.; Wolskee, P.; Shen, J. Treating obesity with a novel hand-held device, computer software program, and In-ternet technology in primary care: The SMART motivational trial. Patient Educ. Couns. 2010, 79, 185–191. [Google Scholar] [CrossRef] [PubMed]
- Harsha, D.W.; Bray, G.A. Response to Weight Loss and Blood Pressure Control: The Pro Side. Hypertension 2008, 51, 1420–1425. [Google Scholar] [CrossRef] [Green Version]
- Kromhout, D.; Spaaij, C.J.K.; De Goede, J.; Weggemans, R.M. The 2015 Dutch food-based dietary guidelines. Eur. J. Clin. Nutr. 2016, 70, 869–878. [Google Scholar] [CrossRef] [PubMed]
- Zinn, C.; McPhee, J.; Harris, N.K.; Williden, M.; Prendergast, K.; Schofield, G. A 12-week low-carbohydrate, high-fat diet improves metabolic health outcomes over a control diet in a randomised controlled trial with overweight defence force personnel. Appl. Physiol. Nutr. Metab. 2017, 42, 1158–1164. [Google Scholar] [CrossRef] [Green Version]
- Davis, C.S.; Clarke, R.; Coulter, S.N.; Rounsefell, K.N.; Walker, R.E.; Rauch, C.; Huggins, C.E.; Ryan, L. Intermittent energy restriction and weight loss: A systematic review. Eur. J. Clin. Nutr. 2015, 70, 292–299. [Google Scholar] [CrossRef] [PubMed]
- Chomentowski, P.; Dubé, J.J.; Amati, F.; Stefanovic-Racic, M.; Zhu, S.; Toledo, F.G.; Goodpaster, B.H. Moderate exercise attenuates the loss of skeletal muscle mass that occurs with intentional caloric re-striction–induced weight loss in older, overweight to obese adults. J. Gerontol. Ser. A Biomed. Sci. Med Sci. 2009, 64, 575–580. [Google Scholar] [CrossRef] [Green Version]
- Trexler, E.T.; Smith-Ryan, A.E.; Norton, L.E. Metabolic adaptation to weight loss: Implications for the athlete. J. Int. Soc. Sports Nutr. 2014, 11, 7. [Google Scholar] [CrossRef] [PubMed] [Green Version]
- MacKenzie-Shalders, K.; Kelly, J.T.; So, D.; Coffey, V.G.; Byrne, N.M. The effect of exercise interventions on resting metabolic rate: A systematic review and me-ta-analysis. J. Sports Sci. 2020, 38, 1635–1649. [Google Scholar] [CrossRef] [PubMed]
- Gibson, A.A.; Sainsbury, A. Strategies to Improve Adherence to Dietary Weight Loss Interventions in Research and Re-al-World Settings. Behav. Sci. 2017, 7, 44. [Google Scholar] [CrossRef] [PubMed] [Green Version]
- Aronica, L.; Rigdon, J.; Offringa, L.C.; Stefanick, M.L.; Gardner, C.D. Examining differences between overweight women and men in 12-month weight loss study comparing healthy low-carbohydrate vs. low-fat diets. Int. J. Obes. 2021, 45, 225–234. [Google Scholar] [CrossRef]
- Harvey, J.; Krukowski, R.; Priest, J.; West, D. Log Often, Lose More: Electronic Dietary Self-Monitoring for Weight Loss. Obesity 2019, 27, 380–384. [Google Scholar] [CrossRef] [PubMed] [Green Version]
- McGowan, B.M. A Practical Guide to Engaging Individuals with Obesity. Obes. Facts 2016, 9, 182–192. [Google Scholar] [CrossRef]


| n | mRMR Group | n | eRMR Group | p Value | |
|---|---|---|---|---|---|
| Sex males (M) females (F) | M10/F19 | M15/F10 | |||
| Age (years) | 29 | 56.7 ± 5.3 | 25 | 58.6 ± 7.1 | |
| Height (cm) | 29 | 170.3 ± 9.5 | 25 | 173.1 ± 8.8 | |
| Weight (kg) | 29 | 88.5 (81.0, 94.8) | 25 | 92.9 (81.0, 98.9) | † p = 0.32 |
| BMI (kg/m2) | 29 | 29.3 (26.8, 33.4) | 25 | 29.5 (27.7, 32.6) | † p = 0.23 |
| WC (cm) | 28 | 106.0 (99.3, 115.3) | 25 | 112.5 (102.5, 116.0) | † p = 0.67 |
| HC (cm) | 28 | 112.3 (106.0, 126.1) | 25 | 113.0 (107.3, 123.0) | † p = 0.98 |
| WHR | 28 | 0.9 ± 0.1 | 25 | 1.0 ± 0.1 | ᶲ p = 0.15 |
| Body Fat (%) | 29 | 37.5 ± 8.6 | 25 | 35.7 ± 7.5 | † p = 0.42 |
| Muscle Mass (kg) | 29 | 49.1 (45.1, 63.0) | 25 | 59.6 (44.6, 67.3) | ᶲ p = 0.22 |
| BPsys (mmHg) | 29 | 126.0 (115.5, 136.0) | 25 | 135.0 (124.0, 151.0) | † p = 0.04 |
| BPdia (mmHg) | 29 | 83.0 (74.5, 87.5) | 25 | 87.0 (78.0, 92.0) | † p = 0.10, |
| Glucose (mmol/L) | 28 | 4.9 (4.5, 5.5) | 25 | 5.3 (4.5, 5.8) | † p = 0.45 |
| TC (mmol/L) | 28 | 4.7 (4.1, 5.3) | 22 | 3.9 (3.5, 4.5) | † p = 0.02 |
| HDL (mmol/L) | 28 | 1.3 (1.1, 1.8) | 23 | 1.2 (1.1, 1.6) | † p = 0.76 |
| TC:HDL Ratio | 28 | 3.4 (2.6, 4.1) | 21 | 3.0 (2.4, 3.4) | † p = 0.08 |
| LDL (mmol/L) | 24 | 2.8 (2.5, 3.1) | 19 | 2.2 (1.7, 2.6) | † p = 0.00 |
| TG (mmol/L) | 25 | 1.1 (0.9, 1.4) | 19 | 1.2 (1.0, 1.6) | † p = 0.34 |
| mRMR (kcal) | 29 | 1604.0 (1374.0, 2011.5) | 23 | 1691.0 (1455.0, 2067.0) | † p = 0.80 |
| RER | 29 | 0.8 (0.7, 0.9) | 23 | 0.8 (0.7, 0.9) | † p = 0.38 |
| eRMR kcal | 29 | 1560.3 ± 221.7 | 24 | 1639.3 ± 272.2 | ᶲ p = 0.25 |
| Energy Intake (kcal) | 21 | 2195.0 (1863.5, 2755.0) | 19 | 2129.0 (1880.0, 2586.0) | † p = 0.68 |
| mRMR Group | eRMR Group | ||||||||||||
|---|---|---|---|---|---|---|---|---|---|---|---|---|---|
| n | Baseline | Week 3 | Week 6 | Week 12 | n | Baseline | Week 3 | Week 6 | Week 12 | Time Effect, p | Group Effect, p | Time-by-Group Interaction, p | |
| Weight (kg) | 22 | 89.0 ± 13.6 | 87.3 ± 13.7 | 86.7 ± 13.6 | 86.0 ± 13.7 | 17 | 93.7 ± 18.7 | 92.0 ± 17.8 | 90.5 ± 17.0 | 90.7 ± 17.8 | p < 0.0005 * | p = 0.38 | p = 0.52 |
| BMI (kg/m2) | 24 | 30.4 ± 5.2 | 29.4 ± 5.2 | 23 | 31.1 ± 4.4 | 30.4 ± 4.0 | p < 0.0005 * | p = 0.53 | p = 0.57 | ||||
| WC (cm) | 23 | 109.0 ± 13.9 | 98.2 ± 11.8 | 23 | 113.2 ± 12.3 | 105.5 ± 11.1 | p < 0.0005 * | p = 0.10 | p = 0.22 | ||||
| HC (cm) | 23 | 117.2 ± 14.5 | 108.6 ± 10.4 | 23 | 117.0 ± 13.7 | 108.8 ± 8.1 | p < 0.0005 * | p = 0.99 | p = 0.92 | ||||
| WHR | 23 | 0.9 ± 0.1 | 0.9 ± 0.1 | 23 | 1.0 ± 0.1 | 1.0 ± 0.1 | p = 0.05 * | p = 0.02 * | p = 0.12 | ||||
| Body Fat (%) | 22 | 36.5 ± 9.2 | 36.7 ± 9.6 | 35.3 ± 9.5 | 36.9 ± 11.3 | 17 | 36.3 ± 7.0 | 35.3 ± 7.7 | 35.0 ± 7.2 | 35.6 ± 7.7 | |||
| Muscle Mass (kg) | 22 | 54.0 ± 11.7 | 52.7 ± 11.8 | 53.4 ± 11.4 | 51.8 ± 12.8 | 17 | 57.2 ± 13.3 | 56.9 ± 12.9 | 56.5 ± 13.3 | 56.0 ± 13.2 | p < 0.0005 * | p = 0.36 | p = 0.37 |
| BPsys (mmHg) | 23 | 124.0 ± 15.4 | 121.2 ± 14.3 | 23 | 137.8 ± 20.5 | 130.8 ± 16.2 | p < 0.0005 * | p = 0.01 * | p = 0.30 | ||||
| BPdia (mmHg) | 23 | 81.2 ± 11.7 | 77.9 ± 9.0 | 23 | 86.7 ± 9.8 | 83.8 ± 9.7 | p < 0.0005 * | p = 0.04 | p = 0.88 | ||||
| mRMR Group | eRMR Group | ||||||||
|---|---|---|---|---|---|---|---|---|---|
| n | Baseline | Week 12 | n | Baseline | Week 12 | Time Effect, p | Group Effect, p | Time-by-Group Interaction, p | |
| Weight (kg) | 24 | 88.0 ± 13.7 | 85.2 ± 13.6 | 23 | 93.5 ± 17.4 | 91.4 ± 16.8 | p < 0.0005 * | p = 0.20 | p = 0.56 |
| mRMR Group | eRMR Group | ||||||||
|---|---|---|---|---|---|---|---|---|---|
| n | Baseline | Week 12 | n | Baseline | Week 12 | Time Effect, p | Group Effect, p | Time-by-Group Interaction, p | |
| Glucose (mmol/L) | 23 | 5.0 ± 0.7 | 4.7 ± 0.7 | 22 | 5.4 ± 0.9 | 5.1 ± 0.8 | p < 0.0005 * | p = 0.08 | p = 0.74 |
| TC (mmol/L) | 23 | 4.5 ± 1.1 | 4.4 ± 1.0 | 20 | 4.1 ± 0.7 | 4.2 ± 0.9 | p = 0.92 | p = 0.18 | p = 0.45 |
| HDL (mmol/L) | 23 | 1.4 ± 0.4 | 1.3 ± 0.4 | 21 | 1.4 ± 0.4 | 1.3 ± 0.3 | p < 0.0005 * | p = 0.91 | p = 0.15 |
| TC:HDL Ratio | 23 | 3.4 ± 0.9 | 3.6 ± 0.9 | 19 | 3.0 ± 0.6 | 3.2 ± 0.8 | p = 0.09 | p = 0.07 | p = 0.87 |
| LDL (mmol/L) | 19 | 2.7 ± 0.7 | 2.6 ± 0.8 | 17 | 2.0 ± 0.6 | 2.3 ± 0.8 | p = 0.43 | p = 0.02 * | p = 0.28 |
| TG (mmol/L) | 20 | 1.2 ± 0.5 | 1.1 ± 0.4 | 18 | 1.3 ± 0.4 | 1.2 ± 0.4 | p = 0.16 | p = 0.63 | p = 0.67 |
| Variable | mRMR Group | eRMR Group | |||||||||||
|---|---|---|---|---|---|---|---|---|---|---|---|---|---|
| n | Baseline | Week 3 | Week 6 | Week 12 | n | Baseline | Week 3 | Week 6 | Week 12 | Time Effect, p | Group Effect, p | Time-by-Group Interaction, p | |
| mRMR (kcal) | 22 | 1764.3 ± 547.6 | 1687.7 ± 505.8 | 1737.8 ± 475.1 | 1688.3 ± 454.6 | 16 | 1813.8 ± 410.4 | 1688.8 ± 469.6 | 1787.4 ± 566.5 | 1780.5 ± 518.8 | p = 0.22 | p = 0.38 | p = 0.75 |
| RER | 22 | 0.8 ± 0.2 | 0.8 ± 0.1 | 0.8 ± 0.1 | 0.8 ± 0.1 | 16 | 0.8 ± 0.1 | 0.8 ± 0.1 | 0.8 ± 0.1 | 0.8 ± 0.1 | p = 0.32 | p = 0.75 | p = 0.34 |
| eRMR (kcal) | 22 | 1578.5 ± 227.7 | 1576.0 ± 230.9 | 1553.7 ± 222.5 | 1547.0 ± 225.0 | 17 | 1656.9 ± 297.7 | 1648.4 ± 276.4 | 1624.1 ± 282.2 | 1625.5 ± 288.0 | p < 0.0005 * | p = 0.37 | p = 0.79 |
| eEI (kcal) | 15 | 2327.3 ± 827.1 | 1841.1 ± 534.3 | 15 | 2117.3 ± 562.8 | 1645.1 ± 433.3 | p < 0.0005 * | p = 0.28 | p = 0.96 | ||||
| Intervention Group | Sex | n | Baseline | Week 12 | Sex | n | Baseline | Week 12 | |
|---|---|---|---|---|---|---|---|---|---|
| eEI (kcal) | mRMR | M | 5 | 2462 ± 973 | 2052 ± 597 | F | 10 | 2260 ± 793 | 1736 ± 473 |
| eRMR | M | 8 | 2267 ± 724 | 1804 ± 445 | F | 15 | 1947 ± 253 | 1463 ± 367 |
| Intervention Group | Sex | n | Prescribed | Estimated Week 12 | Sex | n | Prescribed | Estimated Week 12 | |
|---|---|---|---|---|---|---|---|---|---|
| Energy Intake (kcal) | mRMR | M | 5 | 2180 ± 253 | 2052 ± 597 | F | 10 | 1584 ± 271 | 1736 ± 473 |
| eRMR | M | 8 | 2100 ± 236 | 1804 ± 445 | F | 15 | 1500 ± 141 | 1463 ± 367 |
Publisher’s Note: MDPI stays neutral with regard to jurisdictional claims in published maps and institutional affiliations. |
© 2021 by the authors. Licensee MDPI, Basel, Switzerland. This article is an open access article distributed under the terms and conditions of the Creative Commons Attribution (CC BY) license (https://creativecommons.org/licenses/by/4.0/).
Share and Cite
Cooney, C.; Daly, E.; McDonagh, M.; Ryan, L. Evaluation of Measured Resting Metabolic Rate for Dietary Prescription in Ageing Adults with Overweight and Adiposity-Based Chronic Disease. Nutrients 2021, 13, 1229. https://doi.org/10.3390/nu13041229
Cooney C, Daly E, McDonagh M, Ryan L. Evaluation of Measured Resting Metabolic Rate for Dietary Prescription in Ageing Adults with Overweight and Adiposity-Based Chronic Disease. Nutrients. 2021; 13(4):1229. https://doi.org/10.3390/nu13041229
Chicago/Turabian StyleCooney, Ciara, Ed Daly, Maria McDonagh, and Lisa Ryan. 2021. "Evaluation of Measured Resting Metabolic Rate for Dietary Prescription in Ageing Adults with Overweight and Adiposity-Based Chronic Disease" Nutrients 13, no. 4: 1229. https://doi.org/10.3390/nu13041229