
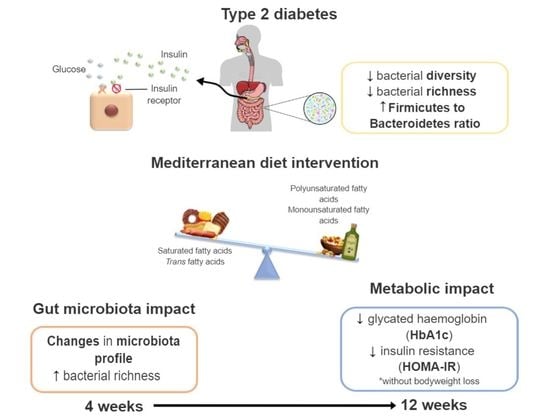
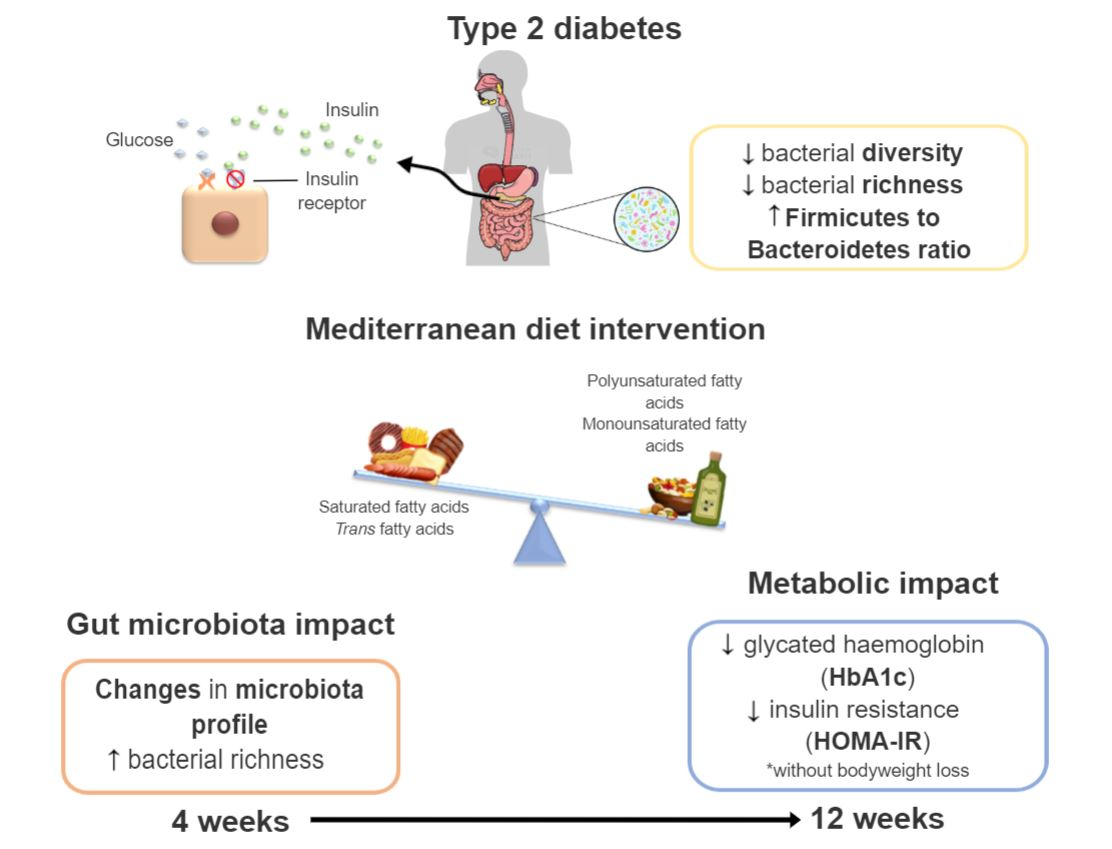
A Pilot Study on the Metabolic Impact of Mediterranean Diet in Type 2 Diabetes: Is Gut Microbiota the Key?


 , ,
, , 
 ,
, 
Abstract
1. Introduction
2. Materials and Methods
2.1. Study Design and Participants
2.2. Intervention
2.3. Outcomes
2.3.1. Anthropometric Measurements and Body Composition
2.3.2. Blood Pressure Assessment
2.3.3. Biochemical Parameters
2.3.4. Gut Microbiota Composition
2.3.5. Fecal Alkaline Phosphatase (ALP) Activity
2.4. Statistical Analysis
3. Results
3.1. Demographics and Baseline Characteristics
3.2. Dietary Habits
3.3. Body Composition, Anthropometric Evaluation, and Blood Pressure
3.4. Biochemical Parameters
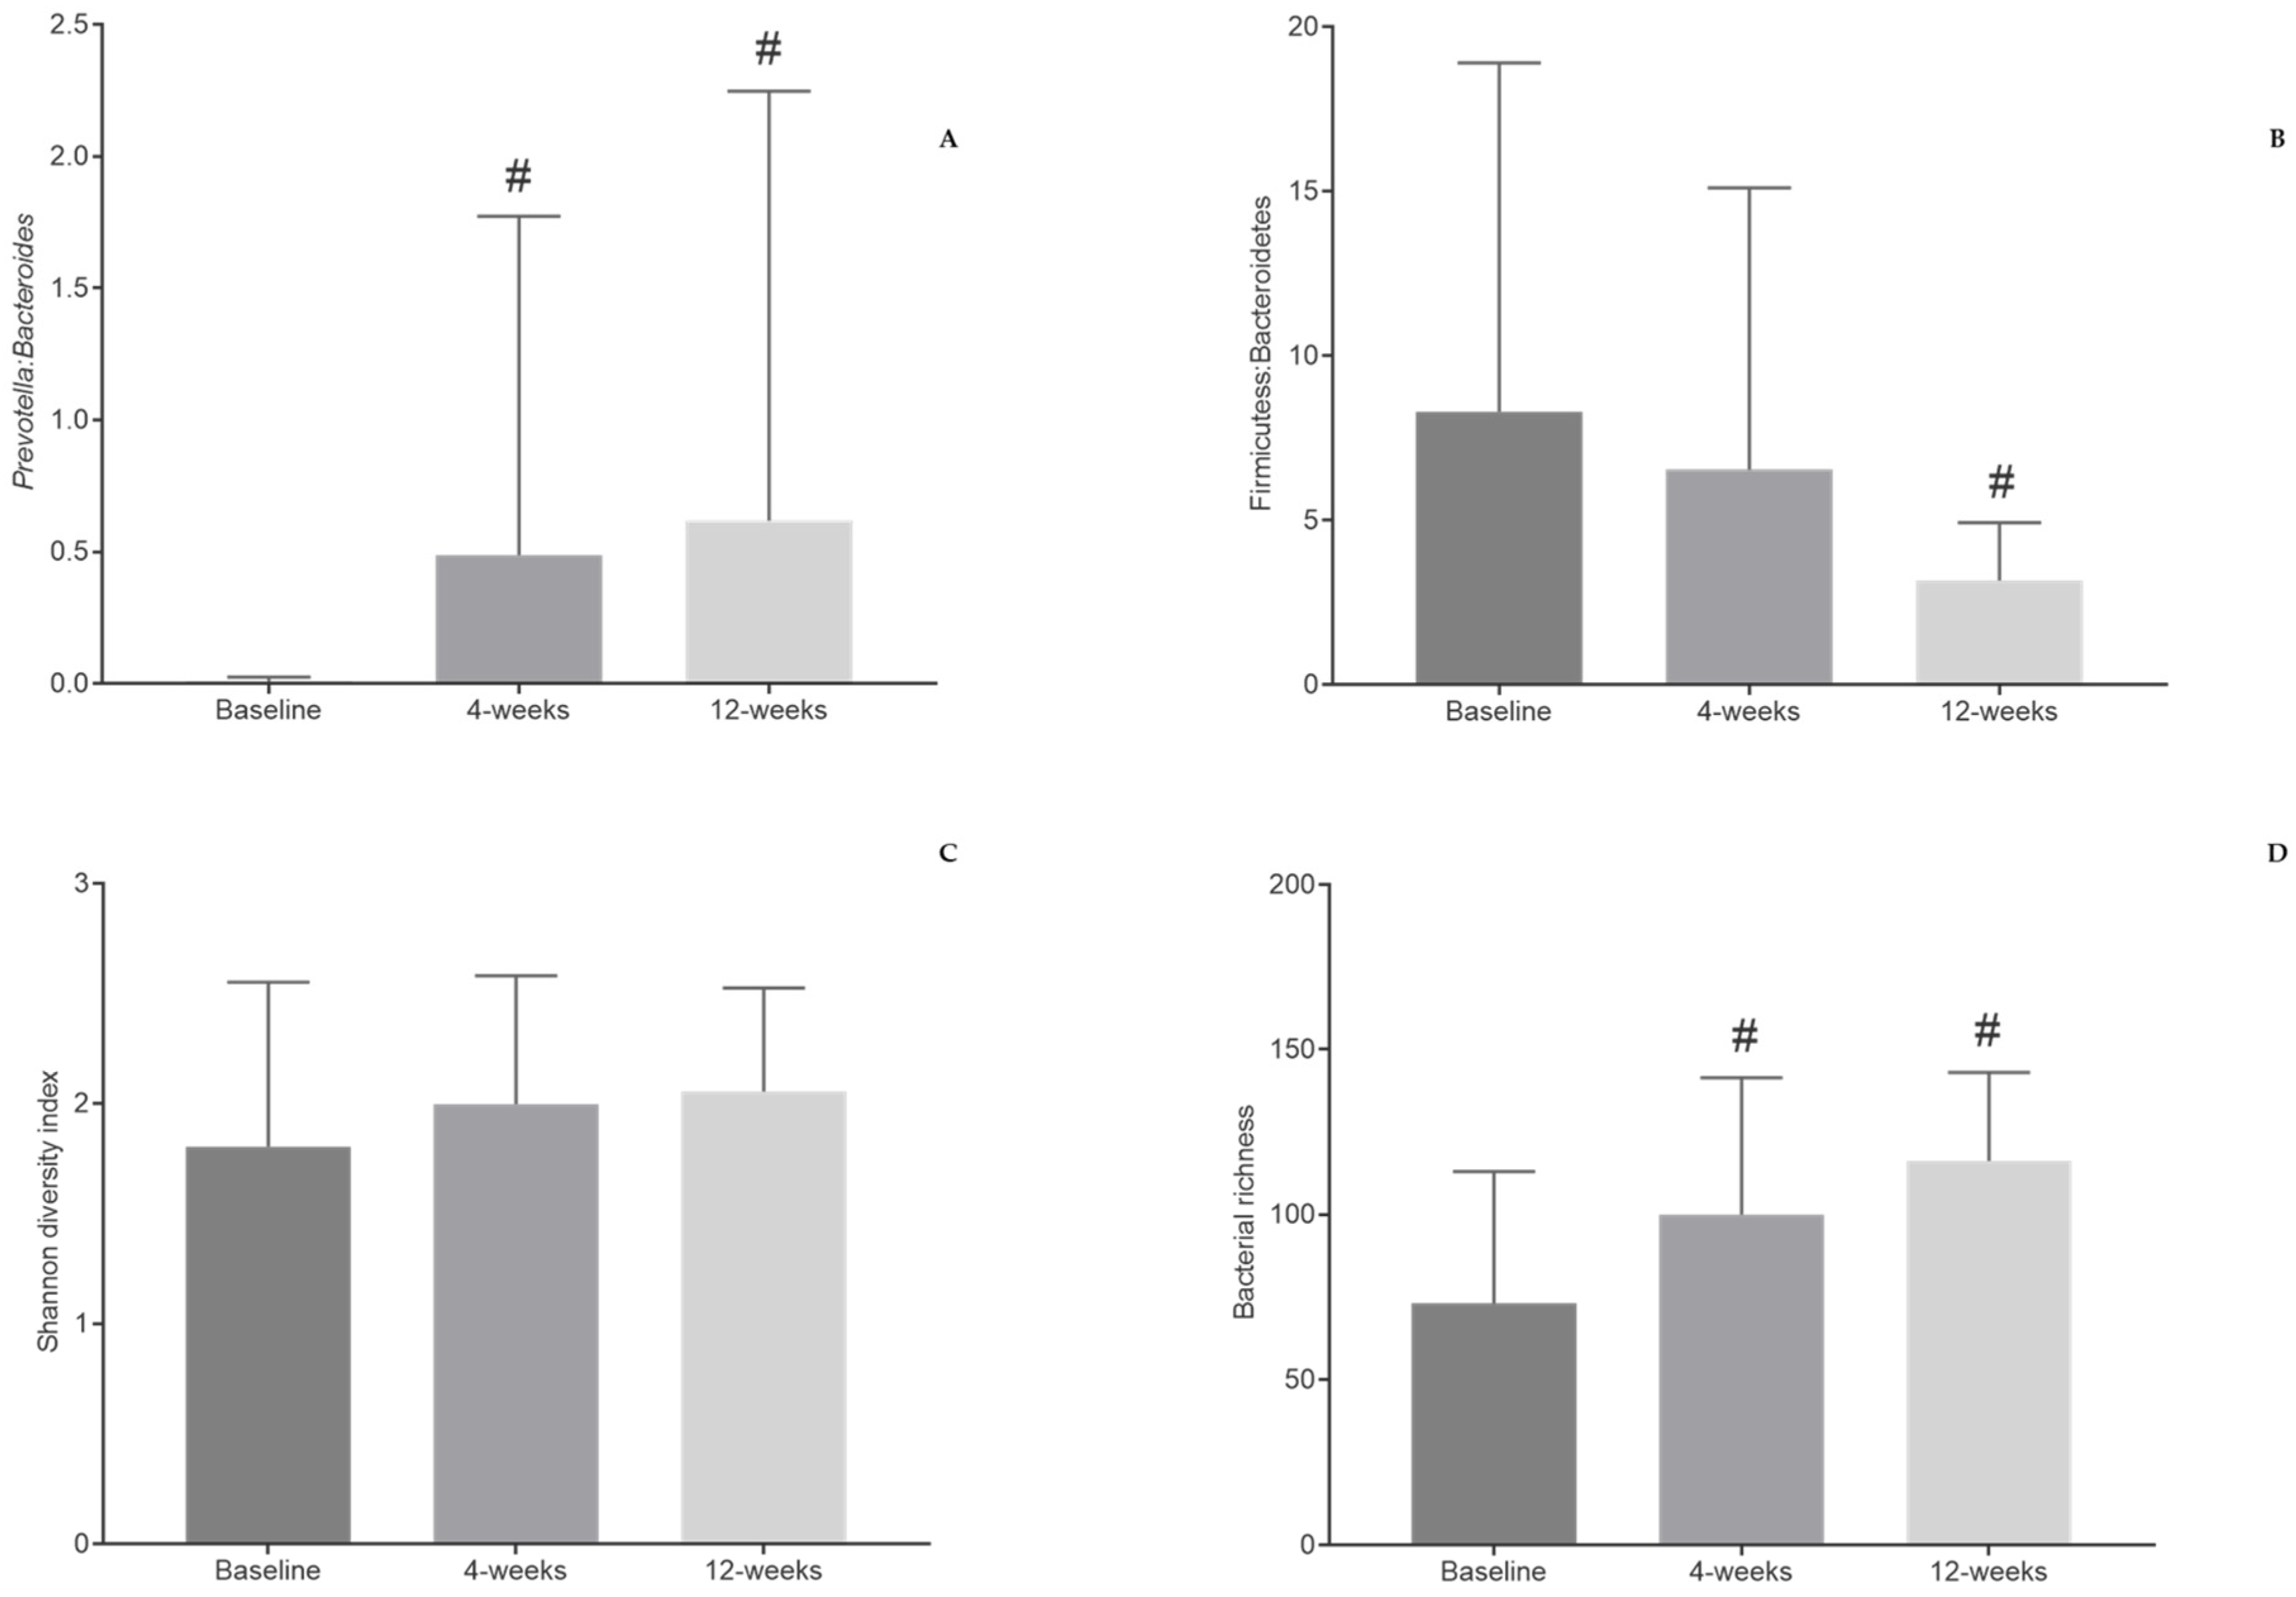
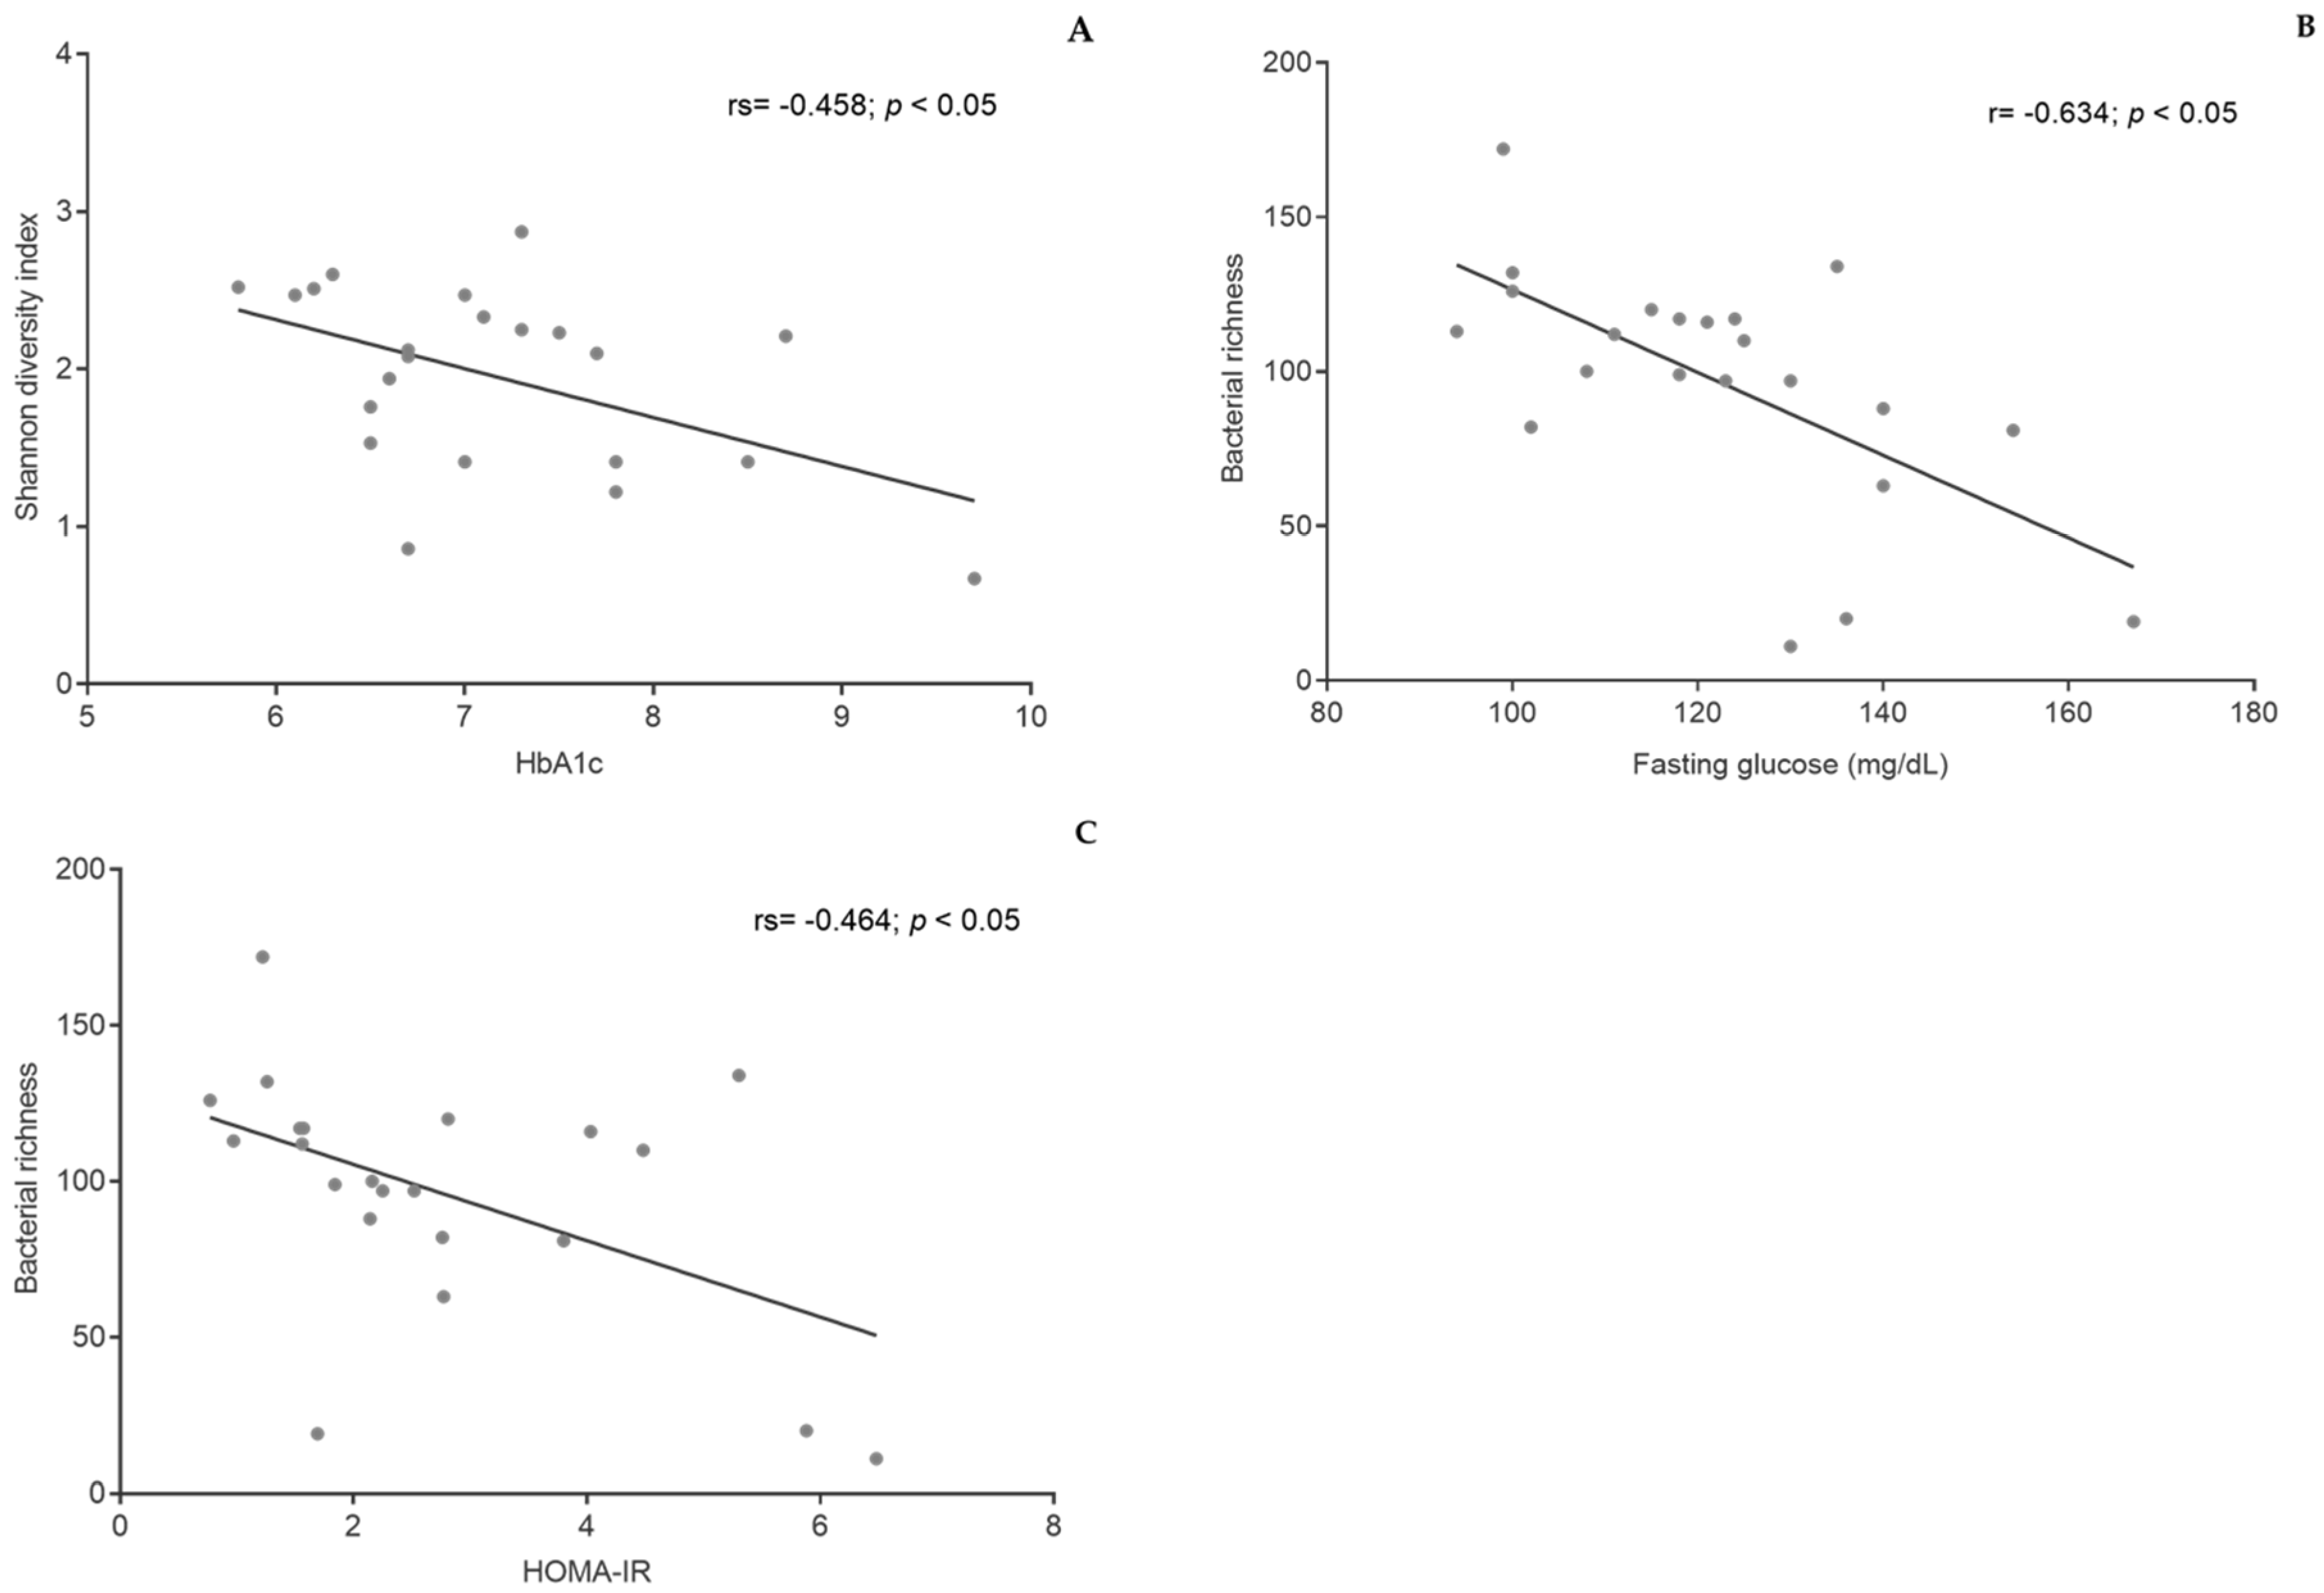
3.5. Gut Microbiota
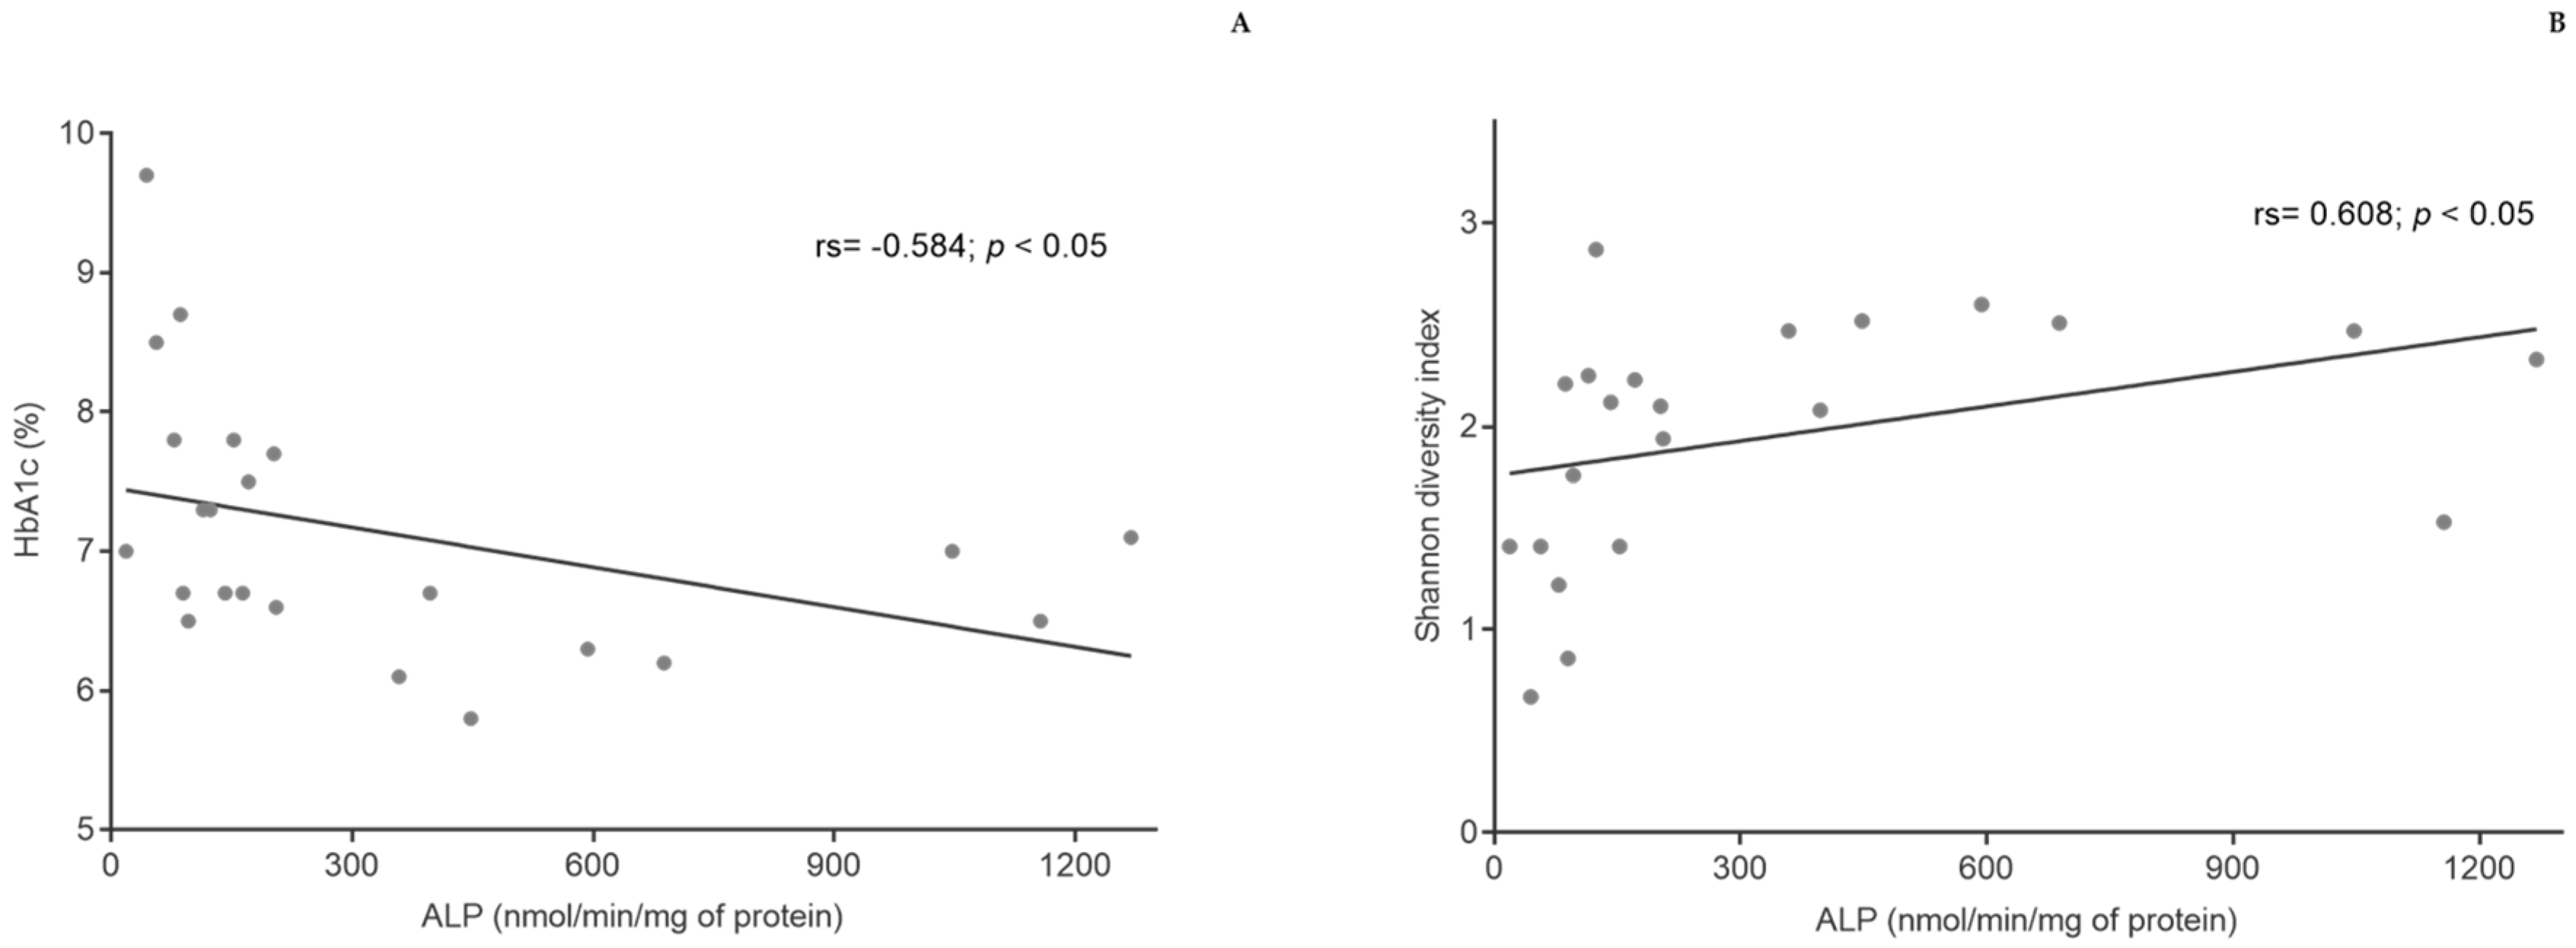
3.6. ALP Activity in Fecal Samples
4. Discussion
5. Conclusions
Supplementary Materials
Author Contributions
Funding
Institutional Review Board Statement
Informed Consent Statement
Data Availability Statement
Acknowledgments
Conflicts of Interest
References
- Evert, A.B.; Dennison, M.; Gardner, C.D.; Timothy Garvey, W.; Karen Lau, K.H.; MacLeod, J.; Mitri, J.; Pereira, R.F.; Rawlings, K.; Robinson, S.; et al. Nutrition therapy for adults with diabetes or prediabetes: A consensus report. Diabetes Care 2019, 42, 731–754. [Google Scholar] [CrossRef]
- Davies, M.J.; D’Alessio, D.A.; Fradkin, J.; Kernan, W.N.; Mathieu, C.; Mingrone, G.; Rossing, P.; Tsapas, A.; Wexler, D.J.; Buse, J.B. Management of hyperglycaemia in type 2 diabetes, 2018. A consensus report by the American Diabetes Association (ADA) and the European Association for the Study of Diabetes (EASD). Diabetologia 2018, 61, 2461–2498. [Google Scholar] [CrossRef] [PubMed]
- Papamichou, D.; Panagiotakos, D.B.; Itsiopoulos, C. Dietary patterns and management of type 2 diabetes: A systematic review of randomised clinical trials. Nutr. Metab. Cardiovasc. Dis. 2019, 29, 531–543. [Google Scholar] [CrossRef]
- American Diabetes Association. 5. Facilitating behavior change and well-being to improve health outcomes: Standards of medical care in diabetes−2021. Diabetes Care 2021, 44, S53–S72. [Google Scholar] [CrossRef] [PubMed]
- Rosato, V.; Temple, N.J.; La, C.; Giorgio, V.; Alessandra, C.; Guercio, V. Mediterranean diet and cardiovascular disease: A systematic review and meta-analysis of observational studies. Eur. J. Nutr. 2019, 58, 173–191. [Google Scholar] [CrossRef]
- Poulimeneas, D.; Anastasiou, C.A.; Santos, I.; Hill, J.O.; Panagiotakos, D.B.; Yannakoulia, M. Exploring the relationship between the Mediterranean diet and weight loss maintenance: The MedWeight study. Br. J. Nutr. 2020, 124, 874–880. [Google Scholar] [CrossRef]
- Galicia-Garcia, U.; Benito-Vicente, A.; Jebari, S.; Larrea-Sebal, A.; Siddiqi, H.; Uribe, K.B.; Ostolaza, H.; Martín, C. Pathophysiology of type 2 diabetes mellitus. Int. J. Mol. Sci. 2020, 21, 6275. [Google Scholar] [CrossRef]
- American Diabetes Association. 6. Glycemic Targets: Standards of Medical Care in Diabetes-2020. Diabetes Care 2020, 43, S66–S76. [Google Scholar] [CrossRef]
- Gurung, M.; Li, Z.; You, H.; Rodrigues, R.; Jump, D.B.; Morgun, A.; Shulzhenko, N. Role of gut microbiota in type 2 diabetes pathophysiology. EBioMedicine 2020, 51, 1–9. [Google Scholar] [CrossRef]
- Makki, K.; Deehan, E.C.; Walter, J.; Bäckhed, F. The Impact of Dietary Fiber on Gut Microbiota in Host Health and Disease. Cell Host Microbe 2018, 23, 705–715. [Google Scholar] [CrossRef] [PubMed]
- Degruttola, A.K.; Low, D.; Mizoguchi, A.; Mizoguchi, E. Current understanding of dysbiosis in disease in human and animal models. Inflamm. Bowel Dis. 2016, 22, 1137–1150. [Google Scholar] [CrossRef] [PubMed]
- Navab-Moghadam, F.; Sedighi, M.; Khamseh, M.E.; Alaei-Shahmiri, F.; Talebi, M.; Razavi, S.; Amirmozafari, N. The association of type II diabetes with gut microbiota composition. Microb. Pathog. 2017, 110, 630–636. [Google Scholar] [CrossRef] [PubMed]
- Wolters, M.; Ahrens, J.; Romaní-Pérez, M.; Watkins, C.; Sanz, Y.; Benítez-Páez, A.; Stanton, C.; Günther, K. Dietary fat, the gut microbiota, and metabolic health—A systematic review conducted within the MyNewGut project. Clin. Nutr. 2019, 38, 2504–2520. [Google Scholar] [CrossRef] [PubMed]
- Nagpal, R.; Shively, C.A.; Register, T.C.; Craft, S.; Yadav, H. Gut microbiome-Mediterranean diet interactions in improving host health. F1000Research 2019, 8, 1–15. [Google Scholar] [CrossRef]
- Leeming, E.R.; Johnson, A.J.; Spector, T.D.; Roy, C.I.L. Effect of diet on the gut microbiota: Rethinking intervention duration. Nutrients 2019, 11, 2862. [Google Scholar] [CrossRef]
- David, L.A.; Maurice, C.F.; Carmody, R.N.; Gootenberg, D.B.; Button, J.E.; Wolfe, B.E.; Ling, A.V.; Devlin, A.S.; Varma, Y.; Fischbach, M.A.; et al. Diet rapidly and reproducibly alters the human gut microbiome. Nature 2014, 505, 559–563. [Google Scholar] [CrossRef]
- Zeevi, D.; Korem, T.; Zmora, N.; Israeli, D.; Rothschild, D.; Weinberger, A.; Ben-Yacov, O.; Lador, D.; Avnit-Sagi, T.; Lotan-Pompan, M.; et al. Personalized Nutrition by Prediction of Glycemic Responses. Cell 2015, 163, 1079–1094. [Google Scholar] [CrossRef]
- Ismael, S.; Silvestre, M.P.; Vasques, M.; Morais, J.; Pestana, D.; Faria, A.; Pereira-Leal, J.; Cardoso, J.; Ribeiro, P.; Teixeira, D.; et al. Effect of MEDiterranean Diet on the microBIOME of Individuals With Type 2 Diabetes (MEDBIOME). Port. J. Diabetes 2020, 15, 40–47. [Google Scholar]
- American Diabetes Association. 2. Classification and Diagnosis of Diabetes: Standards of Medical Care in Diabetes—2020. Diabetes Care 2020, 43, S14–S31. [Google Scholar] [CrossRef]
- Barbosa, C.; Pimenta, P.; Real, H. Mediterranean Food Wheel and Mediterranean Diet. Acta Port. Nutr. 2017, 11, 6–14. [Google Scholar] [CrossRef]
- American Diabetes Association. 5. Facilitating Behavior Change and Well-being to Improve Health Outcomes: Standards of Medical Care in Diabetes-2020. Diabetes Care 2020, 43, S48–S65. [Google Scholar] [CrossRef] [PubMed]
- Cho, S.; Dreher, M. Handbook of Dietary Fiber; CRP Press: New York, NY, USA, 2001. [Google Scholar]
- Lopes, C.; Torres, D.; Oliveira, A.; Severo, M.; Alarcão, V.; Guiomar, S.; Mota, J.; Teixeira, P.; Rodrigues, S.; Lobato, L.; et al. Inquérito Alimentar Nacional e de Atividade Física, IAN-AF 2015-2016: Manual Fotográfico de Quantificação de Alimentos; Universidade do Porto: Porto, Portugal, 2017. [Google Scholar]
- Gregório, M.J.; Rodrigues, A.M.; Salvador, C.; Dias, S.S.; de Sousa, R.D.; Mendes, J.M.; Coelho, P.S.; Branco, J.C.; Lopes, C.; Martínez-González, M.A.; et al. Validation of the Telephone-Administered Version of the Mediterranean Diet Adherence Screener (MEDAS) Questionnaire. Nutrients 2020, 12, 1511. [Google Scholar] [CrossRef] [PubMed]
- Afonso, L.; Moreira, T.; Oliveira, A. Índices de adesão ao padrão alimentar mediterrânico—a base metodológica para estudar a sua relação com a saúde. Rev. Factores Risco 2014, 31, 48–55. [Google Scholar]
- Direção-Geral da Saúde. Avaliação Antropométrica no Adulto; Direção-Geral da Saúde: Lisboa, Portugal, 2013; pp. 1–9.
- Direção-Geral da Saúde. Hipertensão Arterial: Definição e classificação; Direção-Geral da Saúde: Lisboa, Portugal, 2013; pp. 1–6.
- Friedewald, W.; Levy, R.; Fredrickson, D. Estimation of the Concentrationof Low-Density Lipoprote in Cholesterol in Plasma, Without Use of the Preparative Ultracentrifuge. J. Clin. Chem. 1972, 18, 1689–1699. [Google Scholar] [CrossRef]
- Matuszkiewicz-rowińska, J. Homeostatic model assessment indices in evaluation of insulin resistance and secretion in hemodialysis patients. Med. Sci. Monit. 2013, 19, 592–598. [Google Scholar] [CrossRef] [PubMed][Green Version]
- Lewis, S.J.; Heaton, K.W. Stool Form Scale as a Useful Guide to Intestinal Transit Time Stool Form Scale as a Useful Guide to Intestinal Transit Time. Scand. J. Gastroenterol. 2009, 32, 920–924. [Google Scholar] [CrossRef]
- Marques, C.; Meireles, M.; Norberto, S.; Leite, J.; Freitas, J.; Pestana, D.; Faria, A.; Calhau, C. High-fat diet-induced obesity Rat model: A comparison between Wistar and Sprague-Dawley Rat. Adipocyte 2016, 5, 11–21. [Google Scholar] [CrossRef]
- Walters, W.; Hyde, E.R.; Berg-lyons, D.; Ackermann, G.; Humphrey, G.; Parada, A.; Gilbert, J.A.; Jansson, J.K. Transcribed Spacer Marker Gene Primers for Microbial Community Surveys. mSystems 2015, 1, e0009–e00015. [Google Scholar] [CrossRef]
- Ghosh, S.S.; Wang, J.; Yannie, P.J.; Ghosh, S. Intestinal barrier dysfunction, LPS translocation, and disease development. J. Endocr. Soc. 2020, 4, 1–15. [Google Scholar] [CrossRef]
- Calhau, C.; Martel, F.; Hipólito-Reis, C.; Azevedo, I. Differences between duodenal and jejunal rat alkaline phosphatase. Clin. Biochem. 2000, 33, 571–577. [Google Scholar] [CrossRef]
- Malo, M.S. A High Level of Intestinal Alkaline Phosphatase Is Protective Against Type 2 Diabetes Mellitus Irrespective of Obesity. EBioMedicine 2015, 2, 2016–2023. [Google Scholar] [CrossRef] [PubMed]
- Esposito, K.; Maiorino, M.I.; Bellastella, G.; Chiodini, P.; Panagiotakos, D.; Giugliano, D. A journey into a Mediterranean diet and type 2 diabetes: A systematic review with meta-analyses. BMJ Open 2015, 5, 1–10. [Google Scholar] [CrossRef]
- Siopis, G.; Wang, L.; Colagiuri, S.; Allman-Farinelli, M. Cost effectiveness of dietitian-led nutrition therapy for people with type 2 diabetes mellitus: A scoping review. J. Hum. Nutr. Diet. 2020, 4, 1–13. [Google Scholar] [CrossRef]
- Martín-Peláez, S.; Fito, M.; Castaner, O. Mediterranean Diet Effects on Type 2 Diabetes Prevention, Disease Progression, and Related Mechanisms. A Review. Nutrients 2020, 12, 2236. [Google Scholar] [CrossRef] [PubMed]
- Larsen, N.; Vogensen, F.K.; Van Den Berg, F.W.J.; Nielsen, D.S.; Andreasen, A.S.; Pedersen, B.K.; Al-Soud, W.A.; Sørensen, S.J.; Hansen, L.H.; Jakobsen, M. Gut microbiota in human adults with type 2 diabetes differs from non-diabetic adults. PLoS ONE 2010, 5, e9085. [Google Scholar] [CrossRef]
- Wang, J.; Li, W.; Wang, C.; Wang, L.; He, T.; Hu, H.; Song, J.; Cui, C.; Qiao, J.; Qing, L.; et al. Enterotype Bacteroides Is Associated with a High Risk in Patients with Diabetes: A Pilot Study. J. Diabetes Res. 2020, 2020, 1–11. [Google Scholar] [CrossRef]
- Moszak, M.; Szulińska, M.; Bogdański, P. You are what you eat—the relationship between diet, microbiota, and metabolic disorders— A review. Nutrients 2020, 12, 1096. [Google Scholar] [CrossRef] [PubMed]
- Tsigalou, C.; Paraschaki, A.; Karvelas, A.; Kantartzi, K.; Gagali, K.; Tsairidis, D.; Bezirtzoglou, E. Gut microbiome and Mediterranean diet in the context of obesity. Current knowledge, perspectives and potential therapeutic targets. Metab. Open 2021, 9, 100081. [Google Scholar] [CrossRef]
- Merra, G.; Noce, A.; Marrone, G.; Cintoni, M.; Tarsitano, M.G.; Capacci, A.; De Lorenzo, A. Influence of mediterranean diet on human gut microbiota. Nutrients 2021, 13, 7. [Google Scholar] [CrossRef]
- ClinicalTrials.gov. Influence of Beer on Gut Microbiota and Biochemical Outcomes: Alcohol Impact. Available online: https://clinicaltrials.gov/ct2/show/NCT03513432 (accessed on 13 June 2020).
- De Filippis, F.; Pellegrini, N.; Vannini, L.; Jeffery, I.B.; La Storia, A.; Laghi, L.; Serrazanetti, D.I.; Di Cagno, R.; Ferrocino, I.; Lazzi, C.; et al. High-level adherence to a Mediterranean diet beneficially impacts the gut microbiota and associated metabolome. Gut 2016, 65, 1–10. [Google Scholar] [CrossRef] [PubMed]
- Bianchi, F.; Duque, A.L.R.F.; Saad, S.M.I.; Sivieri, K. Gut microbiome approaches to treat obesity in humans. Appl. Microbiol. Biotechnol. 2019, 103, 1081–1094. [Google Scholar] [CrossRef] [PubMed]
- Fan, Y.; Pedersen, O. Gut microbiota in human metabolic health and disease. Nat. Rev. Microbiol. 2021, 19, 55–71. [Google Scholar] [CrossRef]
- Salgaço, M.K.; Oliveira, L.G.S.; Costa, G.N.; Bianchi, F.; Sivieri, K. Relationship between gut microbiota, probiotics, and type 2 diabetes mellitus. Appl. Microbiol. Biotechnol. 2019, 103, 9229–9238. [Google Scholar] [CrossRef] [PubMed]
- Davies, N.K.; O’Sullivan, J.M.; Plank, L.D.; Murphy, R. Altered gut microbiome after bariatric surgery and its association with metabolic benefits: A systematic review. Surg. Obes. Relat. Dis. 2019, 15, 656–665. [Google Scholar] [CrossRef] [PubMed]
- Zaher, D.M.; Aljareh, S.N.; Iqbal, J.; El Gamal, M.I.; Omar, H.A.; Al Shamma, S.A.; Ali, A.J.; Zaib, S. Recent advances with alkaline phosphatase isoenzymes and their inhibitors. Arch. Pharm. 2020, 353, 1–21. [Google Scholar] [CrossRef] [PubMed]
- Tomova, A.; Bukovsky, I.; Rembert, E.; Yonas, W.; Alwarith, J. The Effects of Vegetarian and Vegan Diets on Gut Microbiota. Front. Nutr. 2019, 6, 1–10. [Google Scholar] [CrossRef] [PubMed]
- Okazaki, Y.; Katayama, T. Consumption of non-digestible oligosaccharides elevates colonic alkaline phosphatase activity by up-regulating the expression of IAP-I, with increased mucins and microbial fermentation in rats fed a high-fat diet. Br. J. Nutr. 2019, 121, 146–154. [Google Scholar] [CrossRef]
- Lalle, J. Recent advances in intestinal alkaline phosphatase, inflammation, and nutrition. Nutr. Rev. 2019, 77, 710–724. [Google Scholar] [CrossRef]


| Baseline Characteristics 1 | |
|---|---|
| (n = 9) | |
| Sex | |
| Male | 6 (66.67%) |
| Female | 3 (33.33%) |
| Age (years) | 66 (47–77) |
| Race | |
| Caucasian | 9 (100%) |
| Other complications | |
| Hypertension | 8 (88.89%) |
| Dyslipidemia | 5 (55.56%) |
| Cardiovascular disease | 1 (11.11%) |
| Time since diabetes diagnosis (years) | 13.63 (5–23) |
| Oral antidiabetic drugs | |
| Biguanides | 8 (88.89%) |
| Dipeptidyl peptidase-4 inhibitors | 3 (33.33%) |
| SGLT2-inhibitors | 1 (11.11%) |
| Sulfonylurea | 1 (11.11%) |
| Baseline 1 | 12 Weeks 1 | p Value | |
|---|---|---|---|
| (n = 9) | (n = 8) | ||
| Vegetables (≥2 portions/day) | 4 (44.44%) | 6 (75.00%) | 0.201 |
| Fruit (≥3 portions/day) | 4 (44.44%) | 6 (75.00%) | 0.201 |
| Legumes (≥3 portions/week) | 5 (55.56%) | 3 (37.50%) | 0.457 |
| Fish and seafood (≥3 portions/week) | 7 (77.78%) | 6 (75.00%) | 0.893 |
| Red meat (<1 portion/day) | 6 (66.67%) | 8 (100%) | 0.072 |
| Butter, margarine, and cream (<1 portion/day) | 3 (33.33%) | 8 (100%) | 0.004 * |
| Pastries (<3 portions/week) | 7 (77.78%) | 8 (100%) | 0.156 |
| Nuts (≥3 portions/week) | 3 (33.33%) | 8 (100%) | 0.004 * |
| Sugary drinks—soft drinks and juices (<1 drink/day) | 8 (88.89%) | 8 (100%) | 0.331 |
| Wine (≥7 cups/week) | 5 (55.56%) | 2 (25.00%) | 0.201 |
| Olive oil (≥4 spoons/day) | 3 (33.33%) | 6 (75.00%) | 0.086 |
| Baseline 1 | 4 Weeks 1 | 12 Weeks 1 | p Value | |
|---|---|---|---|---|
| (n = 8–9) | (n = 8–9) | (n = 8) | ||
| Weight (kg) | 76.39 ± 17.79 | 77.52 ± 16.94 | 73.69 ± 14.48 | 0.206 |
| Waist perimeter (cm) | 94.44 ± 12.25 | 95.17 ± 12.67 | 93.36 ± 11.41 | 0.501 |
| Waist-to-hip ratio | 0.93 ± 0.05 | 0.93 ± 0.07 | 0.93 ± 0.06 | 0.867 |
| Body mass index (kg/m2) | 27.60 ± 4.03 | 27.09 ± 3.75 | 26.95 ± 3.84 | 0.056 |
| Body fat mass (kg) | 22.41 ± 6.91 | 23.14 ± 7.45 | 23.56 ± 6.80 | 0.093 |
| Free fat mass (kg) | 52.49 ± 10.69 | 53.01 ± 10.38 | 50.13 ± 8.84 | 0.908 |
| Skeletal muscle mass (kg) | 27.69 ± 5.57 | 28.05 ± 5.46 | 27.59 ± 5.35 | 0.578 |
| Systolic blood pressure (mmHg) | 141.71 ± 12.40 | 142.33 ± 13.04 | 136.54 ± 12.08 | 0.227 |
| Diastolic blood pressure (mmHg) | 82.25 ± 9.98 | 83.54 ± 11.38 | 79.98.0 ± 8.02 | 0.496 |
| Glucose homeostasis and lipid profile parameters | ||||
| Fasting glucose (mg/dL) | 131.63 ± 8.53 | 127.38 ± 7.69 | 122.50 ± 9.42 | 0.581 |
| Insulin (μU/mL) | 11.26 ± 2.65 | 10.80 ± 2.31 | 8.48 ± 1.60 | 0.157 |
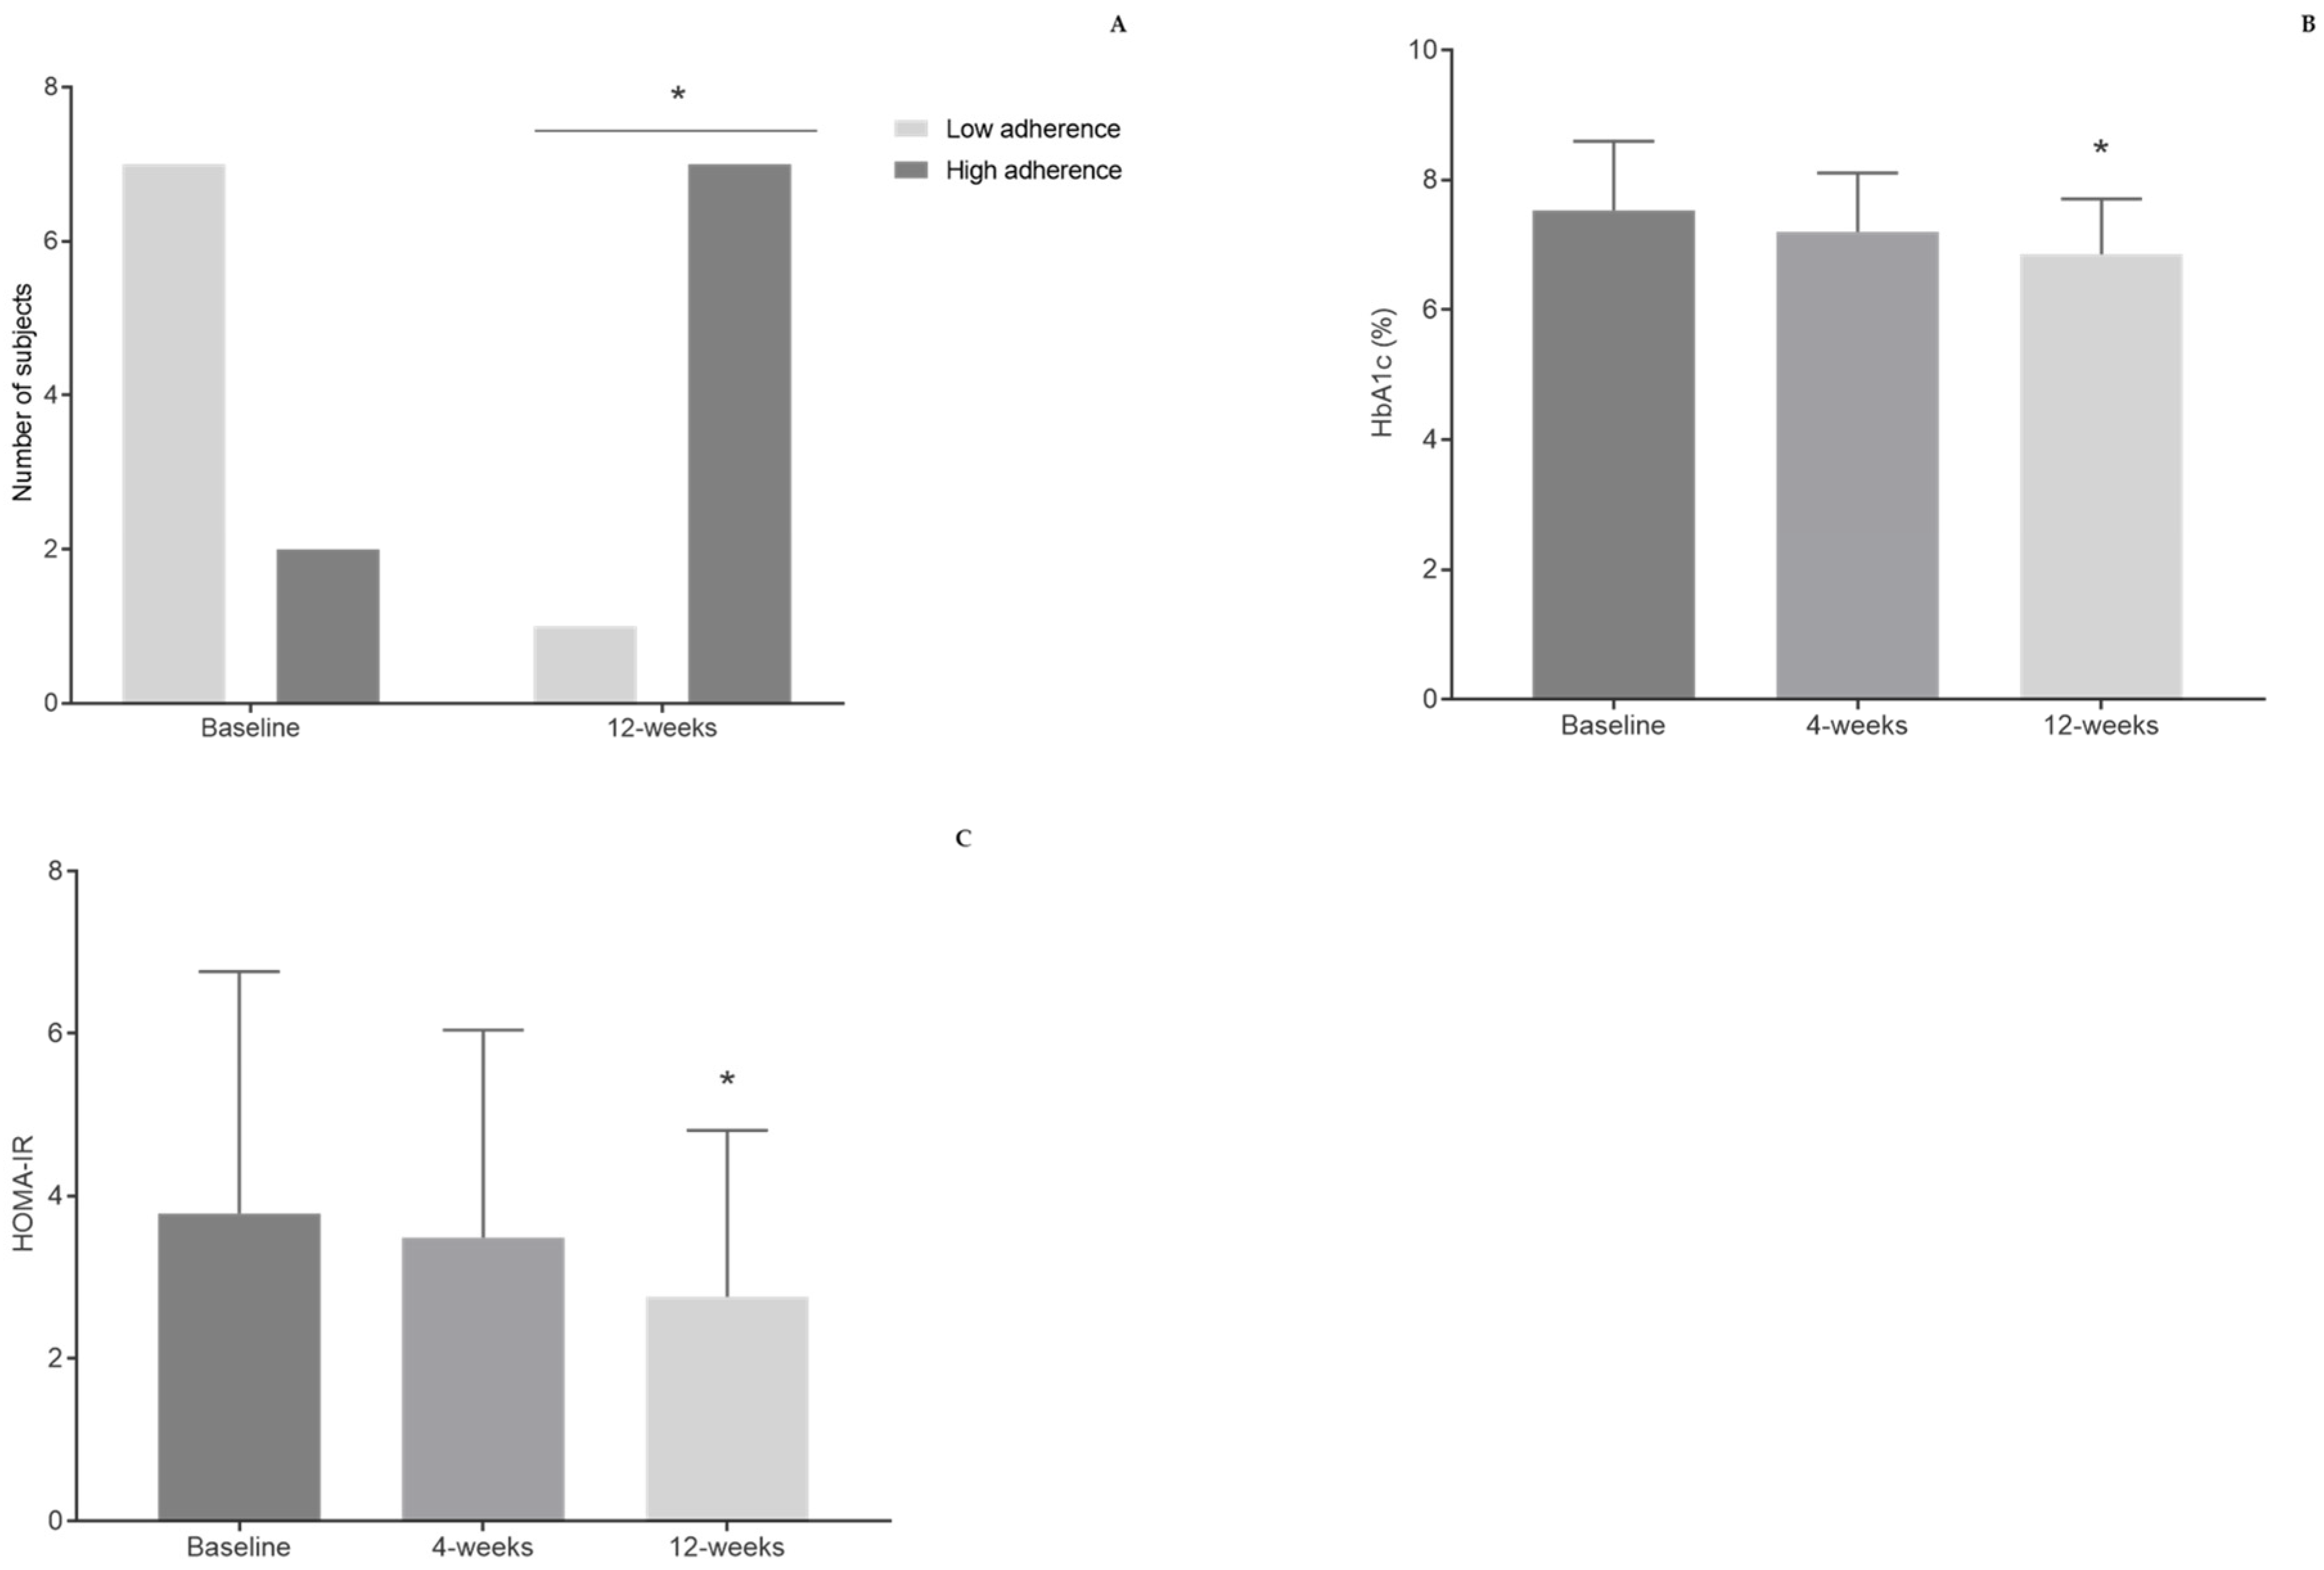
| HbA1c (%) | 7.53 ± 1.07 | 7.20 ± 0.91 | 6.86 ± 0.85 * | 0.024 * |
| HOMA-IR | 3.79 ± 2.98 | 3.49 ± 2.56 | 2.76 ± 2.05 * | 0.044 * |
| HOMA-B | 61.23 ± 10.41 | 57.68 ± 9.39 | 51.82 ± 6.06 | 0.512 |
| HOMA-S (%) | 39.34 ± 7.87 | 48.44 ± 14.44 | 52.71 ± 10.52 | 0.134 |
| Total cholesterol (mg/dL) | 172.44 ± 32.77 | 162.11 ± 15.33 | 168.25 ± 20.46 | 0.479 |
| LDL cholesterol (mg/dL) | 93.56 ± 24.59 | 87.44 ± 17.04 | 90.50 ± 19.70 | 0.688 |
| VLDL cholesterol (mg/dL) | 29.00 ± 16.23 | 27.89 ± 17.72 | 28.00 ± 15.18 | 0.135 |
| HDL cholesterol (mg/dL) | 49.89 ± 18.20 | 47.11 ± 17.42 | 50.00 ± 15.50 | 0.459 |
| Triacylglycerides (mg/dL) | 145.33 ± 81.58 | 139.00 ± 89.34 | 140.38 ± 76.71 | 0.163 |
Publisher’s Note: MDPI stays neutral with regard to jurisdictional claims in published maps and institutional affiliations. |
© 2021 by the authors. Licensee MDPI, Basel, Switzerland. This article is an open access article distributed under the terms and conditions of the Creative Commons Attribution (CC BY) license (https://creativecommons.org/licenses/by/4.0/).
Share and Cite
Ismael, S.; Silvestre, M.P.; Vasques, M.; Araújo, J.R.; Morais, J.; Duarte, M.I.; Pestana, D.; Faria, A.; Pereira-Leal, J.B.; Vaz, J.; et al. A Pilot Study on the Metabolic Impact of Mediterranean Diet in Type 2 Diabetes: Is Gut Microbiota the Key? Nutrients 2021, 13, 1228. https://doi.org/10.3390/nu13041228
Ismael S, Silvestre MP, Vasques M, Araújo JR, Morais J, Duarte MI, Pestana D, Faria A, Pereira-Leal JB, Vaz J, et al. A Pilot Study on the Metabolic Impact of Mediterranean Diet in Type 2 Diabetes: Is Gut Microbiota the Key? Nutrients. 2021; 13(4):1228. https://doi.org/10.3390/nu13041228
Chicago/Turabian StyleIsmael, Shámila, Marta P. Silvestre, Miguel Vasques, João R. Araújo, Juliana Morais, Maria Inês Duarte, Diogo Pestana, Ana Faria, José B. Pereira-Leal, Joana Vaz, and et al. 2021. "A Pilot Study on the Metabolic Impact of Mediterranean Diet in Type 2 Diabetes: Is Gut Microbiota the Key?" Nutrients 13, no. 4: 1228. https://doi.org/10.3390/nu13041228
APA StyleIsmael, S., Silvestre, M. P., Vasques, M., Araújo, J. R., Morais, J., Duarte, M. I., Pestana, D., Faria, A., Pereira-Leal, J. B., Vaz, J., Ribeiro, P., Teixeira, D., Marques, C., & Calhau, C. (2021). A Pilot Study on the Metabolic Impact of Mediterranean Diet in Type 2 Diabetes: Is Gut Microbiota the Key? Nutrients, 13(4), 1228. https://doi.org/10.3390/nu13041228