The Association between Diet and Hepatocellular Carcinoma: A Systematic Review

 ,
,
Abstract
1. Introduction
2. Materials and Methods
2.1. Search Terms and Strategy
2.2. Eligibility Criteria
2.3. Study Selection Process
2.4. Data Extraction
2.5. Quality Assessment and Risk of Bias
2.6. Data Analysis
3. Results
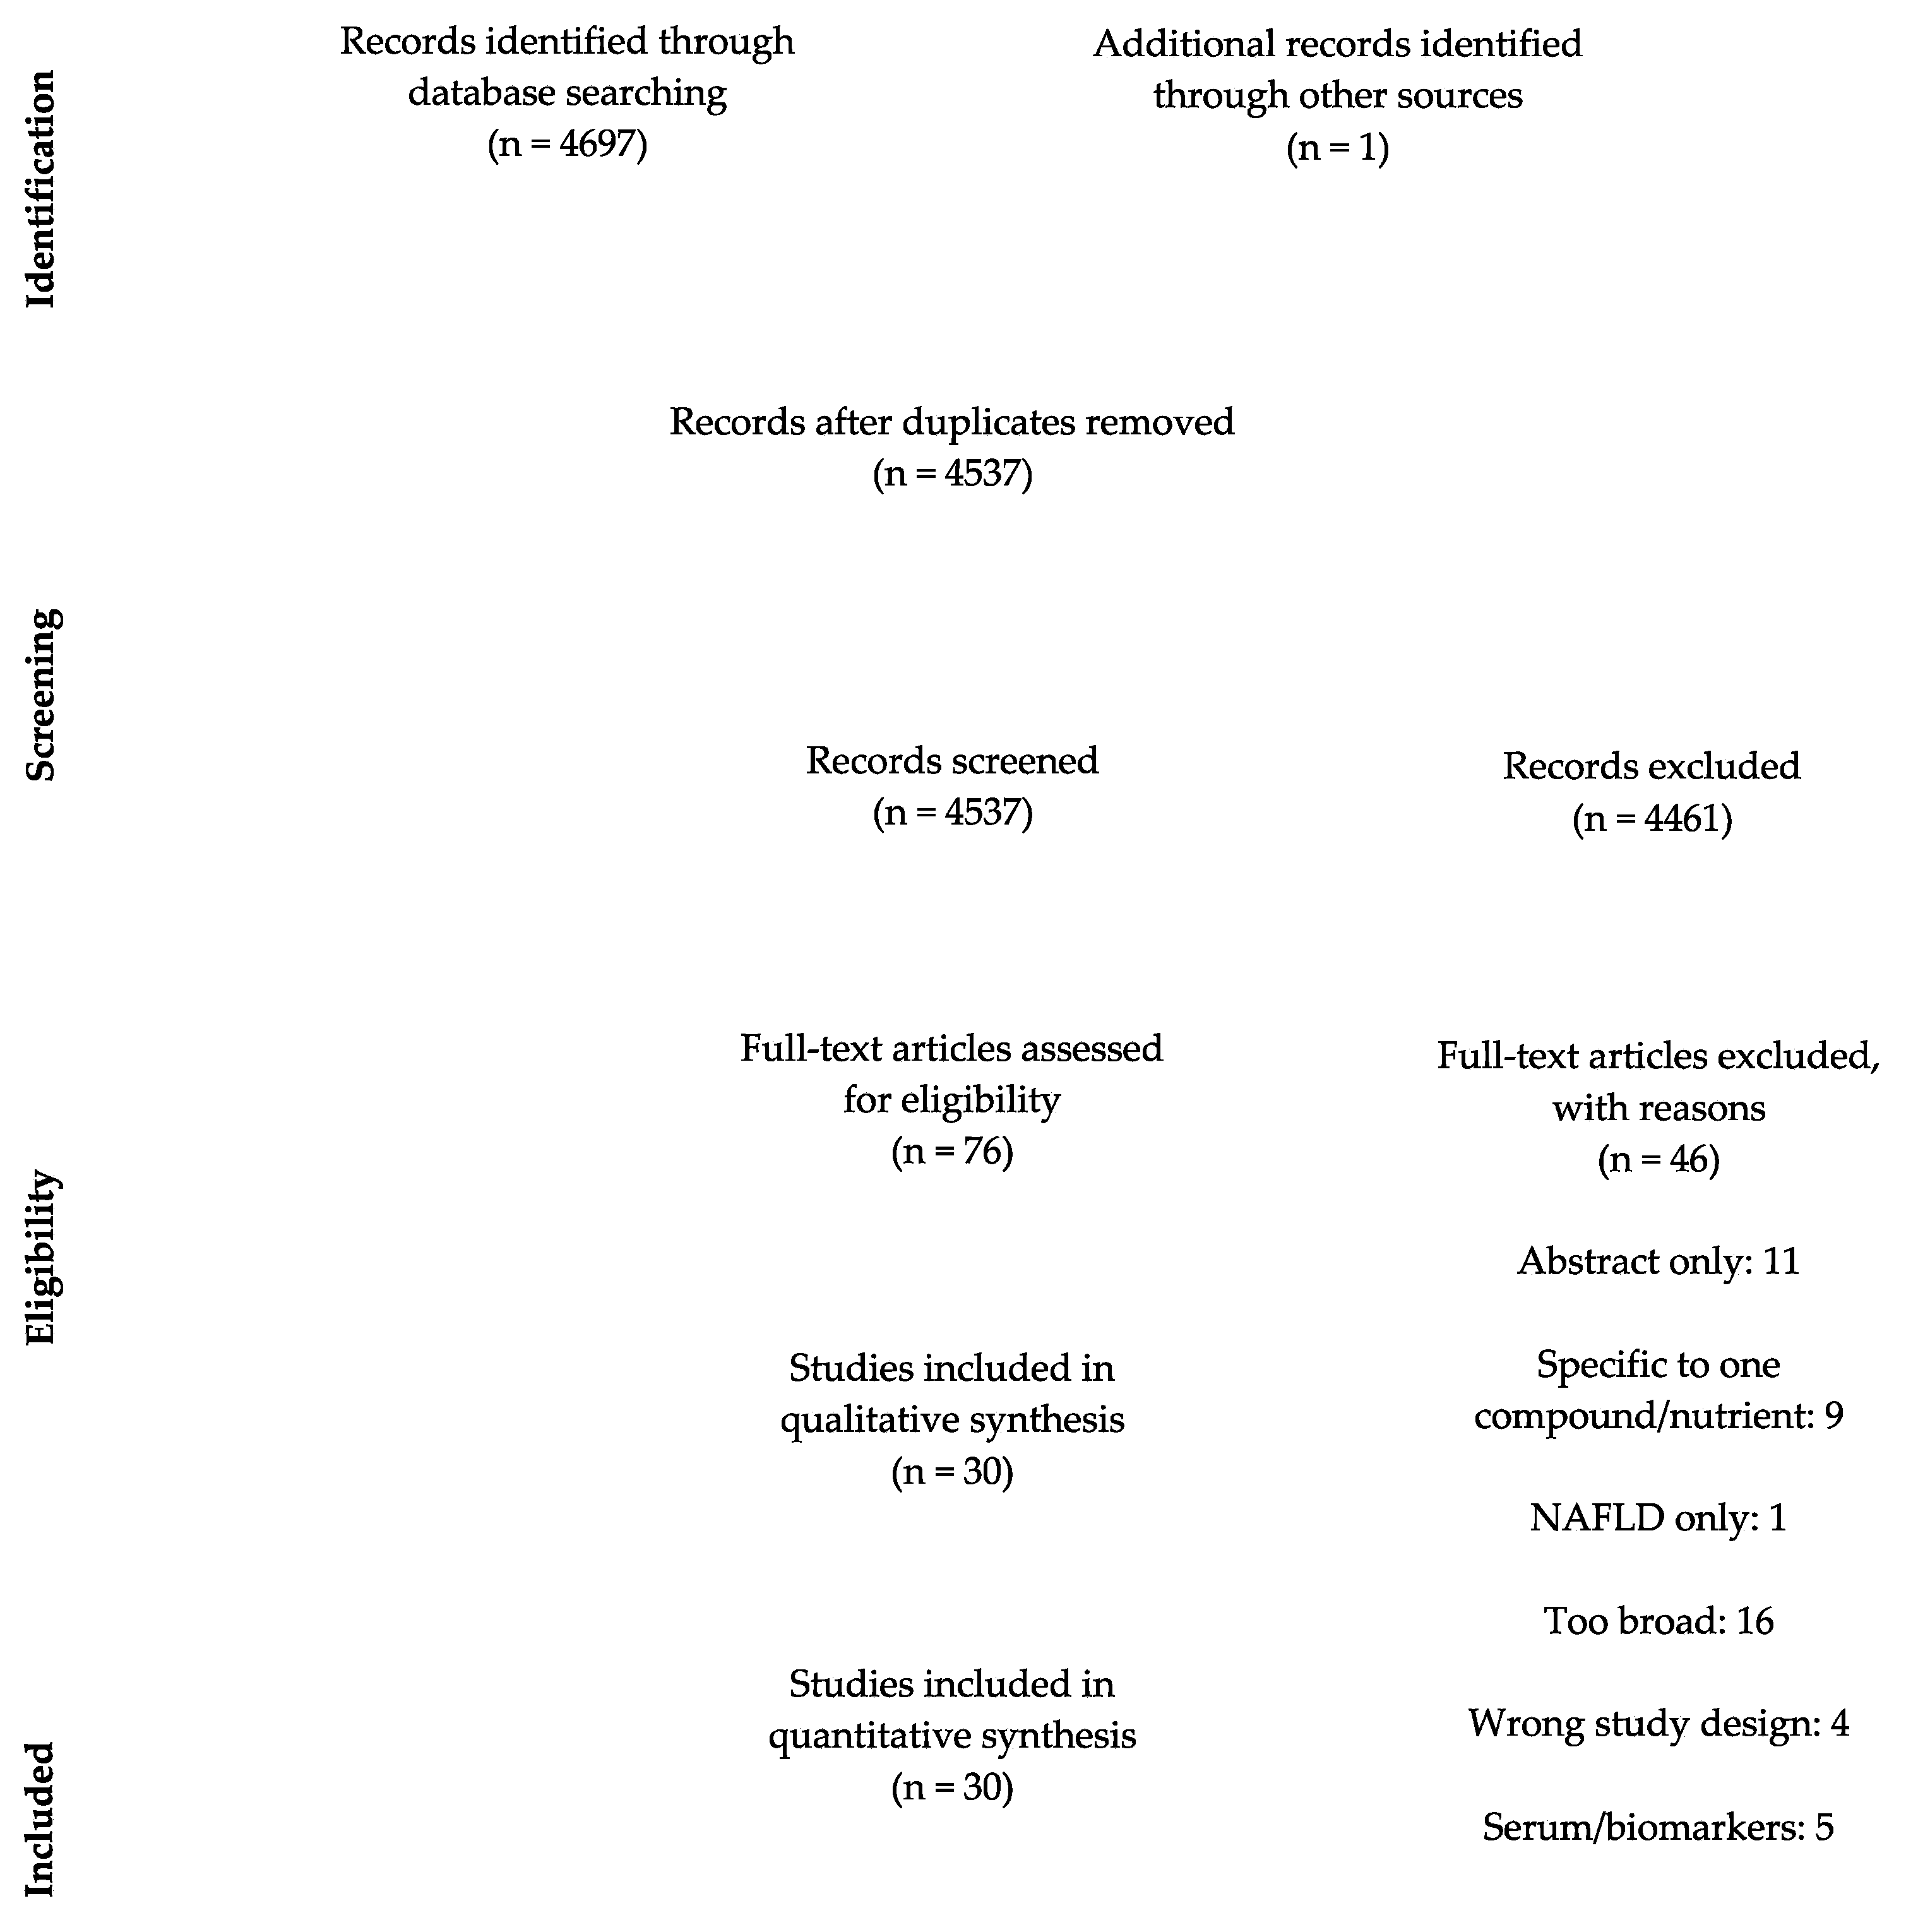
3.1. Study Selection
3.2. Study Characteristics
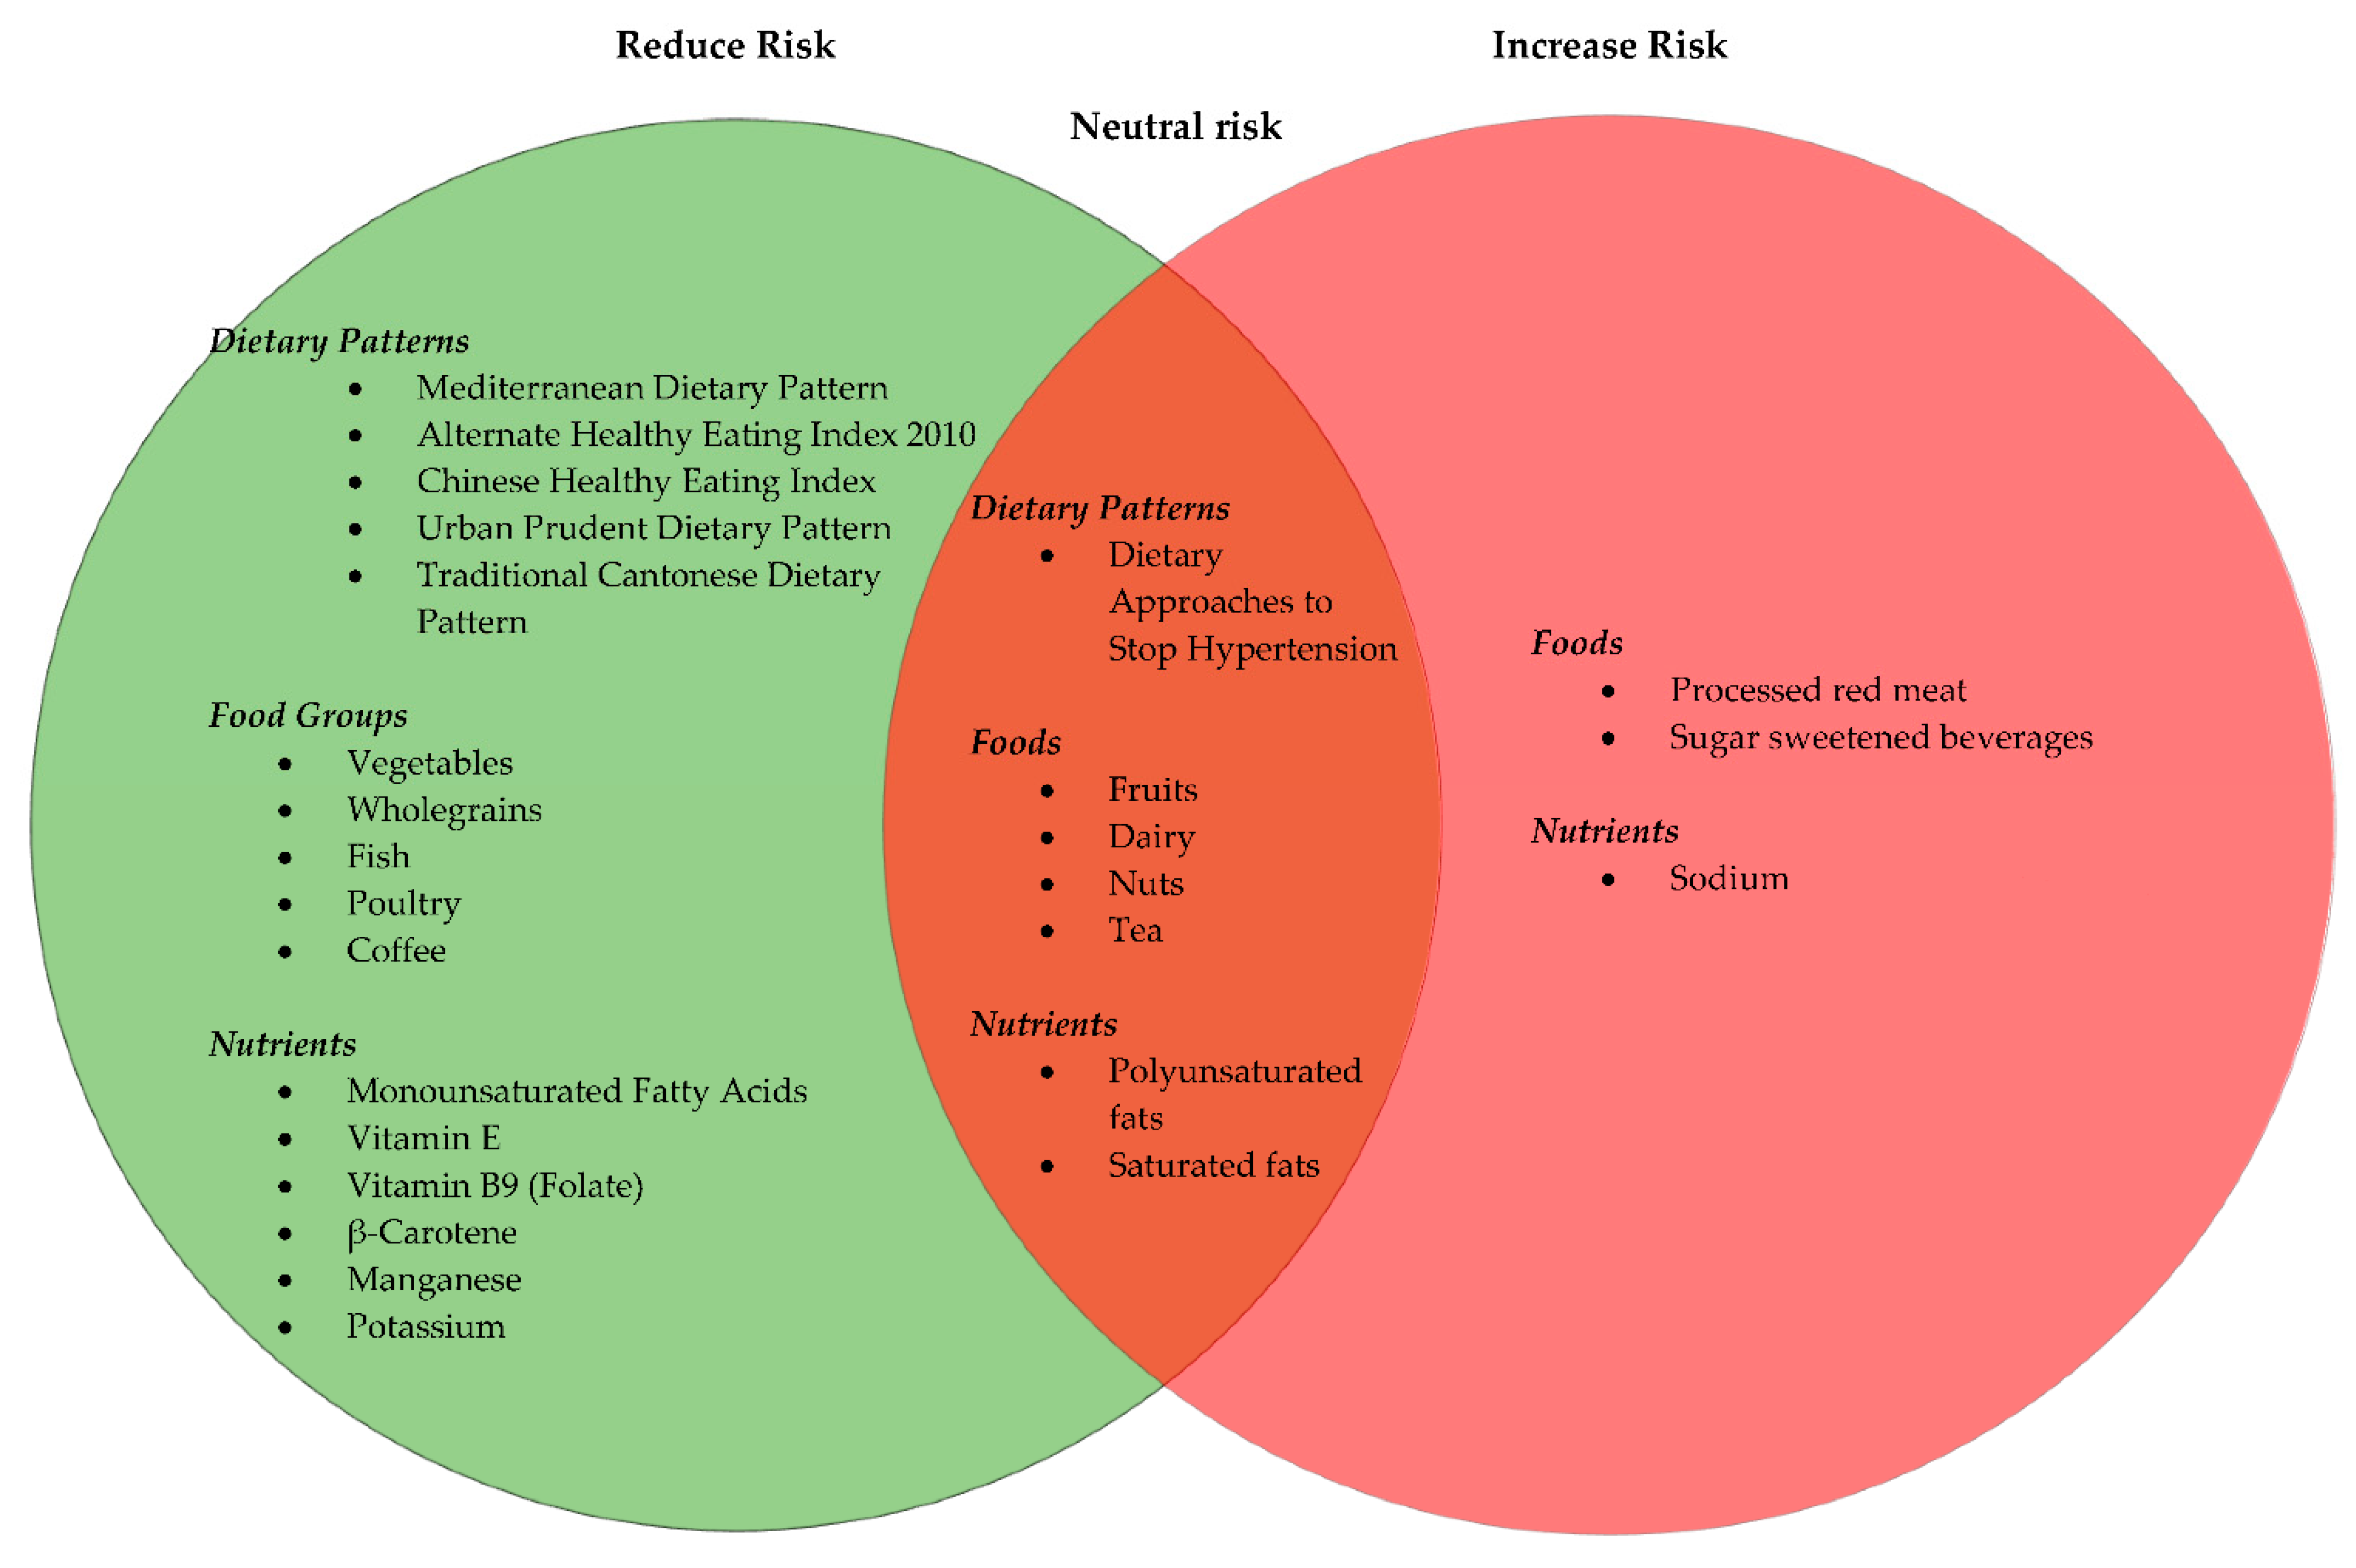
3.3. Dietary Guidelines and Dietary Patterns
3.3.1. Vegetables and Fruits
3.3.2. Red Meat, White Meat and Fish
3.3.3. Dairy and Soy
3.3.4. Wholegrains
3.3.5. Nuts
3.3.6. Beverages
Coffee
Tea
Sugar-Sweetened Beverages
Alcohol
3.3.7. Macronutrients
Fats
3.3.8. Micronutrients
3.4. Risk of Bias
4. Discussion
5. Conclusions
Author Contributions
Funding
Informed Consent Statement
Conflicts of Interest
Abbreviations
| HBV | hepatitis B virus |
| HCV | hepatitis C virus |
| HCC | hepatocellular carcinoma |
| IGF-1 | insulin-like growth factor |
| MAFLD | metabolic-associated fatty liver disease |
| PRISMA | Preferred Reporting Items for Systematic Reviews and Meta-Analysis |
| PLC | primary liver cancer |
| PUFA | polyunsaturated fatty acids |
References
- Rowe, J.H.; Ghouri, Y.A.; Mian, I. Review of hepatocellular carcinoma: Epidemiology, etiology, and carcinogenesis. J. Carcinog. 2017, 16, 1. [Google Scholar] [CrossRef] [PubMed]
- Koumbi, L. Dietary factors can protect against liver cancer development. World J. Hepatol. 2017, 9, 119–125. [Google Scholar] [CrossRef] [PubMed]
- Australian Institute of Health and Welfare, Commonwealth of Australia. Liver Cancer Statistics Canberra. 2019. Available online: https://liver-cancer.canceraustralia.gov.au/statistics (accessed on 19 April 2019).
- Rizk, M.; Guilloteau, A.; Mouillot, T.; Thiéfin, G.; Bronowicki, J.-P.; Richou, C.; Doffoel, M.; Assaf, M.D.; Hillon, P.; Cottet, V. Dietary components modulate the risk of hepatocellular carcinoma in cirrhotic patients. Nutr. Res. 2019, 61, 82–94. [Google Scholar] [CrossRef] [PubMed]
- Bray, F.; Ferlay, J.; Soerjomataram, I.; Siegel, R.; Torre, L.; Jemal, A. Global cancer statistics 2018: GLOBOCAN estimates of incidence and mortality worldwide for 36 cancers in 185 countries. CA Cancer J. Clin. 2018, 68, 394–424. [Google Scholar] [CrossRef]
- Torre, L.; Bray, F.; Siegel, R.; Ferlay, J.; Lortet-Tieulent, J.; Jemal, A. Global cancer statistics, 2012. CA Cancer J. Clin. 2015, 65, 87–108. [Google Scholar] [CrossRef]
- Sharp, G.B.; Lagarde, F.; Mizuno, T.; Sauvaget, C.; Fukuhara, T.; Allen, N.; Suzuki, G.; Tokuoka, S. Relationship of hepatocellular carcinoma to soya food consumption: A cohort-based, case-control study in Japan. Int. J. Cancer 2005, 115, 290–295. [Google Scholar] [CrossRef]
- McGlynn, K.; Petrick, J.; London, W. Global epidemiology of hepatocellular carcinoma: An emphasis on demo-graphic and regional variability. Clin. Liver Dis. 2015, 19, 223–238. [Google Scholar] [CrossRef]
- Donato, F.; Boffetta, P.; Puoti, M. A meta-analysis of epidemiological studies on the combined effect of hepatitis B and C virus infections in causing hepatocellular carcinoma. Int. J. Cancer 1998, 75, 347–354. [Google Scholar] [CrossRef]
- Stepien, M.; Duarte-Salles, T.; Fedirko, V.; Trichopoulou, A.; Lagiou, P.; Bamia, C.; Overvad, K.; Tjønneland, A.; Hansen, L.; Boutron-Ruault, M.-C.; et al. Consumption of soft drinks and juices and risk of liver and biliary tract cancers in a European cohort. Eur. J. Nutr. 2016, 55, 7–20. [Google Scholar] [CrossRef]
- Key, T.J.; Schatzkin, A.; Willett, W.C.; Allen, N.E.; Spencer, E.A.; Travis, R.C. Diet, nutrition and the prevention of cancer. Public Health Nutr. 2004, 7, 187–200. [Google Scholar] [CrossRef]
- Vogtmann, E.; Xiang, Y.-B.; Li, H.-L.; Levitan, E.; Yang, G.; Waterbor, J.; Gao, J.; Cai, H.; Xie, L.; Wu, Q.-J.; et al. Fruit and vegetable intake and the risk of colorectal cancer: Results from the Shanghai Men’s Health Study. Cancer Causes Control 2013, 24, 1935–1945. [Google Scholar] [CrossRef] [PubMed]
- Farvid, M.S.; Stern, M.C.; Norat, T.; Sasazuki, S.; Vineis, P.; Weijenberg, M.P.; Wolk, A.; Wu, K.; Stewart, B.W.; Cho, E. Consumption of red and processed meat and breast cancer incidence: A systematic review and meta-analysis of prospective studies. Int. J. Cancer 2018, 143, 2787–2799. [Google Scholar] [CrossRef] [PubMed]
- Turati, F.; Trichopoulos, D.; Polesel, J.; Bravi, F.; Rossi, M.; Talamini, R.; Franceschi, S.; Montella, M.; Trichopoulou, A.; La Vecchia, C.; et al. Mediterranean diet and hepatocellular carcinoma. J. Hepatol. 2014, 60, 606–611. [Google Scholar] [CrossRef] [PubMed]
- Armstrong, H.; Bording-Jorgensen, M.; Dijk, S.; Wine, E. The complex interplay between chronic inflammation, the microbiome, and cancer: Understanding disease progression and what we can do to prevent it. Cancers 2018, 10, 83. [Google Scholar] [CrossRef]
- Montella, M.; Crispo, A.; Giudice, A. HCC, diet and metabolic factors: Diet and HCC. Hepat. Mon. 2011, 11, 159. [Google Scholar]
- Mandair, D.S.; Rossi, R.E.; Pericleous, M.; Whyand, T.; Caplin, M. The impact of diet and nutrition in the preven-tion and progression of hepatocellular carcinoma. Expert Rev. Gastroenterol. Hepatol. 2014, 8, 369–382. [Google Scholar] [CrossRef]
- Schutte, K.K.; Schulz, C.; Malfertheiner, P. Nutrition and Hepatocellular Cancer. Gastrointest. Tumors 2016, 2, 188–194. [Google Scholar] [CrossRef]
- Yang, W.; Zeng, X.; Liu, Z.; Zhao, Q.; Tan, Y.; Gao, J.; Li, H.-L.; Xiang, Y.-B. Diet and liver cancer risk: A narrative review of epidemio-logical evidence. Br. J. Nutr. 2020, 124, 330–340. [Google Scholar] [CrossRef]
- Bamia, C.; Lagiou, P.; Jenab, M.; Aleksandrova, K.; Fedirko, V.; Trichopoulos, D.; Overvad, K.; Tjønneland, A.; Olsen, A.; Clavel-Chapelon, F.; et al. Fruit and vegetable consumption in relation to hepatocellular carcinoma in a multi-centre, European cohort study. Br. J. Cancer 2015, 112, 1273–1282. [Google Scholar] [CrossRef]
- Bamia, C.; Lagiou, P.; Jenab, M.; Trichopoulou, A.; Fedirko, V.; Aleksandrova, K.; Pischon, T.; Overvad, K.; Olsen, A.; Tjønneland, A.; et al. Coffee, tea and decaffeinated coffee in relation to hepatocellular carcinoma in a European population: Multicentre, prospective cohort study. Int. J. Cancer 2015, 136, 1899–1908. [Google Scholar] [CrossRef]
- Bogumil, D.; Park, S.-Y.; Le Marchand, L.; Haiman, C.A.; Wilkens, L.R.; Boushey, C.J.; Setiawan, V.W. High-Quality Diets Are Associated with Reduced Risk of Hepatocellular Carcinoma and Chronic Liver Disease: The Multiethnic Cohort. Hepatol. Commun. 2019, 3, 437–447. [Google Scholar] [CrossRef] [PubMed]
- Chen, P.-Y.; Zhang, D.-M.; Wang, X.-Y.; Lan, Q.-Y.; Liao, G.-C.; Liu, Z.-Y.; Zhang, D.-M.; Zhang, Y.; Chen, Y.-M.; Zhu, H.-L. Adherence to the Chinese or American Dietary Guidelines is associated with a Lower Risk of Primary Liver Cancer in China: A Case-Control Study. Nutrients 2018, 10, 1113. [Google Scholar] [CrossRef] [PubMed]
- Duarte-Salles, T.; Fedirko, V.; Stepien, M.; Aleksandrova, K.; Bamia, C.; Lagiou, P.; Laursen, A.S.D.; Hansen, L.; Overvad, K.; Tjønneland, A.; et al. Dietary fat, fat subtypes and hepatocellular carcinoma in a large European cohort. Int. J. Cancer 2015, 137, 2715–2728. [Google Scholar] [CrossRef] [PubMed]
- Duarte-Salles, T.; Fedirko, V.; Stepien, M.; Trichopoulou, A.; Bamia, C.; Lagiou, P.; Lukanova, A.; Trepo, E.; Overvad, K.; Tjønneland, A.; et al. Dairy products and risk of hepatocellular carcinoma: The European Prospective Investigation into Cancer and Nutrition. Int. J. Cancer 2014, 135, 1662–1672. [Google Scholar] [CrossRef]
- Fedirko, V.; Trichopolou, A.; Bamia, C.; Duarte-Salles, T.; Trepo, E.; Aleksandrova, K.; Nöthlings, U.; Lukanova, A.; Lagiou, P.; Boffetta, P.; et al. Consumption of fish and meats and risk of hepatocellular carcinoma: The European Prospective Investigation into Cancer and Nutrition (EPIC). Ann. Oncol. 2013, 24, 2166–2173. [Google Scholar] [CrossRef] [PubMed]
- Freedman, N.D.; Cross, A.J.; McGlynn, K.A.; Abnet, C.C.; Park, Y.; Hollenbeck, A.R.; Schatzkin, A.; Everhart, J.E.; Sinha, R. Association of Meat and Fat Intake with Liver Disease and Hepatocellular Carcinoma in the NIH-AARP Cohort. J. Natl. Cancer Inst. 2010, 102, 1354–1365. [Google Scholar] [CrossRef] [PubMed]
- Inoue, M.; Yoshimi, I.; Sobue, T.; Tsugane, S.; Group, J. Influence of coffee drinking on subsequent risk of hepatocel-lular carcinoma: A prospective study in Japan. J. Natl. Cancer Inst. 2005, 97, 293–300. [Google Scholar] [CrossRef]
- Johnson, S.; Koh, W.; Wang, R.; Govindarajan, S.; Yu, M.; Yuan, J. Coffee consumption and reduced risk of hepatocel-lular carcinoma: Findings from the Singapore Chinese Health Study. Cancer Causes Control 2011, 22, 503–510. [Google Scholar] [CrossRef]
- Li, W.; Park, Y.; McGlynn, K.; Hollenbeck, A.; Taylor, P.; Goldstein, A.M.; Freedman, N.D. Index-based dietary patterns and risk of incident hepa-tocellular carcinoma and mortality from chronic liver disease in a prospective study. Hepatology 2014, 60, 588–597. [Google Scholar] [CrossRef]
- Ma, Y.; Yang, W.; Li, T.; Liu, Y.; Simon, T.G.; Sui, J.; Wu, K.; Giovannucci, E.L.; Chan, A.T.; Zhang, X. Meat intake and risk of hepatocellular carcinoma in two large US prospective cohorts of women and men. Int. J. Epidemiol. 2019, 48, 1863–1871. [Google Scholar] [CrossRef]
- Ma, Y.; Yang, W.; Simon, T.; Smith-Warner, S.; Fung, T.; Sui, J. Dietary Patterns and Risk of Hepatocellular Car-cinoma Among U.S. Men Women Hepatol. 2019, 70, 577–586. [Google Scholar]
- Polesel, J.; Talamini, R.; Montella, M.; Maso, L.; Crovatto, M.; Parpinel, M.; Franceschi, S.; Izzo, F.; Tommasi, L.G.; Serraino, D.; et al. Nutrients intake and the risk of hepatocel-lular carcinoma in Italy. Eur. J. Cancer 2007, 43, 2381–2387. [Google Scholar] [CrossRef]
- Setiawan, V.; Wilkens, L.; Lu, S.; Hernandez, B.; Le-Marchand, L.; Henderson, B. Association of coffee intake with re-duced incidence of liver cancer and death from chronic liver disease in the US multiethnic cohort. Gastroenterology 2015, 148, 15. [Google Scholar] [CrossRef] [PubMed]
- Sui, J.; Yang, W.; Ma, Y.; Li, T.Y.; Simon, T.G.; Meyerhardt, J.A.; Liang, G.; Giovannucci, E.L.; Chan, A.T.; Zhang, X. A Prospective Study of Nut Consumption and Risk of Primary Hepatocellular Carcinoma in the U.S. Women and Men. Cancer Prev. Res. 2019, 12, 367–374. [Google Scholar] [CrossRef] [PubMed]
- Koh, W.-P.; Dan, Y.; Goh, G.-B.; Jin, A.; Wang, R.; Yuan, J.-M. Dietary fatty acids and risk of hepatocellular carcinoma in the Singapore Chinese health study. Liver Int. 2016, 36, 893–901. [Google Scholar] [CrossRef] [PubMed]
- Kuper, H.; Tzonou, A.; Lagiou, P.; Mucci, L.; Trichopoulos, D.; Stuver, S.; Trichopoulou, A. Diet and Hepatocellular Carcinoma: A Case-Control Study in Greece. Nutr. Cancer 2000, 38, 6–12. [Google Scholar] [CrossRef] [PubMed]
- Kurozawa, Y.; Ogimoto, I.; Shibata, A.; Nose, T.; Yoshimura, T.; Suzuki, H.; Sakata, R.; Fujita, Y.; Ichikawa, S.; Iwai, N.; et al. Dietary habits and risk of death due to hepatocellular carcinoma in a large scale cohort study in Japan. Univariate analysis of JACC study data. Kurume Med. J. 2004, 51, 141–149. [Google Scholar] [CrossRef]
- Lan, Q.-Y.; Liao, G.-C.; Zhou, R.-F.; Chen, P.-Y.; Wang, X.-Y.; Chen, M.-S.; Chen, Y.-M.; Zhu, H.-L. Dietary patterns and primary liver cancer in Chinese adults: A case-control study. Oncotarget 2018, 9, 27872–27881. [Google Scholar] [CrossRef]
- Montella, M.; Polesel, J.; La Vecchia, C.; Maso, L.D.; Crispo, A.; Crovatto, M.; Casarin, P.; Izzo, F.; Tommasi, L.G.; Talamini, R.; et al. Coffee and tea consumption and risk of hepatocellular carcinoma in Italy. Int. J. Cancer 2007, 120, 1555–1559. [Google Scholar] [CrossRef]
- Tamura, T.; Wada, K.; Konishi, K.; Goto, Y.; Mizuta, F.; Koda, S.; Hori, A.; Tanabashi, S.; Matsushita, S.; Tokimitsu, N.; et al. Coffee, Green Tea, and Caffeine Intake and Liver Cancer Risk: A Prospective Cohort Study. Nutr. Cancer 2018, 70, 1210–1216. [Google Scholar] [CrossRef]
- Vogtmann, E.; Li, H.L.; Shu, X.O.; Chow, W.H.; Ji, B.T.; Cai, H.; Gao, J.; Zhang, W.; Gao, Y.T.; Zheng, W.; et al. Dietary glycemic load, glycemic index, and carbohydrates on the risk of primary liver cancer among Chinese women and men. Ann. Oncol. 2013, 24, 238–244. [Google Scholar] [CrossRef] [PubMed]
- Yang, W.; Ma, Y.; Liu, Y.; Smith-Warner, S.; Simon, T.; Chong, D.; Qi, Q.; Meyerhardt, J.A.; Giovannucci, E.L.; Chan, A.T.; et al. Association of Intake of Whole Grains and Dietary Fiber with Risk of Hepatocellular Carcinoma in US Adults. JAMA Oncol. 2019, 5, 879–886. [Google Scholar] [CrossRef] [PubMed]
- Yang, W.; Sui, J.; Ma, Y.; Simon, T.G.; Chong, D.; Meyerhardt, J.A.; Willett, W.C.; Giovannucci, E.L.; Chan, A.T.; Zhang, X. A prospective study of dairy product intake and the risk of hepatocellular carcinoma in U.S. men and women. Int. J. Cancer 2020, 146, 1241–1249. [Google Scholar] [CrossRef] [PubMed]
- Zhang, W.; Xiang, Y.; Li, H.; Yang, G.; Cai, H.; Ji, B.; Gao, Y.T.; Zheng, W.; Shu, X.O. Vegetable-based dietary pattern and liver cancer risk: Results from the Shanghai women’s and men’s health studies. Cancer Sci. 2013, 104, 1353–1361. [Google Scholar] [CrossRef] [PubMed]
- Jacobs, S.; Harmon, B.E.; Ollberding, N.J.; Wilkens, L.R.; Monroe, K.R.; Kolonel, L.N.; Le Marchand, L.; Boushey, C.J.; Maskarinec, G. Among 4 Diet Quality Indexes, Only the Alternate Mediterranean Diet Score Is Associated with Better Colorectal Cancer Survival and Only in African American Women in the Multiethnic Cohort. J. Nutr. 2016, 146, 1746–1755. [Google Scholar] [CrossRef]
- Fung, T.T.; McCullough, M.L.; Newby, P.; Manson, J.E.; Meigs, J.B.; Rifai, N. Diet-quality scores and plasma concentrations of markers of inflammation and endothelial dysfunction. Am. J. Clin. Nutr. 2005, 82, 163–173. [Google Scholar] [CrossRef]
- Bøhn, S.K.; Blomhoff, R.; Paur, I. Coffee and cancer risk, epidemiological evidence, and molecular mechanisms. Mol. Nutr. Food Res. 2013, 58, 915–930. [Google Scholar] [CrossRef]
- Kurahashi, N.; Inoue, M.; Iwasaki, M.; Tanaka, Y.; Mizokami, M.; Tsugane, S.; for the JPHC Study Group. Vegetable, fruit and antioxidant nutrient consumption and subsequent risk of hepatocellular carcinoma: A prospective cohort study in Japan. Br. J. Cancer 2009, 100, 181–184. [Google Scholar] [CrossRef]
- Latief, U.; Ahmad, R. Role of Dietary Carotenoids in Different Etiologies of Chronic Liver Diseases. In Descriptive Food Science; InTech: Rijeka, Croatia, 2018. [Google Scholar]
- Zhan, J.; Liu, Y.-J.; Cai, L.-B.; Xu, F.-R.; Xie, T.; He, Q.-Q. Fruit and vegetable consumption and risk of cardiovascular disease: A meta-analysis of prospective cohort studies. Crit. Rev. Food Sci. Nutr. 2017, 57, 1650–1663. [Google Scholar] [CrossRef]
- Benetou, V.; Orfanos, P.; Lagiou, P.; Trichopoulos, D.; Boffetta, P.; Trichopoulou, A. Vegetables and Fruits in Rela-tion to Cancer Risk: Evidence from the Greek EPIC Cohort Study. Cancer Epidemiol. Biomark. Prev. 2008, 17, 387. [Google Scholar] [CrossRef]
- Luo, J.; Yang, Y.; Liu, J.; Lu, K.; Tang, Z.; Liu, P.; Liu, L.; Zhu, Y. Systematic review with meta-analysis: Meat consumption and the risk of hepato-cellular carcinoma. Aliment. Pharm. 2014, 39, 913–922. [Google Scholar] [CrossRef] [PubMed]
- Bonkovsky, H. Iron and the Liver. Am. J. Med. Sci. 1991, 301, 32–43. [Google Scholar] [CrossRef] [PubMed]
- Endres, S.; Ghorbani, R.; Kelley, V.; Georgilis, K.; Lonnemann, G.; van der Meer, J.; Cannon, J.G.; Rogers, T.S.; Klempner, M.S.; Weber, P.C.; et al. The Effect of Dietary Supple-mentation with n—3 Polyunsaturated Fatty Acids on the Synthesis of Interleukin-1 and Tumor Necrosis Factor by Mononuclear Cells. N. Engl. J. Med. 1989, 320, 265–271. [Google Scholar] [CrossRef] [PubMed]
- Linseisen, J.; Welch, A.; Ocké, M.; Amiano, P.; Agnoli, C.; Ferrari, P.; Sonestedt, E.; Chajès, V.; Kaaks, R.; Weikert, C.; et al. Dietary fat intake in the European Pro-spective Investigation into Cancer and Nutrition: Results from the 24-h dietary recalls. Eur. J. Clin. Nutr. 2009, 63, 61. [Google Scholar] [CrossRef] [PubMed]
- Cotton, P.A.; Subar, A.F.; Friday, J.E.; Cook, A. Dietary sources of nutrients among US adults, 1994 to 1996. J. Am. Diet. Assoc. 2004, 104, 921–930. [Google Scholar] [CrossRef]
- Wang, S.; Zhou, M.; Ji, A.; Zhang, D.; He, J. Milk/dairy products consumption and gastric cancer: An update me-ta-analysis of epidemiological studies. Oncotarget 2017, 9, 7126. [Google Scholar] [CrossRef][Green Version]
- Zang, J.; Shen, M.; Du, S.; Chen, T.; Zou, S. The Association between Dairy Intake and Breast Cancer in Western and Asian Populations: A Systematic Review and Meta-Analysis. J. Breast Cancer 2015, 18, 313–322. [Google Scholar] [CrossRef]
- Ros, E. Health Benefits of Nut Consumption. Nutrients 2010, 2, 652–682. [Google Scholar] [CrossRef]
- El-Serag, H.; Tran, T.; Everhart, J. Diabetes increases the risk of chronic liver disease and hepatocellular carcinoma. Gastroenterology 2004, 126, 460–480. [Google Scholar] [CrossRef]
- Gnagnarella, P.; Gandini, S.; La Vecchia, C.; Maisonneuve, P. Glycemic index, glycemic load, and cancer risk: A meta-analysis. Am. J. Clin. Nutr. 2008, 87, 1793–1801. [Google Scholar] [CrossRef]
- Chazelas, E.; Srour, B.; Desmetz, E.; Kesse-Guyot, E.; Julia, C.; Deschamps, V.; Druesne-Pecollo, N.; Galan, P.; Hercberg, S.; Latino-Martel, P.; et al. Sugary drink consumption and risk of cancer: Results from NutriNet-Santé prospective cohort. BMJ 2019, 366, 2408. [Google Scholar] [CrossRef] [PubMed]
- Ouyang, X.; Cirillo, P.; Sautin, Y.; McCall, S.; Bruchette, J.L.; Diehl, A.M.; Johnson, R.J.; Abdelmalek, M.F. Fructose consumption as a risk factor for non-alcoholic fatty liver disease. J. Hepatol. 2008, 48, 993–999. [Google Scholar] [CrossRef] [PubMed]
- Schwingshackl, L.; Hoffmann, G. Mediterranean dietary pattern, inflammation and endothelial function: A sys-tematic review and meta-analysis of intervention trials. Nutr. Metab. Cardiovasc. Dis. 2014, 24, 929–939. [Google Scholar] [CrossRef] [PubMed]
- Kastorini, C.-M.; Milionis, H.; Esposito, K.; Giugliano, D.; Goudevenos, J.; Panagiotakos, D. The Effect of Med-iterranean Diet on Metabolic Syndrome and its Components. J. Am. Coll. Cardiol. 2011, 57, 1299. [Google Scholar] [CrossRef] [PubMed]
- Sofi, F.; Abbate, R.; Gensini, G.F.; Casini, A. Accruing evidence on benefits of adherence to the Mediterranean diet on health: An updated systematic review and meta-analysis. Am. J. Clin. Nutr. 2010, 92, 1189–1196. [Google Scholar] [CrossRef] [PubMed]
- George, E.S.; Kucianski, T.; Mayr, H.L.; Moschonis, G.; Tierney, A.C.; Itsiopoulos, C. A Mediterranean Diet Model in Australia: Strategies for Translating the Traditional Mediterranean Diet into a Multicultural Setting. Nutrients 2018, 10, 465. [Google Scholar] [CrossRef]
- Widmer, R.J.; Flammer, A.J.; Lerman, L.O.; Lerman, A. The Mediterranean diet, its components, and cardiovas-cular disease. Am. J. Med. 2015, 128, 229–238. [Google Scholar] [CrossRef]
- Cespedes, E.; Hu, F. Dietary patterns: From nutritional epidemiologic analysis to national guidelines. Am. J. Clin. Nutr. 2015, 101, 899–900. [Google Scholar] [CrossRef]


| Parameter | Criteria |
|---|---|
| Population | Adults of both sexes above the age of 18 years |
| Intervention | Different dietary patterns (e.g., Mediterranean, Prudent), key food groups and nutrients |
| Comparison | Those who do not develop hepatocellular carcinoma are compared to individuals who do |
| Outcome | Risk of hepatocellular carcinoma |
| Study Design | Observational studies (including case–control studies, nested case–control studies or cohort studies) |
| Relevance questions |
|---|
| 1. Would implementing the studied intervention or procedure (if found successful) result in improved outcomes for the patients/clients/population group? |
| 2. Did the authors study an outcome (dependent variable) or topic that the patients/clients/population group would care about? |
| 3. Is the focus of the intervention or procedure (independent variable) or topic of study a common issue of concern to dietetics practice? |
| 4. Is the intervention or procedure feasible? |
| Validity questions |
| 1. Was the research question clearly stated? |
| 2. Was the selection of study subjects/patients free from bias? |
| 3. Were study groups comparable? |
| 4. Was method of handling withdrawals described? |
| 5. Was blinding used to prevent introduction of bias? |
| 6. Were intervention/therapeutic regimens/exposure factor or procedure and any comparison (s) described in detail? Were intervening factors described? |
| 7. Were outcomes clearly defined and the measurements valid and reliable? |
| 8. Was the statistical analysis appropriate for the study design and type of outcome indicators? |
| 9. Are conclusions supported by results with biases and limitations taken into consideration? |
| 10. Is bias due to study/s funding or sponsorship unlikely? |
| Author; Study Period | Study Design | Country(ies) of Study | Sample Size; Male and Female; Disease State | Participant Characteristics: Age (years); BMI (kg/m2); Co-Morbidities | Diet | Dietary Assessment Method | Risk of HCC |
|---|---|---|---|---|---|---|---|
| EPIC Cohort studies | |||||||
| Stepien et al. (2016) [10] 1992–1998 | European Prospective Investigation into Cancer and Nutrition (EPIC) Cohort study | Denmark, France, Greece, Germany, Italy, the Netherlands, Norway, Spain, Sweden, and the United Kingdom | n = 477,206 M: 141,945 F: 334,768 HCC cases: 191 | Mean age: 59.6 Mean BMI: 28.0 Diabetes: 11.5% | Soft drinks, fruit and vegetable juices | Country-specific dietary questionnaires | Soft drink (>6 servings/week): HR = 1.83, 95% CI: 1.11–3.02, p = 0.01 Artificially sweetened soft drinks: HR = 1.06, 95% CI: 1.03–1.09 Sugar-sweetened soft drinks: HR = 1.00, 95% CI: 0.95–1.06 Juice (<1 serving/week): HR = 0.60, 95% CI: 0.38–0.95, P trend = 0.02 |
| Bamia et al. (2015) [20] 1992–2010 | n = 486,799 M: 145,039 F: 341,760 HCC cases: 201 | Mean age: 49.7 Diabetes (self-reported): 14.8% | Fruit and vegetable intake | Centre-specific questionnaires | Higher vegetable intake: HR = 0.83, 95% CI: 0.71–0.98Fruit intake: HR = 1.01; 95% CI: 0.92–1.11 | ||
| Bamia et al. (2015) [21] 1992–2010 | n = 486,799 M: 145,039 F: 341,760 HCC cases: 201 | Mean age: 53 Diabetes (self-reported): 47.5% | Coffee, tea and decaffeinated coffee intake. Median coffee consumption: M: 354 mL/d F: 290 mL/d | High coffee consumers (Q5 vs. Q1): HR = 0.28, 95% CI: 0.16–0.50, p < 0.001 Decaffeinated coffee: HR = 0.94, 95% CI, 0.39 to 2.28 High tea consumers vs. low tea consumers: HR = 0.41, 95% CI: 0.22–0.78, p = 0.003 | |||
| Duarte- Salles et al. (2015) [24] 1992–2010 | n = 477,206 M: 142,194 F: 335,012 HCC cases: 191 | Mean age: 50.6 Mean BMI: 25.3 Diabetes: 2.3% | Total dietary fat, Subtypes of fats (monounsaturated, polyunsaturated and saturated) and sources of fats (added fats, meat and meat products and dairy products) | Country-specific dietary questionnaires | Total fat (highest vs. lowest): HR = 0.80, 95% CI: 0.65–0.99 Monounsaturated fat: HR = 0.71, 95% CI: 0.55–0.92 Saturated fats: HR = 1.08, 95% CI: 0.88–1.34 | ||
| Duarte-Salles et al. (2014) [25] 1992–2010 | n = 477,206 M: 142,194 F: 335,012 HCC cases: 191 | Milk, cheese and yogurt | Total dairy products (highest vs. lowest tertile): HR = 1.66, 95% CI: 1.13–2.43, p = 0.012 Milk (highest vs. lowest tertile): HR = 1.51, 95% CI: 1.02–2.24, p = 0.049 Cheese (highest vs. lowest tertile): HR = 1.56, 95% CI: 1.02–2.38, p = 0.101 Yogurt (highest vs. lowest tertile): HR = 0.94, 95% CI: 0.65–1.35, p = 0.848 | ||||
| Fedirko et al. (2013) [26] 1992–2010 | n = 477,206 M: 142,194 F: 335012 HCC cases: 191 | Total meat and fish | Total fish intake: HR = 0.80, 95% CI: 0.69–0.97 Lean fish (per 10 g/day): HR = 0.91, 95% CI: 0.81–1.02) Fatty fish (per 10 g/day): HR = 0.92, 95% CI: 0.82–1.03) Crustaceans and molluscs: HR = 0.86, 95% CI: 0.70–1.06 20 g increase in total meat intake offset by a decrease in total fish intake: HR = 1.16, 95% CI: 1.01–1.34 Total meat: HR = 0.93, 95% CI: 0.82–1.12 per 20 g/day Red/processed meats: HR = 0.95, 95% CI: 0.88–1.06 per 10 g day Poultry: HR = 0.99, 95% CI: 0.91–1.09 per 10 g/day | ||||
| MEC Cohort studies | |||||||
| Bogumil et al. (2019) [22] 1993–2013 | Multi-ethnic centre (MEC) cohort study | United States California and Hawaii | n = 169,806 HCC cases: 605 | Age range: 45–75 Mean BMI: 27.2 Diabetes: 8.4% | Healthy Eating Index- 2010 Alternative Healthy Eating Index-2010Alternate Mediterranean Diet Dietary Approaches to Stop Hypertension | FFQ | Healthy Eating Index-2010 (Q5 vs. Q1): HR = 0.69, 95% CI: 0.53–0.91; p = 0.003 Alternative Healthy Eating Index-2010 (Q5 vs. Q1): HR = 0.74, 95% CI: 0.58–0.95; p = 0.048 Alternate Mediterranean Diet (Q5 vs. Q1): HR = 0.68, 95% CI: 0.51–0.90; P trend = 0.016 Dietary Approaches to Stop Hypertension (Q5 vs. Q1): HR = 0.80, 95% CI: 0.62–1.03; p = 0.045 |
| Setiawan et al. (2015) [34] 1993/1996–2012/2012 | n = 162 022 HCC cases: 451 | Coffee intake | 1 cup coffee/day: RR = 0.87, 95% CI: 0.67–1.11 2–3 cups coffee/day: RR = 0.62, 95% CI: 0.46–0.84 ≥4 cups of coffee/day: RR = 0.59; 95% CI: 0.35–0.99 | ||||
| Sun-Yet Sun University Centre case–control studies | |||||||
| Chen et al. (2018) [23] Sep 2013–Oct 2017 | Sun-Yet Sun University Centre case–control study | China | HCC cases: 720 M: 613 F: 107 Control: 720 M: 613 F: 107 | Mean age: Cases: 58.2 Controls: 58.4 Mean BMI: Control: 23.7 Cases: 22.8 Diabetes: Cases: 76 Controls: 57 | The Chinese Healthy Eating IndexThe Healthy Eating Index-2015 | FFQ | The Chinese Healthy Eating Index OR = 0.43, 95% CI: 0.38–0.50 Healthy Eating Index-2015: OR = 0.47, 95% CI: 0.40–0.55 |
| Lan et al. (2018) [39] Sep 2013–Aug 2016 | HCC cases: 782 M: 680 F: 102 Control: 782 M: 680 F: 102 | Mean age: 58 Cases: 52.7 Control: 53.02 Mean BMI: Cases: 22.81 Control: 23.25 HTN: Cases: 14.2% Controls: 11.8% Diabetes: Cases: 8.6% Controls: 4.9% | Urban Prudent Dietary Pattern Meat and Preservative Dietary Pattern Traditional Cantonese Dietary Pattern | Urban Prudent Dietary Pattern (highest quartile): OR = 0.25, 95% CI: 0.18–0.35, p = <0.001 Meat and Preservative Dietary Pattern (highest quartile): OR = 1.98, 95% CI: 1.46–2.6, p <0.001Traditional Cantonese Dietary Pattern (highest quartile): OR = 0.61, 95% CI: 0.46–0.82; P trend = 0.002 | |||
| Singapore Chinese Health Study Cohort studies | |||||||
| Koh et al. (2016) [36] | Singapore Chinese Health Study cohort study | Southern China | n = 60,298 HCC: 488 F: 134 M: 354 | Age range: 45–74 Mean BMI: Cases: 23.9 Non-cases: 23.1 Diabetes: Cases: 18.0% Non-cases: 8.8% | Fatty acids (saturated, monounsaturated, omega-3 and omega-6 PUFA) | Omega-6 PUFA intake (top quartile): HR = 1.49, 95% CI: 1.08–2.07 | |
| Johnson et al. (2011) [29] 1993–1998 | China | n = 61,321 HCC cases: 362 | Coffee, black tea, and other types of tea (e.g., green tea) | Coffee (3+ cups per day vs. non-drinkers): HR = 0.56, 95%C I: 0.31–1.00, p = 0.049 | |||
| Aviano National Cancer Institute case–control studies | |||||||
| Montella et al. (2007) [40] Jan 1999–Jul 2002 | National Cancer Institute in Aviano, the ‘Santa Maria degli Angeli’ General Hospital in Pordenone, the ‘Pascale’ National Cancer Institute, and four General Hospitals in Naples Case–control study | Province of Pordenone (north- eastern Italy) and city of Naples (southern Italy) | HCC cases: 185 M: 149 F: 36 Controls: 412 M: 281 F: 131 | Age range: 43–84 | Coffee, decaffeinated coffee and tea | Coffee consumption (≥28 cups/week): OR = 0.43, 95%CI: 0.16–1.13, p = 0.02 Decaffeinated coffee: OR = 0.72, 95%CI: 0.21–2.50 Tea (≥1 cup/week): OR = 1.43, 95% CI: 0.76–2.66 | |
| Polesel et al. (2007) [33] Jan 1999–Jul 2002 | HCC cases: 185 M: 149 F: 36 Controls: 412 M: 281 F: 131 | Age range: 43–84 | Dietary data divided into 7 sections: milk, hot beverages and sweeteners; bread, cereals; first courses; second courses (meat and other mains); side dishes (vegetables); fruits; sweets, desserts and soft drinks; alcoholic beverages | High iron-containing foods: OR = 3.00, 95% CI: 1.25–7.23 Wine:OR = 1.61, 95% CI: 0.78–3.30 Polyunsaturated fatty acids: OR = 0.35, 95% CI: 0.18–0.69 B-carotene also possibly reduces HCC risk (OR = 0.48, 95% CI: 0.24–0.93). | |||
| Shanghai Women’s Health Study and Shanghai Men’s Health cohort study | |||||||
| Vogtman etal. (2013) [42] | Shanghai Women’s Health Study and Shanghai Men’s Health Study cohort study | Shanghai, China | n = 132,837 M: 60,207 F: 72,966 | Mean age: M: 54.8 F: 50.7 Mean BMI: M: 23.7 F: 23.7 | Dietary glycemic index, glycemic load and carbohydrate | Consumption of glycemic load: Women Q5: HR = 1.13, 95% CI: 0.66–1.93 Men Q5: HR = 1.07, 95% CI: 0.70–1.66 Consumption of glycemic Index: Women Q5: HR = 2.41, 95% CI: 1.23–4.7 Men Q5: HR = 0.95, 95% CI: 0.63–1.43 Consumption of carbohydrate: Women Q5: HR = 0.92, 95% CI: 0.56–1.50 Men Q5: HR = 1.16, 95% CI: 0.75–1.81 | |
| Zhang et al. (2013) [45] | n = 132,837 M: 60,207 F: 72,966 HCC: 267 | Mean age: M: 56.1 ± 10.3 F: 52.6 ± 9.1 Mean BMI non-cases: M: 23.7 ± 3.1 F: 24.0 Mean BMI cases: M: 23.3 ± 0.3 F: 24.7 ± 0.3 | Vegetable-based diet, fruit-based diet and meat-based diet | Vegetable-based dietary pattern (Q4): HR = 0.58, 95% CI: 0.40–0.84; p = 0.01 Fruit-based dietary pattern (Q4): HR = 1.13, 95% CI: 0.78–1.64; p = 0.39 Meat-based dietary pattern (Q4): HR = 1.18, 95% CI: 0.83–1.69; p = 0.51 | |||
| Freedman etal. (2010) [27] 1995–1997 | Cohort study | California, Florida, Georgia, Lousiana, Michigan, New Jersey, North Carolina, Pennsylvania | n = 303,172 M: 176,845; F: 126,327 HCC: 338 | Age range: 50–71 Mean age: Women—Cases: 59.0 Controls: 52.4 Men—Cases: 59.4 Controls: 55.2 Mean BMI: Women—Cases: 24.7 Controls: 24.0 Men—Cases: 23.3 Controls: 23.7 | Red meat, white meat, processed meat and total fat | White meat:HR = 0.52, 95% CI: 0.36–0.77 Red meat: HR = 1.74, 95% CI: 1.16–2.61 Saturated fat: HR = 1.87, 95% CI: 1.23–2.85 Total fat intake (Q5 vs. Q1: HR = 1.46, 95% CI: 0.98–2.19, p = 0.045 | |
| Inoue et al. (2005) [28] 1990–1993 | Cohort study | Japan | n = 90,452 M: 43,109 F: 47,343 HCC: 334 | Age range: 40–69 | Coffee consumption | Self-administered questionnaire | Coffee: HR = 0.49, 95% CI: 0.36–0.66 1–2 cups/day: HR = 0.52, 95% CI: 0.38–0.73 3–4 cups/day: HR = 0.48, 95% CI: 0.28–0.83 ≥5 cups/day: HR = 0.24, 95% CI: 0.08–0.77 |
| Kuper et al. (2000) [37] Jan 1995–Dec 1998 | Case–control study | Greece | n = 225 Controls: 128 M: 110 F: 18 HCC incidence: 97 M: 85 F: 12 | NA | Food groups: cereals; starchy roots; sugars and syrups; pulses and nuts; vegetables; fruits; meats, fish, and eggs; milk and dairy products; added lipids; and non-alcoholic beverages | FFQ | Vegetable intake: OR = 1.21, 95% CI: 0.80–1.82, p = 0.36 Dairy intake: OR = 0.70, 95% CI: 0.49–1.01, p = 0.06 Monounsaturated fat: OR = 0.47, 95% CI: 0.25–0.87 |
| Kurozawa et al. (2004) [38] 1988–1999 | Cohort study | Japan | n = 110,688 M: 46,399 F: 64,289 | Age range: M: 40–59 F: 40–59 BMI: NA | 33 food items: beef, pork, ham and sausage, chicken, liver, eggs, milk, yogurt, cheese, butter, margarine, fried food, fried vegetables, fish, fish paste, dried fish, green leafy vegetables, carrots and squash, tomatoes, cabbage and lettuce, Chinese cabbage, edible wild plants, mushrooms, potatoes, seaweeds, pickles, foods boiled down in soy sauce (tsukudani), boiled beans, tofu, oranges, fruits other thanoranges, fruit juice and cakes | Self-administered questionnaire | Carrots and squash (3–4x/week) women aged 60–79 years: HR = 0.29, 95% CI: 0.10–0.78, p < 0.05 Potatoes (1–2x/week) women aged 40–59 years: HR = 0.10, 95% CI: 0.01–0.99, p < 0.05 Coffee (1+/day) men aged 60–79 years: HR = 0.41, 95% CI: 0.19–0.90 Coffee (1+/day) women aged 60–79 years: HR = 0.30, 95% CI: 0.10–0.89 |
| Rizk et al. (2019) [4] Jun 2008–Dec 2012 | Case– control study | North- East France | n = 582 Controls: 401 M: 267 Cases: 181 M: 156 | Mean age: Controls: 59 Cases: 64 | Food variables were measured for 27 predefined food groups Information about the consumption of 208 food items and 23 nutrients were collected | Diet history questionnaire | Carbonated beverages: OR = 2.44, 95% CI: 1.17–5.09; p = 0.021 Total cereals group: OR = 1.87, 95% CI: 1.09–3.22; p = 0.035 Processed meat group: OR = 1.97, 95% CI: 1.14–3.41; p = 0.028 High-fat dairy products: OR = 1.41, 95% CI: 0.82–2.43; p = 0.36 Low-fat dairy products: OR = 1.01, 95% CI: 0.58–1.76; p = 0.82 |
| Sharp et al. (2005) [7] 1965–1988 | Cohort, with nested case-control subset | Japan | HCC cases: 176Control: 560 | NA | Soya food consumption | FFQ | Miso soup (5 times/week): OR = 0.5, 95% CI: 0.29–0.95 Tofu (5 times/week): OR = 0.5, 95% CI: 0.20–0.99 Miso soup (95% CI: 0.80–0.98) Tofu 0.92 (95% CI: 0.81–1.05) |
| Tamura et al. (2018) [41] Sep 1992–Mar 2008 | Cohort study | City of Takayama, Gifu Prefecture, Japan | n = 30,824 M: 14,240 F: 16,584 | Mean age: 55.3 BMI: 18.5 to <25: 22, 182 History of diabetes: 4.5% | Coffee, green tea, black tea, caffeine and decaffeinated coffee consumption | Coffee (2x/day or more): HR = 0.4, 95% CI: 0.20–0.79, p = 0.03 | |
| Turati et al. (2014) [14] 1999–2002 and 1995–1998 | Case–control study | Province of Pordenone, city of Naples and Athens, Greece | HCC cases: 518 M: 432 F:86 Control: 722 M: 579 F: 193 | Mean age: Cases: 66 Controls: 65 | Mediterranean diet | Mediterranean Diet Score: ORs = 0.51, 95% CI: 0.34–0.75, p < 0.001 | |
| Yang et al. (2019) [43] 1984–2012 and 1986–2012 | Cohort study | United States | n = 125,455 M: 48,214 F: 77,241 HCC: 141 M: 71 F: 70 | Mean age: 63.4 | Wholegrains and dietary fiber | Wholegrains (T3 vs. T1): HR = 0.63; 95% CI: 0.41–0.96; p = 0.04 Total bran (T3): HR = 0.70; 95% CI: 0.46–1.07 Cereal fiber (tertile 3): HR = 0.68, 95% CI: 0.45–1.03; p = 0.06 Fiber from vegetables (T3): HR = 0.81, 95% CI: 0.54–1.21; p = 0.42 Fiber from fruits (T3): HR = 1.39, 95% CI: 0.88–2.21; p = 0.20 | |
| Li et al. (2014) [30] 1995–2011 | NIH-AARP Diet and Health Study Prospective cohort study | United States | n = 494,942 M: 295,283 F: 199,659 HCC incident cases: 509 | Mean age range = 50–71 years | Healthy Eating Index-2010 and Mediterranean Diet Score | FFQ | HEI-2010 (highest quintile) = HR, 0.72, 95% CI: 0.53–0.97; P trend = 0.03 aMED = HR, 0.62, 95% CI: 0.47–0.84; P trend = 0.0002 |
| NHS and HPFS cohort studies | |||||||
| Ma et al. (2019) [32] 1976–32 year follow up 1986–32 year follow up | Nurses’ Health Study (NHS) and Health Professionals Follow-up Study (HPFS) Prospective cohort study | M (HPFS): 51,529 F (NHS): 121,700 HCC: 160 | Mean age range M: 40–75 years Mean age range F: 30–55 years | Alternative Healthy Eating Index-2010, Alternate Mediterranean Diet and Dietary Approaches to Stop Hypertension | AHEI-2010 (highest tertile) = HR, 0.61 (95% CI: 0.39–0.95; P trend = 0.03) AMED; HR = 0.75; 95% CI: 0.49–1.15; P trend = 0.18)DASH; HR = 0.90; 95% CI: 0.59–1.36; P trend = 0.61) | ||
| Ma et al. (2019) [31] 1976–32 year follow up 1986–32 year follow up | M (HPFS): 51,529 F (NHS): 121,700 HCC: 163 | Intake of total meats, processed red meat, unprocessed red meat, poultry, fish | Processed red meats (highest vs. lowest tertile intake levels) = 1.84 (95% CI: 1.16–2.92, P trend = 0.04) Total white meats (highest vs. lowest tertile intake levels) = 0.61 (CI: 0.40–0.91, P trend = 0.02) Unprocessed red meats = HR, 1.06 95% CI: 0.68–1.63, P trend = 0.85) Poultry = HR, 0.60, 95% CI: 0.40–0.90, P trend = 0.01)Fish = HR, 0.70, 95% CI: 0.47–1.05, P trend = 0.10) | ||||
| Sui et al., (2019) [35] 1976–27.9 year follow up 1986–27.9-year follow-up | M (HPFS): 51,492 F (NHS): 88,783 HCC: 162 | Mean age: M: 59.7 F: 67.8 Mean BMI: M: 25.4 F: 25.9 Diabetes: M: 6.4% F: 3.6% Mean age: 62.5 Mean BMI: 25.1 Diabetes: 5% | Nut consumption (tree nuts, walnuts, peanuts, peanut butter, etc.) | Total nut consumption (highest vs. lowest tertile intake, HR, 0.84; 95% CI, 0.56–1.26) Tree nut consumption = HR, 0.64, 95% CI: 0.43–0.95) NS association with peanuts (p = 0.90) walnuts (p = 0.19), peanut butter (p = 0.34) | |||
| Yang et al. (2020) [44] 1976–32 year follow up 1986–32 year follow up | n = 144,845 M (HPFS): 51,418 F (NHS): 93,427 HCC cases: 164 | Dairy products (total, milk, butter, cheese and yoghurt) | Total dairy (highest vs. lowest tertile) = HR 1.85 (95% CI: 1.19–2.88; p = 0.009) High-fat dairy (HR = 1.81, 95% CI: 1.19–2.76; p = 0.008) Butter (HR = 1.58, 95% CI: 1.06–2.36; p = 0.04) NS association with yoghurt = HR, 0.72, 95% CI: 0.49–1.05; p = 0.26 | ||||
| Study | Relevance | Validity | Outcome | ||||||||||||
|---|---|---|---|---|---|---|---|---|---|---|---|---|---|---|---|
| 1 | 2 | 3 | 4 | 1 | 2 | 3 | 4 | 5 | 6 | 7 | 8 | 9 | 10 | ||
| Bamia et al. (2015) [20] | NA | Y | Y | NA | Y | Y | NA | Y | NA | Y | Y | Y | Y | Y | + |
| Bamia et al. (2015) [21] | NA | Y | Y | NA | Y | Y | NA | Y | NA | Y | Y | Y | Y | Y | + |
| Bogumil et al. (2019) [22] | NA | Y | Y | NA | Y | Y | NA | Y | NA | Y | Y | Y | Y | Y | + |
| Chen et al. (2018) [23] | NA | Y | Y | NA | Y | Y | Y | Unclear | NA | Y | Y | Y | Y | Y | + |
| Duarte-Salles et al. (2015) [24] | NA | Y | Y | NA | Y | Y | NA | Y | NA | Y | Y | Y | Y | Y | + |
| Duarte-Salles et al. (2014) [25] | NA | Y | Y | NA | Y | Y | NA | Y | NA | Y | Y | Y | Y | Y | + |
| Fedirko et al. (2013) [26] | NA | Y | Y | NA | Y | Y | NA | Y | NA | Y | Y | Y | Y | Y | + |
| Freedman et al. (2010) [27] | NA | Y | Y | NA | Y | Y | NA | Y | NA | Y | Y | Y | Y | Y | + |
| Inoue et al. (2005) [28] | NA | Y | Y | NA | Y | Y | NA | Y | NA | Y | Y | Y | Y | Y | + |
| Johnson et al. (2011) [29] | NA | Y | Y | NA | Y | Y | NA | Y | NA | Y | Y | Y | Y | Y | + |
| Li et al. (2014) [30] | NA | Y | Y | NA | Y | Y | NA | Y | NA | NA | Y | Y | Y | Y | + |
| Ma et al. (2019) [31] | NA | Y | Y | NA | Y | Y | NA | Y | NA | NA | Y | Y | Y | Y | + |
| Ma et al. (2019) [32] | NA | Y | Y | NA | Y | Y | NA | Y | NA | NA | Y | Y | Y | Y | + |
| Polesel et al. (2007) [33] | NA | Y | Y | NA | Y | Y | Y | Y | N | Y | Y | Y | Y | Y | + |
| Rizk et al. (2019) [4] | NA | Y | Y | NA | Y | Y | Y | Y | N | Y | Y | Y | Y | Y | + |
| Setiawan et al. (2015) [34] | NA | Y | Y | NA | Y | Y | NA | Y | NA | Y | Y | Y | Y | Y | + |
| Sharp et al. (2005) [7] | NA | Y | Y | NA | Y | Y | Y | NA | N | Y | Y | Y | Y | Y | + |
| Stepien et al. (2016) [10] | NA | Y | Y | NA | Y | Y | NA | Y | N | Y | Y | Y | Y | Y | + |
| Sui et al. (2019) [35] | NA | Y | Y | NA | Y | Y | NA | Y | NA | NA | Y | Y | Y | Y | + |
| Koh et al. (2016) [36] | NA | Y | Y | NA | Y | Y | Y | Y | NA | NA | Y | Y | Y | Y | + |
| Kuper et al. (2000) [37] | NA | Y | Y | NA | Y | Y | Y | Y | NA | Y | Y | Y | Y | Y | + |
| Kurozawa et al. (2004) [38] | NA | Y | Y | NA | Y | Y | Y | Y | Unclear | NA | Y | Y | Y | Y | + |
| Lan et al. (2018) [39] | NA | Y | Y | NA | Y | Y | Y | Y | Unclear | NA | Y | Y | Y | Y | + |
| Montella et al. (2007) [40] | NA | Y | Y | NA | Y | Y | Y | Y | NA | NA | Y | Y | Y | Unclear | + |
| Tamura et al. (2018) [41] | NA | Y | Y | NA | Y | Y | Y | Y | NA | NA | Y | Y | Y | Y | + |
| Turati et al. (2014) [14] | NA | Y | Y | NA | Y | Y | Y | Y | NA | NA | Y | Y | Y | Y | + |
| Vogtmann et al. (2013) [42] | NA | Y | Y | NA | Y | Y | Y | Y | NA | NA | Y | Y | Y | Y | + |
| Yang et al. (2019) [43] | NA | Y | Y | NA | Y | Y | Unclear | N | NA | NA | Y | Y | Y | Y | + |
| Yang et al. (2020) [44] | NA | Y | Y | NA | Y | Y | NA | Y | NA | NA | Y | Y | Y | Y | + |
| Zhang et al. (2013) [45] | NA | Y | Y | NA | Y | Y | Y | Unclear | NA | NA | Y | Y | Y | Y | + |
Publisher’s Note: MDPI stays neutral with regard to jurisdictional claims in published maps and institutional affiliations. |
© 2021 by the authors. Licensee MDPI, Basel, Switzerland. This article is an open access article distributed under the terms and conditions of the Creative Commons Attribution (CC BY) license (http://creativecommons.org/licenses/by/4.0/).
Share and Cite
George, E.S.; Sood, S.; Broughton, A.; Cogan, G.; Hickey, M.; Chan, W.S.; Sudan, S.; Nicoll, A.J. The Association between Diet and Hepatocellular Carcinoma: A Systematic Review. Nutrients 2021, 13, 172. https://doi.org/10.3390/nu13010172
George ES, Sood S, Broughton A, Cogan G, Hickey M, Chan WS, Sudan S, Nicoll AJ. The Association between Diet and Hepatocellular Carcinoma: A Systematic Review. Nutrients. 2021; 13(1):172. https://doi.org/10.3390/nu13010172
Chicago/Turabian StyleGeorge, Elena S., Surbhi Sood, Anna Broughton, Georgia Cogan, Megan Hickey, Wai San Chan, Sonal Sudan, and Amanda J. Nicoll. 2021. "The Association between Diet and Hepatocellular Carcinoma: A Systematic Review" Nutrients 13, no. 1: 172. https://doi.org/10.3390/nu13010172
APA StyleGeorge, E. S., Sood, S., Broughton, A., Cogan, G., Hickey, M., Chan, W. S., Sudan, S., & Nicoll, A. J. (2021). The Association between Diet and Hepatocellular Carcinoma: A Systematic Review. Nutrients, 13(1), 172. https://doi.org/10.3390/nu13010172