Assessing Orthorexia Nervosa: Validation of the Polish Version of the Eating Habits Questionnaire in a General Population Sample


Abstract
1. Introduction
2. Materials and Methods
2.1. Participants and Study Design
2.2. Outcome Measures
2.2.1. The Eating Habits Questionnaire (EHQ)
2.2.2. The Three-Factor Eating Questionnaire (TFEQ-R18)
2.2.3. The Body Dissatisfaction (BD) Scale
2.2.4. Anthropometric and Demographic Measures
2.3. Statistical Analysis
2.3.1. Exploratory Factor Analysis (EFA)
2.3.2. Confirmatory Factor Analysis (CFA)
2.3.3. Multigroup Confirmatory Factor Analysis
2.3.4. Reliability and Sensibility Analyses
2.3.5. Relationships with Sociodemographic Variables
3. Results
3.1. Exploratory Factor Analysis (EFA)
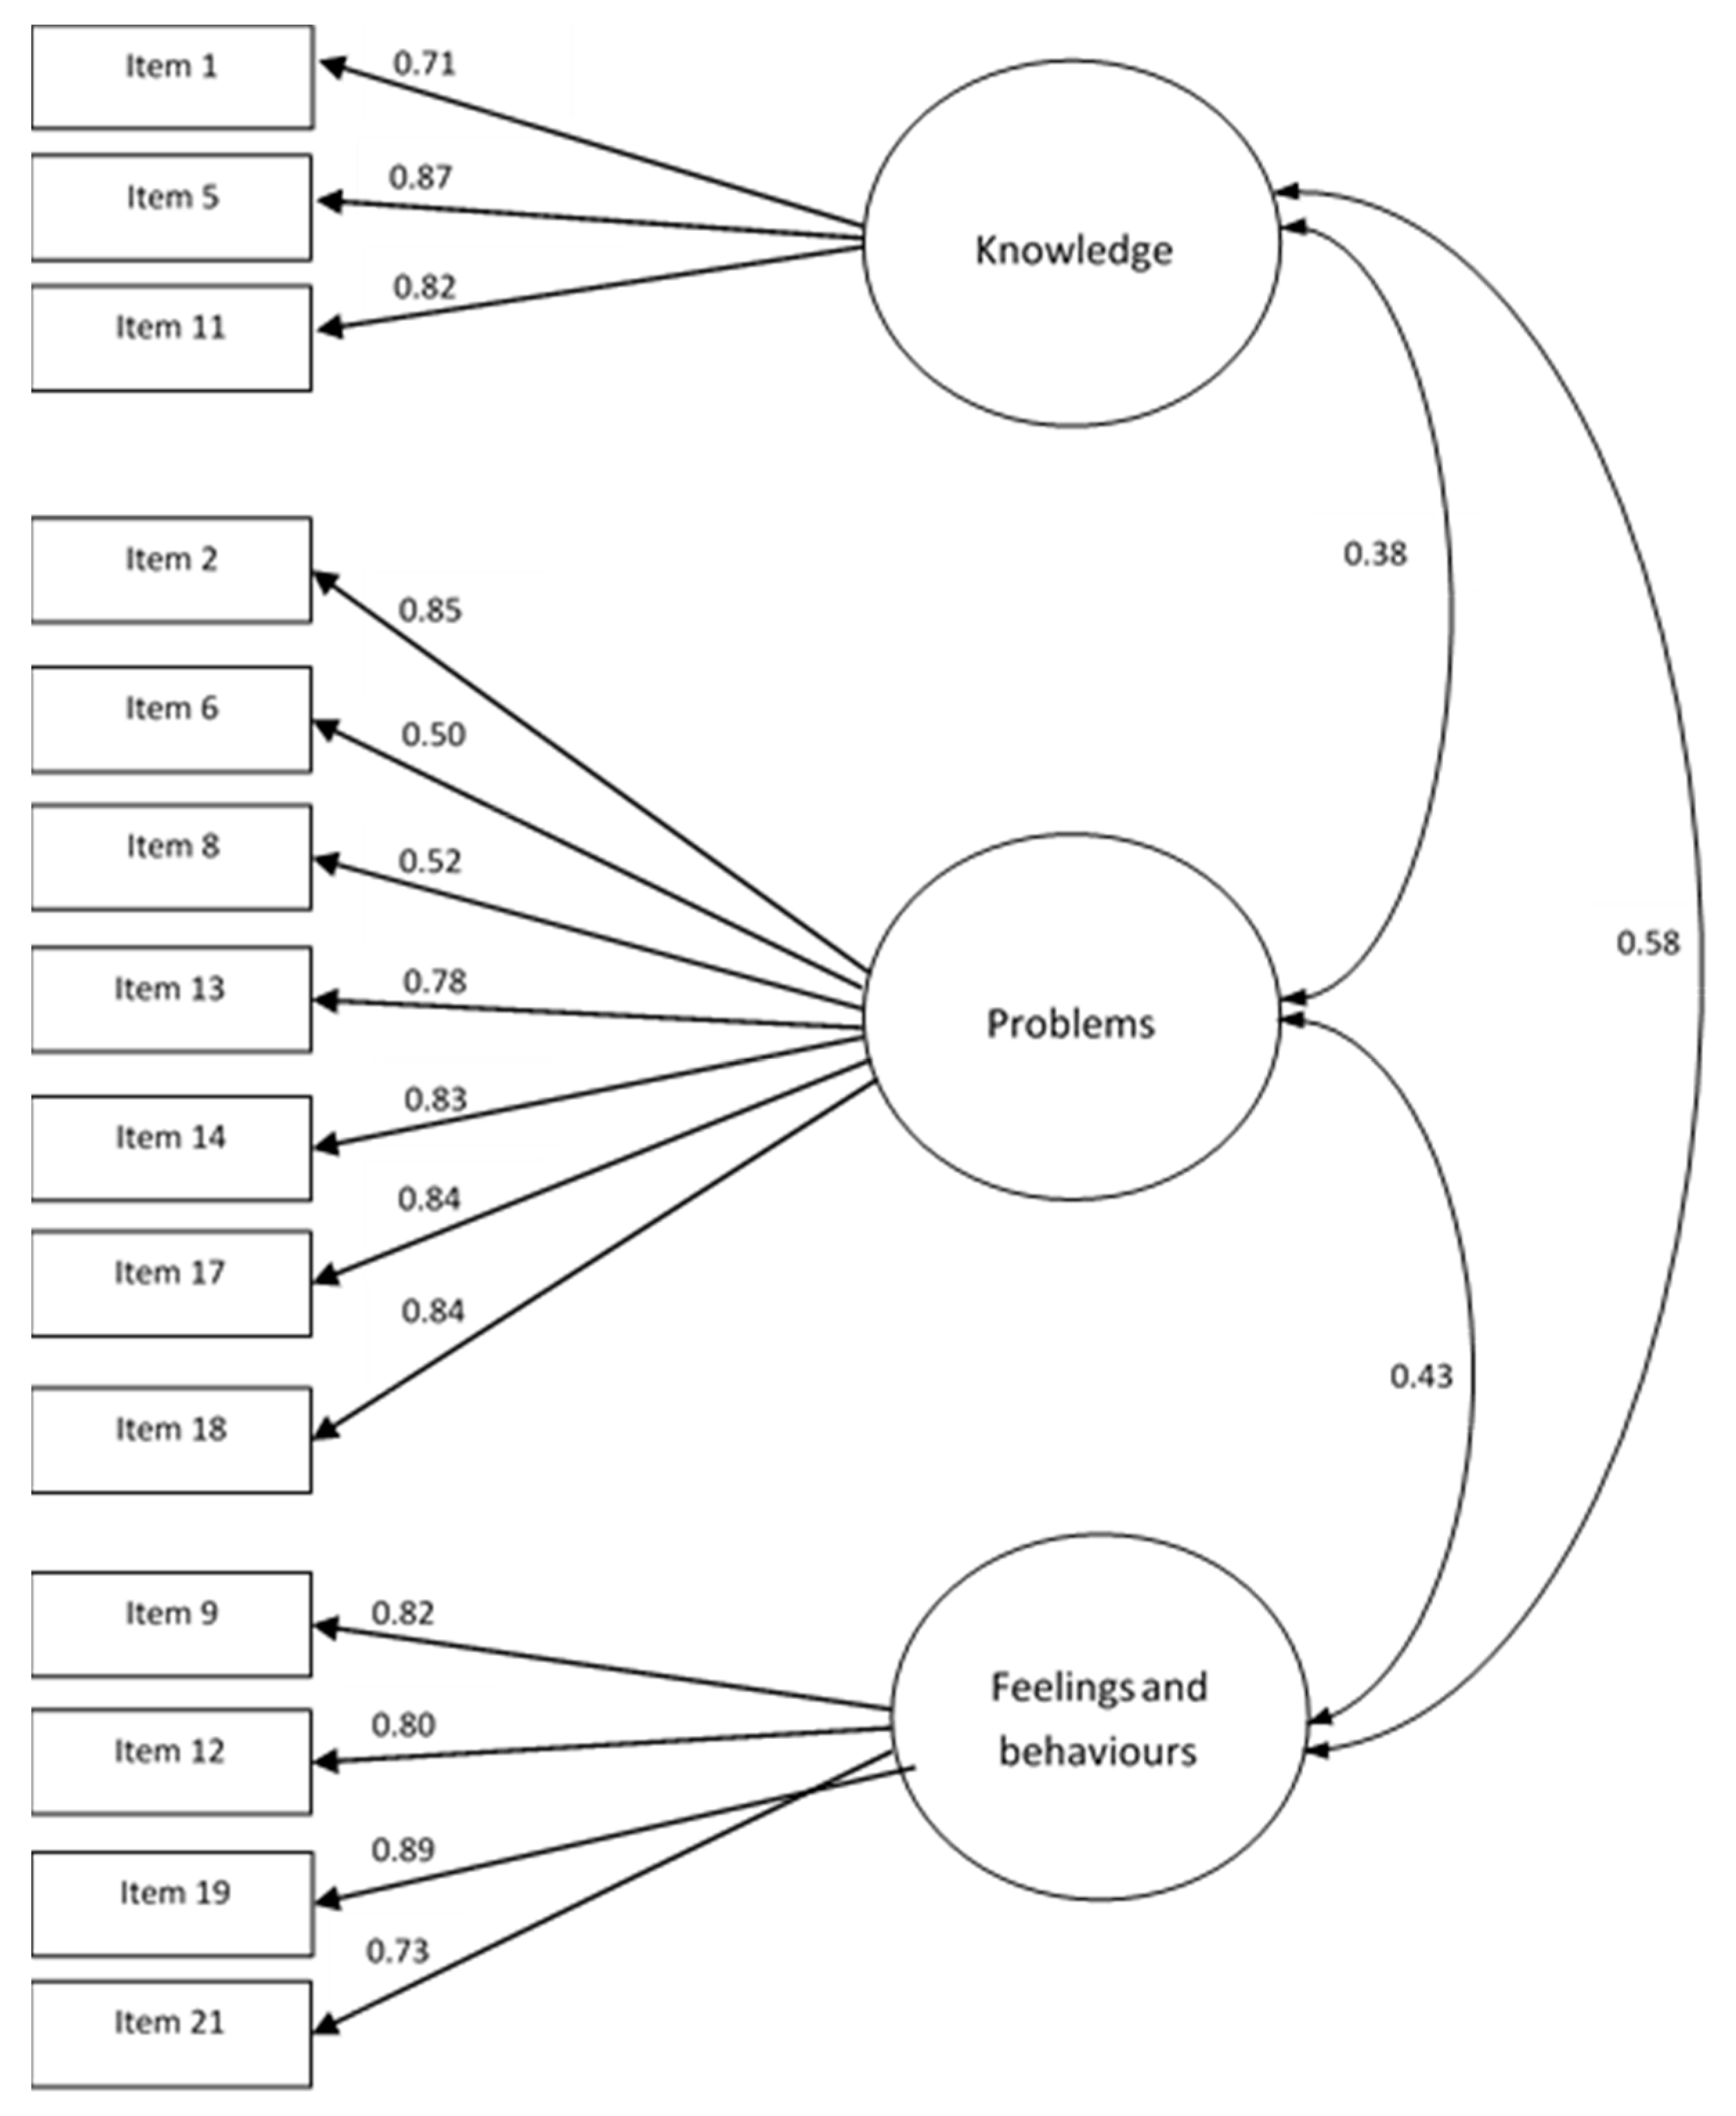
3.2. Comfirmatory Factor Analysis (CFA)
3.3. Multigroup Confirmatory Factor Analysis
3.4. Reliability and Sensibility Analyses
3.5. Relationships with Sociodemographic Variables
4. Discussion
5. Conclusions
Author Contributions
Funding
Conflicts of Interest
Appendix A

| Fałsz, Całkowita Nieprawda | Trochę Prawda | Głównie Prawda | Całkowita Prawda | |
|---|---|---|---|---|
| 1. Jestem lepiej niż inni poinformowany(a) w kwestii zdrowego odżywiania się | ☐ | ☐ | ☐ | ☐ |
| 2. Odrzucam propozycje towarzyskie, które wiążą się z jedzeniem niezdrowego jedzenia | ☐ | ☐ | ☐ | ☐ |
| 3. Sposób w jaki przygotowuję jedzenie jest ważny w mojej diecie | ☐ | ☐ | ☐ | ☐ |
| 4. Ilość zasad obowiązujących w mojej diecie wzrosła | ☐ | ☐ | ☐ | ☐ |
| 5. Moje nawyki żywieniowe są lepsze od nawyków żywieniowych innych ludzi | ☐ | ☐ | ☐ | ☐ |
| 6. Rozpraszają mnie myśli dotyczące zdrowego odżywiania się | ☐ | ☐ | ☐ | ☐ |
| 7. Jem tylko to, na co moja dieta pozwala | ☐ | ☐ | ☐ | ☐ |
| 8. Moje zdrowe odżywianie się jest znaczącym źródłem stresu w moich relacjach z innymi ludźmi | ☐ | ☐ | ☐ | ☐ |
| 9. Podejmowałem(am) wysiłki, by z biegiem czasu jeść zdrowiej | ☐ | ☐ | ☐ | ☐ |
| 10. Moja dieta ma wpływ na rodzaj zatrudnienia jakie bym podjął/podjęła | ☐ | ☐ | ☐ | ☐ |
| 11. Moja dieta jest lepsza niż dieta innych ludzi | ☐ | ☐ | ☐ | ☐ |
| 12. Czuję, że mam kontrolę kiedy zdrowo jem | ☐ | ☐ | ☐ | ☐ |
| 13. W ciągu ostatniego roku przyjaciele lub członkowie rodziny powiedzieli mi, że zbytnio przejmuję się zdrowym odżywianiem | ☐ | ☐ | ☐ | ☐ |
| 14. Mam trudność ze znalezieniem restauracji serwujących jedzenie, które jem | ☐ | ☐ | ☐ | ☐ |
| 15. Jedzenie w taki sposób, w jaki ja to robię, daje mi poczucie satysfakcji | ☐ | ☐ | ☐ | ☐ |
| 16. Niewiele pokarmów jest dla mnie zdrowych | ☐ | ☐ | ☐ | ☐ |
| 17. Rzadziej wychodzę z domu odkąd zacząłem/zaczęłam się zdrowo odżywiać | ☐ | ☐ | ☐ | ☐ |
| 18. Spędzam więcej niż trzy godzinny dziennie na myśleniu o zdrowym jedzeniu | ☐ | ☐ | ☐ | ☐ |
| 19. Czuję się świetnie, kiedy zdrowo jem | ☐ | ☐ | ☐ | ☐ |
| 20. Sztywno trzymam się diety opartej na zdrowym jedzeniu | ☐ | ☐ | ☐ | ☐ |
| 21. Przygotowuję jedzenie w najzdrowszy możliwy sposób | ☐ | ☐ | ☐ | ☐ |
References
- Nevin, S.M.; Vartanian, L.R. The stigma of clean dieting and orthorexia nervosa. J. Eat. Disord 2017, 5, 37. [Google Scholar] [CrossRef] [PubMed]
- Hanganu-Bresch, C. Orthorexia: Eating right in the context of healthism. Med. Humanit. 2020, 46, 311–322. [Google Scholar] [CrossRef] [PubMed]
- Musolino, C.; Warin, M.; Wade, T.; Gilchrist, P. “Healthy anorexia”: The complexity of care in disordered eating. Soc. Sci. Med. 2015, 139, 18–25. [Google Scholar] [CrossRef]
- Bratman, S.; Knight, D. Orthorexia Nervosa: Overcoming the Obsession with Healthful Eating. Health Food Junkies; Broadway Books: New York, NY, USA, 2000. [Google Scholar]
- Cena, H.; Barthels, F.; Cuzzolaro, M.; Bratman, S.; Brytek-Matera, A.; Dunn, T.; Varga, M.; Missbach, B.; Donini, L.M. Definition and diagnostic criteria for orthorexia nervosa: A narrative review of the literature. Eat. Weight Disord. 2019, 24, 209–246. [Google Scholar] [CrossRef] [PubMed]
- Scarff, J.R. Orthorexia Nervosa: An obsession with healthy eating. Fed Pract. 2017, 34, 36–39. [Google Scholar] [PubMed]
- Barthels, F.; Meyer, F.; Huber, T.; Pietrowsky, R. Orthorexic eating behaviour as a coping strategy in patients with anorexia nervosa. Eat. Weight Disord. 2017, 22, 269–276. [Google Scholar] [CrossRef]
- Dunn, T.M.; Bratman, S. On orthorexia nervosa: A review of the literature and proposed diagnostic criteria. Eat. Behav. 2016, 21, 11–17. [Google Scholar] [CrossRef]
- Moroze, R.M.; Dunn, T.M.; Craig, J.H.; Yager, J.; Weintraub, P. Microthinking about micronutrients: A case of transition from obsessions about healthy eating to near-fatal” orthorexia nervosa” and proposed diagnostic criteria. Psychosomatics 2015, 56, 397–403. [Google Scholar] [CrossRef]
- Setnick, J. The Eating Disorders Clinical Pocket Guide: Quick Reference for Healthcare Providers, 2nd ed.; Understanding Nutrition: Dallas, TX, USA, 2013. [Google Scholar]
- Greville-Harris, M.; Smithson, J.; Karl, A. What are people’s experiences of orthorexia nervosa? A qualitative study of online blogs. Eat. Weight Disord. 2020, 1693–1702. [Google Scholar] [CrossRef]
- Mitrofanova, E.; Pummell, E.; Martinelli, L.; Petróczi, A. Does ORTO-15 produce valid data for ‘Orthorexia Nervosa’? A mixed-method examination of participants’ interpretations of the fifteen test items. Eat. Weight Disord. 2020, 1–13. [Google Scholar] [CrossRef]
- Oberle, C.D.; De Nadai, A.S.; Madrid, A.L. Orthorexia Nervosa Inventory (ONI): Development and validation of a new measure of orthorexic symptomatology. Eat. Weight Disord. 2020, 1–14. [Google Scholar] [CrossRef] [PubMed]
- Strahler, J.; Hermann, A.; Walter, B.; Stark, R. Orthorexia nervosa: A behavioral complex or a psychological condition? J. Behav. Addict. 2018, 7, 1143–1156. [Google Scholar] [CrossRef] [PubMed]
- Brytek-Matera, A.; Onieva-Zafra, M.D.; Parra-Fernández, M.L.; Staniszewska, A.; Modrzejewska, J.; Fernández-Martínez, E. Evaluation of Orthorexia Nervosa and Symptomatology Associated with Eating Disorders among European University Students: A Multicentre Cross-Sectional Study. Nutrients 2020, 12, 3716. [Google Scholar] [CrossRef] [PubMed]
- Barthels, F.; Kisser, J.; Pietrowsky, R. Orthorexic eating behavior and body dissatisfaction in a sample of young females. Eat. Weight Disord. 2020. [Google Scholar] [CrossRef] [PubMed]
- Parra-Fernández, M.L.; Onieva-Zafra, M.D.; Fernández-Martínez, E.; Abreu-Sánchez, A.; Fernández-Muñoz, J.J. Assessing the prevalence of orthorexia nervosa in a sample of university students using two different self-report measures. Int. J. Environ. Res. Public Health 2019, 16, 2459. [Google Scholar] [CrossRef]
- Bundros, J.; Clifford, D.; Silliman, K.; Morris, M.N. Prevalence of Orthorexia Nervosa among college students based on Bratman’s test and associated tendencies. Appetite 2016, 101, 86–94. [Google Scholar] [CrossRef]
- Hayes, O.; Wu, M.S.; De Nadai, A.S.; Storch, E.A. Orthorexia Nervosa: An examination of the prevalence, correlates, and associated impairment in a university sample. J. Cogn. Psychother. 2017, 31, 124–135. [Google Scholar] [CrossRef]
- Bauer, S.M.; Fusté, A.; Andrés, A.; Saldaña, C. The Barcelona Orthorexia Scale (BOS): Development process using the Delphi method. Eat. Weight Disord. 2019, 24, 247–255. [Google Scholar] [CrossRef]
- Jenaro Río, C.; Flores Robaina, N.; Bermejo, B.G.; Cruz, M.I. Cuestionario de imagen corporal para la detección temprana de trastornos de la conducta alimentaria. Acción Psicol. 2011, 8, 7–20. [Google Scholar]
- Burda, L. Development and Validation of an Inventory Measuring Dietary Attitudes of Healthy Eating and Orthorexia Nervosa. Ph.D. Thesis, Texas A&M University, Corpus Christi, TX, USA, May 2018. [Google Scholar]
- Bratman, S. The Authorized Bratman Orthorexia Self-Test 2017. Available online: http://www.orthorexia.com/the-authorized-bratman-orthorexia-self-test/ (accessed on 2 December 2020).
- Barthels, F.; Meyer, F.; Pietrowsky, R. Die Düsseldorfer Orthorexie Skala–Konstruktion und Evaluation eines Fragebogens zur Erfassung ortho-rektischen Ernährungsverhaltens. Z. Klin. Psychother. 2015, 44, 97–105. [Google Scholar] [CrossRef]
- Gleaves, D.H.; Graham, E.C.; Ambwani, S. Measuring “orthorexia”: Development of the Eating Habits Questionnaire. Int. J. Educ. Psychol. Assess. 2013, 12, 1–18. [Google Scholar]
- Glen, K.; Gleaves, D. Development and Validation of the Eating Habits Questionnaire-Revised (EHQ-R). Master’s Thesis, University of South Australia, Adelaide, Australia, 2018. Unpublished. [Google Scholar]
- Kramer, M. The Development of a Scale to Measure Orthorexia Nervosa. Master’s Thesis, Colorado State University, Fort Collins, CO, USA, 2016. [Google Scholar]
- Donini, L.M.; Marsili, D.; Graziani, M.P.; Imbriale, M.; Cannella, C. Orthorexia nervosa: Validation of a diagnosis questionnaire. Eat. Weight Disord. 2005, 10, e28–e32. [Google Scholar] [CrossRef] [PubMed]
- Rogoza, R.; Donini, L.M. Introducing ORTO-R: A revision of ORTO-15: Based on the re-assessment of original data. Eat. Weight Disord. 2020. [Google Scholar] [CrossRef] [PubMed]
- Carrero, T.; Padilla Cotto, L.; Rodríguez-Gómez, J. Construcción y validación de una Escala para Tamizar Ortorexia: Primer estudio piloto en Puerto Rico. Bol. Asoc. Med. P. R. 2016, 108, 89–95. [Google Scholar] [PubMed]
- Barrada, J.R.; Roncero, M. Bidimensional structure of the orthorexia: Development and initial validation of a new instrument. An. Psicol. 2018, 34, 283–291. [Google Scholar] [CrossRef]
- Opitz, M.C.; Newman, E.; Alvarado Vazquez Mellado, A.S.; Robertson, M.D.A.; Sharpe, H. The psychometric properties of orthorexia nervosa assessment scales: A systematic review and reliability generalization. Appetite 2020, 155, 104797. [Google Scholar] [CrossRef]
- Meule, A.; Holzapfel, C.; Brandl, B.; Greetfeld, M.; Hessler-Kaufmann, J.B.; Skurk, T.; Quadflieg, N.; Schlegl, S.; Hauner, H.; Voderholzer, U. Measuring orthorexia nervosa: A comparison of four self-report questionnaires. Appetite 2020, 146, 104512. [Google Scholar] [CrossRef]
- Brytek-Matera, A. Vegetarian diet and orthorexia nervosa: A review of the literature. Eat. Weight Disord. 2019. [Google Scholar] [CrossRef]
- Valente, M.; Syurina, E.V.; Donini, L.M. Shedding light upon various tools to assess orthorexia nervosa: A critical literature review with a systematic search. Eat. Weight Disord. 2019, 24, 671–682. [Google Scholar] [CrossRef]
- Bert, F.; Gualano, M.R.; Voglino, G.; Rossello, P.; Perret, J.P.; Siliquini, R. Orthorexia nervosa: A cross-sectional study among athletes competing in endurance sports in northern italy. PLoS ONE 2019, 14, e0221399. [Google Scholar] [CrossRef]
- Brytek-Matera, A.; Czepczor-Bernat, K.; Jurzak, H.; Kornacka, M.; Kołodziejczyk, N. Strict health-oriented eating patterns (orthorexic eating behaviours) and their connection with a vegetarian and vegan diet. Eat. Weight Disord. 2019, 24, 441–452. [Google Scholar] [CrossRef] [PubMed]
- Brytek-Matera, A. The Polish version of the Düsseldorf Orthorexia Scale (PL-DOS) and its comparison with the English version of the DOS (E-DOS). Eat. Weight Disord. 2020. [Google Scholar] [CrossRef] [PubMed]
- Brytek-Matera, A. Interaction between Vegetarian Versus Omnivorous Diet and Unhealthy Eating Patterns (Orthorexia Nervosa, Cognitive Restraint) and Body Mass Index in Adults. Nutrients 2020, 12, 646. [Google Scholar] [CrossRef] [PubMed]
- Brytek-Matera, A. Restrained eating and vegan, vegetarian and omnivore dietary intakes. Nutrients 2020, 12, 2133. [Google Scholar] [CrossRef]
- Chard, C.A.; Hilzendegen, C.; Barthels, F.; Stroebele-Benschop, N. Psychometric evaluation of the English version of the Düsseldorf Orthorexie Scale (DOS) and the prevalence of orthorexia nervosa among a U.S. student sample. Eat. Weight Disord. 2019, 24, 275–281. [Google Scholar] [CrossRef]
- Godefroy, V.; Trinchera, L.; Dorard, G. Optimizing the empirical assessment of orthorexia nervosa through EHQ and clarifying its relationship with BMI. Eat. Weight Disord. 2020. [Google Scholar] [CrossRef]
- Mohamed Halim, Z.; Dickinson, K.M.; Kemps, E.; Prichard, I. Orthorexia nervosa: Examining the Eating Habits Questionnaire’s reliability and validity, and its links to dietary adequacy among adult women. Public Health Nutr. 2020, 23, 1684–1692. [Google Scholar] [CrossRef]
- Hayatbini, N.; Oberle, C.D. Are orthorexia nervosa symptoms associated with cognitive Inflexibility? Psychiatry Res. 2019, 271, 464–468. [Google Scholar] [CrossRef]
- Jovičić, A.Đ. Healthy eating habits among the population of Serbia: Gender and age differences. J. Health Popul. Nutr. 2015, 33, 76–84. [Google Scholar]
- Novara, C.; Pardini, S.; Pastore, M.; Mulatti, C. Ortoressia Nervosa: Un’indagine del costrutto e delle caratteristiche psicometriche della versione italiana dell’Eating Habits Questionnaire-21(EHQ-21). Psicoter. Cogn. Comport. 2017, 23, 291–316. [Google Scholar]
- Oberle, C.D.; Samaghabadi, R.O.; Hughes, E.M. Orthorexia nervosa: Assessment and correlates with gender, BMI, and personality. Appetite 2017, 108, 303–310. [Google Scholar] [CrossRef] [PubMed]
- Oberle, C.D.; Watkins, R.S.; Burkot, A.J. Orthorexic eating behaviors related to exercise addiction and internal motivations in a sample of university students. Eat. Weight Disord. 2018, 23, 67–74. [Google Scholar] [CrossRef] [PubMed]
- Oberle, C.D.; Klare, D.L.; Patyk, K.C. Health beliefs, behaviors, and symptoms associated with orthorexia nervosa. Eat. Weight Disord. 2019, 24, 495–506. [Google Scholar] [CrossRef] [PubMed]
- Oberle, C.D.; Lipschuetz, S.L. Orthorexia symptoms correlate with perceived muscularity and body fat, not BMI. Eat. Weight Disord. 2018, 23, 363–368. [Google Scholar] [CrossRef]
- Zickgraf, H.F.; Ellis, J.M.; Essayli, J.H. Disentangling orthorexia nervosa from healthy eating and other eating disorder symptoms: Relationships with clinical impairment, comorbidity, and self-reported food choices. Appetite 2019, 134, 40–49. [Google Scholar] [CrossRef]
- Voglino, G.; Parente, E.; Bert, F.; Lo Moro, G.; Corradi, A.; Lapiccirella, M.; Gualano, M.R.; Siliquini, R. Orthorexia nervosa, a challenging evaluation: Analysis of a sample of customers from organic food. Psychol Health Med. 2020, 25, 1–9. [Google Scholar] [CrossRef]
- Karlsson, J.; Persson, L.-O.; Sjöström, L.; Sullivan, M. Psychometric properties and factor structure of the Three-Factor Eating Questionnaire (TFEQ) in obese men and women. Results from the Swedish obese subjects (SOS) study. Int. J. Obesity 2000, 24, 1715–1725. [Google Scholar] [CrossRef]
- Brytek-Matera, A.; Rogoza, R.; Czepczor-Bernat, K. The Three-Factor Eating Questionnaire-R18 Polish version: Factor structure analysis among normal weight and obese adult women. Arch. Psychiatry Psychother. 2017, 19, 81–90. [Google Scholar] [CrossRef]
- Garner, D.M.; Olmstead, M.P.; Polivy, J. Development and validation of a multidimensional Eating Disorder Inventory for anorexia nervosa and bulimia. Int. J. Eat. Disord. 1983, 2, 15–34. [Google Scholar] [CrossRef]
- Żechowski, C. Polska wersja Kwestionariusza Zaburzeń Odżywiania (EDI)–adaptacja i normalizacja. Psychiatr. Pol 2008, 42, 179–193. [Google Scholar]
- Gana, K.; Broc, G. Introduction à la Modélisation par Equations Structurales. Manuel Pratique avec Lavaan; ISTE Editions Ltd.: London, UK, 2018. [Google Scholar]
- Cattell, R.B. The scree test for the number of factors. Multivar. Behav. Res. 1966, 1, 245–276. [Google Scholar] [CrossRef]
- Rosseel, Y. lavaan: An R package for structural equation modeling. J. Stat. Softw. 2012, 48, 1–36. [Google Scholar] [CrossRef]
- Hooper, D.; Coughlan, J.; Mullen, M. Structural Equation Modelling: Guidelines for Determining Model Fit. Electron. J. Bus. Res. Methods 2008, 6, 53–60. [Google Scholar]
- Jorgensen, T.D.; Pornprasertmanit, S.; Schoemann, A.M.; Rosseel, Y.; Miller, P.; Quick, C.; Garnier-Villarreal, M.; Selig, J.; Boulton, A.; Preacher, K.; et al. semTools: Useful Tools for Structural Equation Modeling 2015. Available online: http://cran.r-project.org/package=semTools (accessed on 4 May 2020).
- Chen, F.F. Sensitivity of Goodness of Fit Indexes to Lack of Measurement Invariance. Struct. Equ. Modeling 2007, 14, 464–504. [Google Scholar] [CrossRef]
- dos Santos Fontes, A.; Santos, M.S.; de Almeida, M.B.; Marín, P.J.; da Silva, D.R.P.; Da Silva-Grigoletto, M.E. Inter-day reliability of the Upper Body Test for shoulder and pelvic girdle stability in adults. Braz. J. Phys. Ther. 2020, 24, 161–166. [Google Scholar] [CrossRef]
- Koo, T.K.; Li, M.Y. A guideline of selecting and reporting intraclass correlation coefficients for reliability research. J. Chiropr. Med. 2016, 15, 155–163. [Google Scholar] [CrossRef]
- DeVellis, R.F. Scale Development: Theory and Applications, 4th ed.; SAGE Publications: Newbury Park, CA, USA, 2017. [Google Scholar]
- Hankins, M. Questionnaire discrimination: (re)-introducing coefficient delta. BMC Med. Res. Methodol. 2007, 7, 1–5. [Google Scholar] [CrossRef]
- Ebel, R.L. Essentials of Educational Measurement, 2nd ed.; Prentice-Hall: Englewood Cliffs, NJ, USA, 1972; p. 232. [Google Scholar]
- Cohen, J. Statistical Power Analysis for the Behavioral Science, 2nd ed.; Academic Press: New York, NY, USA, 1988. [Google Scholar]
- Herman, C.P.; Mack, D. Restrained and unrestrained eating. J. Pers. 1975, 43, 647–660. [Google Scholar] [CrossRef]
- Depa, J.; Barrada, J.R.; Roncero, M. Are the motives for food choices different in orthorexia nervosa and healthy orthorexia? Nutrients 2019, 11, 697. [Google Scholar] [CrossRef]
- McComb, S.E.; Mills, J.S. Orthorexia nervosa: A review of psychosocial risk factors. Appetite 2019, 140, 50–75. [Google Scholar] [CrossRef]
- Strahler, J. Sex differences in orthorexic eating behaviors: A systematic review and meta-analytical integration. Nutrition 2019, 67–68, 110534. [Google Scholar] [CrossRef] [PubMed]
- Hyrnik, J.; Janas-Kozik, M.; Stochel, M.; Jelonek, I.; Siwiec, A.; Rybakowski, J. K The assessment of orthorexia nervosa among 1899 Polish adolescents using the ORTO-15 questionnaire. Int. J. Psychiatry Clin. Pract. 2016, 20, 199–203. [Google Scholar] [CrossRef] [PubMed]

| EHQ Items | Factor Loading | ||
|---|---|---|---|
| F1 | F2 | F3 | |
| 1. I am more informed than others about healthy eating. | 0.53 | −0.03 | 0.21 |
| 2. I turn down social offers that involve eating unhealthy food. | 0.13 | 0.49 | 0.05 |
| 3. The way my food is prepared is important in my diet. | 0.4 | 0.03 | 0.42 |
| 4. I follow a diet with many rules. | 0.31 | 0.13 | 0.42 |
| 5. My eating habits are superior to others. | 0.83 | −0.07 | 0.08 |
| 6. I am distracted by thoughts of eating healthy. | −0.16 | 0.56 | 0.17 |
| 7. I only eat what my diet allows. | 0.4 | 0.37 | −0.02 |
| 8. My healthy eating is a significant source of stress in my relationships. | −0.12 | 0.79 | −0.07 |
| 9. I have made efforts to eat more healthily over time. | −0.07 | 0.03 | 0.73 |
| 10. My diet affects the type of employment I would take. | 0.2 | 0.44 | 0 |
| 11. My diet is better than other peoples’ diets. | 0.79 | 0.07 | −0.02 |
| 12. I feel in control when I eat healthily. | 0.11 | 0.09 | 0.64 |
| 13. In the past year, friends or family members have told me that I’m overly concerned with eating healthily. | 0.15 | 0.62 | −0.01 |
| 14. I have difficulties finding restaurants that serve the foods I eat. | 0.13 | 0.58 | −0.05 |
| 15. Eating the way I do gives me a sense of satisfaction. | 0.2 | −0.01 | 0.39 |
| 16. Few foods are healthy for me to eat. | −0.07 | 0.51 | 0.14 |
| 17. I go out less since I began eating healthily. | 0.09 | 0.65 | −0.03 |
| 18. I spend more than three hours a day thinking about healthy food. | −0.1 | 0.74 | 0.09 |
| 19. I feel great when I eat healthily. | −0.02 | −0.07 | 0.79 |
| 20. I follow a health-food diet rigidly. | 0.37 | 0.43 | 0.09 |
| 21. I prepare food in the most healthful way. | 0.16 | 0.18 | 0.47 |
| EHQ and Its Versions | χ2 | p | χ2df | RMSEA | SRMR | AGFI | TLI | CFI |
|---|---|---|---|---|---|---|---|---|
| EHQ [18] | NA | NA | NA | 0.07 | NA | NA | 0.90 | 0.91 |
| PL-EHQ | 76.240 | 0.406 | 1.030 | 0.008 | 0.056 | 0.983 | 0.999 | 0.999 |
| Italian version of the EHQ [46] | 228.190 | 0.020 | NA | 0.050 | NA | NA | NA | 0.990 |
| French version of the EHQ [42] | NA | NA | NA | 0.04 | 0.05 | NA | 0.98 | NA |
| Model | CFI | SRMR | RMSEA | χ2 | ΔCFI | ΔSRMR | ΔRMSEA | Δχ2 |
|---|---|---|---|---|---|---|---|---|
| Female | 0.945 | 0.042 | 0.046 | 160.881 | ||||
| Male | 0.925 | 0.050 | 0.044 | 126.038 | ||||
| Configural | 0.935 | 0.045 | 0.046 | 289.515 | ||||
| Metric | 0.957 | 0.048 | 0.036 | 250.585 | 0.022 | 0.003 | 0.01 | 38.93 |
| Scalar | 0.959 | 0.048 | 0.034 | 258.281 | 0.001 | 0 | 0.002 | 7.696 |
| Strict | 0.961 | 0.051 | 0.032 | 267.9 | 0.002 | 0.003 | 0.002 | 9.619 |
| Variables | Age | BMI | BD | EHQ | K | P | F&B | UE | EE |
|---|---|---|---|---|---|---|---|---|---|
| 1. Age | |||||||||
| 2. Body mass index | 0.22 * | ||||||||
| 3. Body dissatisfaction (EDI) | 0.01 | 0.18 * | |||||||
| 4. Eating Habits Questionnaire total score | −0.05 | −0.06 * | 0.11 * | ||||||
| 5. Knowledge (EHQ) | 0 | −0.08 * | −0.01 | 0.76 * | - | ||||
| 6. Problems (EHQ) | −0.07 * | −0.04 | 0.14 * | 0.81 * | 0.38 * | ||||
| 7. Feelings and behaviors (EHQ) | −0.04 | −0.04 | 0.1 * | 0.83 * | 0.58 * | 0.43 * | |||
| 8. Uncontrolled eating (TFEQ-R18) | −0.16 * | 0.04 | 0.11 * | 0.1 * | 0 | 0.11 * | 0.11 * | ||
| 9. Emotional eating (TFEQ-R18) | −0.1 * | 0.12 * | 0.14 * | 0.11 * | 0.03 | 0.1 * | 0.12 * | 0.74 * | |
| 10. Cognitive restraint (TFEQ-R18) | −0.02 | 0.1 * | 0.08 * | 0.32 * | 0.24 * | 0.24 * | 0.3 * | 0.33 * | 0.34 * |
| Measure | Female | Male | U (1, 965) | p-Value | d | ||
|---|---|---|---|---|---|---|---|
| M | SD | M | SD | ||||
| EHQ | 25.7 | 7.32 | 24.7 | 6.91 | 121732 * | 0.038 a | 0.14 |
| Knowledge (EHQ) | 5.96 | 2.33 | 5.63 | 2.18 | 112933 | 0.990 | |
| Problems (EHQ) | 10.87 | 3.69 | 10.45 | 3.48 | 121099 | 0.050 | 0.17 |
| Feelings and behaviors (EHQ) | 3.14 | 3.09 | 8.62 | 3.00 | 124090 ** | 0.008 a | |
| Body dissatisfaction (EDI) | 1.41 | 0.49 | 1.38 | 0.49 | 115178 | 0.433 | |
| Cognitive restraint (TFEQ-R18) | 9.75 | 3.75 | 11.83 | 4.03 | 79207 *** | <0.001 a | −0.54 |
| Uncontrolled eating (TFEQ-R18) | 10.22 | −6.03 | 15.06 | 7.11 | 67251 *** | <0.001 a | −0.75 |
| Emotional eating (TFEQ-R18) | 3.73 | 2.68 | 4.93 | 3.05 | 86818 *** | <0.001 a | −0.43 |
| Body mass index | 22.26 | 3.76 | 22.85 | 3.79 | 101221 ** | 0.006 a | −0.15 |
| Age | 23.86 | 5.77 | 22.62 | 3.34 | 6119016 | 0.147 | |
Publisher’s Note: MDPI stays neutral with regard to jurisdictional claims in published maps and institutional affiliations. |
© 2020 by the authors. Licensee MDPI, Basel, Switzerland. This article is an open access article distributed under the terms and conditions of the Creative Commons Attribution (CC BY) license (http://creativecommons.org/licenses/by/4.0/).
Share and Cite
Brytek-Matera, A.; Plasonja, N.; Décamps, G. Assessing Orthorexia Nervosa: Validation of the Polish Version of the Eating Habits Questionnaire in a General Population Sample. Nutrients 2020, 12, 3820. https://doi.org/10.3390/nu12123820
Brytek-Matera A, Plasonja N, Décamps G. Assessing Orthorexia Nervosa: Validation of the Polish Version of the Eating Habits Questionnaire in a General Population Sample. Nutrients. 2020; 12(12):3820. https://doi.org/10.3390/nu12123820
Chicago/Turabian StyleBrytek-Matera, Anna, Natalija Plasonja, and Greg Décamps. 2020. "Assessing Orthorexia Nervosa: Validation of the Polish Version of the Eating Habits Questionnaire in a General Population Sample" Nutrients 12, no. 12: 3820. https://doi.org/10.3390/nu12123820
APA StyleBrytek-Matera, A., Plasonja, N., & Décamps, G. (2020). Assessing Orthorexia Nervosa: Validation of the Polish Version of the Eating Habits Questionnaire in a General Population Sample. Nutrients, 12(12), 3820. https://doi.org/10.3390/nu12123820