Response of Vitamin D after Magnesium Intervention in a Postmenopausal Population from the Province of Granada, Spain

 ,
,  ,
, 
Abstract
1. Introduction
2. Materials and Methods
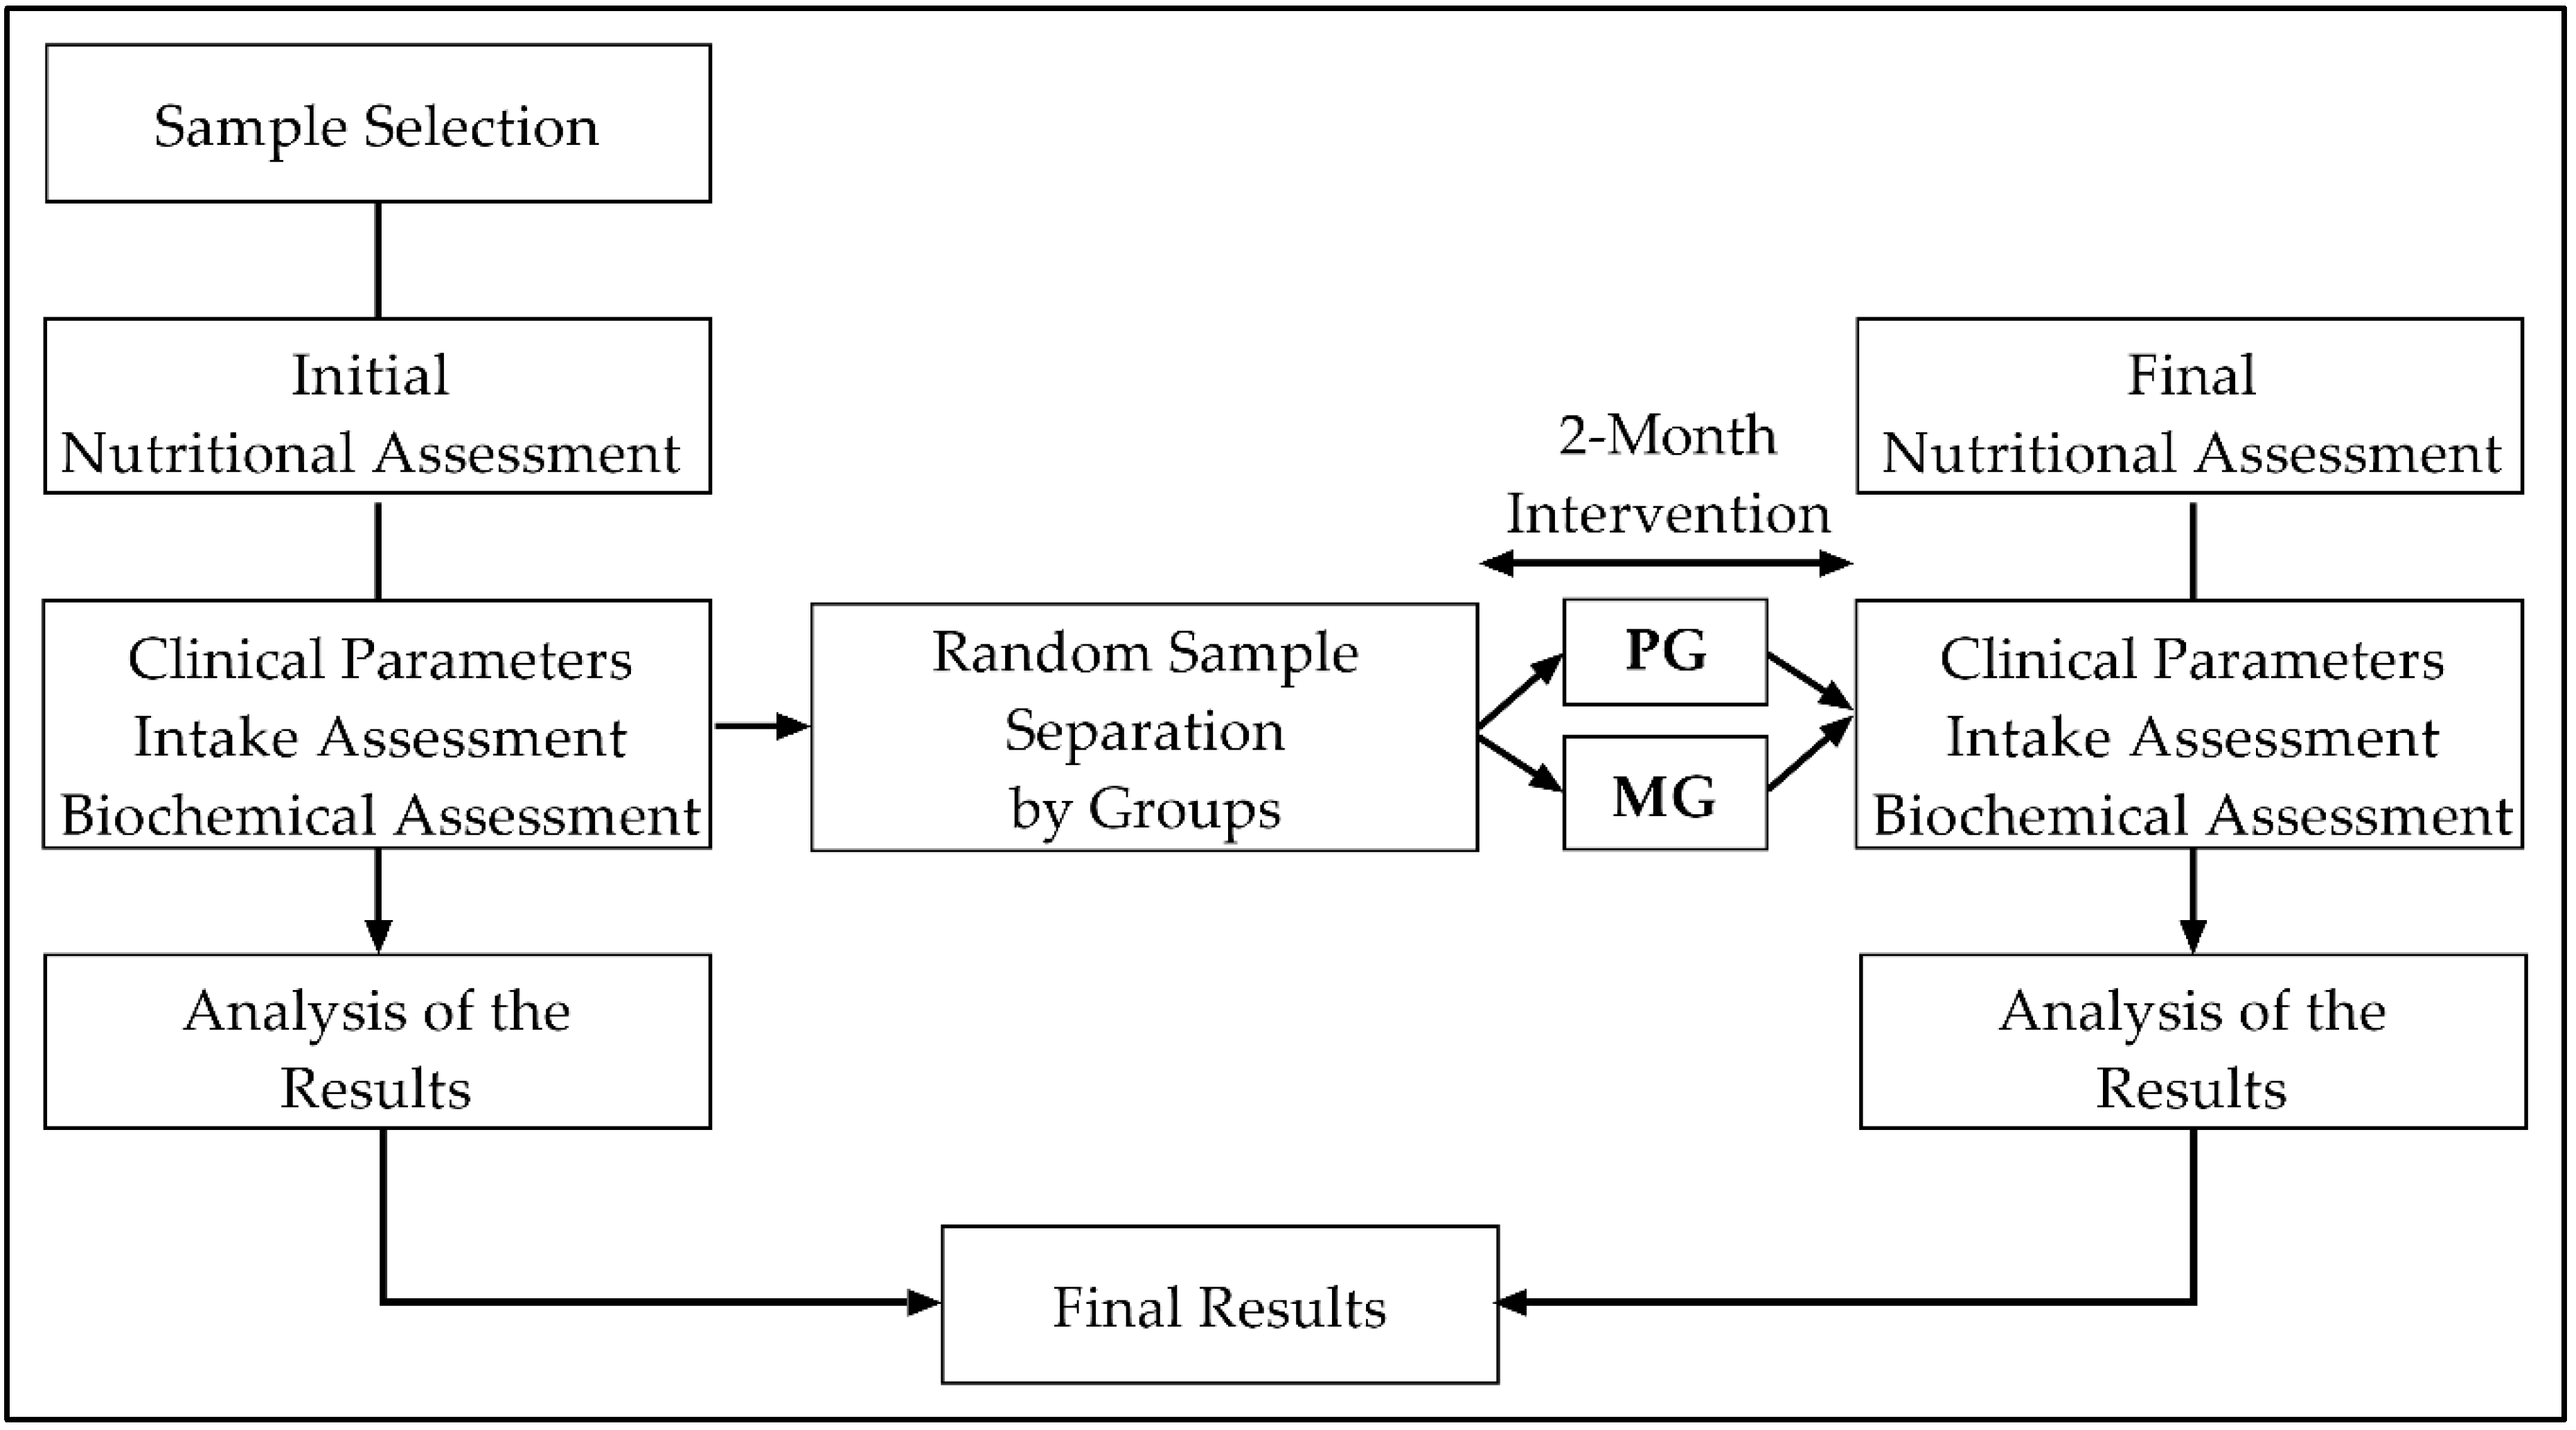
2.1. Study Design and Intervention
2.2. Study Participants
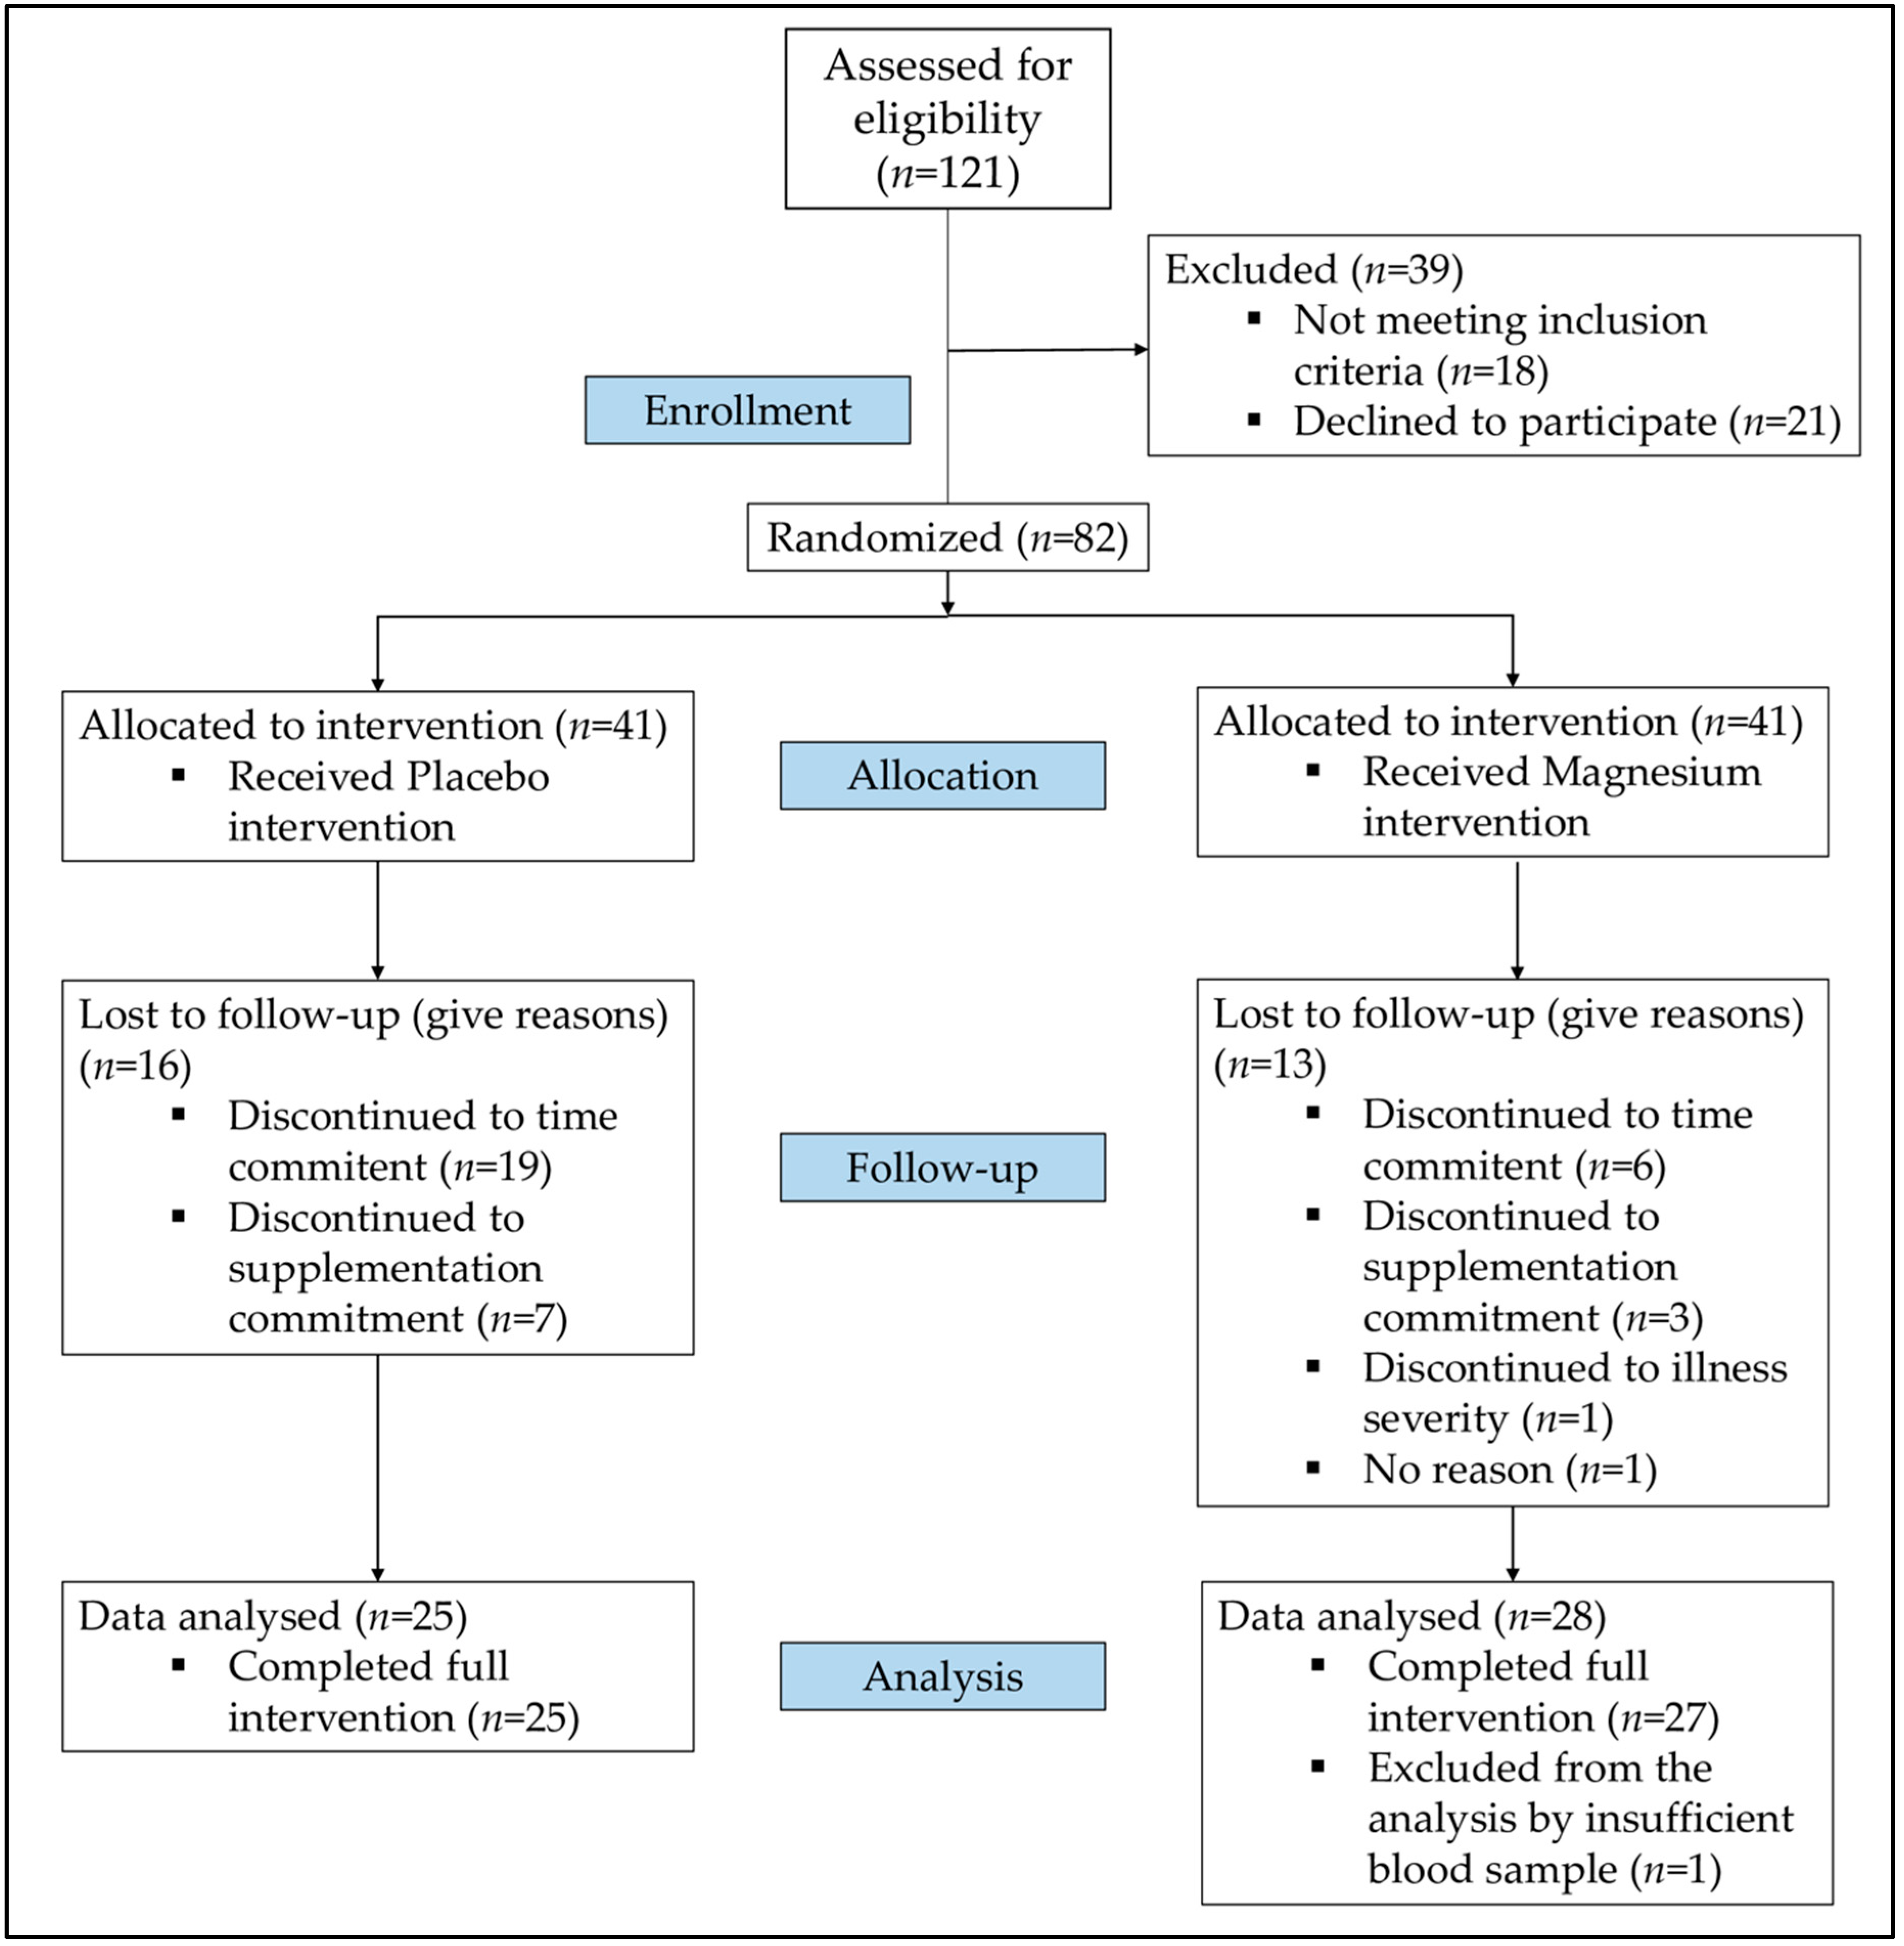
2.3. Randomization and Blinding
2.4. Sample Size
2.5. Compliance Evaluation
2.6. Data Collection
2.7. Body Composition Analysis
2.8. Intake Rating
2.9. Sample Treatment
Measurement of Biochemical Parameters
2.10. Statistical Analysis
3. Results
4. Discussion
5. Conclusions
Author Contributions
Funding
Acknowledgments
Conflicts of Interest
References
- López-González, B.; Florea, D.; García-Ávila, M.; Millan, E.; Saez, L.; Molina, J.; Planells, E.M. Calcic and hormonal levels in postmenopausal women of the province of Granada. Ars Pharm. 2010, 51, 685–696. [Google Scholar]
- LeBlanc, E.S.; Desai, M.; Perrin, N.; Watctawski-Wende, J.; Manson, J.E.; Cauley, J.A.; Michael, Y.L.; Tang, J.; Womacl, C.; Song, Y.; et al. Vitamin D levels and menopause-related symptoms. Menopause 2014, 21, 1197–1203. [Google Scholar] [CrossRef] [PubMed]
- Karlamangla, A.S.; Burnett-Bowie, S.-A.M.; Crandall, C.J. Bone health during the menopause transition and beyond. Obstet. Gynecol. Clin. N. Am. 2018, 45, 695–708. [Google Scholar] [CrossRef] [PubMed]
- Pavón de Paz, I.; Alameda Hernando, C.; Olivar Roldán, J. Obesity and menopause. Nutr. Hosp. 2006, 21, 633–637. [Google Scholar] [PubMed]
- Robinson, D.; Cardozo, L. The menopause and HRT. Urogenital effects of hormone therapy. Best Pr. Res. Clin. Endocrinol. Metab. 2003, 17, 91–104. [Google Scholar] [CrossRef]
- Barbagallo, M.; Belvedere, M.; Dominguez, L.J. Magnesium homeostasis and aging. Magnes. Res. 2009, 22, 235–246. [Google Scholar] [CrossRef]
- Loupy, A.; Ramakrishnan, S.K.; Wootla, B.; Chambrey, R.; de la Faille, R.; Bourgeois, S.; Bruneval, P.; Mandet, C.; Christensen, E.I.; Faure, H.; et al. PTH-independent regulation of blood calcium concentration by the calcium-sensing receptor. J. Clin. Investig. 2012, 122, 3355–3367. [Google Scholar] [CrossRef]
- Zofková, I.; Kancheva, R.L. The relationship between magnesium and calciotropic hormones. Magnes. Res. 1995, 8, 77–84. [Google Scholar]
- Agus, Z.S. Mechanisms and causes of hypomagnesemia. Curr. Opin. Nephrol. Hypertens. 2016, 25, 301–307. [Google Scholar] [CrossRef]
- Ayuk, J.; Gittoes, N.J. Contemporary view of the clinical relevance of magnesium homeostasis. Ann. Clin. Biochem. 2014, 51, 179–188. [Google Scholar] [CrossRef]
- Parazzini, F.; Martino, M.D.; Pellegrino, P. Magnesium in the gynecological practice: A literature review. Magnes. Res. 2017, 30, 1–7. [Google Scholar] [CrossRef] [PubMed]
- Atef, S.H. Vitamin D assays in clinical laboratory: Past, present and future challenges. J. Steroid. Biochem. Mol. Biol. 2018, 175, 136–137. [Google Scholar] [CrossRef] [PubMed]
- Jolfaie, N.R.; Rouhani, M.H.; Onvani, S.; Azadbakht, L. The association between Vitamin D and health outcomes in women: A review on the related evidence. J. Res. Med. Sci. 2016, 21, 76. [Google Scholar] [PubMed]
- Wranicz, J.; Szostak-Węgierek, D. Health outcomes of vitamin D.; Part, I. characteristics and classic role. Rocz. Panstw. Zakl. Hig. 2014, 65, 179–184. [Google Scholar] [PubMed]
- Palacios, C.; Gonzalez, L. Is vitamin D deficiency a major global public health problem? J. Steroid. Biochem. Mol. Biol. 2014, 144, 138–145. [Google Scholar] [CrossRef]
- Van den Ouweland, J.M.W. Analysis of vitamin D metabolites by liquid chromatography-tandem mass spectrometry. Trac Trend. Anal. Chem. 2016, 84, 117–130. [Google Scholar] [CrossRef]
- Hart, G.R.; Furniss, J.L.; Laurie, D.; Durham, S.K. Measurement of vitamin D status: Background, clinical use, and methodologies. Clin. Lab. 2006, 52, 335–343. [Google Scholar]
- Babić, N. Analytical methods and performance of the immunoassay methods for determination of vitamin D in comparison to mass spectrometry. J. Med. Biochem. 2012, 31, 333–338. [Google Scholar]
- Begum Azmathullah, A.; Kirubharan, S.; Jeyasubramanian, L.; Anbarasan, P.; Kandasamy, V.; Natesan, S. Study of vitamin D levels in postmenopausal women. J. Evol. Med. Dent. 2016, 5, 4740–4744. [Google Scholar]
- Kasalová, E.; Aufartová, J.; Krčmová, L.K.; Solichová, D.; Solich, P. Recent trends in the analysis of vitamin D and its metabolites in milk–A review. Food Chem. 2015, 171, 177–190. [Google Scholar] [CrossRef]
- Karaźniewicz-Łada, M.; Główka, A. A review of chromatographic methods for the determination of water- and fat-soluble vitamins in biological fluids. J. Sep. Sci. 2016, 39, 132–148. [Google Scholar] [CrossRef] [PubMed]
- Romagnoli, E.; Carnevale, V.; Biondi, P.; Minisola, S. Vitamin D supplementation: When and how? J. Endocrinol. Investig. 2014, 37, 603–607. [Google Scholar] [CrossRef] [PubMed]
- Romagnoli, E.; Pepe, J.; Piemonte, S.; Cipriani, C.; Minisola, S. Management of endocrine disease: Value and limitations of assessing vitamin D nutritional status and advised levels of vitamin D supplementation. Eur. J. Endocrinol. 2013, 169, R59–R69. [Google Scholar] [CrossRef] [PubMed]
- Siggelkow, H. Vitamin-D-Analytic. Diabetol 2016, 12, 248–253. [Google Scholar] [CrossRef]
- Delchiaro, A.; Oliveira, F.d.J.; Bonacordi, C.L.; Chedid, B.L.; Annicchino, G.; Fernandes, C.E.; Strufaldi, R.; Pompei, L.M.; Steiner, M.L. Evaluation of quality of life, physical activity and nutritional profile of postmenopausal women with and without vitamin D deficiency. Rev. Bras. Ginecol. Obstet. 2017, 39, 337–343. [Google Scholar] [CrossRef]
- Bahareh, N.; Samiee, M.S.; Farzami, R.M.; Alavimajd, H.; Zahedirad, M.; Kalayi, A.; Shariatzadeh, N.; Boroumand, N.; Golshekan, E.; Gholamian, Y.; et al. Harmonization of serum 25-hydroxycalciferol assay results from high-performance liquid chromatography, enzyme immunoassay, radioimmunoassay, and immunochemiluminescence systems: A multicenter study. J. Clin. Lab. Anal. 2017, 31, e22117. [Google Scholar]
- Cheng, T.-Y.D.; Millen, A.E.; Wactawski-Wende, J.; Beresford, S.A.A.; LaCroix, A.Z.; Zheng, Y.; Goodman, G.E.; Thornquist, M.D.; Neuhouser, M.L. Vitamin D intake determines vitamin D status of postmenopausal women, particularly those with limited sun exposure. J. Nutr. 2014, 144, 681–689. [Google Scholar] [CrossRef][Green Version]
- Damaso, E.L.; Albuquerque de Paula, F.J.; Franceschini, S.A.; Vieira, C.S.; Ferriani, R.A.; Silva de Sa, M.F.; Lara, L.A.d.S. Does the access to sun exposure ensure adequate levels of 25-Hydroxyvitamin D? Rev. Bras. Ginecol. Obstet. 2017, 39, 102–109. [Google Scholar] [CrossRef]
- Watanabe, R.; Okazaki, R. Secondary osteoporosis or secondary contributors to bone loss in fracture. Vitamin D deficiency and fracture. Clin. Calcium 2013, 23, 1313–1319. [Google Scholar]
- López-González, B.; Molina-López, J.; Florea, D.I.; Quintero-Osso, B. Association between magnesium-deficient status and anthropometric and clinical-nutritional parameters in posmenopausal women. Nutr. Hosp. 2014, 29, 658–664. [Google Scholar]
- Holick, M.F. Vitamin D Deficiency. N. Engl. J. Med. 2007, 357, 266–281. [Google Scholar] [CrossRef] [PubMed]
- Federation of Spanish Societies of Nutrition and Dietetics (FESNAD). Dietary Reference Intakes (DRI) for the Spanish Population—2010. Act. Diet. 2010, 14, 196–197. [Google Scholar]
- Vázquez-Lorente, H.; Molina-López, J.; Herrera-Quintana, L.; Gamarra-Morales, Y.; López-González, B.; Planells, E. Association between Body Fatness and Vitamin D3 Status in a Postmenopausal Population. Nutrients 2020, 12, 667. [Google Scholar] [CrossRef] [PubMed]
- Rosanoff, A.; Weaver, C.M.; Rude, R.K. Suboptimal magnesium status in the United States: Are the health consequences underestimated? Nutr. Rev. 2012, 70, 153–164. [Google Scholar] [CrossRef] [PubMed]
- Ortega, R.M.; González, L.G.; Navia, B.; Sanchez, J.M.P.; Vizuete, A.A.; Sobaler, A.M.L. Calcium and vitamin D intakes in a representative sample of Spanish women; particular problem in menopause. Nutr. Hosp. 2013, 28, 306–313. [Google Scholar]
- Wright, H.H.; Kruger, M.C.; Schutte, W.D.; Wentzel-Viljoen, E.; Kruger, I.M.; Kruger, H.S. Magnesium intake predicts bone turnover in postmenopausal black south African women. Nutrients 2019, 11, 2519. [Google Scholar] [CrossRef]
- Rizzoli, R.; Bischoff-Ferrari, H.; Dawson-Hughes, B.; Weaver, C. Nutrition and bone health in women after menopause. Womens Health (Lond. Engl.) 2014, 10, 599–608. [Google Scholar] [CrossRef]
- Deng, X.; Song, Y.; Manson, J.E.; Signorello, L.B.; Zhang, S.M.; Shrubsole, M.J.; Ness, R.M.; Seidner, D.L.; Dai, Q. Magnesium, vitamin D status and mortality: Results from US National Health and Nutrition Examination Survey (NHANES) 2001 to 2006 and NHANES III. BMC Med. 2013, 11, 187. [Google Scholar] [CrossRef]
- Olza, J.; Aranceta-Bartrina, J.; González-Gross, M.; Ortega, R.M.; Serra-Majem, L.; Varela-Moreiras, G.; Gil, A. Reported dietary intake, disparity between the reported consumption and the level needed for adequacy and food sources of calcium, phosphorus, magnesium and vitamin D in the spanish population: Findings from the ANIBES study. Nutrients 2017, 9, 168. [Google Scholar] [CrossRef]
- Al-Musharaf, S.; Al-Othman, A.; Al-Daghri, N.M.; Krishnaswamy, S.; Yusuf, D.; Alkharfy, K.M.; Al-Saleh, Y.; Al-Attas, O.S.; Alokail, M.S.; Moharram, O.; et al. Vitamin D deficiency and calcium intake in reference to increased body mass index in children and adolescents. Eur. J. Pediatr. 2012, 171, 1081–1086. [Google Scholar] [CrossRef]
- Harris, H.R.; Chavarro, J.E.; Malspeis, S.; Willett, W.C.; Missmer, S.A. Dairy-food, calcium, magnesium, and vitamin D intake and endometriosis: A prospective cohort study. Am. J. Epidemiol. 2013, 177, 420–430. [Google Scholar] [CrossRef] [PubMed]
- Cashman, K.D. Vitamin D deficiency: Defining, prevalence, causes, and strategies of addressing. Calcif. Tissue. Int. 2020, 106, 14–29. [Google Scholar] [CrossRef] [PubMed]
- Park, E.J.; Lee, H.S.; Lee, S.H.; Shim, K.W.; Cho, C.; Yoo, B.-W. The level of vitamin D using the LC–MS/MS method and related factors in healthy Korean postmenopausal women. J. Obstet. Gynaecol. Res. 2018, 44, 1977–1984. [Google Scholar] [CrossRef] [PubMed]
- Schmitt, E.B.; Nahas-Neto, J.; Bueloni-Dias, F.; Poloni, P.F.; Orsatti, C.L.; Petri Nahas, E.A. Vitamin D deficiency is associated with metabolic syndrome in postmenopausal women. Maturitas 2018, 107, 97–102. [Google Scholar] [CrossRef]
- Erem, S.; Atfi, A.; Razzaque, M.S. Anabolic effects of vitamin D and magnesium in aging bone. J. Steroid Biochem. Mol. Biol. 2019, 193, 105400. [Google Scholar] [CrossRef]
- Uwitonze, A.M.; Razzaque, M.S. Role of magnesium in vitamin D activation and function. J. Am. Osteopath. Assoc. 2018, 118, 181–189. [Google Scholar] [CrossRef]
- Dai, Q.; Zhu, X.; Manson, J.E.; Song, Y.; Li, X.; Franke, A.A.; Costello, R.B.; Rosanoff, A.; Nian, H.; Fan, L.; et al. Magnesium status and supplementation influence vitamin D status and metabolism: Results from a randomized trial. Am. J. Clin. Nutr. 2018, 108, 1249–1258. [Google Scholar] [CrossRef]
- Melamed, M.L.; Michos, E.D.; Post, W.; Astor, B. 25-hydroxyvitamin D levels and the risk of mortality in the general population. Arch. Intern. Med. 2008, 168, 1629–1637. [Google Scholar] [CrossRef]
- Reddy, P.; Edwards, L.R. Magnesium supplementation in vitamin D deficiency. Am. J. Ther. 2019, 26, 124–132. [Google Scholar] [CrossRef]
- Granado-Lorencio, F.; Blanco-Navarro, I.; Pérez-Sacristán, B. Criteria of adequacy for vitamin D testing and prevalence of deficiency in clinical practice. Clin. Chem. Lab. Med. 2016, 54, 791–798. [Google Scholar] [CrossRef]
- Klapkova, E.; Cepova, J.; Pechova, M.; Dunovska, K.; Kotaska, K.; Prusa, R. A comparison of four Methods (Immunochemistry and HPLC) for determination of 25-(OH)-vitamin D in postmenopausal women. Clin. Lab. 2017, 63, 385–388. [Google Scholar] [CrossRef] [PubMed]
- Garg, U. 25-Hydroxyvitamin D testing: Immunoassays versus tandem mass spectrometry. Clin. Lab. Med. 2018, 38, 439–453. [Google Scholar] [CrossRef] [PubMed]
- Vázquez-Lorente, H.; Herrera-Quintana, L.; Quintero-Osso, B.; Molina-López, J.; Planells, E. Current trends in the analytical determination of vitamin D. Nutr. Hosp. 2019, 36, 1418–1423. [Google Scholar] [PubMed]
- Catalano, A.; Morabito, N.; Basile, G.; Cucinotta, D.; Lasco, A. Calcifediol improves lipid profile in osteopenicatorvastatin-treated postmenopausal women. Eur. J. Clin. Investig. 2015, 45, 144–149. [Google Scholar] [CrossRef]
- Pop, L.C.; Sukumar, D.; Schneider, S.H.; Sclussel, Y.; Stahl, T.; Gordon, C.; Wang, X.; Papathomas, T.V.; Shapses, S.A. Three doses of vitamin D, bone mineral density, and geometry in older women during modest weight control in a 1-year randomized controlled trial. Osteoporos. Int. 2017, 28, 377–388. [Google Scholar] [CrossRef]
- Watcharanon, W.; Kaewrudeem, S.; Soontrapa, S.; Somboonporn, W.; Srisaenpang, P.; Panpanit, L.; Pongchaiyakul, C. Effects of sunlight exposure and vitamin D supplementation on vitamin D levels in postmenopausal women in rural Thailand: A randomized controlled trial. Complement Ther. Med. 2018, 40, 243–247. [Google Scholar] [CrossRef]


| Features | Reference Values | PG (n = 25) | MG (n = 27) | p Value PG Follow-Up | p Value MG Follow-Up | p Value Inter-Groups | ||
|---|---|---|---|---|---|---|---|---|
| Baseline (Mean ± SD) | Follow-Up (Mean ± SD) | Baseline (Mean ± SD) | Follow-Up (Mean ± SD) | |||||
| Age (Years) | - | 59.7 ± 9.15 | 59.7 ± 9.15 | 57.7 ± 7.58 | 57.7 ± 7.58 | - | - | - |
| Weight (Kg) | - | 69.1 ± 11.0 | 67.8 ± 11.2 | 69.3 ± 14.2 | 69.7 ± 13.6 | 0.23 | 0.43 | 0.62 |
| Height (cm) | - | 157.2 ± 6.01 | 157.2 ± 6.01 | 160.2 ± 6.11 | 160.2 ± 6.11 | - | - | - |
| BMI (Kg/m2) | 22.0–27.0 | 28.0 ± 4.30 | 27.7 ± 4.41 | 26.9 ± 4.88 | 27.7 ± 4.41 | 0.21 | 0.49 | 0.65 |
| Blood pressure n (%) | ||||||||
| Normal blood pressure | - | 10 (40) | - | 14 (51) | - | - | - | - |
| High blood pressure | - | 15 (60) | - | 13 (49) | - | - | - | - |
| Physical exercise n (%) | ||||||||
| Sedentary | - | 9 (36) | - | 6 (23) | - | - | - | - |
| Non-sedentary | - | 16 (64) | - | 21 (77) | - | - | - | - |
| Smoking habit n (%) | ||||||||
| Non-smoker | - | 18 (75) | - | 23 (82) | - | - | - | - |
| Smoker | - | 6 (25) | - | 5 (18) | - | - | - | - |
| Educational level n (%) | ||||||||
| Basic educational level | - | 10 (40) | - | 11 (40) | - | - | - | - |
| Secondary or high educational level | - | 15 (60) | - | 16 (60) | - | - | - | - |
| Energy intake (Kcal) | 2000.0 | 1339.5 ± 283.1 | 1232.9 ± 285.5 | 1307.1 ± 323.3 | 1323.4 ± 264.5 | 0.17 | 0.66 | 0.27 |
| CHO intake (g/day) | 275.0 | 146.6 ± 40.3 | 146.5 ± 33.4 | 149.5 ± 48.2 | 150.5 ± 48.5 | 0.84 | 0.89 | 0.75 |
| Protein intake (g/day) | 50.0 | 59.7 ± 14.2 | 57.1 ± 10.4 | 61.1 ± 17.6 | 63.4 ± 15.6 | 0.47 | 0.42 | 0.12 |
| Fat intake (g/day) | 70.0 | 56.1 ± 17.2 | 47.9 ± 18.5 | 53.2 ± 14.7 | 51.8 ± 12.7 | 0.15 | 0.66 | 0.41 |
| Cholesterol intake (mg/day) | <300.0 | 150.6 ± 61.6 | 151.7 ± 64.4 | 154.1 ± 64.6 | 158.3 ± 76.8 | 0.87 | 0.81 | 0.75 |
| Fiber intake (g/day) | >25.0 | 17.1 ± 10.6 | 16.2 ± 4.07 | 15.7 ± 7.72 | 16.5 ± 7.50 | 0.42 | 0.53 | 0.88 |
| P intake (mg/day) | 800.0 | 996.1 ± 257.7 | 993.9 ± 219.1 | 1002.6 ± 318.9 | 1038.8 ± 282.5 | 0.86 | 0.57 | 0.55 |
| Ca intake (mg/day) | 800.0–1000.0 | 728.2 ± 223.1 | 679.9 ± 168.6 | 873.5 ± 250.2 | 832.5 ± 210.6 | 0.69 | 0.56 | 0.01 |
| Mg intake (mg/day) | 320.0 | 237.4 ± 87.0 | 232.7 ± 55.8 | 219.3 ± 71.1 | 726.4 ± 59.9 | 0.99 | 0.001 | 0.001 |
| Vitamin D intake (µg/day) | 10.0 | 3.36 ± 3.00 | 4.34 ± 2.91 | 3.89 ± 3.62 | 3.62 ± 2.57 | 0.35 | 0.72 | 0.57 |
| Features | Reference Values | PG (n = 25) | MG (n = 27) | p Value PG Follow-Up | p Value MG Follow-Up | p Value Inter-Groups | ||
|---|---|---|---|---|---|---|---|---|
| Baseline (Mean ± SD) | Follow-Up ((Mean ± SD) | Baseline ((Mean ± SD) | Follow-Up ((Mean ± SD) | |||||
| Glucose (mg/dL) | 70.0–110.0 | 96.0 ± 19.8 | 95.8 ± 19.9 | 90.1 ± 11.1 | 95.8 ± 18.9 | 0.63 | 0.25 | 0.047 |
| Transferrin (mg/dL) | 200.0–360.0 | 285.9 ± 39.7 | 272.8 ± 43.4 | 284.2 ± 47.7 | 272.8 ± 43.4 | 0.89 | 0.18 | 0.71 |
| Prealbumin (mg/dL) | 20.0–40.0 | 26.6 ± 5.03 | 24.7 ± 5.01 | 24.8 ± 6.45 | 24.7 ± 5.01 | 0.001 | 0.06 | 0.62 |
| Albumin (mg/dL) | 3.50–5.20 | 4.50 ± 0.20 | 4.45 ± 0.27 | 4.50 ± 0.21 | 4.45 ± 0.27 | 0.62 | 0.055 | 0.57 |
| Homocysteine (µmol/L) | <13.0 | 12.5 ± 6.45 | 12.7 ± 4.78 | 11.5 ± 4.25 | 12.7 ± 4.78 | 0.27 | 0.66 | 0.46 |
| Creatinine (mg/dl) | 0.50–0.90 | 0.75 ± 0.16 | 0.75 ± 0.16 | 0.68 ± 0.11 | 0.75 ± 0.16 | 0.31 | 0.81 | 0.08 |
| Total bilirubin (mg/dL) | 0.10–1.20 | 0.49 ± 0.13 | 0.55 ± 0.21 | 0.47 ± 0.11 | 0.55 ± 0.21 | 0.13 | 0.95 | 0.26 |
| LDH (U/L) | 110.0–295.0 | 182.8 ± 29.3 | 181.1 ± 26.1 | 192.5 ± 26.7 | 181.1 ± 26.1 | 0.96 | 0.41 | 0.81 |
| Urea (mg/dL) | 10.0–50.0 | 36.2 ± 10.2 | 36.7 ± 9.35 | 34.3 ± 8.98 | 36.7 ± 9.35 | 0.87 | 0.65 | 0.44 |
| Uric acid (mg/dL) | 2.40–5.70 | 4.51 ± 0.98 | 4.70 ± 1.02 | 4.43 ± 1.23 | 4.70 ± 1.02 | 0.21 | 0.26 | 0.21 |
| Triglycerides (mg/dL) | 50.0–200.0 | 115.8 ± 68.9 | 112.3 ± 62.2 | 111.1 ± 50.6 | 112.3 ± 62.2 | 0.79 | 0.41 | 0.80 |
| HDL (mg/dL) | 40.0–60.0 | 62.6 ± 11.2 | 64.1 ± 12.3 | 66.6 ± 14.4 | 64.1 ± 12.3 | 0.04 | 0.06 | 0.95 |
| LDL (mg/dL) | 70.0–190.0 | 134.5 ± 35.3 | 137.6 ± 30.5 | 130.4 ± 26.4 | 137.6 ± 30.5 | 0.76 | 0.06 | 0.19 |
| Total cholesterol (mg/dL) | 110.0–200.0 | 224.1 ± 39.7 | 221.4 ± 31.4 | 224.7 ± 30.1 | 221.4 ± 31.4 | 0.86 | 0.09 | 0.64 |
| Osteocalcin (ng/mL) | 15.0–46.0 | 17.4 ± 9.45 | 18.1 ± 7.21 | 16.8 ± 10.4 | 18.1 ± 7.21 | 0.69 | 0.22 | 0.91 |
| PTH (pg/mL) | 20.0–70.0 | 50.7 ± 15.8 | 53.3 ± 34.4 | 52.9 ± 17.2 | 53.3 ± 34.4 | 0.46 | 0.07 | 0.29 |
| Ca (mg/dL) | 8.60–10.2 | 9.31 ± 0.31 | 9.14 ± 0.44 | 9.27 ± 0.51 | 9.13 ± 0.49 | 0.31 | 0.07 | 0.98 |
| P (mg/dL) | 2.70–4.50 | 3.45 ± 0.45 | 3.57 ± 0.55 | 3.42 ± 0.53 | 3.60 ± 0.49 | 0.49 | 0.07 | 0.88 |
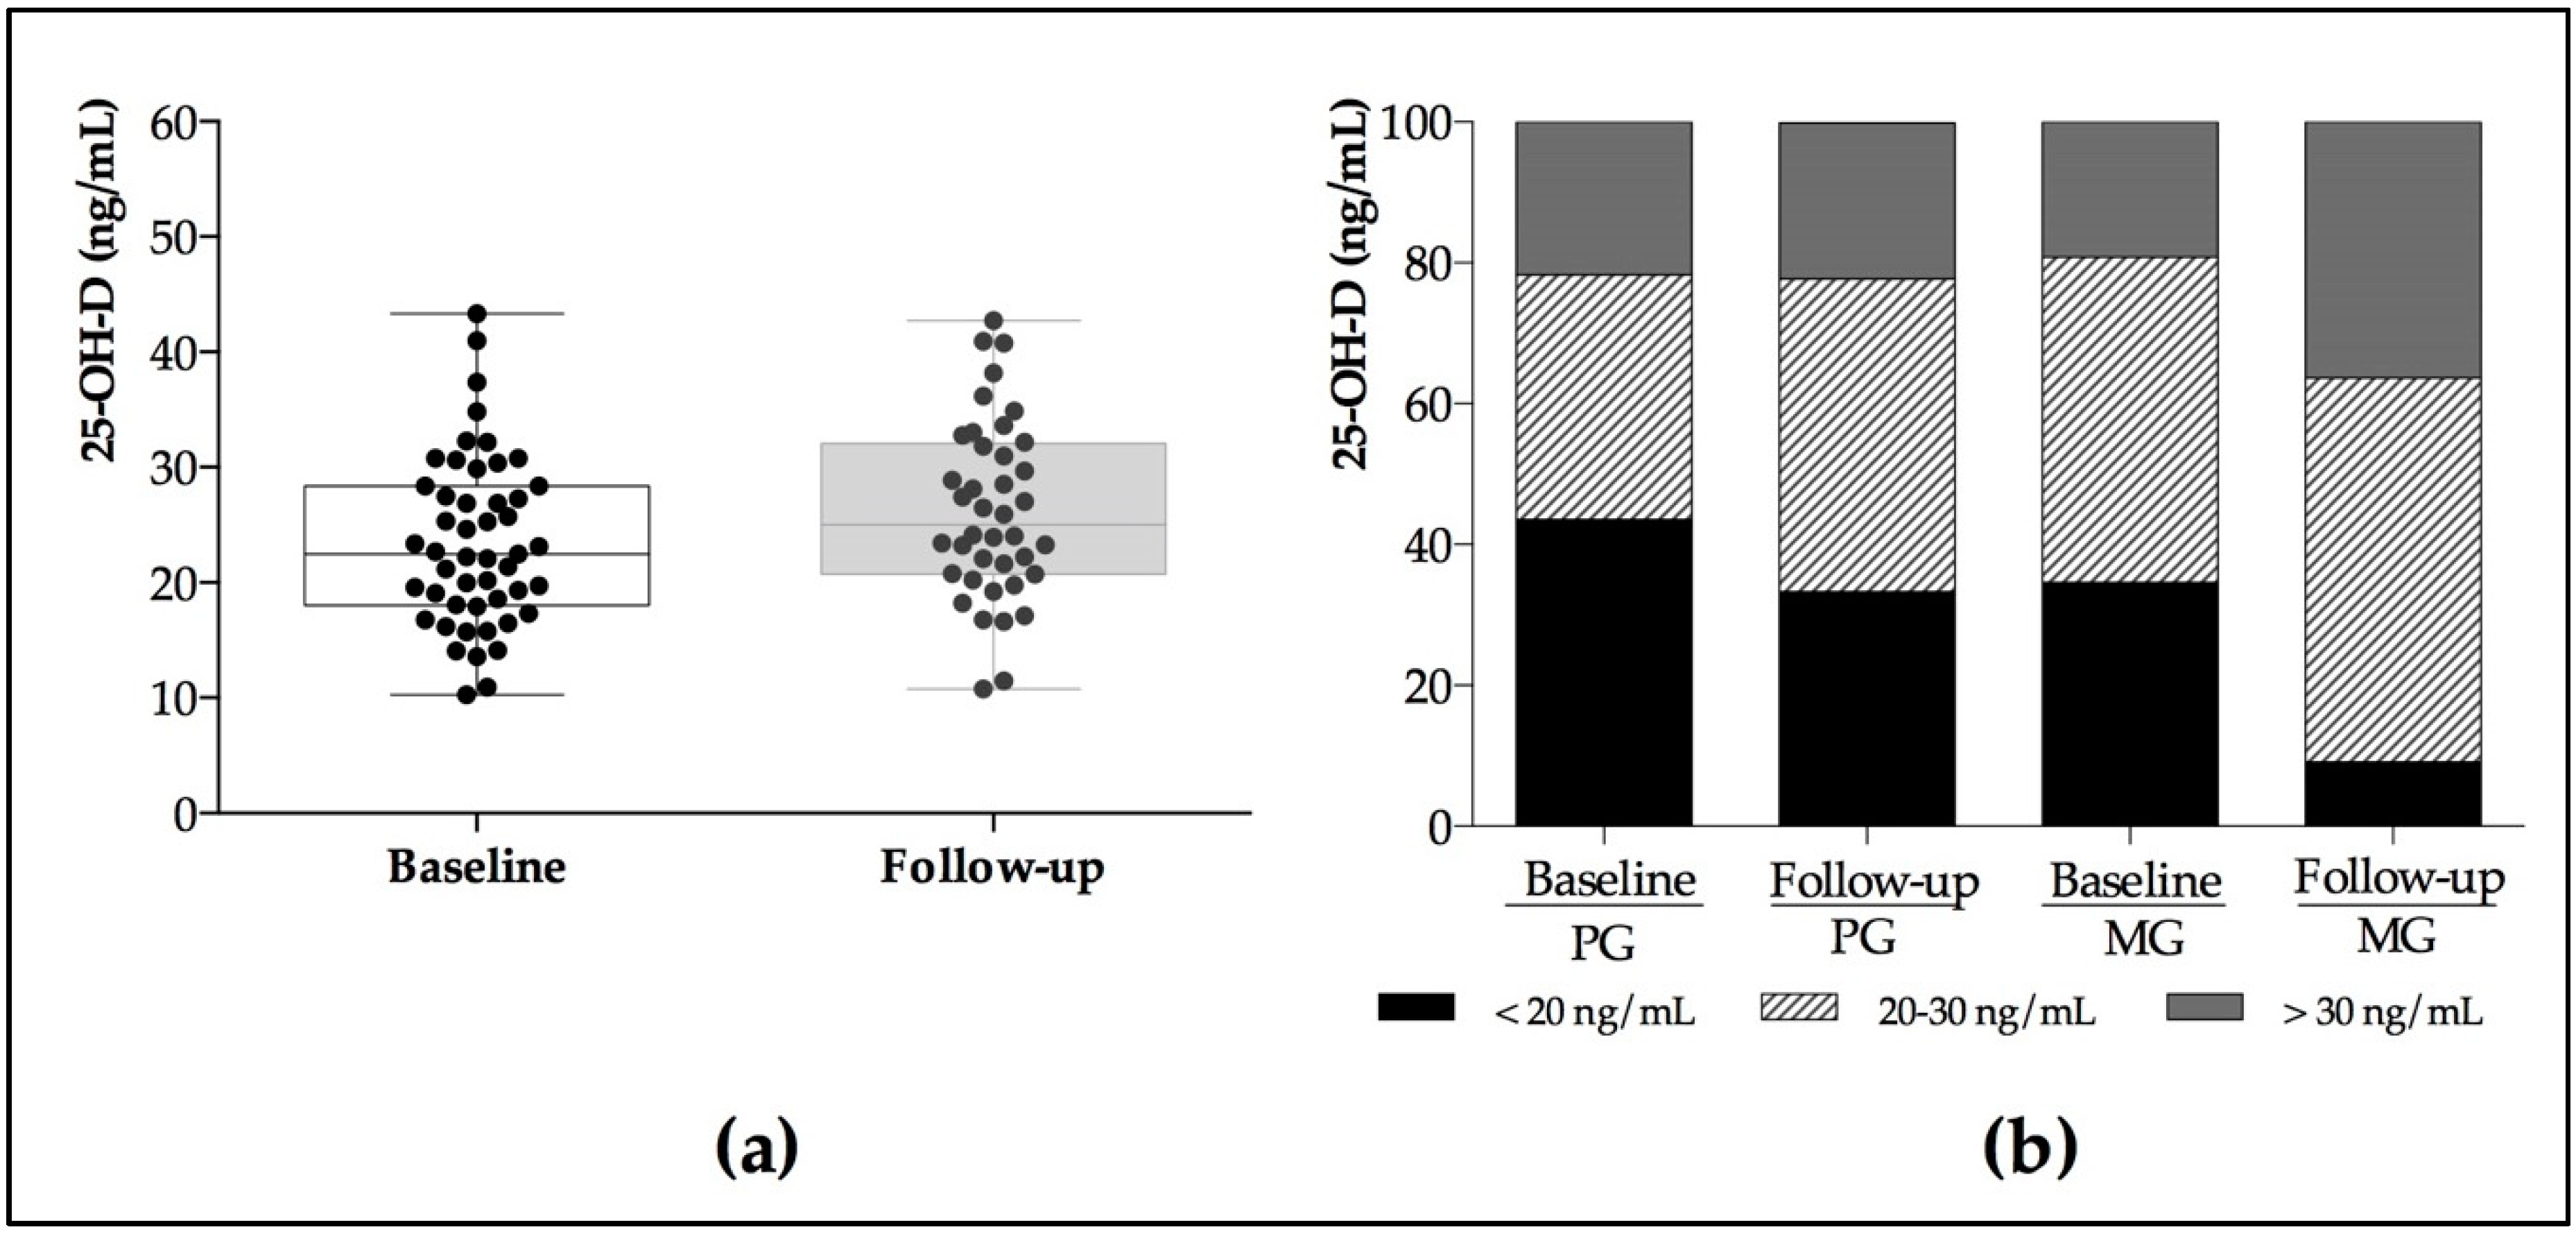
| 25–OH–D LC–MS/MS (ng/mL) | 30.0–100.0 | 23.0 ± 8.99 | 24.2 ± 7.71 | 23.6 ± 5.70 | 27.8 ± 7.56 | 0.81 | 0.049 | 0.14 |
| 25–OH–D3 LC–MS/MS (ng/mL) | >20 | 18.0 ± 8.37 | 19.7 ± 8.00 | 17.7 ± 6.25 | 21.1 ± 7.40 | 0.52 | 0.13 | 0.57 |
| 25–OH–D2 LC–MS/MS (ng/mL) | >10 | 4.99 ± 2.11 | 4.55 ± 2.74 | 5.86 ± 3.05 | 6.80 ± 7.16 | 0.31 | 0.41 | 0.22 |
© 2020 by the authors. Licensee MDPI, Basel, Switzerland. This article is an open access article distributed under the terms and conditions of the Creative Commons Attribution (CC BY) license (http://creativecommons.org/licenses/by/4.0/).
Share and Cite
Vázquez-Lorente, H.; Herrera-Quintana, L.; Molina-López, J.; Gamarra-Morales, Y.; López-González, B.; Miralles-Adell, C.; Planells, E. Response of Vitamin D after Magnesium Intervention in a Postmenopausal Population from the Province of Granada, Spain. Nutrients 2020, 12, 2283. https://doi.org/10.3390/nu12082283
Vázquez-Lorente H, Herrera-Quintana L, Molina-López J, Gamarra-Morales Y, López-González B, Miralles-Adell C, Planells E. Response of Vitamin D after Magnesium Intervention in a Postmenopausal Population from the Province of Granada, Spain. Nutrients. 2020; 12(8):2283. https://doi.org/10.3390/nu12082283
Chicago/Turabian StyleVázquez-Lorente, Héctor, Lourdes Herrera-Quintana, Jorge Molina-López, Yenifer Gamarra-Morales, Beatriz López-González, Claudia Miralles-Adell, and Elena Planells. 2020. "Response of Vitamin D after Magnesium Intervention in a Postmenopausal Population from the Province of Granada, Spain" Nutrients 12, no. 8: 2283. https://doi.org/10.3390/nu12082283
APA StyleVázquez-Lorente, H., Herrera-Quintana, L., Molina-López, J., Gamarra-Morales, Y., López-González, B., Miralles-Adell, C., & Planells, E. (2020). Response of Vitamin D after Magnesium Intervention in a Postmenopausal Population from the Province of Granada, Spain. Nutrients, 12(8), 2283. https://doi.org/10.3390/nu12082283