Postprandial Glycemia, Insulinemia, and Antioxidant Status in Healthy Subjects after Ingestion of Bread made from Anthocyanin-Rich Riceberry Rice


Abstract
:1. Introduction
2. Materials and Methods
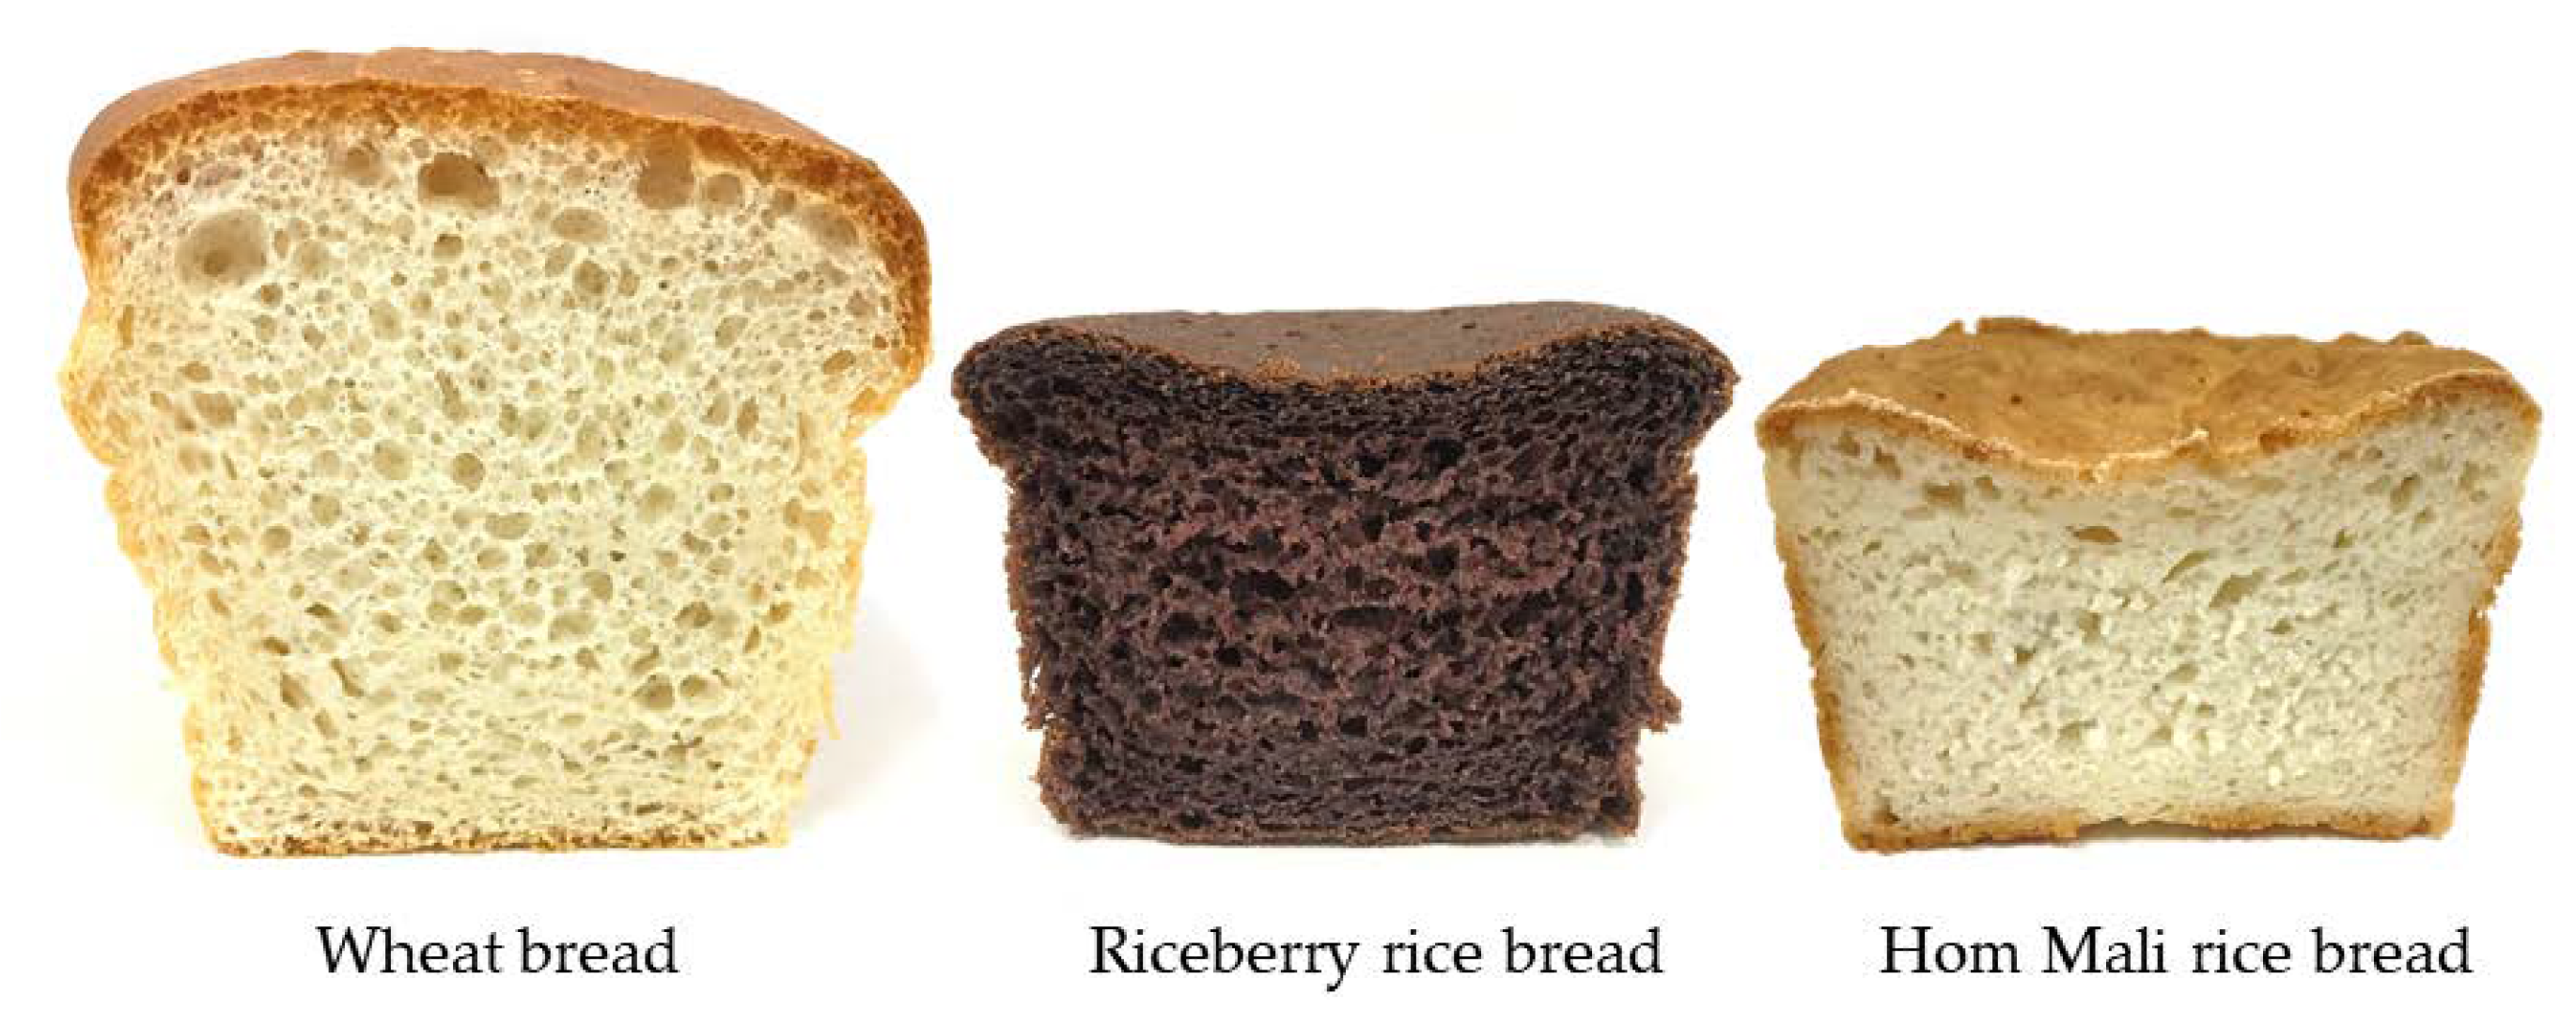
2.1. Sample Preparation
2.2. Participants
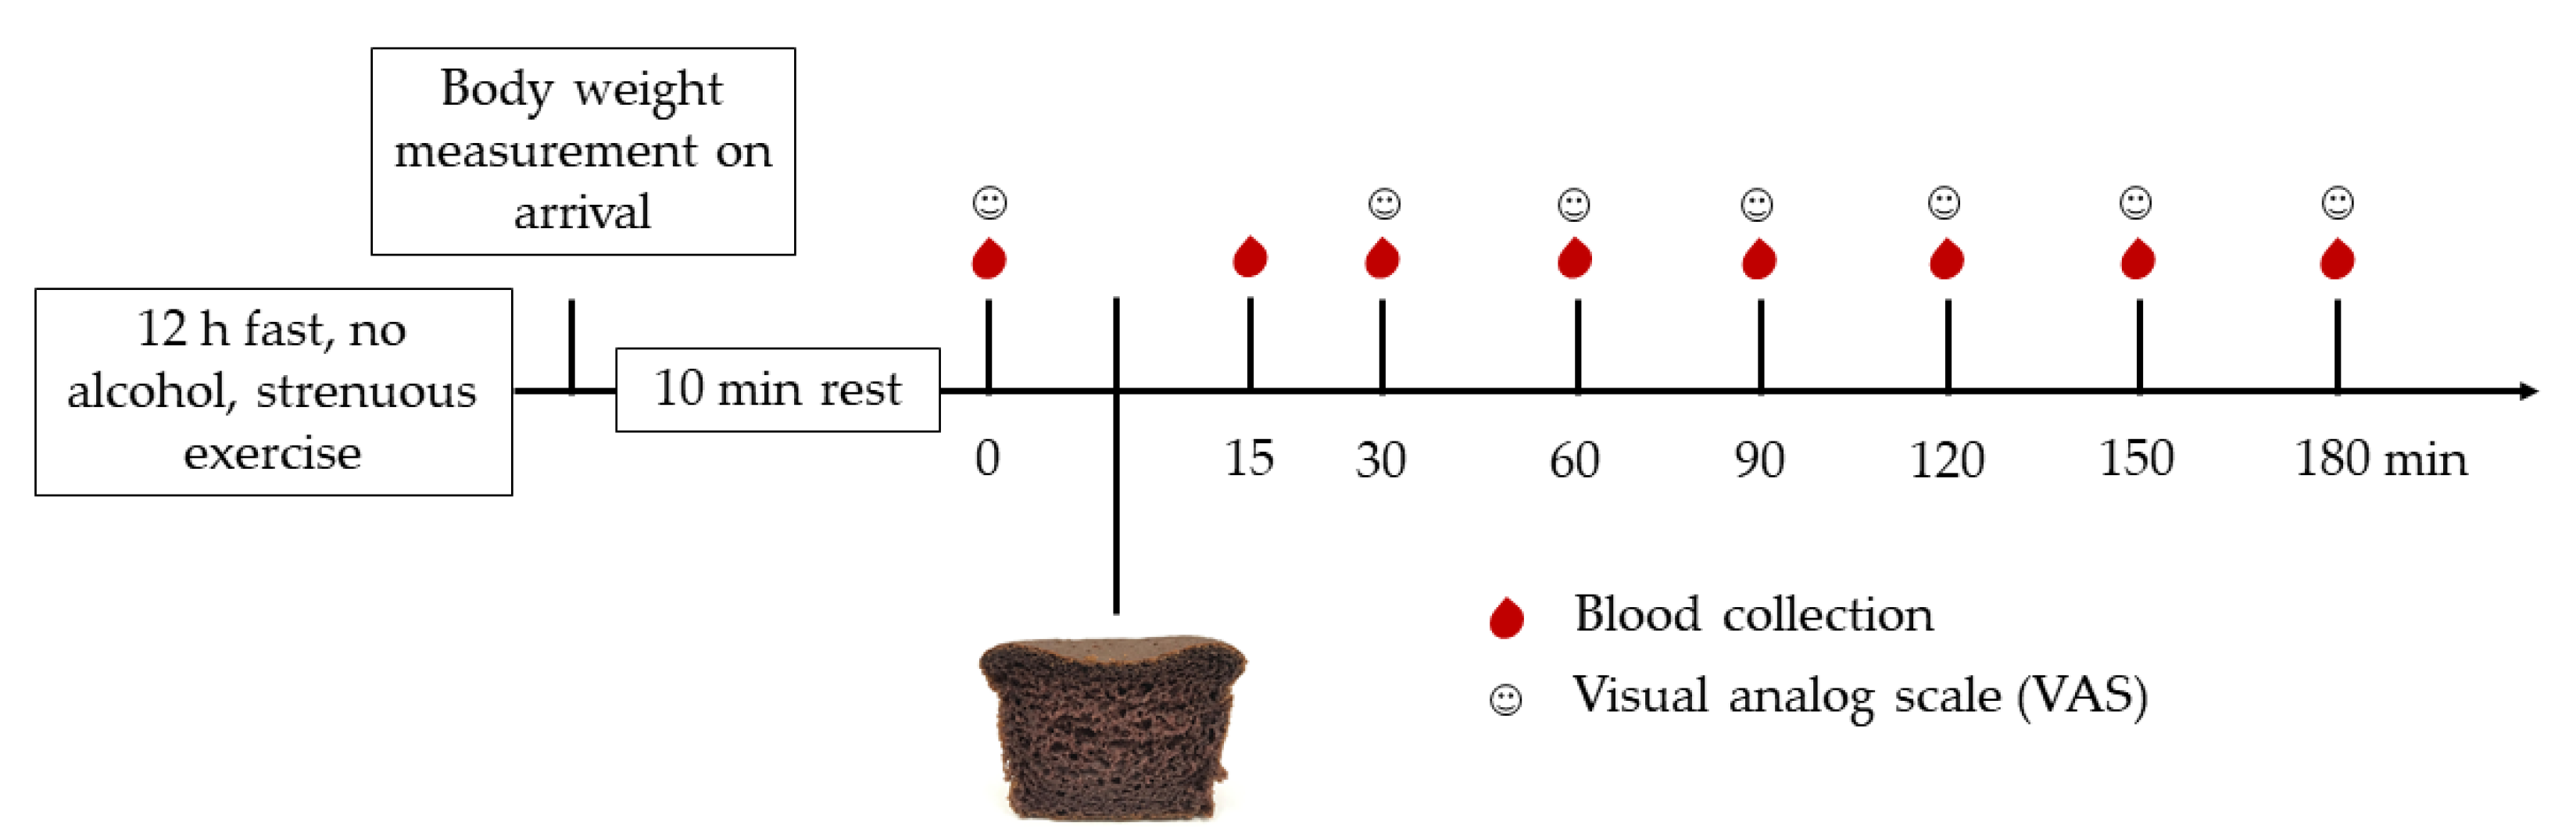
2.3. Study Design
2.4. Biochemical Measures
2.5. Antioxidant and Oxidant Measures
2.6. Statistical Analysis
3. Results
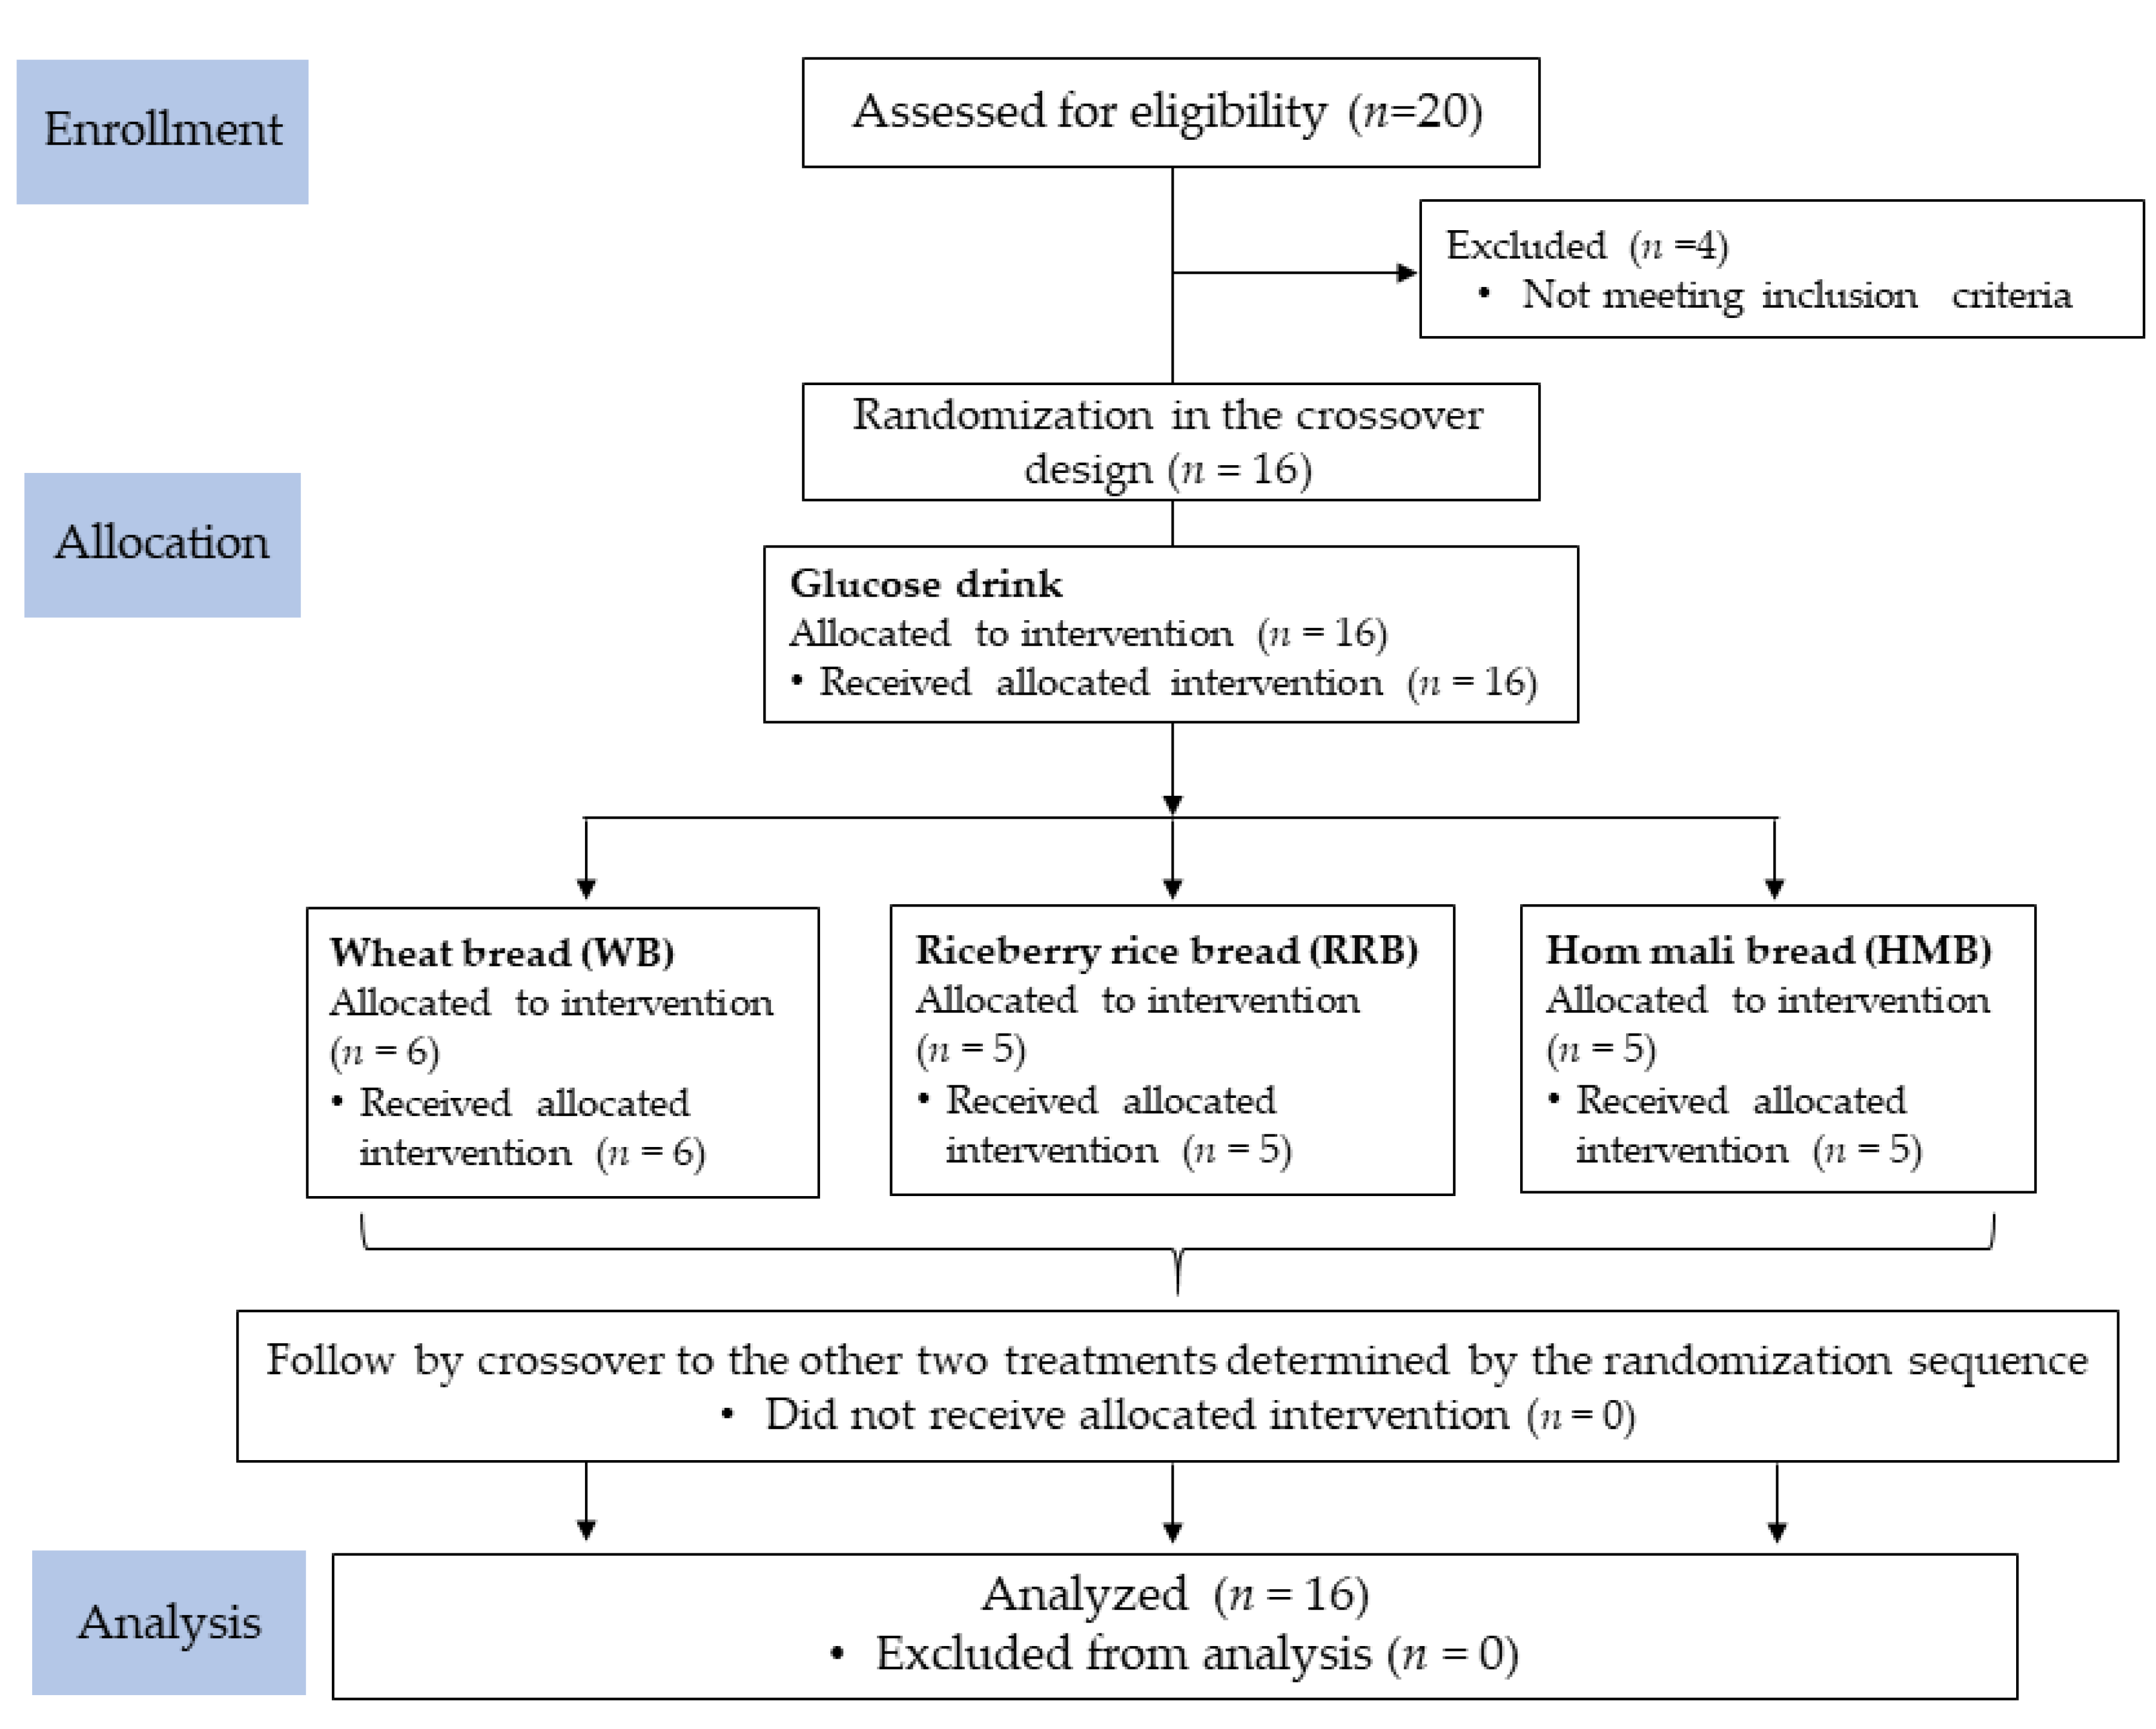
3.1. Participants
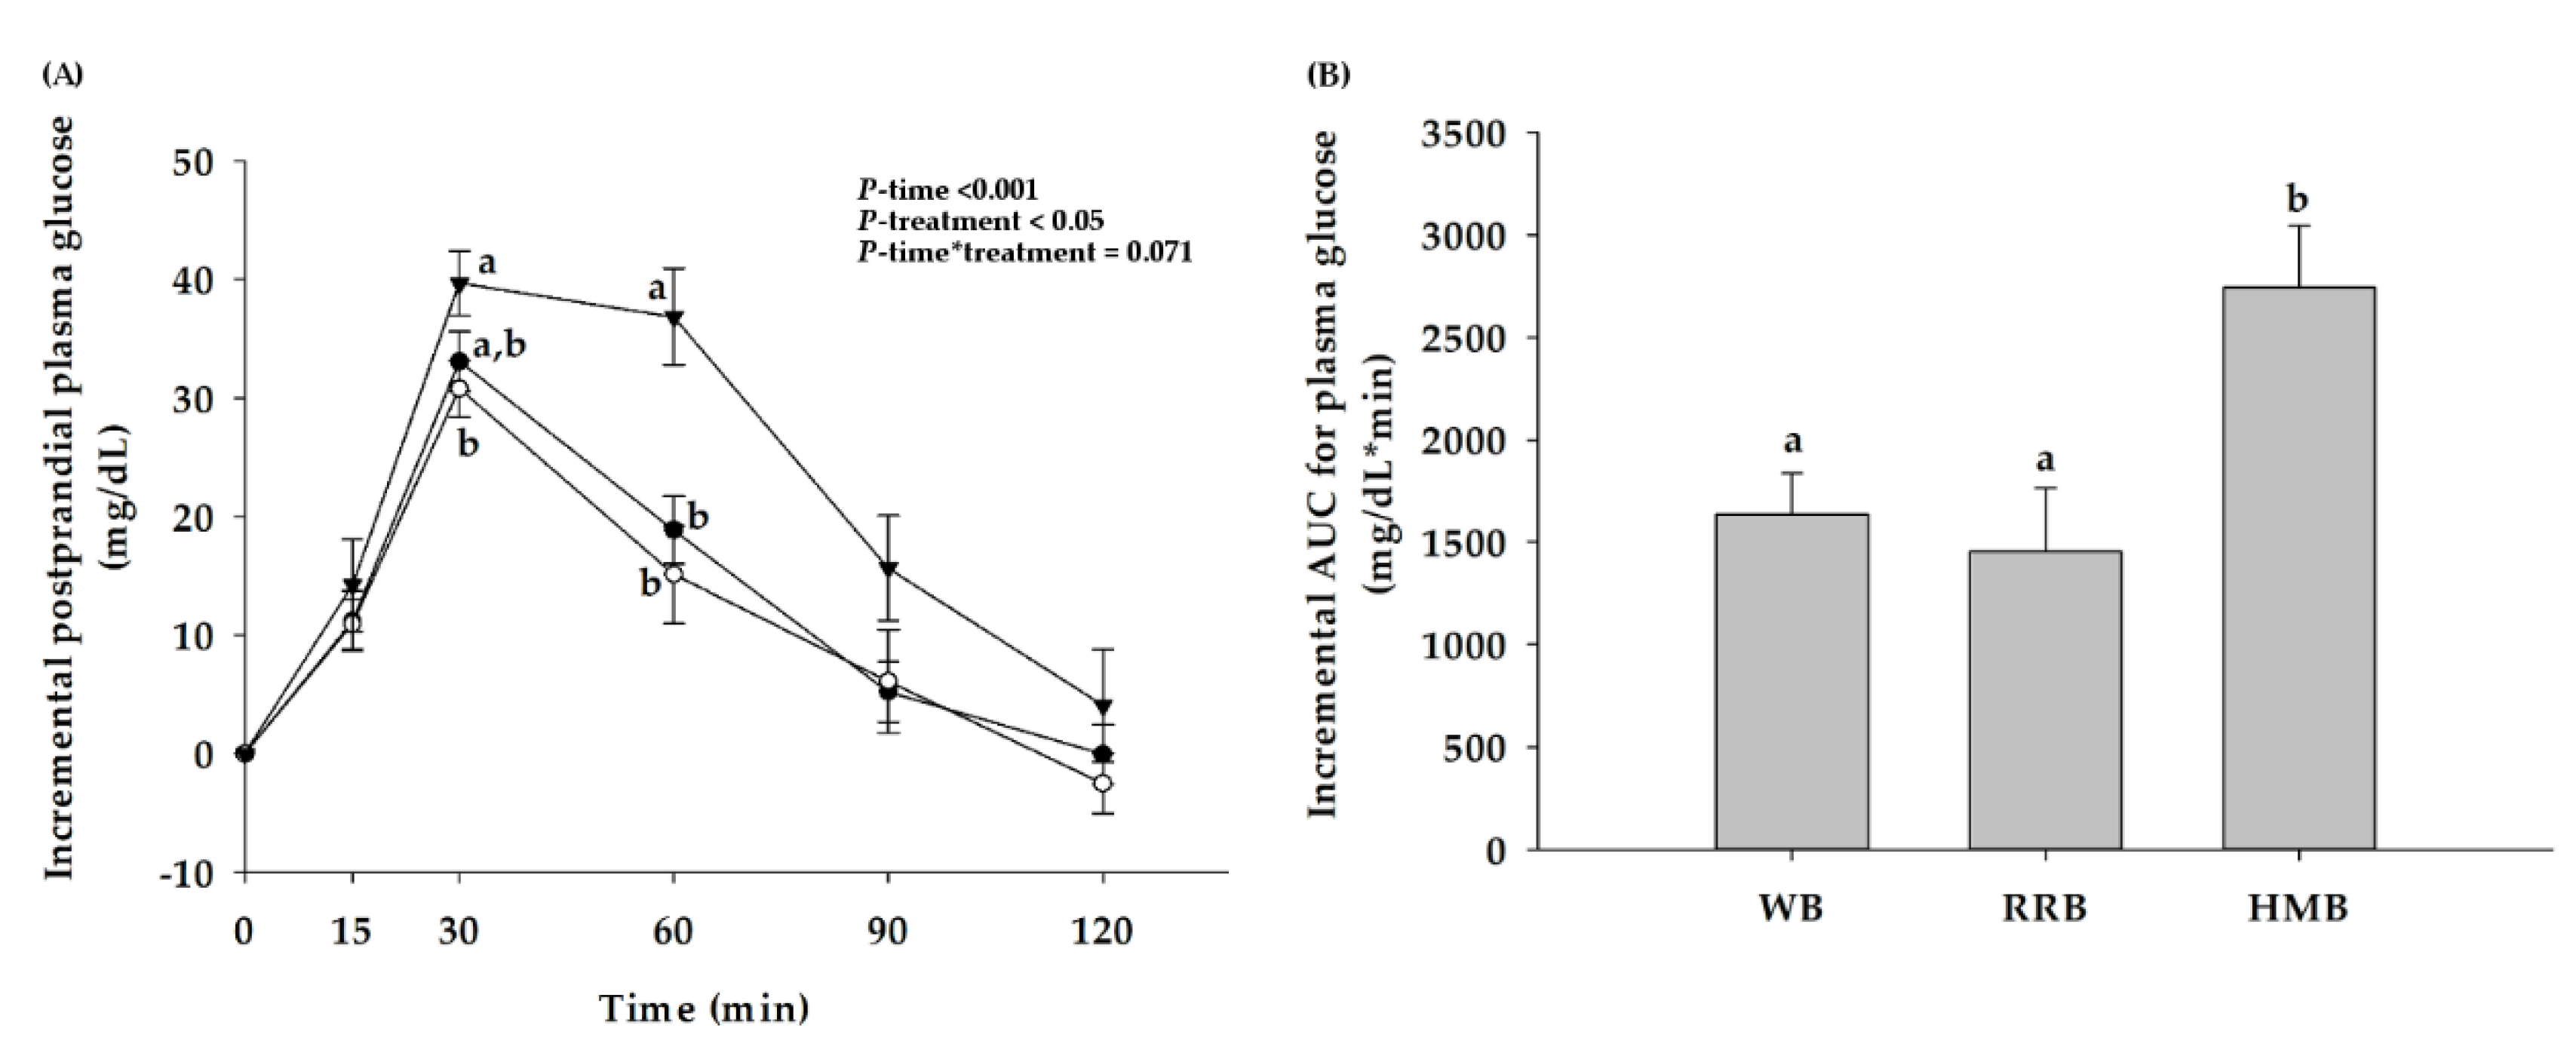
3.2. Postprandial Plasma Glucose
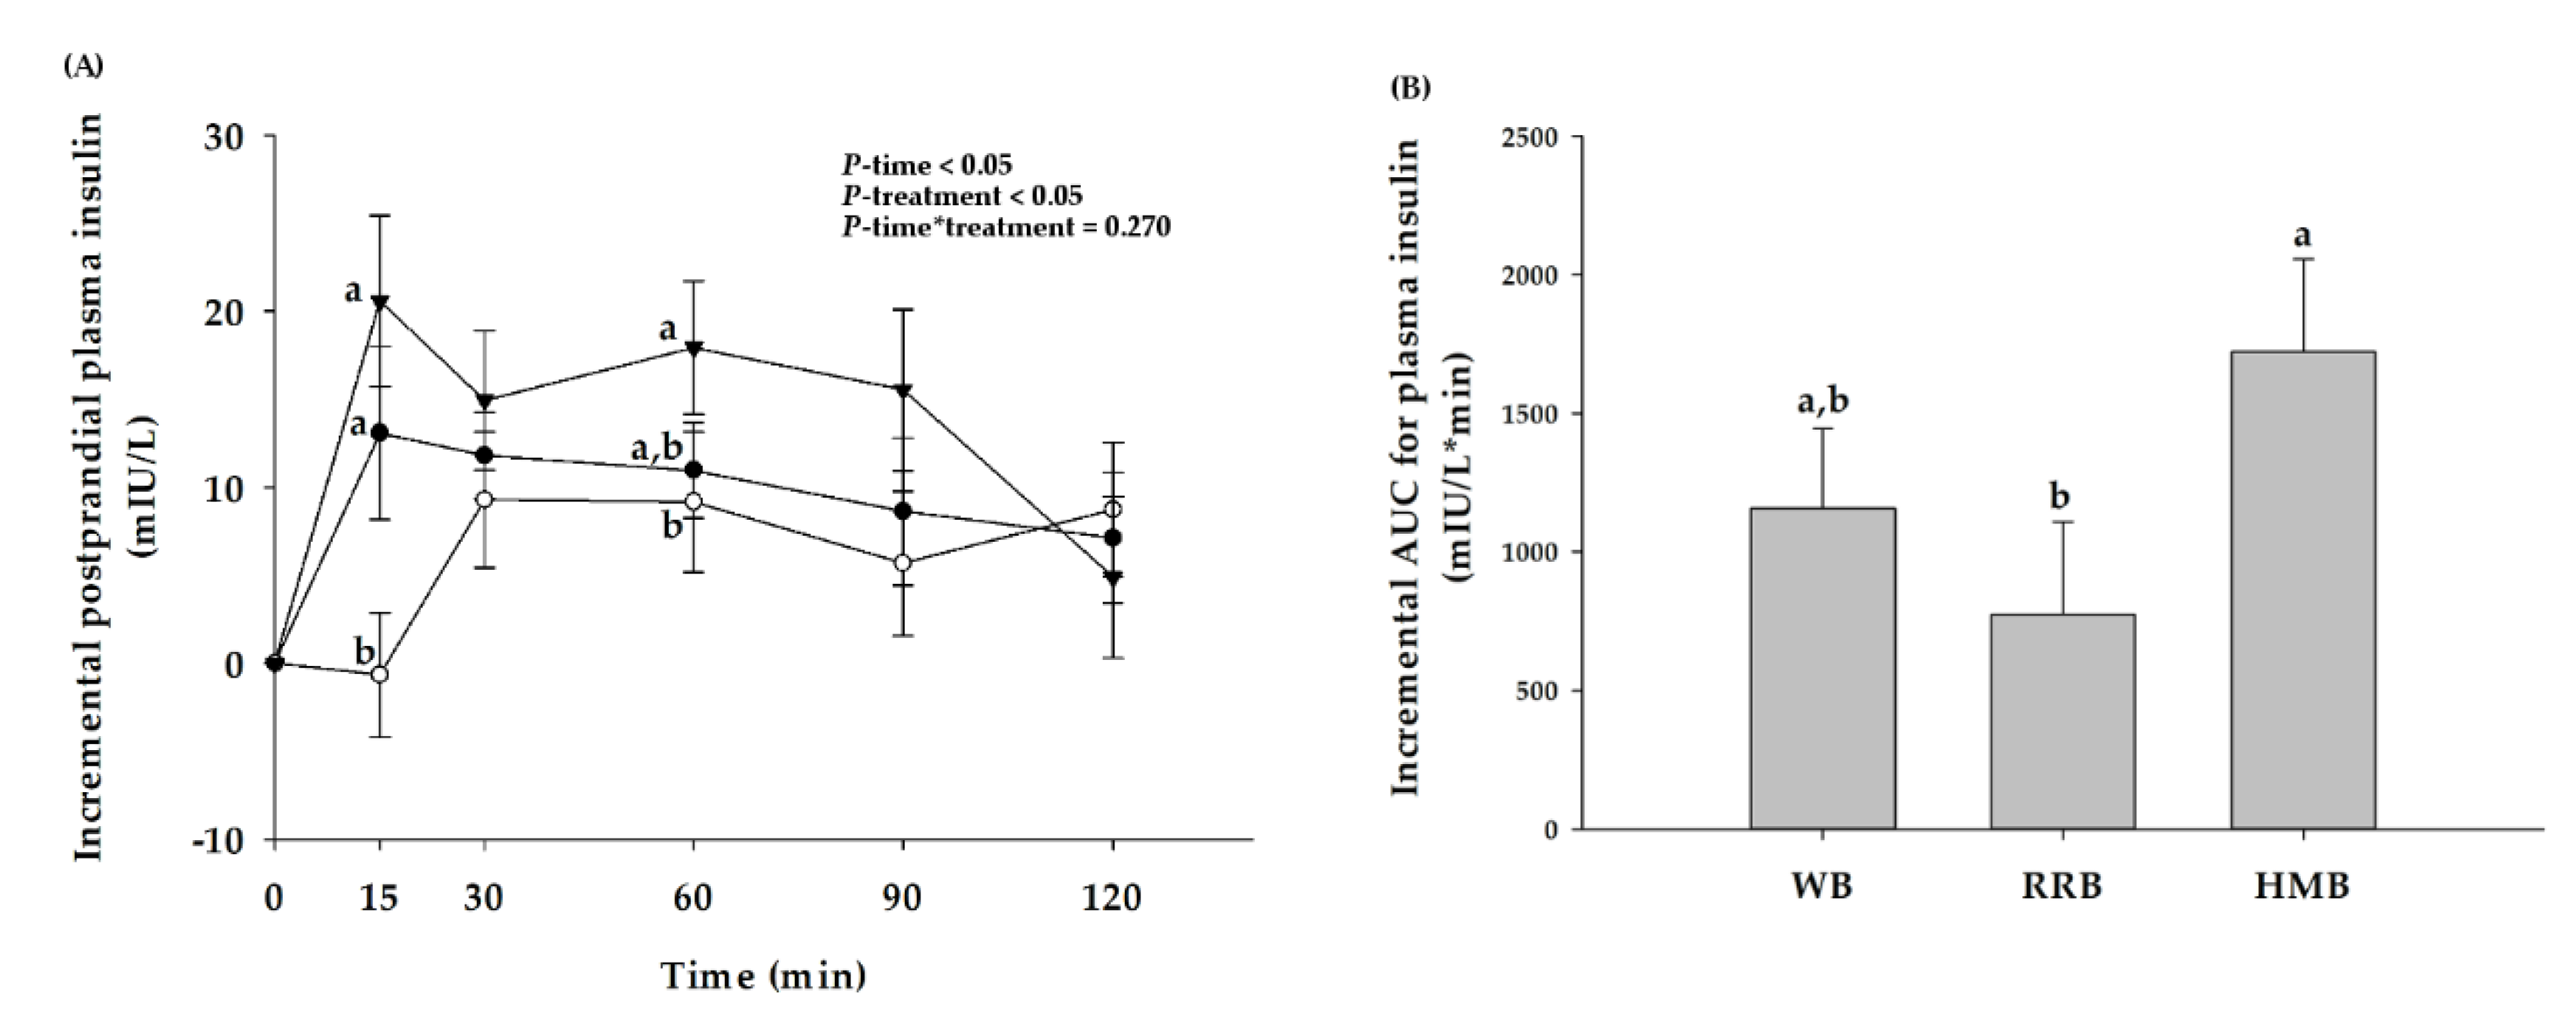
3.3. Postprandial Plasma Insulin
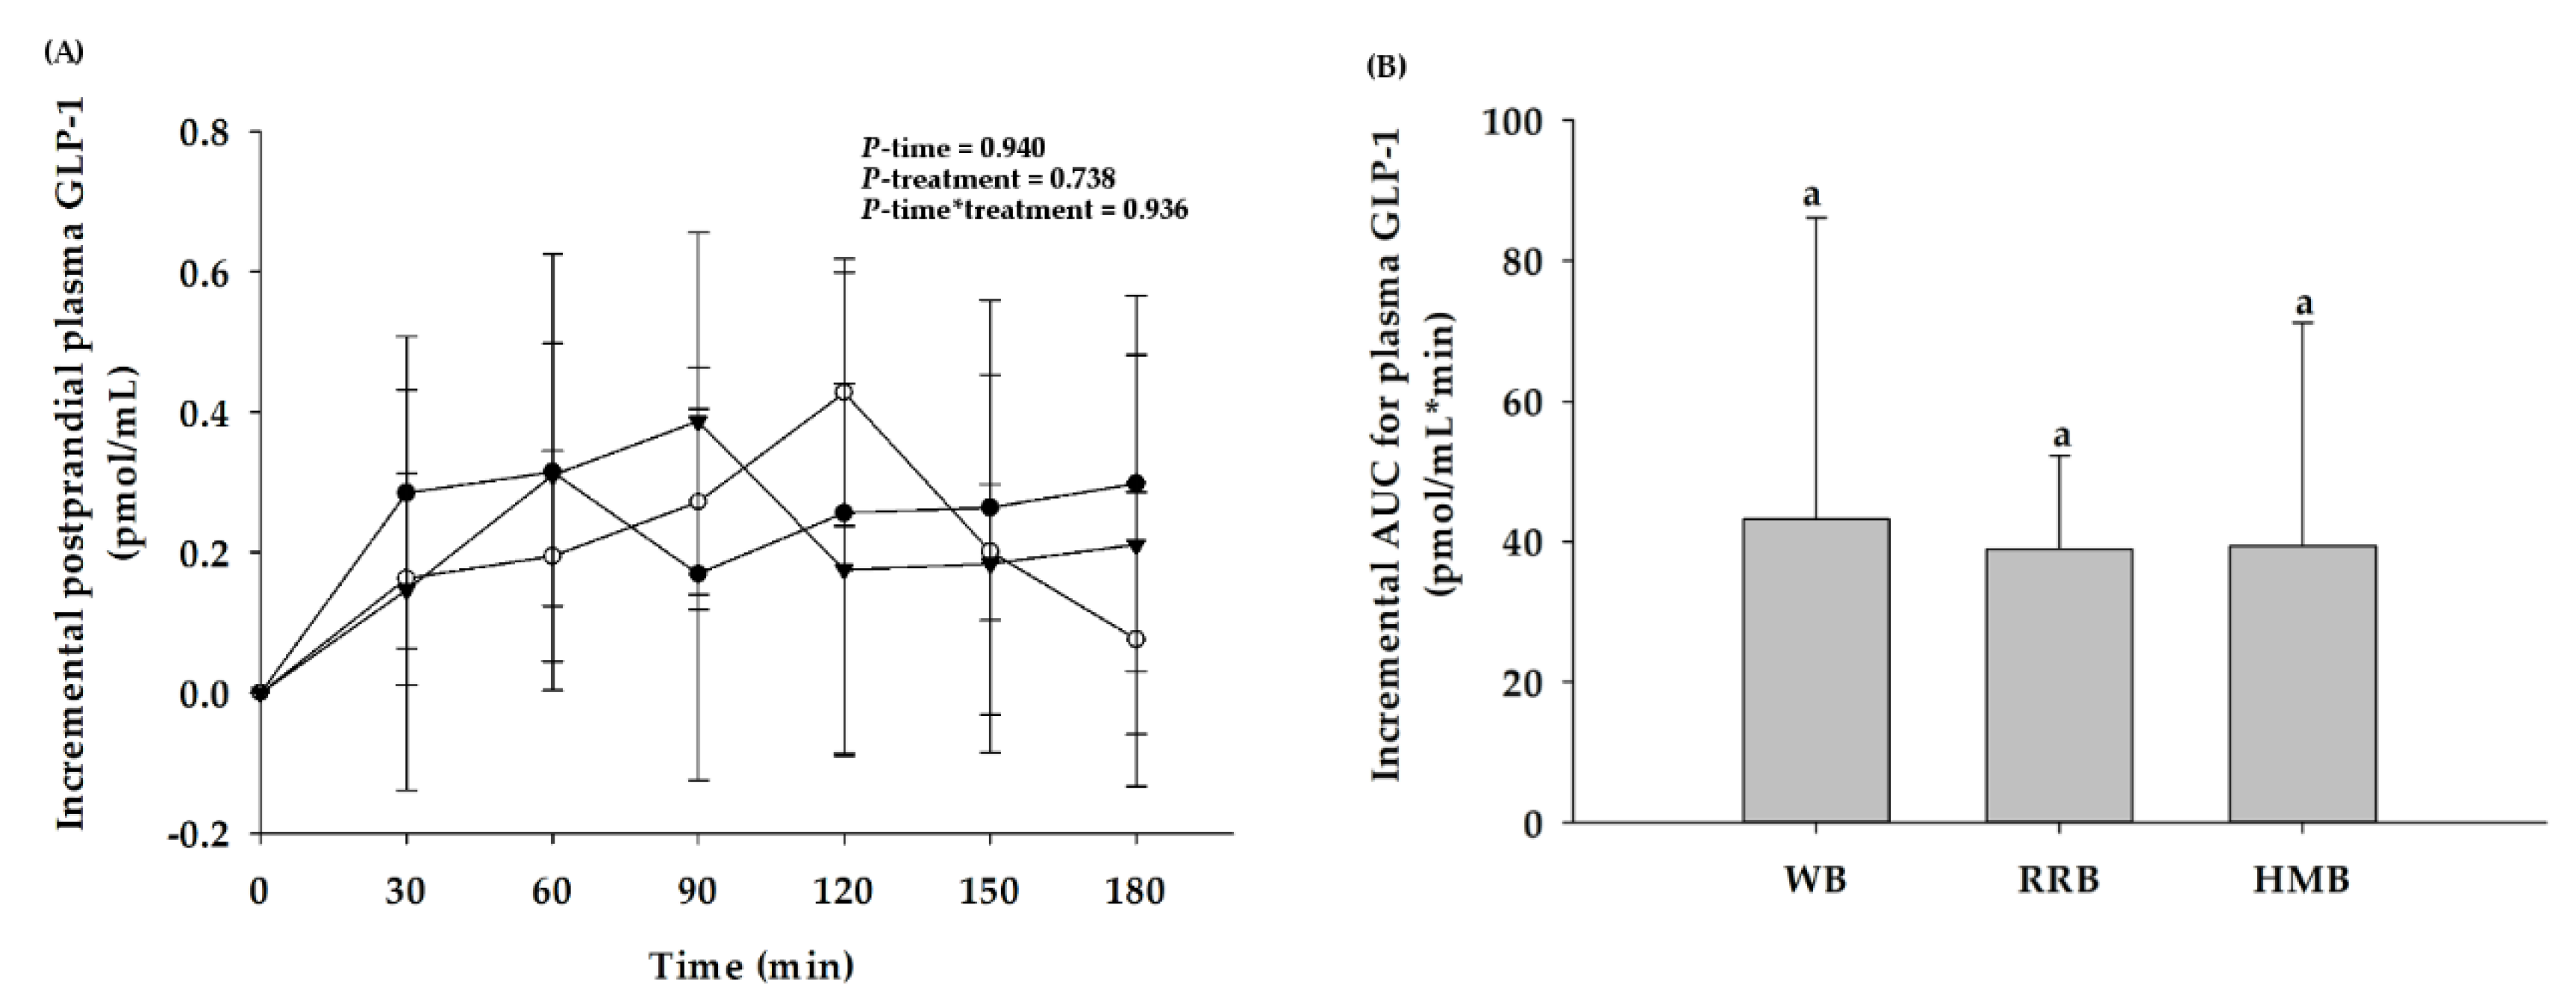
3.4. Plasma GLP-1
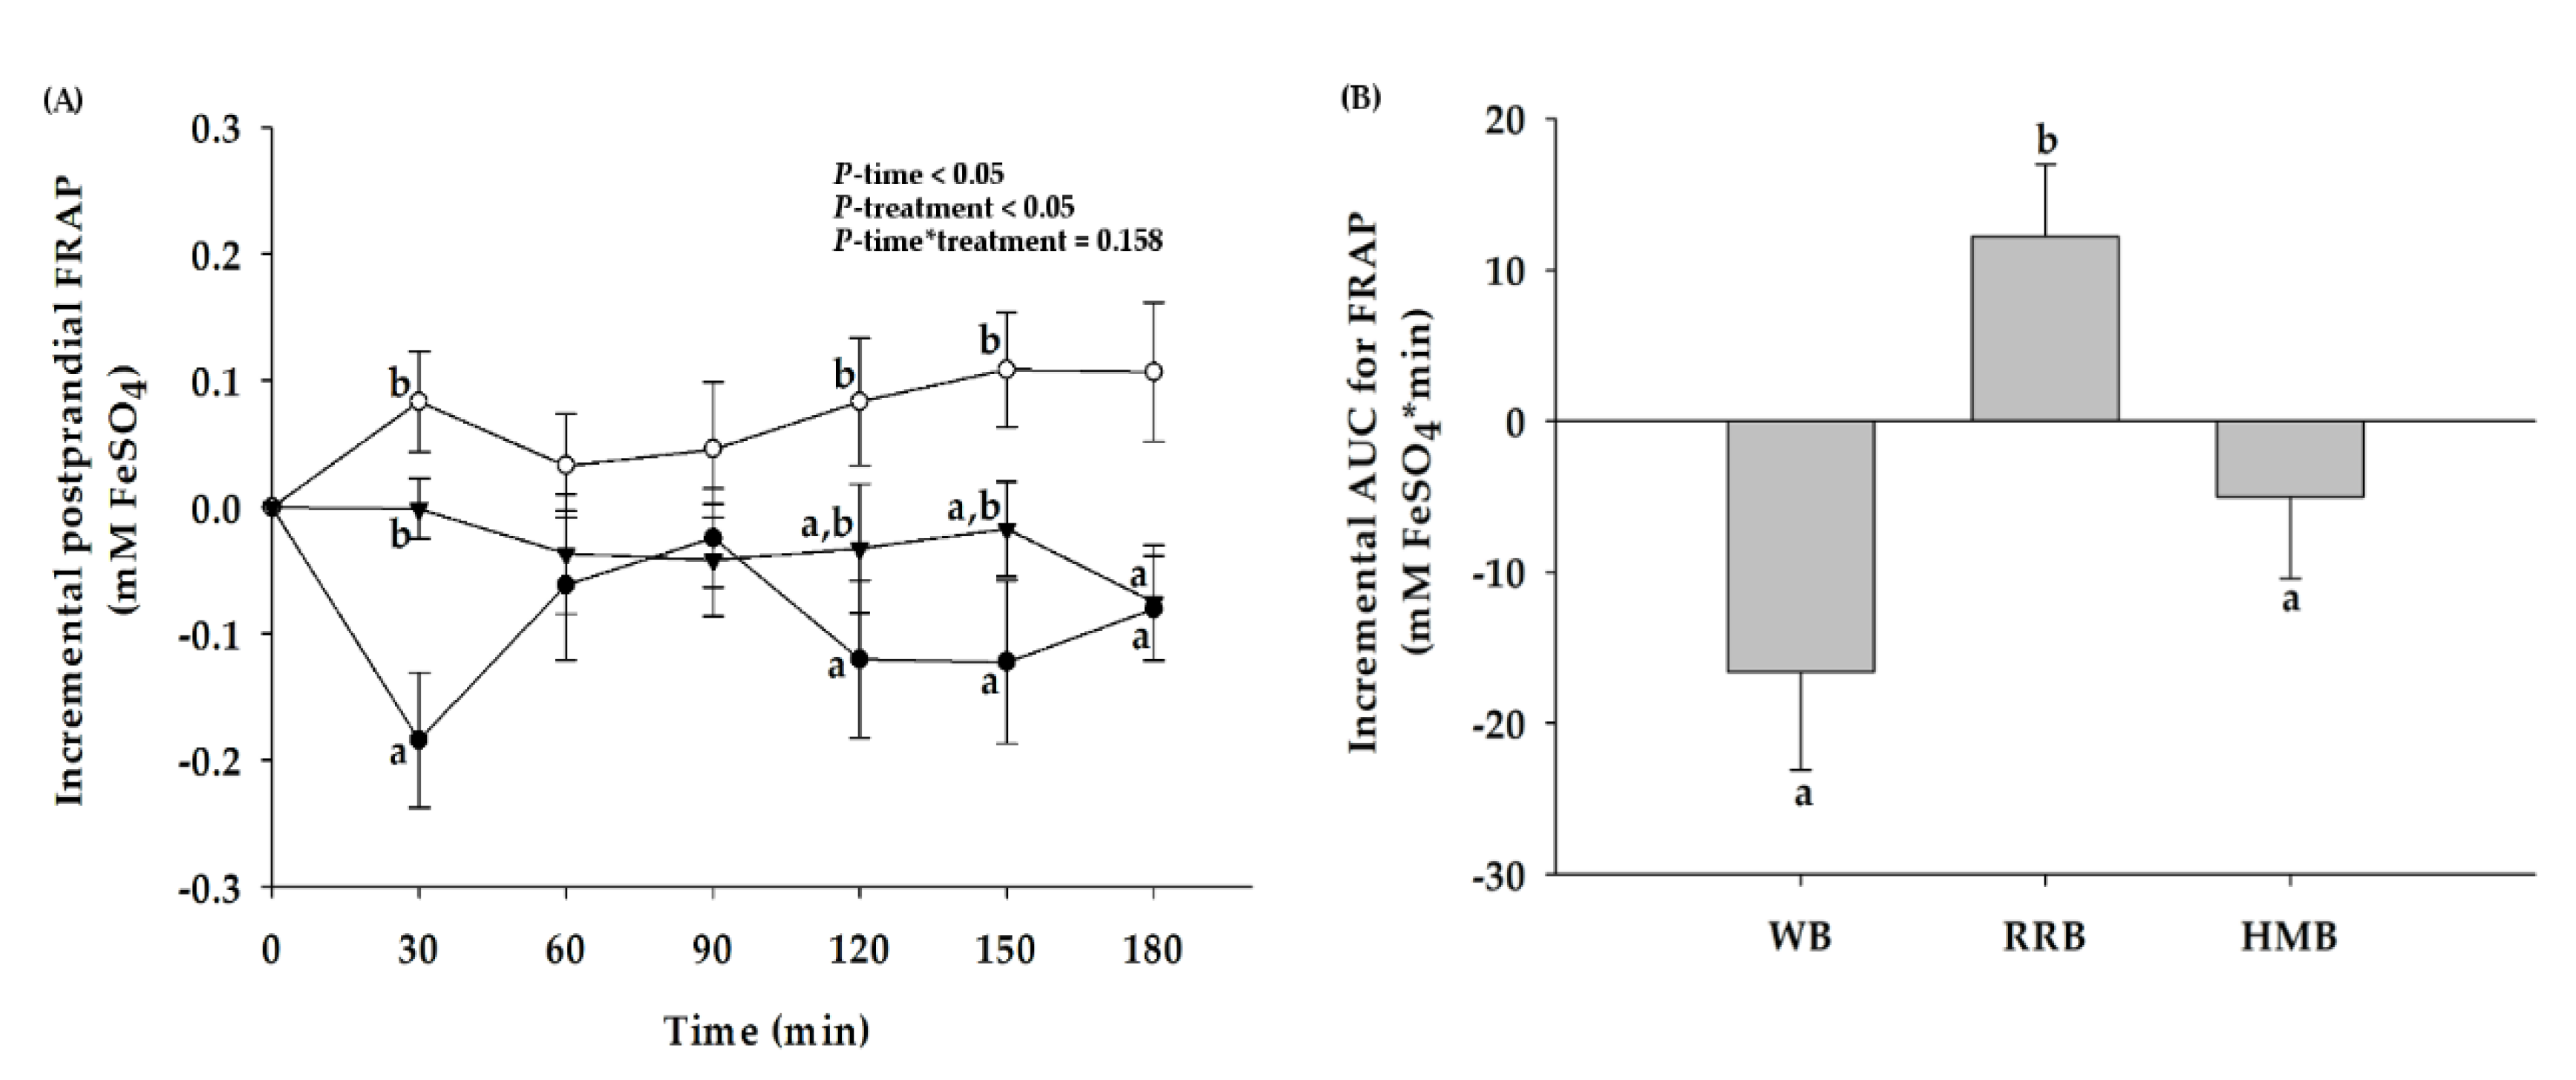
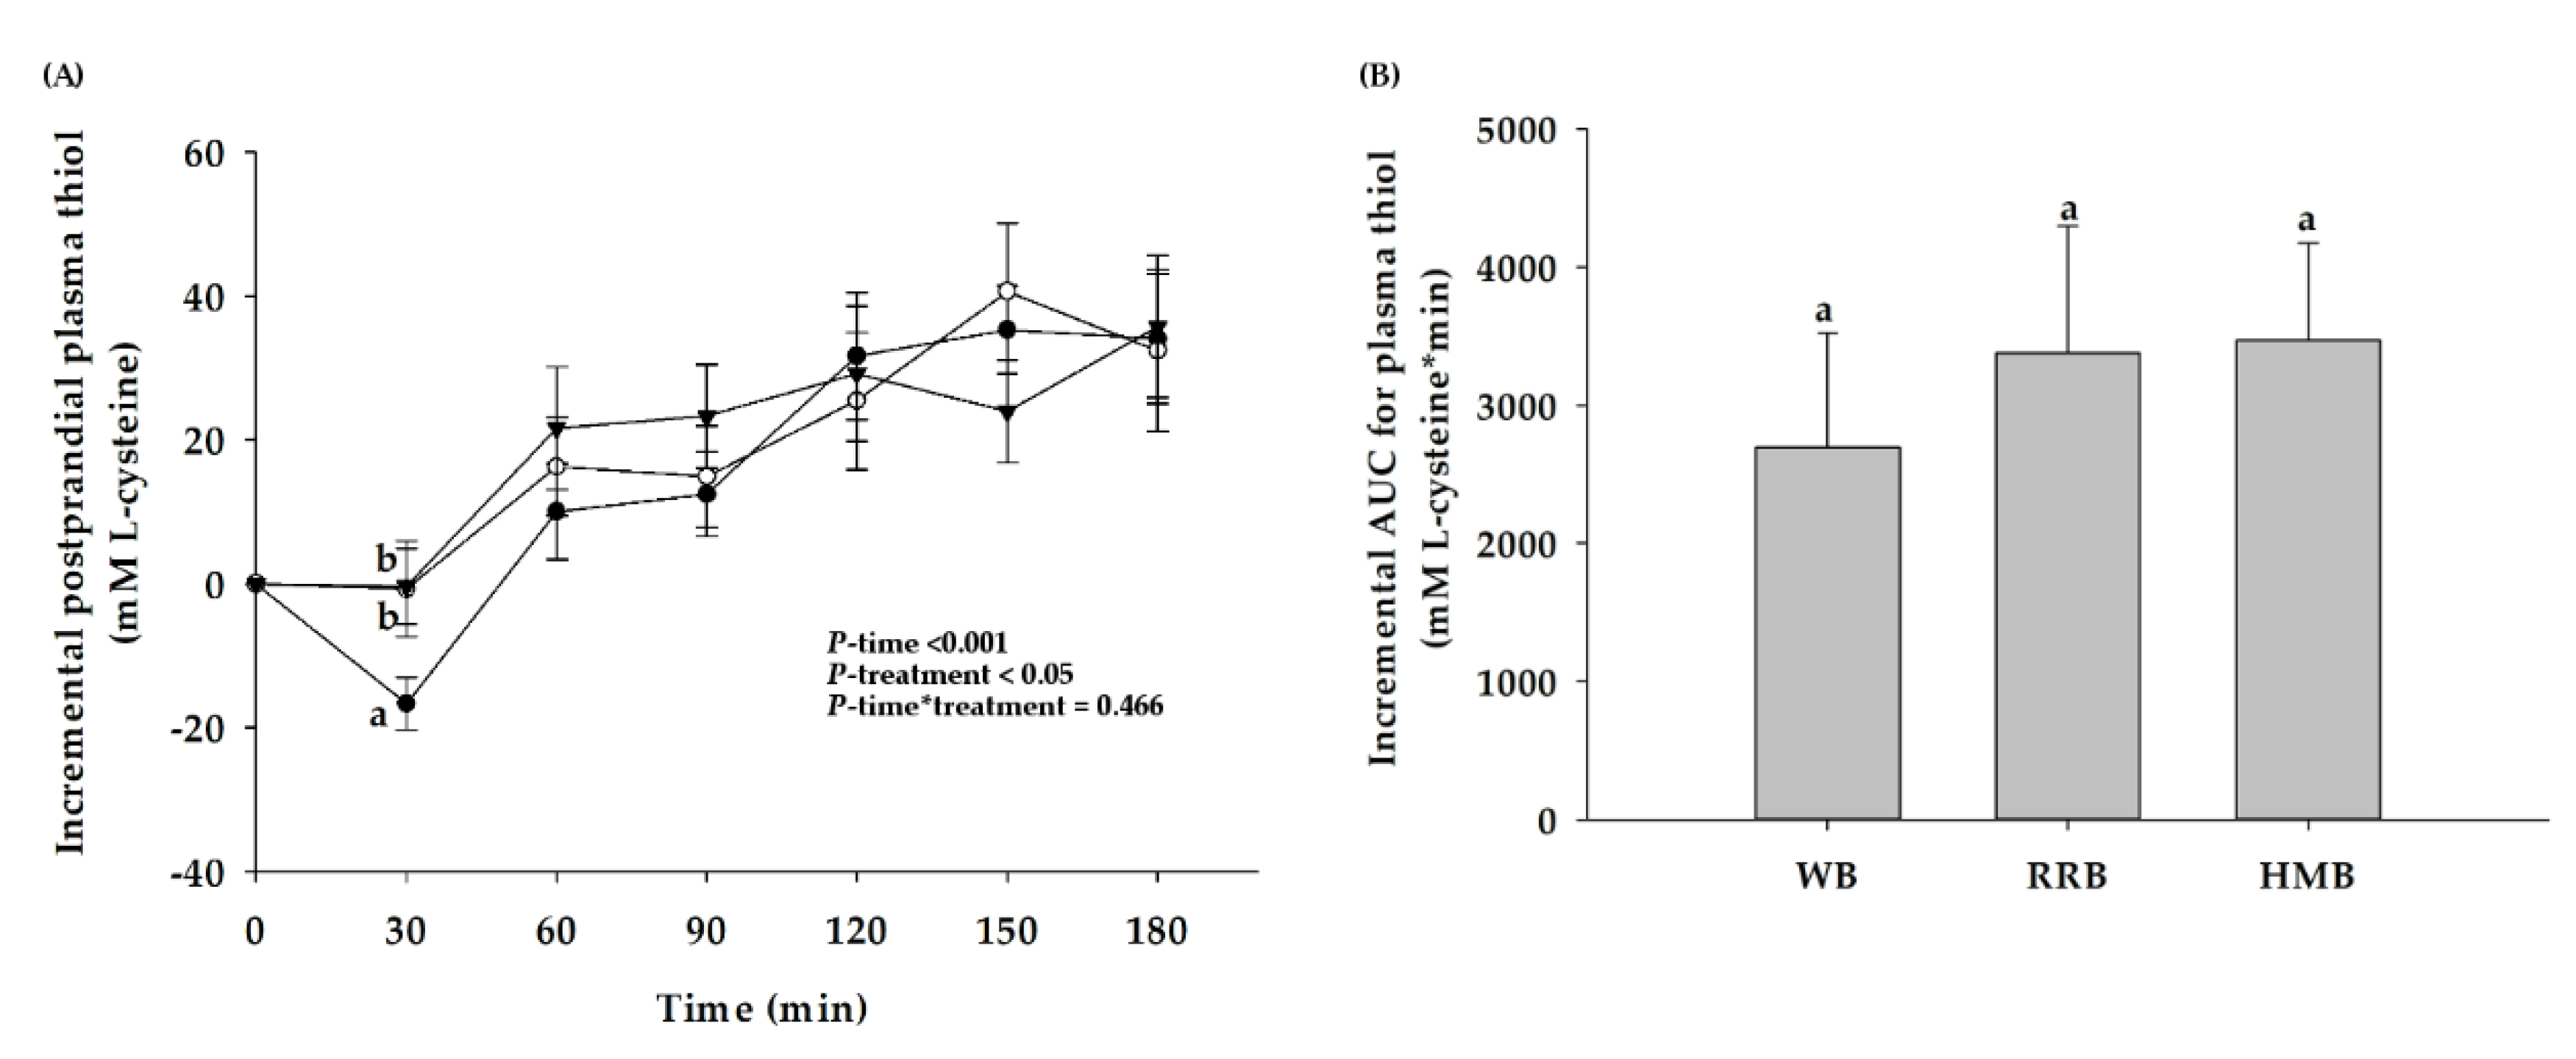
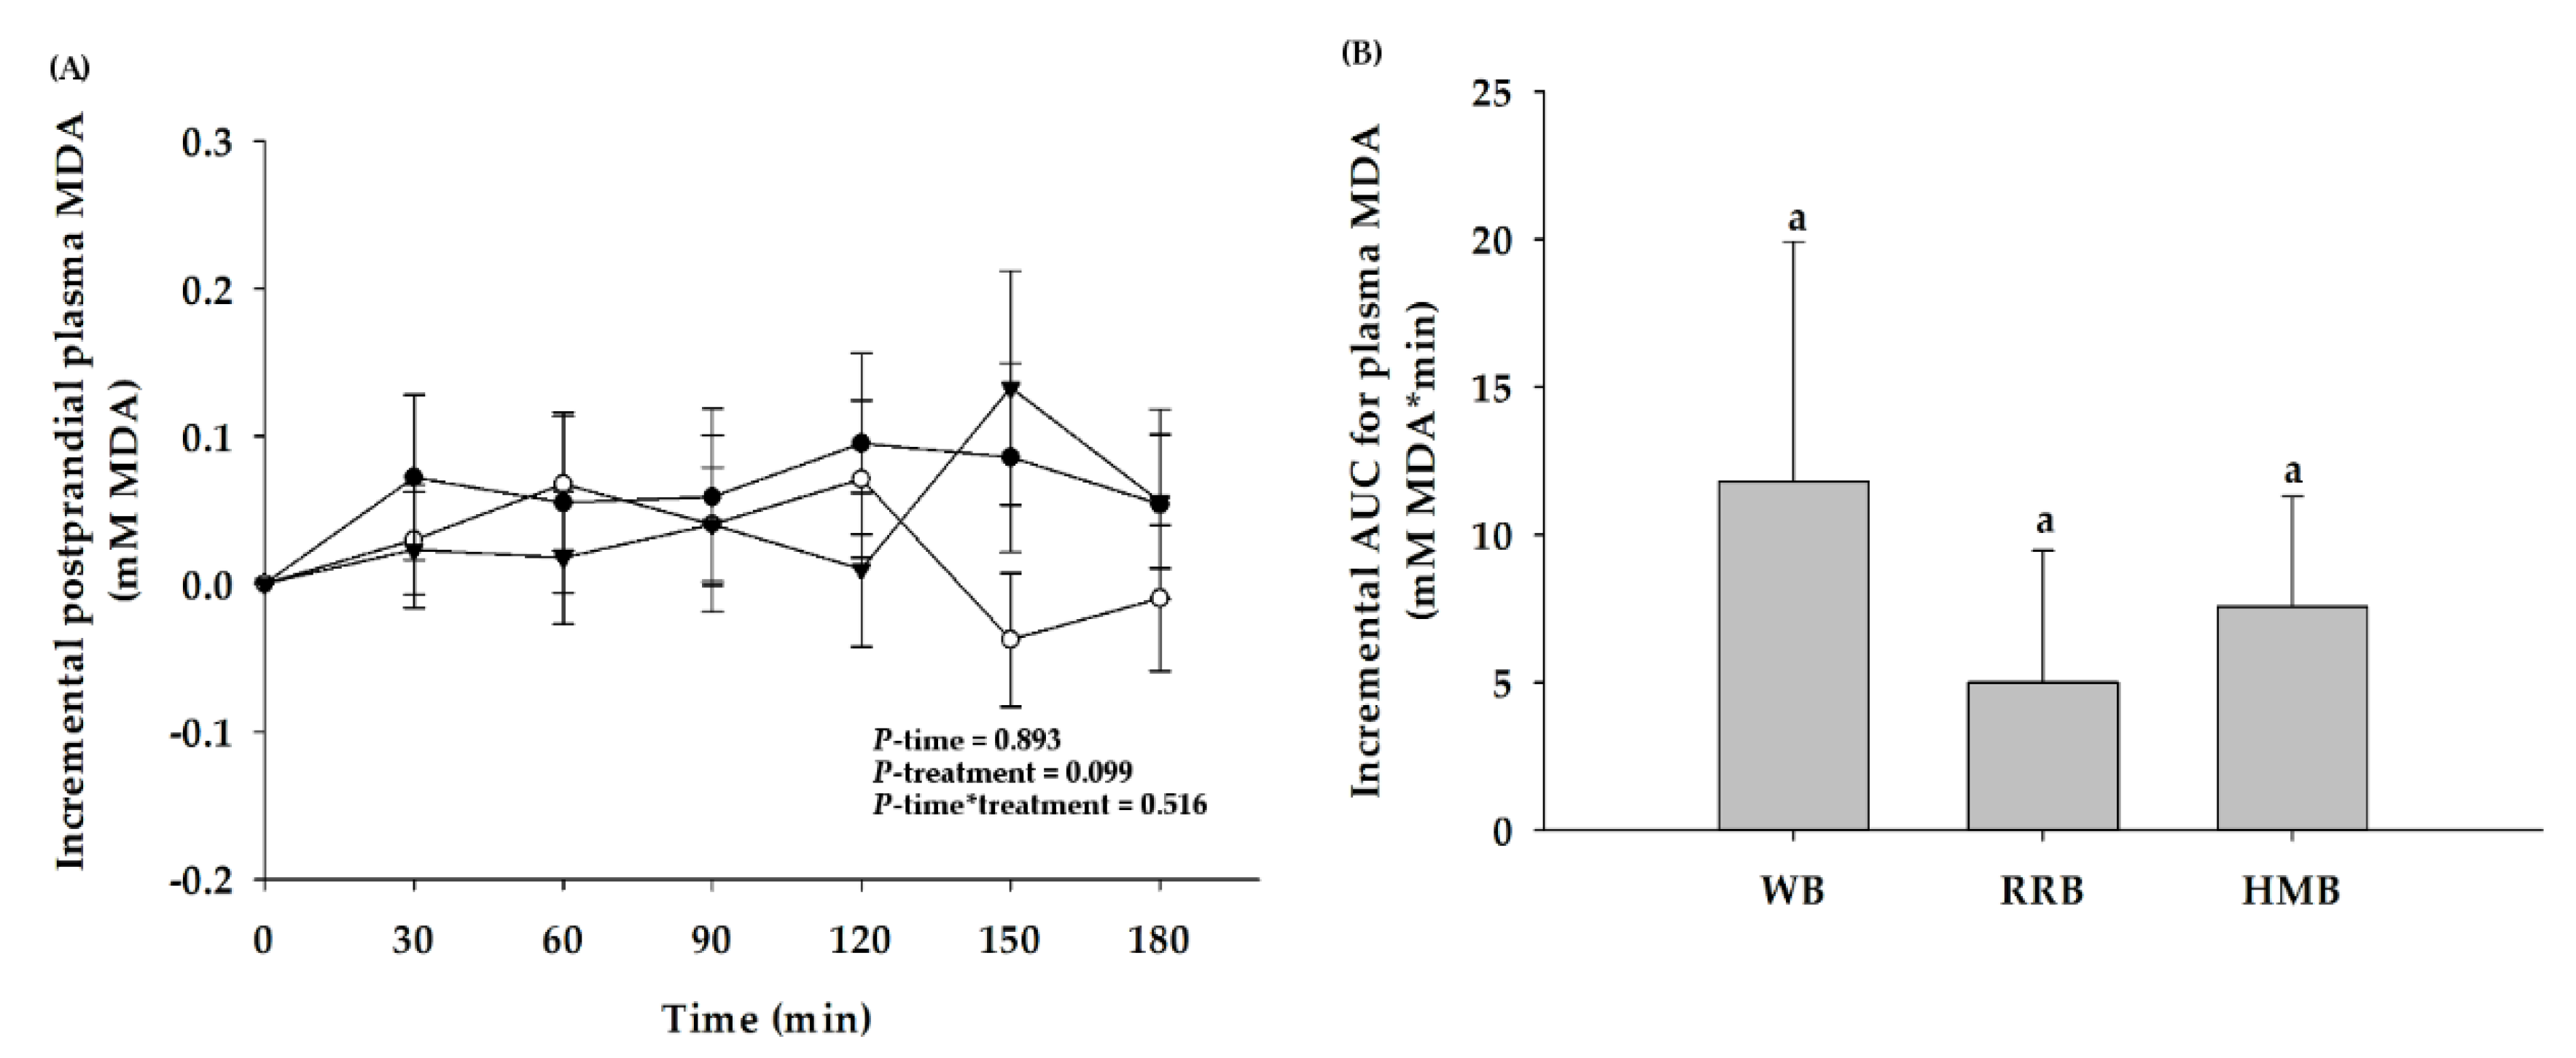
3.5. Plasma Antioxidant Status
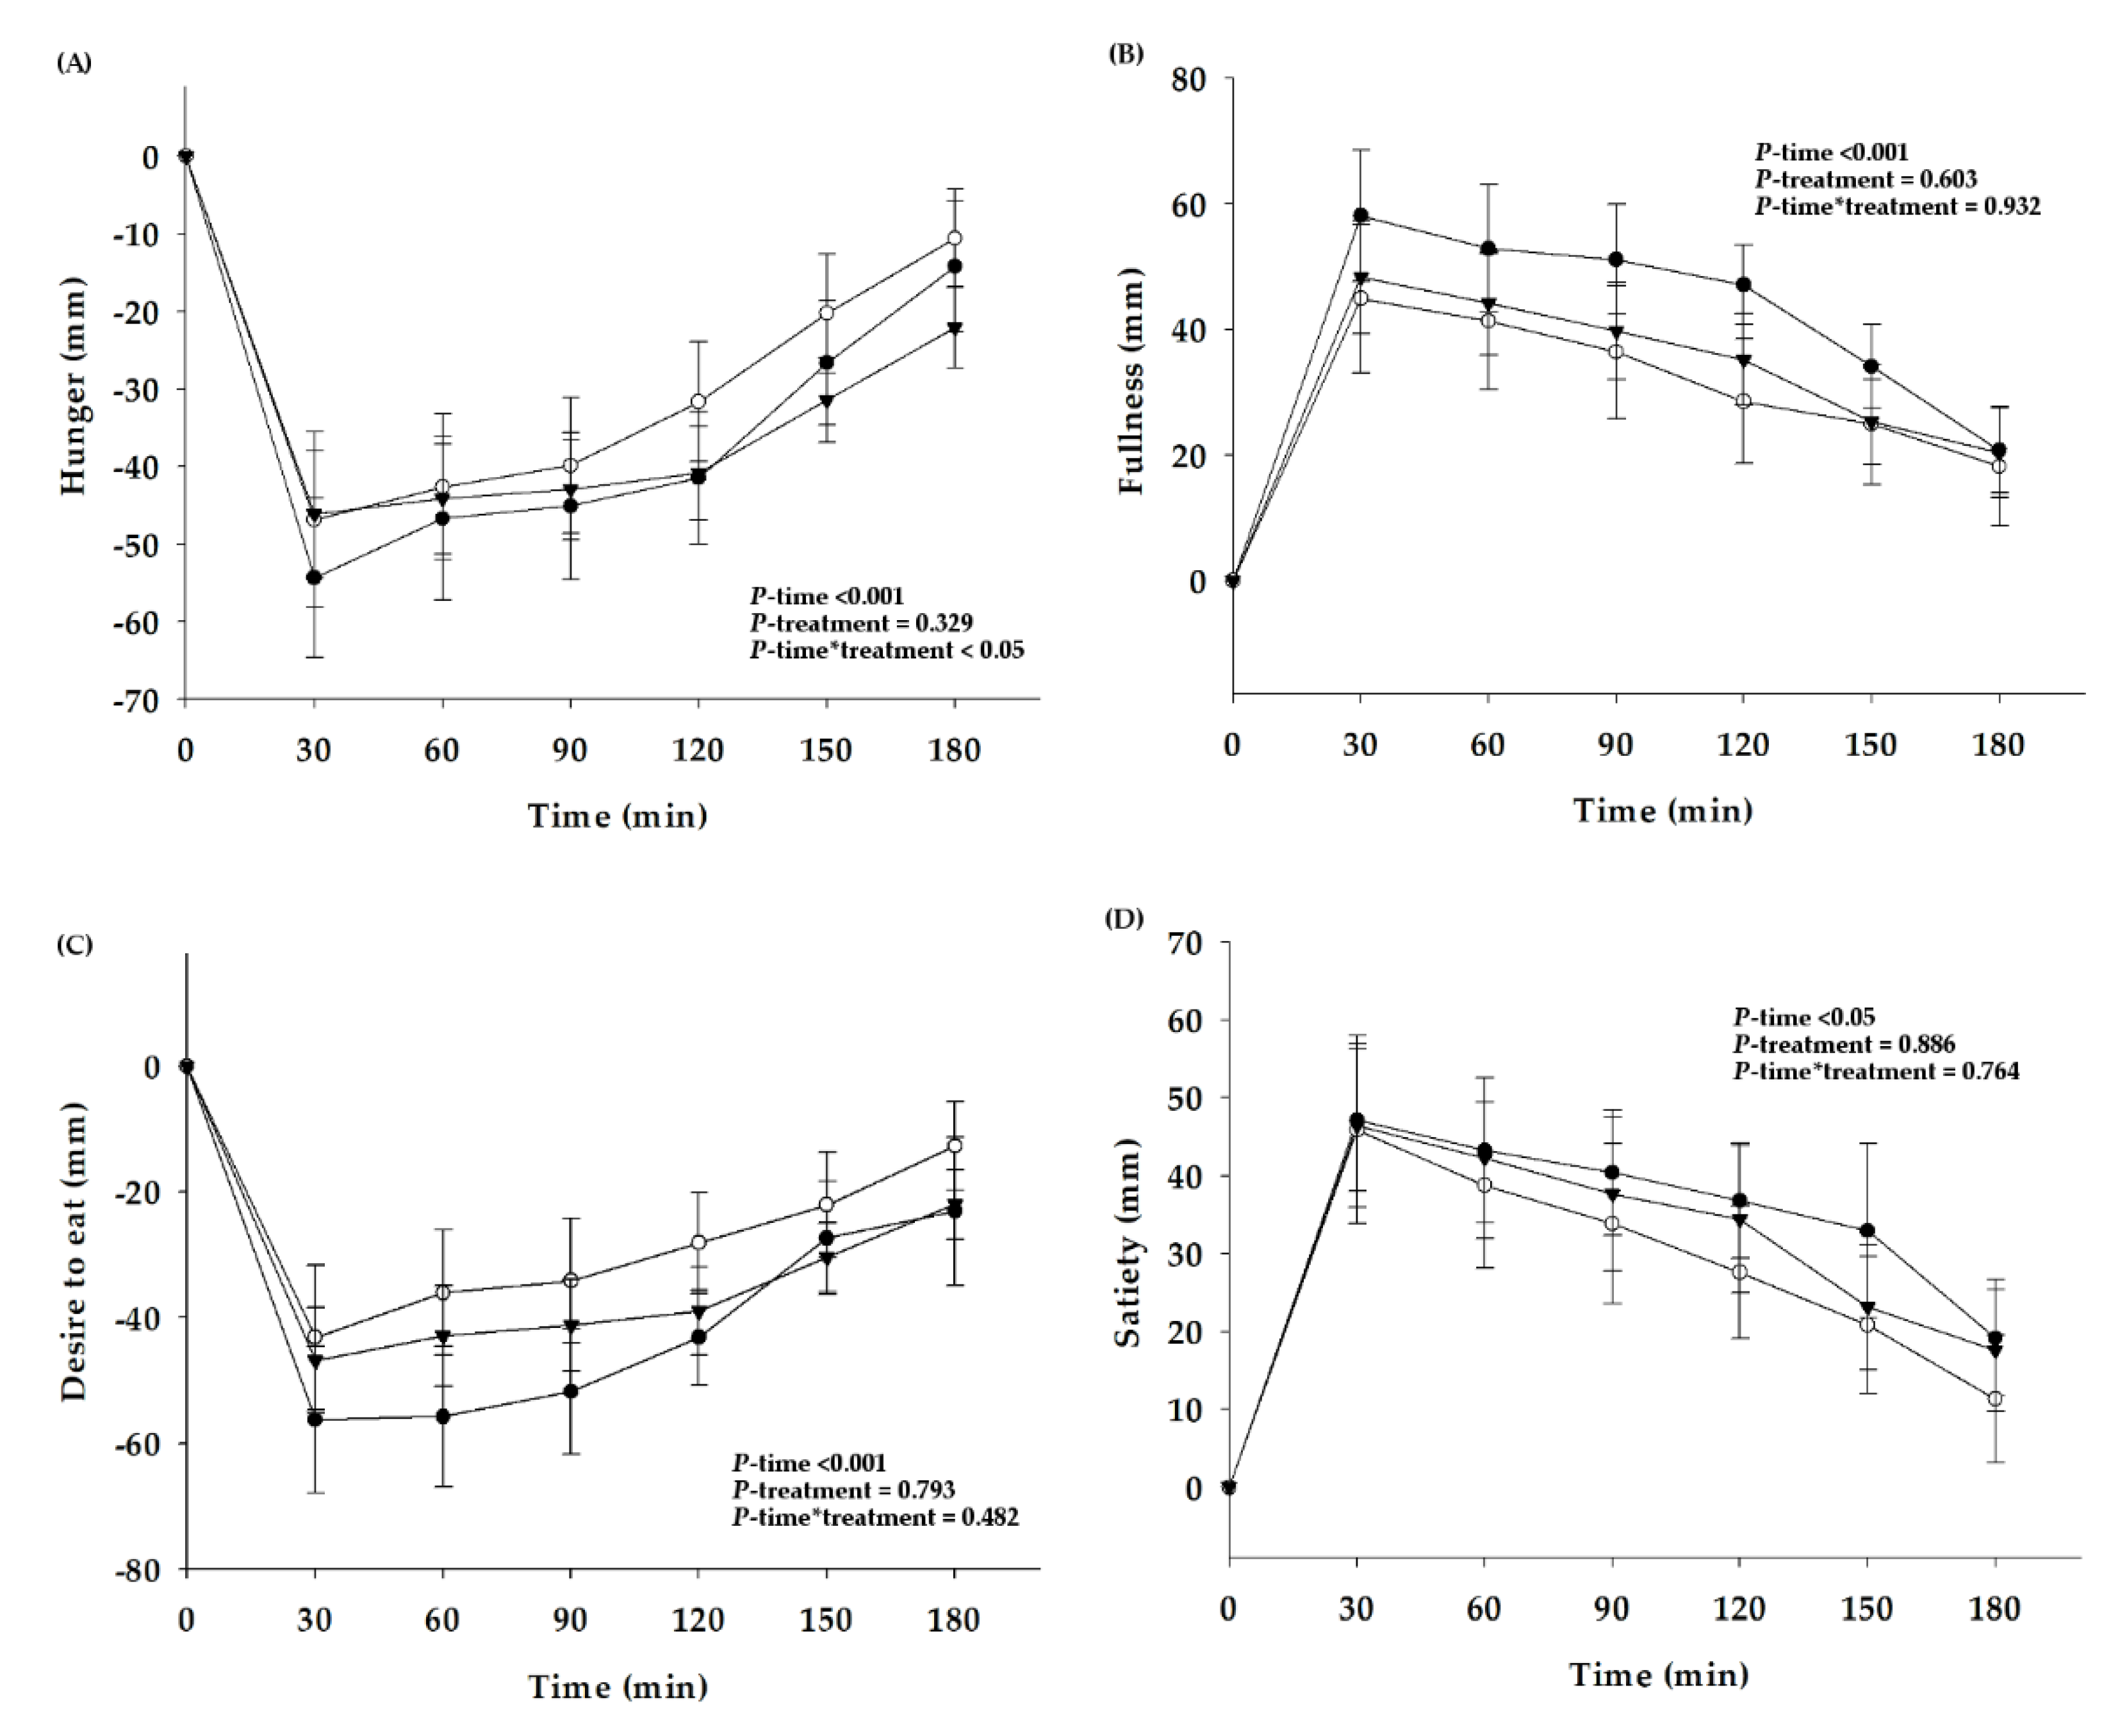
3.6. Subjective Rating of Hunger, Fullness, Desire to Eat, and Satiety
4. Discussion
5. Conclusions
Author Contributions
Funding
Acknowledgments
Conflicts of Interest
References
- Rienks, J.; Barbaresko, J.; Oluwagbemigun, K.; Schmid, M.; Nöthlings, U. Polyphenol exposure and risk of type 2 diabetes: Dose-response meta-analyses and systematic review of prospective cohort studies. Am. J. Clin. Nutr. 2018, 108, 49–61. [Google Scholar] [CrossRef] [Green Version]
- Kim, Y.; Je, Y. Flavonoid intake and mortality from cardiovascular disease and all causes: A meta-analysis of prospective cohort studies. Clin. Nutr. ESPEN 2017, 20, 68–77. [Google Scholar] [CrossRef]
- Thompson, L.U.; YOON, J.H. Starch digestibility as affected by polyphenols and phytic acid. J. Food Sci. 1984, 49, 1228–1229. [Google Scholar] [CrossRef]
- Nyambe-Silavwe, H.; Williamson, G. Polyphenol-and fibre-rich dried fruits with green tea attenuate starch-derived postprandial blood glucose and insulin: A randomised, controlled, single-blind, cross-over intervention. Br. J. Nutr. 2016, 116, 443–450. [Google Scholar] [CrossRef]
- Andersen, C.J.; Fernandez, M.; Disorders, M. Dietary strategies to reduce metabolic syndrome. Rev. Endocr. Metab. Disord. 2013, 14, 241–254. [Google Scholar] [CrossRef]
- Edirisinghe, I.; Banaszewski, K.; Cappozzo, J.; Sandhya, K.; Ellis, C.L.; Tadapaneni, R.; Kappagoda, C.T.; Burton-Freeman, B.M. Strawberry anthocyanin and its association with postprandial inflammation and insulin. Br. J. Nutr. 2011, 106, 913–922. [Google Scholar] [CrossRef]
- Kay, C.D.; Holub, B. The effect of wild blueberry (Vaccinium angustifolium) consumption on postprandial serum antioxidant status in human subjects. Br. J. Nutr. 2002, 88, 389–397. [Google Scholar] [CrossRef] [Green Version]
- Mazza, G.; Kay, C.D.; Cottrell, T.; Holub, B.J. Absorption of anthocyanins from blueberries and serum antioxidant status in human subjects. J. Agric. Food Chem. 2002, 50, 7731–7737. [Google Scholar] [CrossRef]
- Jokioja, J.; Linderborg, K.M.; Kortesniemi, M.; Nuora, A.; Heinonen, J.; Sainio, T.; Viitanen, M.; Kallio, H.; Yang, B. Anthocyanin-rich extract from purple potatoes decreases postprandial glycemic response and affects inflammation markers in healthy men. Food Chem. 2020, 310, 125797. [Google Scholar] [CrossRef]
- Chusak, C.; Thilavech, T.; Henry, C.J.; Adisakwattana, S. Acute effect of Clitoria ternatea flower beverage on glycemic response and antioxidant capacity in healthy subjects: A randomized crossover trial. BMC complement. Altern. Med. 2018, 18, 1–11. [Google Scholar] [CrossRef]
- Frei, M.; Becker, K. Agro-biodiversity in subsistence-oriented farming systems in a Philippine upland region: Nutritional considerations. Biodivers. Conserv. 2004, 13, 1591–1610. [Google Scholar] [CrossRef]
- Leardkamolkarn, V.; Thongthep, W.; Suttiarporn, P.; Kongkachuichai, R.; Wongpornchai, S.; Wanavijitr, A. Chemopreventive properties of the bran extracted from a newly-developed Thai rice: The Riceberry. Food Chem. 2011, 125, 978–985. [Google Scholar] [CrossRef]
- Poosri, S.; Thilavech, T.; Pasukamonset, P.; Suparpprom, C.; Adisakwattana, S. Studies on Riceberry rice (Oryza sativa L.) extract on the key steps related to carbohydrate and lipid digestion and absorption: A new source of natural bioactive substances. NFS J. 2019, 17, 17–23. [Google Scholar] [CrossRef]
- Arjinajarn, P.; Chueakula, N.; Pongchaidecha, A.; Jaikumkao, K.; Chatsudthipong, V.; Mahatheeranont, S.; Norkaew, O.; Chattipakorn, N.; Lungkaphin, A. Anthocyanin-rich Riceberry bran extract attenuates gentamicin-induced hepatotoxicity by reducing oxidative stress, inflammation and apoptosis in rats. Biomed. Pharm. 2017, 92, 412–420. [Google Scholar] [CrossRef]
- Daiponmak, W.; Senakun, C.; Siriamornpun, S. Antiglycation capacity and antioxidant activities of different pigmented Thai rice. Int. J. Food Sci. Tech. 2014, 49, 1805–1810. [Google Scholar] [CrossRef]
- Suttireung, P.; Winuprasith, T.; Srichamnong, W.; Paemuang, W.; Phonyiam, T.; Trachootham, D. Riceberry rice puddings: Rice-based low glycemic dysphagia diets. Asia Pac. J. Clin. Nutr. 2019, 28, 467. [Google Scholar]
- Thiranusornkij, L.; Thamnarathip, P.; Chandrachai, A.; Kuakpetoon, D.; Adisakwattana, S. Comparative studies on physicochemical properties, starch hydrolysis, predicted glycemic index of Hom Mali rice and Riceberry rice flour and their applications in bread. Food Chem. 2019, 283, 224–231. [Google Scholar] [CrossRef]
- Chusak, C.; Henry, C.J.; Chantarasinlapin, P.; Techasukthavorn, V.; Adisakwattana, S. Influence of Clitoria ternatea flower extract on the in vitro enzymatic digestibility of starch and its application in bread. Foods 2018, 7, 102. [Google Scholar] [CrossRef] [Green Version]
- AOAC. International Total Dietary Fiber in Foods, Enzymatic- Gravimetric Method Official Methods of Analysis of AOAC International, 17th ed.; William, H., Ed.; AOAC: Gaithersburg, MD, USA, 2003. [Google Scholar]
- Benzie, I.F.; Strain, J. The ferric reducing ability of plasma (FRAP) as a measure of “antioxidant power”: The FRAP assay. Anal. Biochem. 1996, 239, 70–76. [Google Scholar] [CrossRef] [Green Version]
- Ellman, G. Tissue sulfhydryl groups. Arch. Biochem. Biophys. 1959, 82, 70–77. [Google Scholar] [CrossRef]
- Vuksan, V.; Jenkins, A.L.; Dias, A.G.; Lee, A.S.; Jovanovski, E.; Rogovik, A.L.; Hanna, A. Reduction in postprandial glucose excursion and prolongation of satiety: Possible explanation of the long-term effects of whole grain Salba (Salvia Hispanica L.). Eur. J. Clin. Nutr. 2010, 64, 436. [Google Scholar] [CrossRef] [PubMed] [Green Version]
- Lafiandra, D.; Riccardi, G.; Shewry, P.R. Improving cereal grain carbohydrates for diet and health. J. Cereal Sci. 2014, 59, 312–326. [Google Scholar] [CrossRef] [PubMed] [Green Version]
- Potter, J.G.; Coffman, K.P.; Reid, R.L.; Krall, J.M.; Albrink, M.J. Effect of test meals of varying dietary fiber content on plasma insulin and glucose response. Am. J. Clin. Nutr. 1981, 34, 328–334. [Google Scholar] [CrossRef] [PubMed]
- McDougall, G.J.; Shpiro, F.; Dobson, P.; Smith, P.; Blake, A.; Stewart, D. Different polyphenolic components of soft fruits inhibit α-amylase and α-glucosidase. J. Agric. Food Chem. 2005, 53, 2760–2766. [Google Scholar] [CrossRef] [PubMed]
- Fardet, A. Wheat-based foods and non celiac gluten/wheat sensitivity: Is drastic processing the main key issue? Med. Hypotheses. 2015, 85, 934–939. [Google Scholar] [CrossRef]
- Lamb, R.; Goldstein, B. Modulating an oxidative-inflammatory cascade: Potential new treatment strategy for improving glucose metabolism, insulin resistance, and vascular function. Int. J. Clin. Pract. 2008, 62, 1087–1095. [Google Scholar] [CrossRef] [Green Version]
- Yamagishi, S.; Imaizumi, T. Diabetic vascular complications: Pathophysiology, biochemical basis and potential therapeutic strategy. Curr. Pharm. Des. 2005, 11, 2279–2299. [Google Scholar] [CrossRef]
- Chusak, C.; Thilavech, T.; Adisakwattana, S. Consumption of Mesona chinensis attenuates postprandial glucose and improves antioxidant status induced by a high carbohydrate meal in overweight subjects. Am. J. Chin. Med. 2014, 42, 315–336. [Google Scholar] [CrossRef]
- Naseri, R.; Farzaei, F.; Haratipour, P.; Nabavi, S.F.; Habtemariam, S.; Farzaei, M.H.; Khodarahmi, R.; Tewari, D.; Momtaz, S. Anthocyanins in the management of metabolic syndrome: A pharmacological and biopharmaceutical review. Front. Pharmacol. 2018, 9, 1310. [Google Scholar] [CrossRef]
- Ceriello, A.; Bortolotti, N.; Crescentini, A.; Motz, E.; Lizzio, S.; Russo, A.; Ezsol, Z.; Tonutti, L.; Taboga, C. Antioxidant defences are reduced during the oral glucose tolerance test in normal and non-insulin-dependent diabetic subjects. Eur. J. Clin. Invest. 1998, 28, 329–333. [Google Scholar] [CrossRef]
- Morgan, P.E.; Sturgess, A.D.; Davies, M.J. Increased levels of serum protein oxidation and correlation with disease activity in systemic lupus erythematosus. Arthritis Rheum. 2005, 52, 2069–2079. [Google Scholar] [CrossRef] [PubMed]
- Bonina, F.; Leotta, C.; Scalia, G.; Puglia, C.; Trombetta, D.; Tringali, G.; Roccazzello, A.M.; Rapisarda, P.; Saija, A. Evaluation of oxidative stress in diabetic patients after supplementation with a standardised red orange extract. Diabetes Nutr. Metab. 2002, 15, 14–19. [Google Scholar] [PubMed]
- Reinbold, J.; Rychlik, M.; Asam, S.; Wieser, H.; Koehler, P. Concentrations of total glutathione and cysteine in wheat flour as affected by sulfur deficiency and correlation to quality parameters. J. Agric. Food Chem. 2008, 56, 6844–6850. [Google Scholar] [CrossRef] [PubMed]
- Montes-Nieto, R.; Insenser, M.; Murri, M.; Fernández-Durán, E.; Ojeda-Ojeda, M.; Martínez-García, M.Á.; Luque-Ramírez, M.; Escobar-Morreale, H.F. Plasma thiobarbituric acid reactive substances (TBARS) in young adults: Obesity increases fasting levels only in men whereas glucose ingestion, and not protein or lipid intake, increases postprandial concentrations regardless of sex and obesity. Mol. Nutr. Food Res. 2017, 61, 1700425. [Google Scholar] [CrossRef]
- Gonzalez-Anton, C.; Rico, M.C.; Sanchez-Rodriguez, E.; Ruiz-Lopez, M.D.; Gil, A.; Mesa, M.D. Glycemic responses, appetite ratings and gastrointestinal hormone responses of most common breads consumed in Spain. A randomized control trial in healthy humans. Nutrients 2015, 7, 4033–4053. [Google Scholar] [CrossRef] [Green Version]
- Belobrajdic, D.P.; Regina, A.; Klingner, B.; Zajac, I.; Chapron, S.; Berbezy, P.; Bird, A.R. High-amylose wheat lowers the postprandial glycemic response to bread in healthy adults: A randomized controlled crossover trial. J. Nutr. 2019, 149, 1335–1345. [Google Scholar] [CrossRef]
- Quilez, J.; Bullo, M.; Salas-Salvadó, J. Improved postprandial response and feeling of satiety after consumption of low-calorie muffins with maltitol and high-amylose corn starch. J. Food Sci. 2007, 72, S407–S411. [Google Scholar] [CrossRef]
- Willis, H.J.; Eldridge, A.L.; Beiseigel, J.; Thomas, W.; Slavin, J.L. Greater satiety response with resistant starch and corn bran in human subjects. Nutr. Res. 2009, 29, 100–105. [Google Scholar] [CrossRef]


| Proximate Composition (%) | Wheat Bread | Riceberry Rice Bread | Hom Mali Bread |
|---|---|---|---|
| Total Carbohydrate | 44.48 | 42.93 | 46.98 |
| Total dietary fiber | 5.46 | 3.94 | 3.76 |
| Available carbohydrate | 39.02 | 38.99 | 43.22 |
| Protein | 10.0 | 8.16 | 7.63 |
| Total fat | 4.95 | 5.87 | 4.7 |
| Moisture | 39.0 | 41.28 | 39.13 |
| Ash | 1.57 | 1.76 | 1.49 |
| Mean ± SEM | |
|---|---|
| Age (years) | 24.29 ± 0.67 |
| BMI (kg/m2) | 21.29 ± 0.34 |
| Fasting blood glucose (mg/dL) | 79.71 ± 3.40 |
| Fasting total cholesterol (mg/dL) | 180.48 ± 7.71 |
| Fasting triglyceride (mg/dL) | 56.86 ± 4.71 |
| Fasting LDL cholesterol (mg/dL) | 121.19 ± 6.22 |
| Creatinine (mg/dL) | 0.70 ± 0.02 |
| BUN (mg/dL) | 11.33 ± 0.54 |
© 2020 by the authors. Licensee MDPI, Basel, Switzerland. This article is an open access article distributed under the terms and conditions of the Creative Commons Attribution (CC BY) license (http://creativecommons.org/licenses/by/4.0/).
Share and Cite
Chusak, C.; Pasukamonset, P.; Chantarasinlapin, P.; Adisakwattana, S. Postprandial Glycemia, Insulinemia, and Antioxidant Status in Healthy Subjects after Ingestion of Bread made from Anthocyanin-Rich Riceberry Rice. Nutrients 2020, 12, 782. https://doi.org/10.3390/nu12030782
Chusak C, Pasukamonset P, Chantarasinlapin P, Adisakwattana S. Postprandial Glycemia, Insulinemia, and Antioxidant Status in Healthy Subjects after Ingestion of Bread made from Anthocyanin-Rich Riceberry Rice. Nutrients. 2020; 12(3):782. https://doi.org/10.3390/nu12030782
Chicago/Turabian StyleChusak, Charoonsri, Porntip Pasukamonset, Praew Chantarasinlapin, and Sirichai Adisakwattana. 2020. "Postprandial Glycemia, Insulinemia, and Antioxidant Status in Healthy Subjects after Ingestion of Bread made from Anthocyanin-Rich Riceberry Rice" Nutrients 12, no. 3: 782. https://doi.org/10.3390/nu12030782