
Flexible and Ecological Cotton-Based Dosimeter for 2D UV Surface Dose Distribution Measurements


Abstract
1. Introduction
2. Materials and Methods
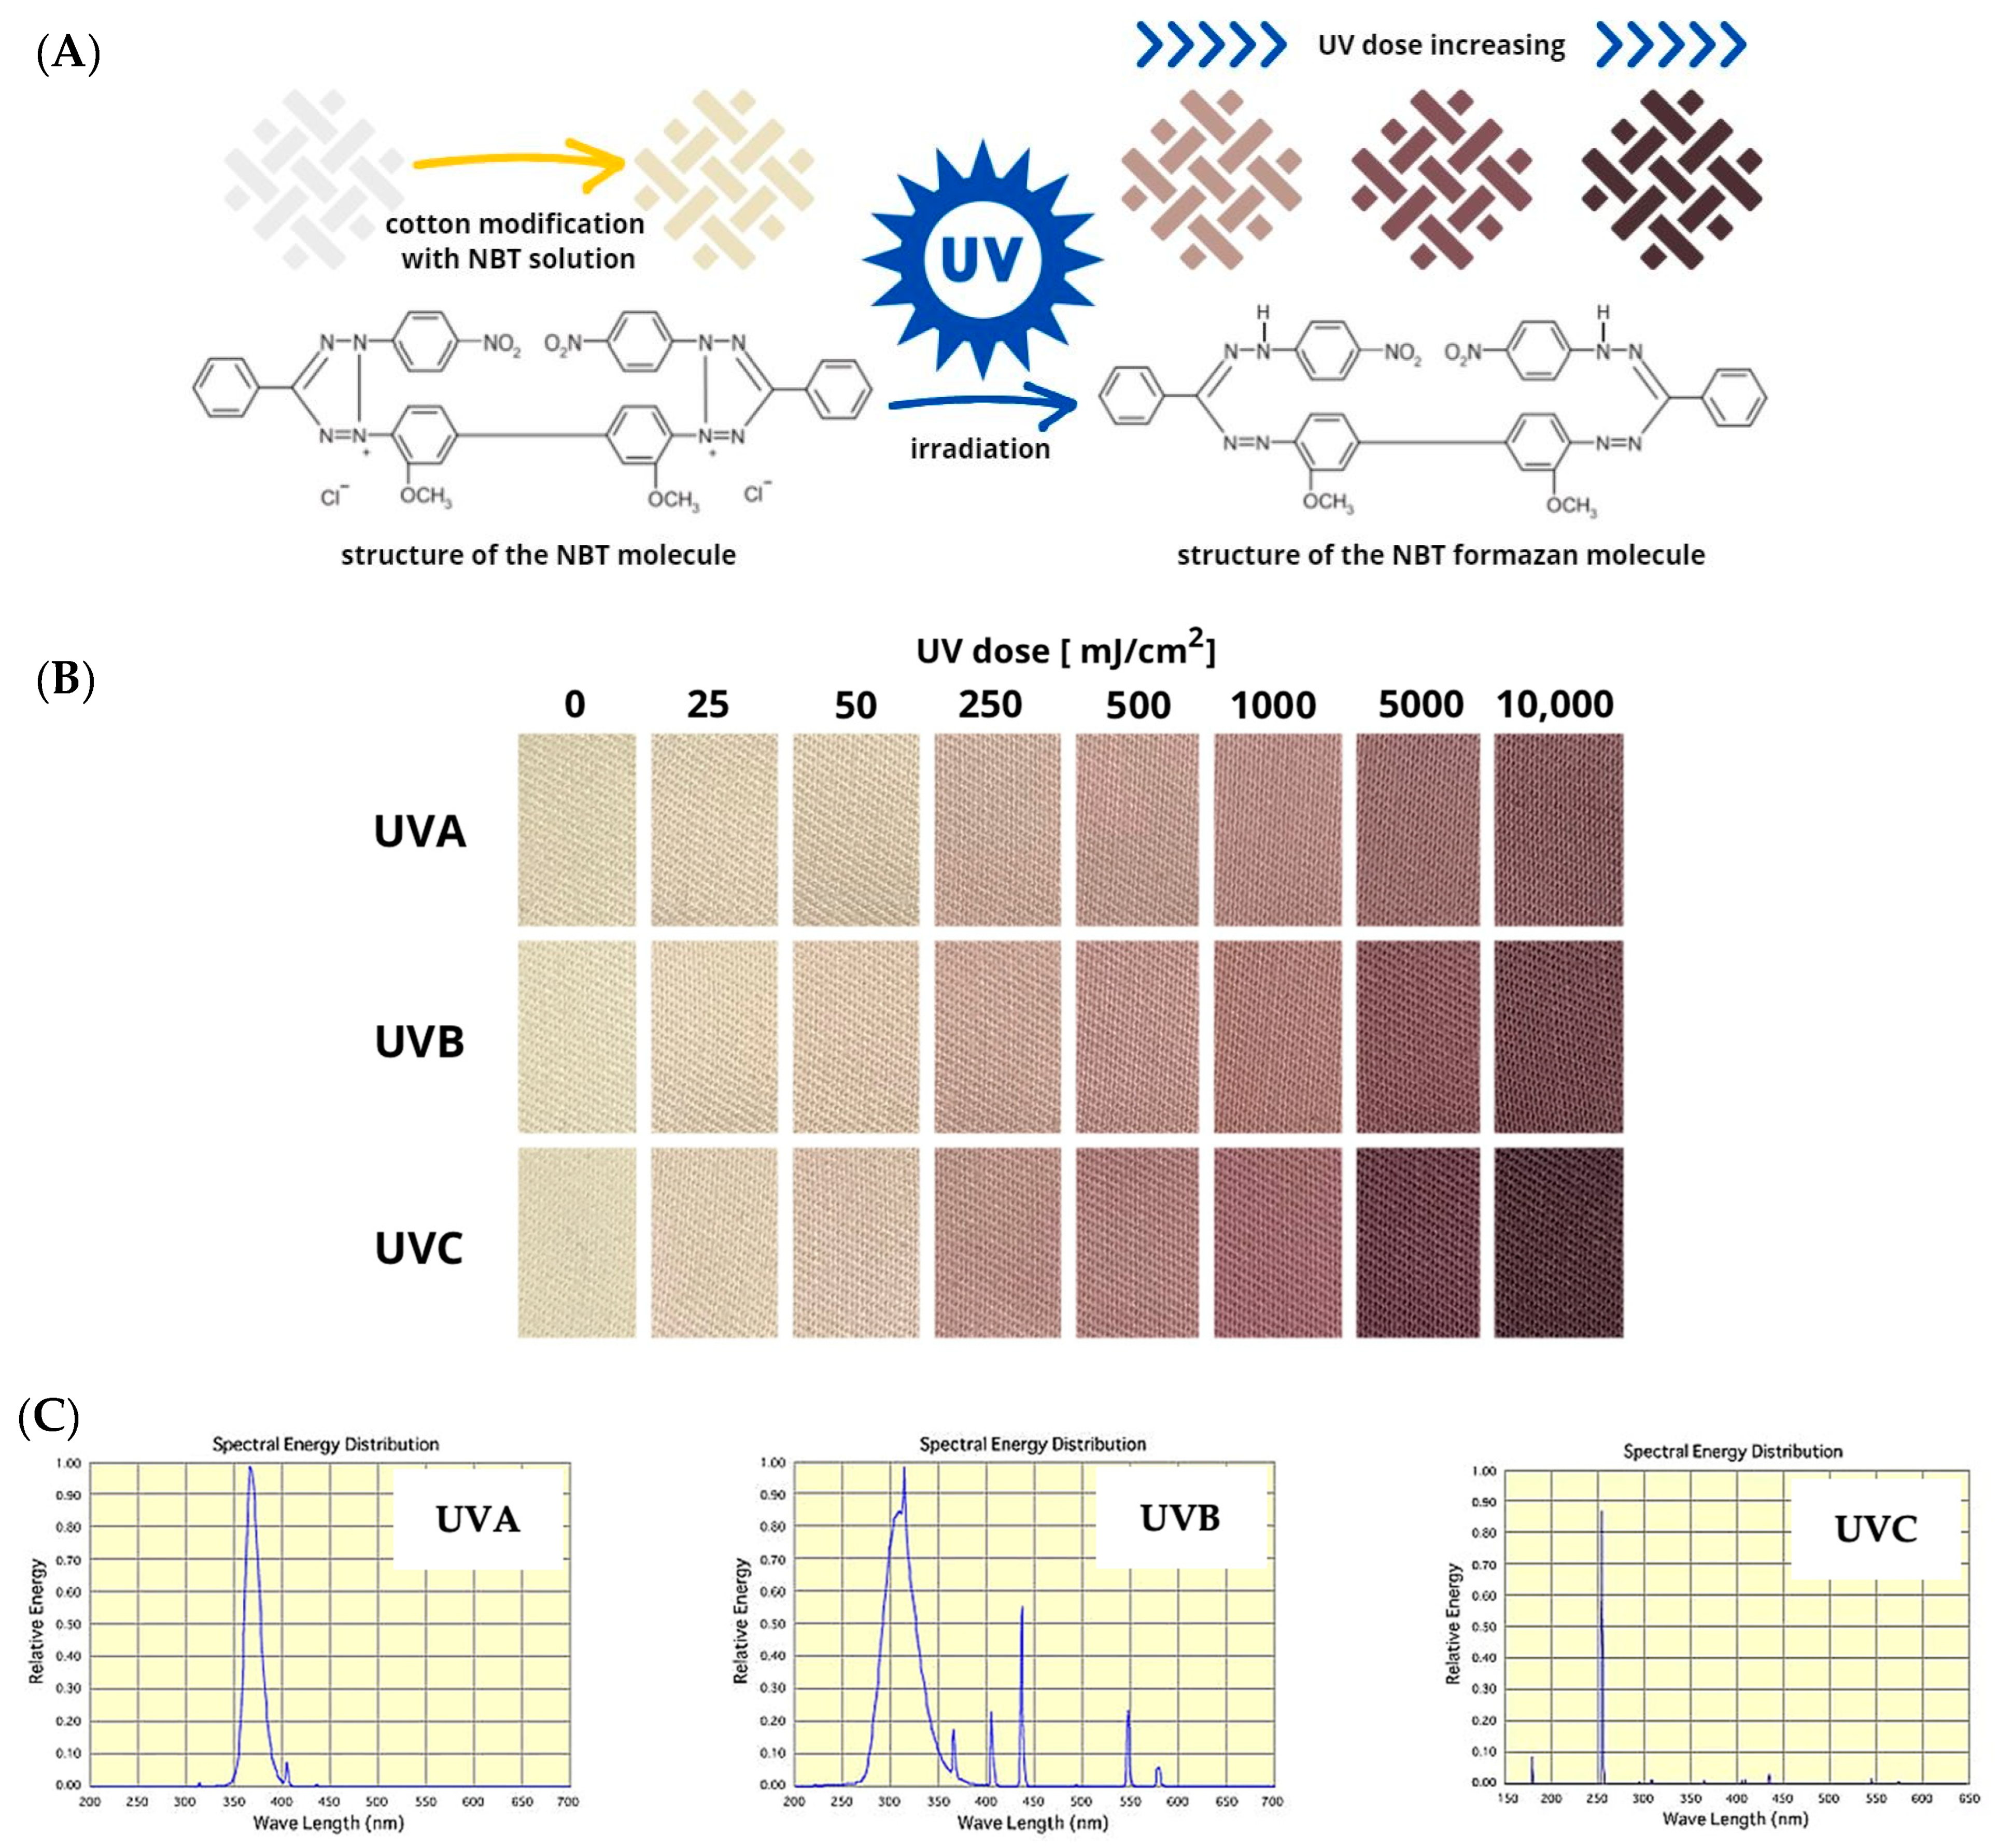
2.1. Preparation of Cotton Fabric Samples
2.2. UV Irradiation
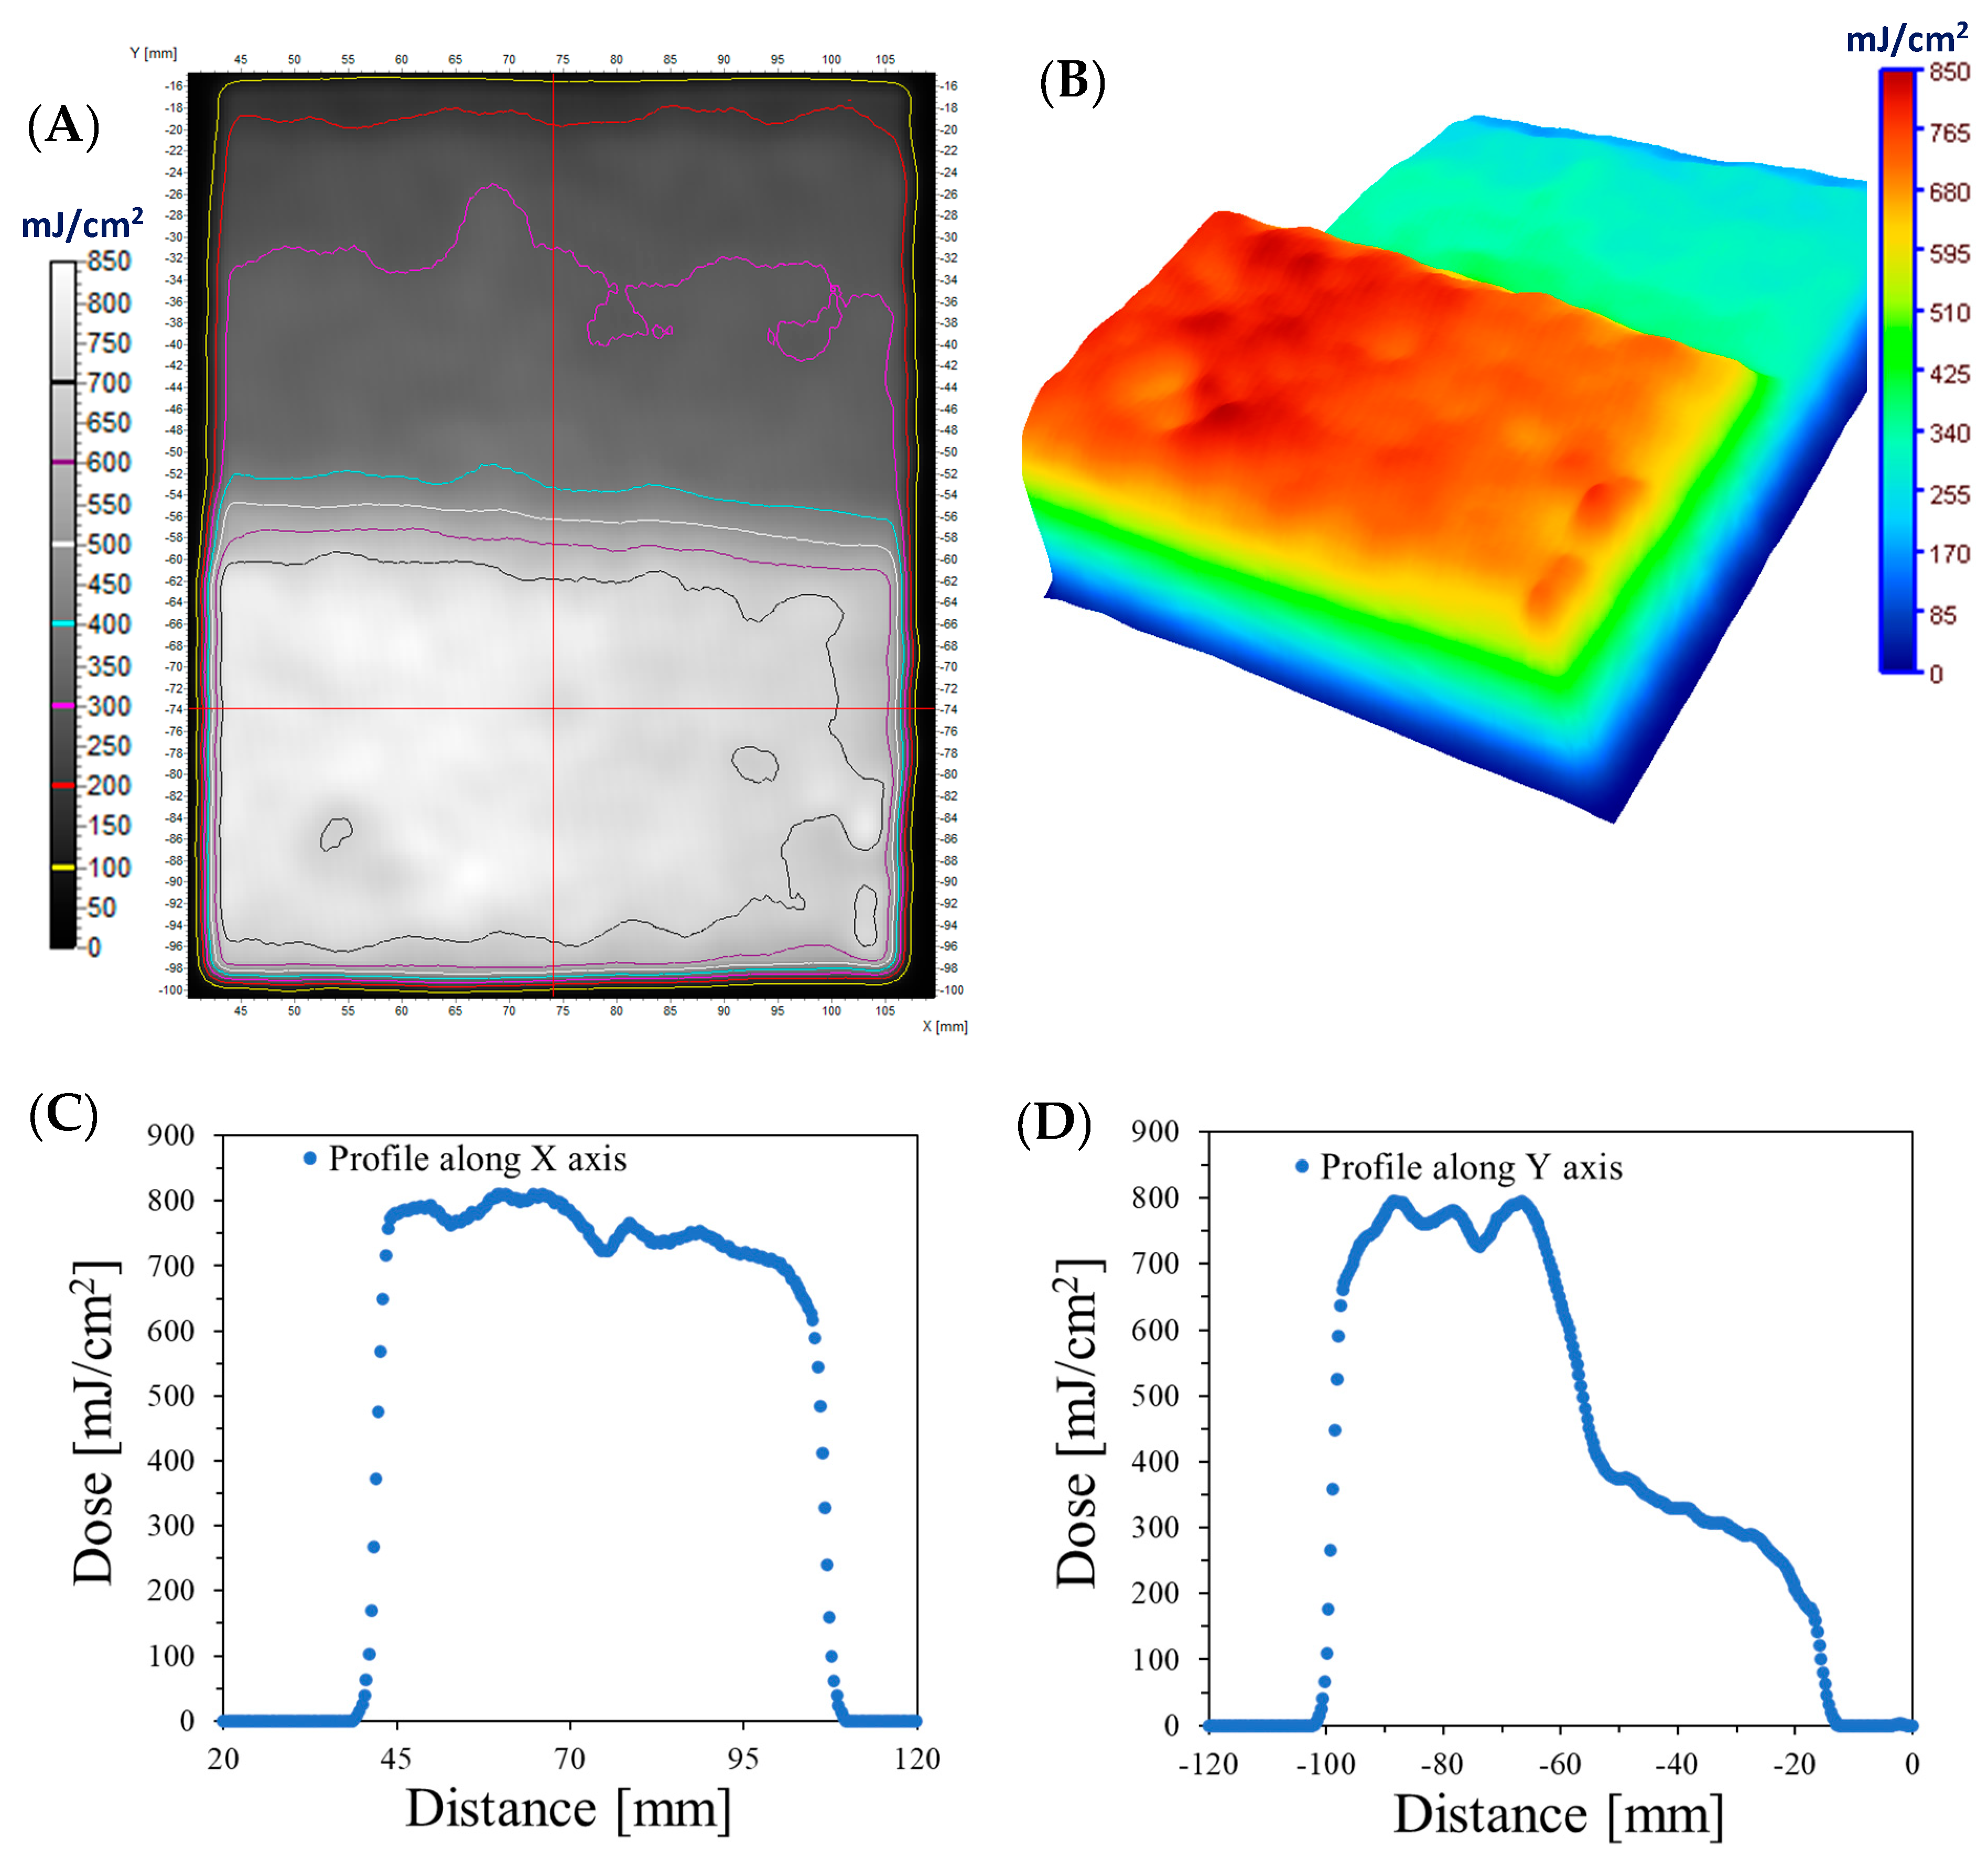
2.3. 2D Scanning
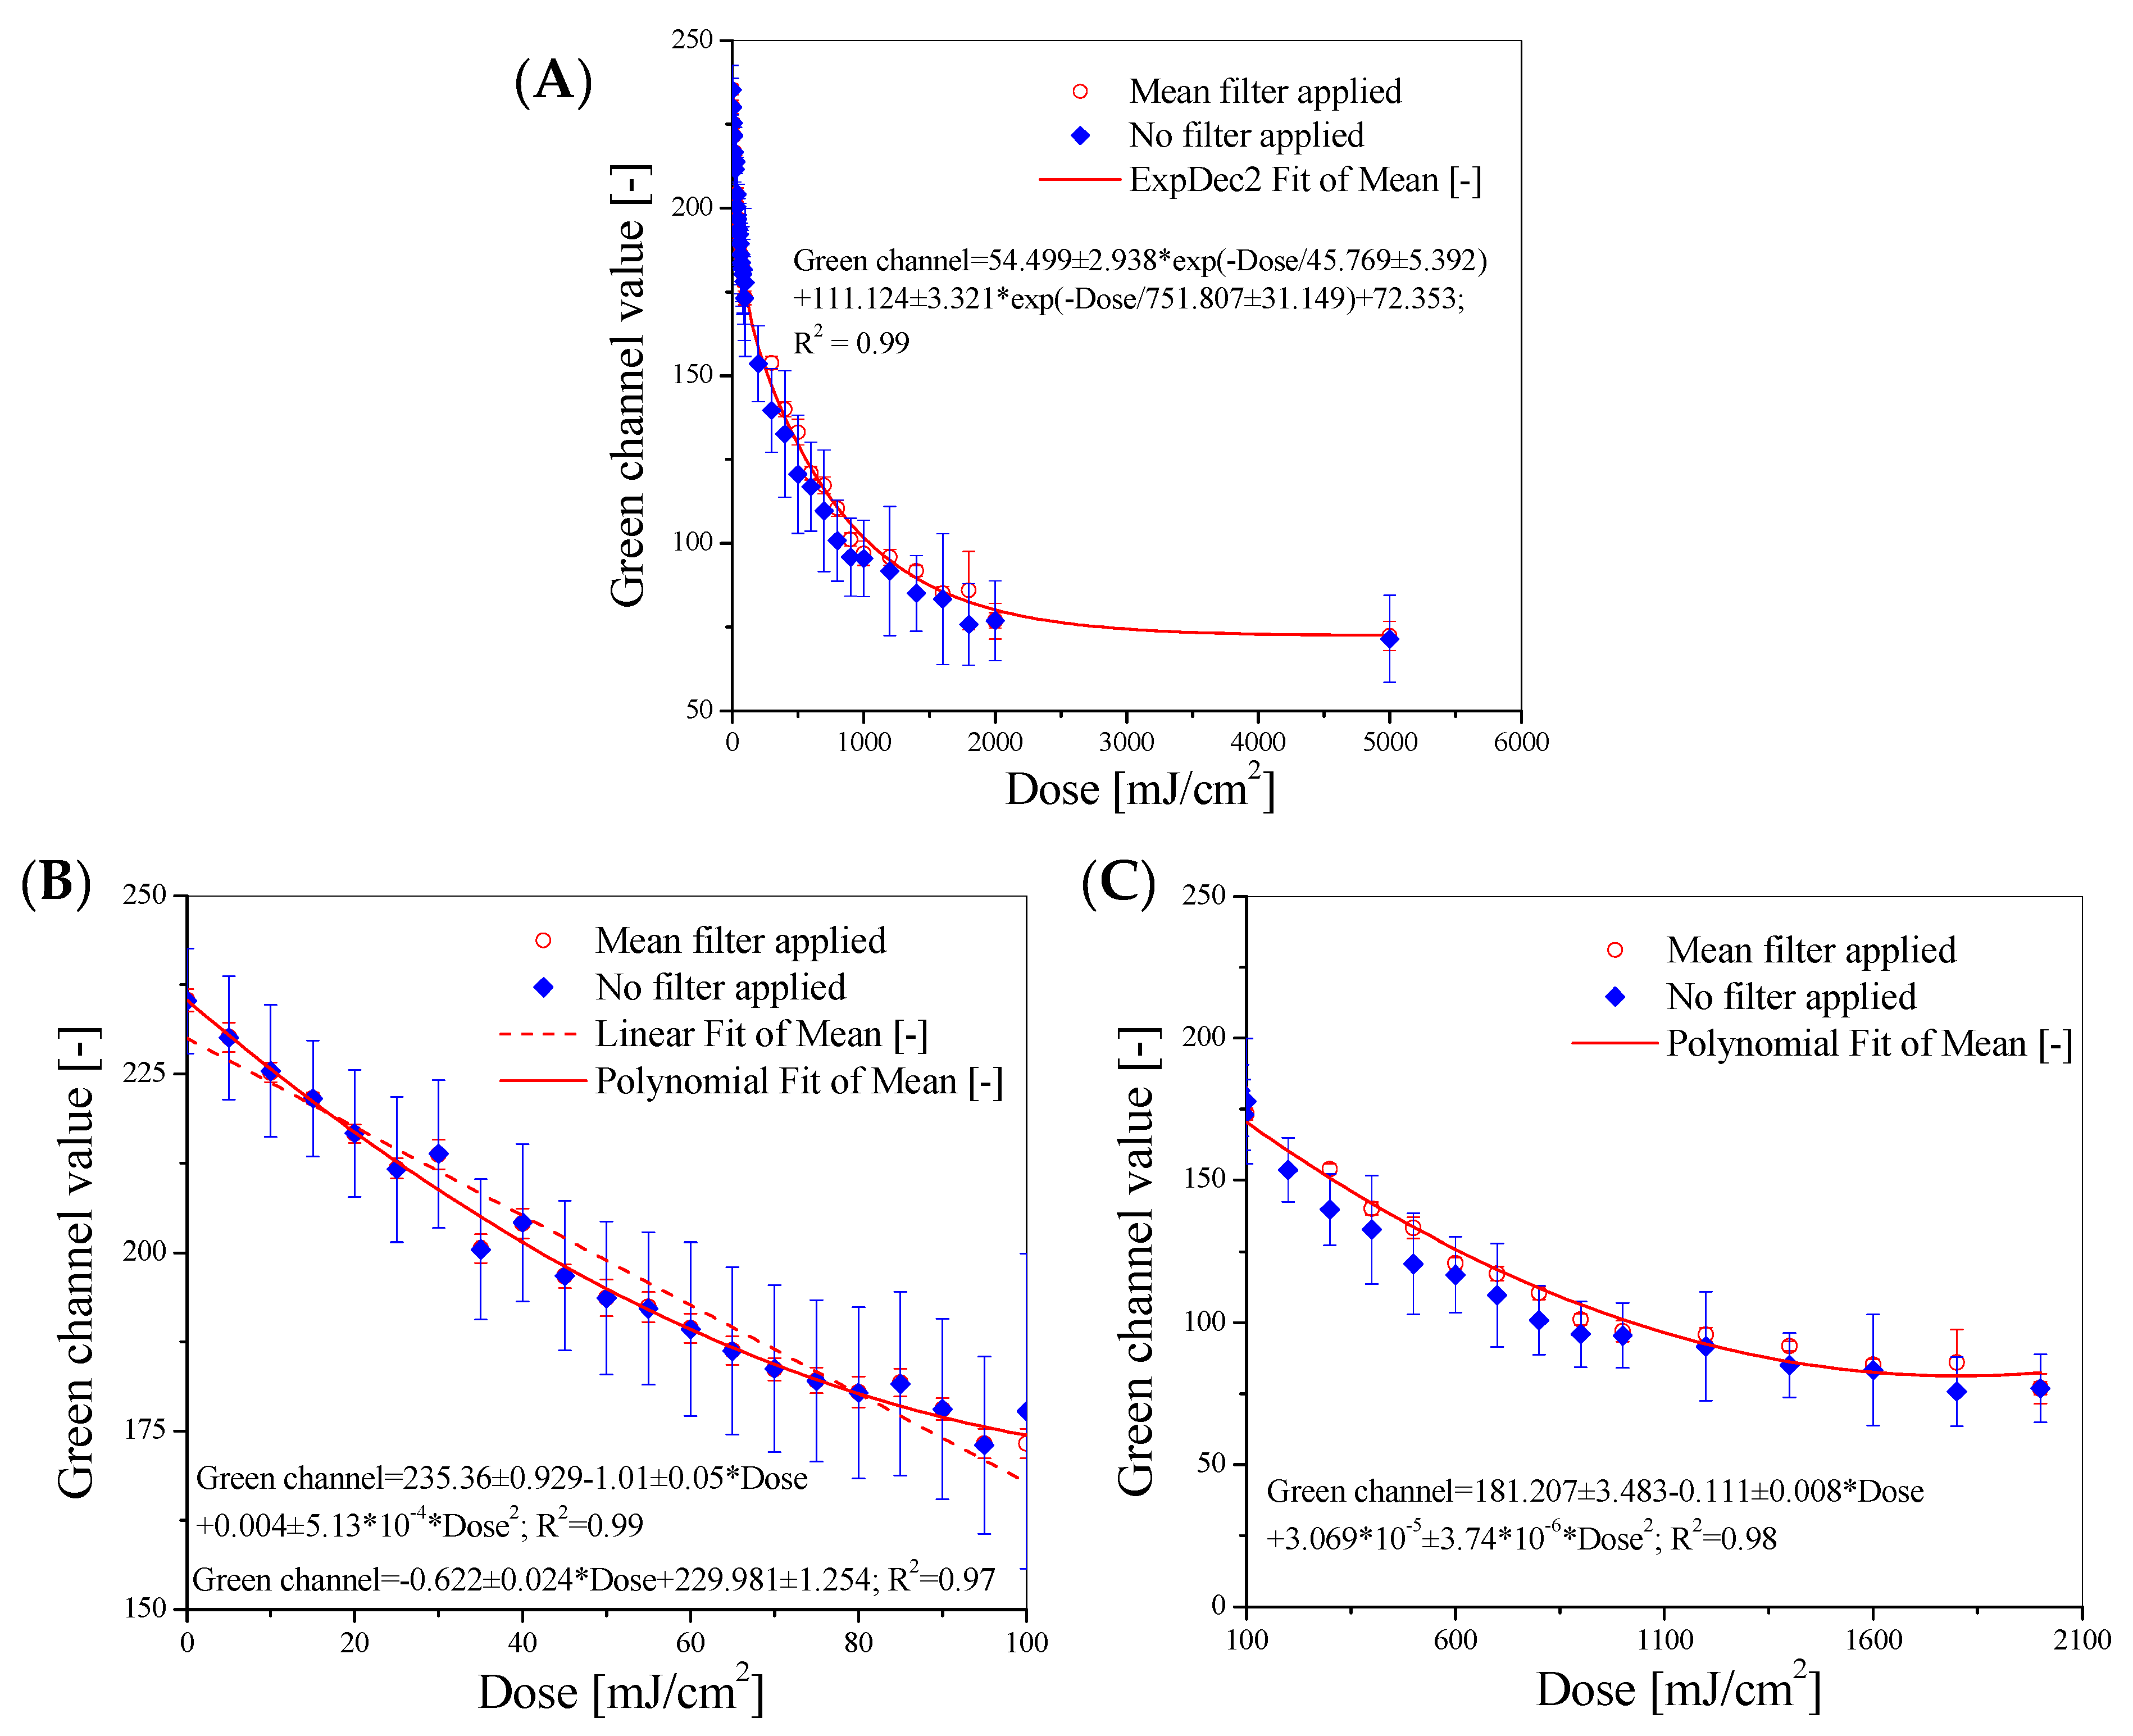
2.4. Data Processing
2.5. Color Coordinate Measurements
2.6. Preparation of Samples for Irradiation with Ionizing Radiation
3. Results and Discussion
3.1. Calibration of Cotton–NBT Dosimeter
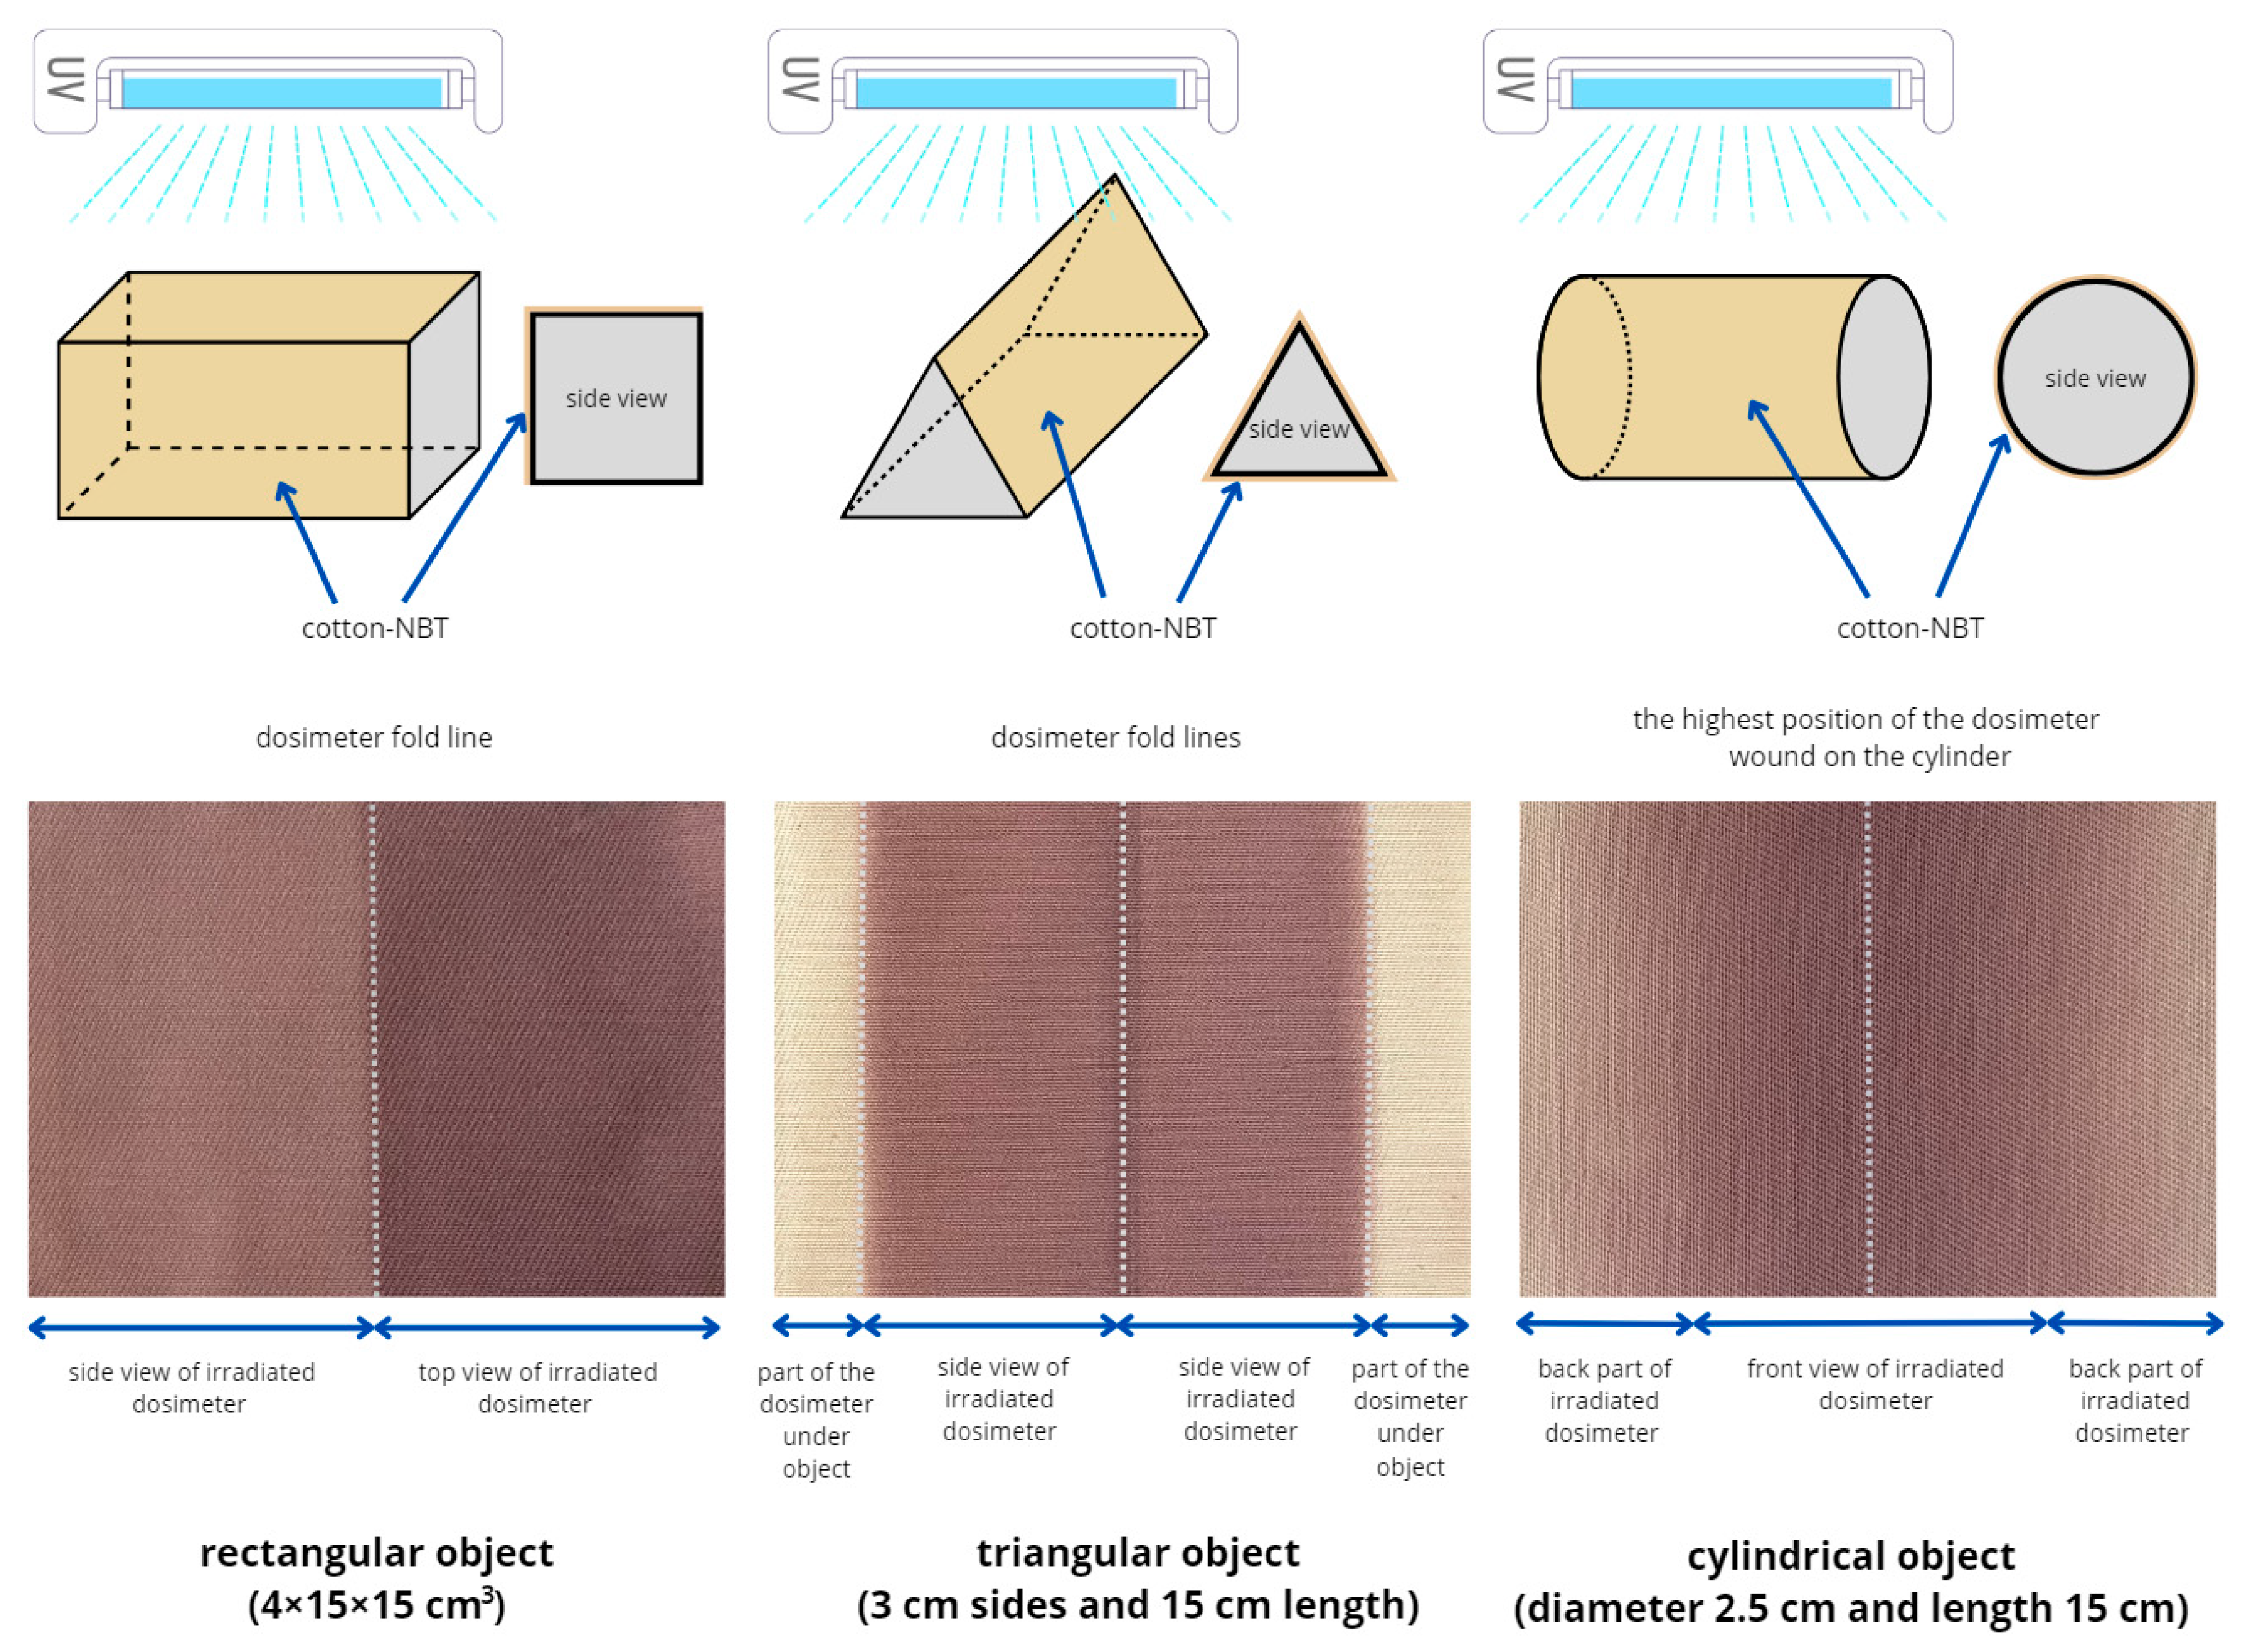
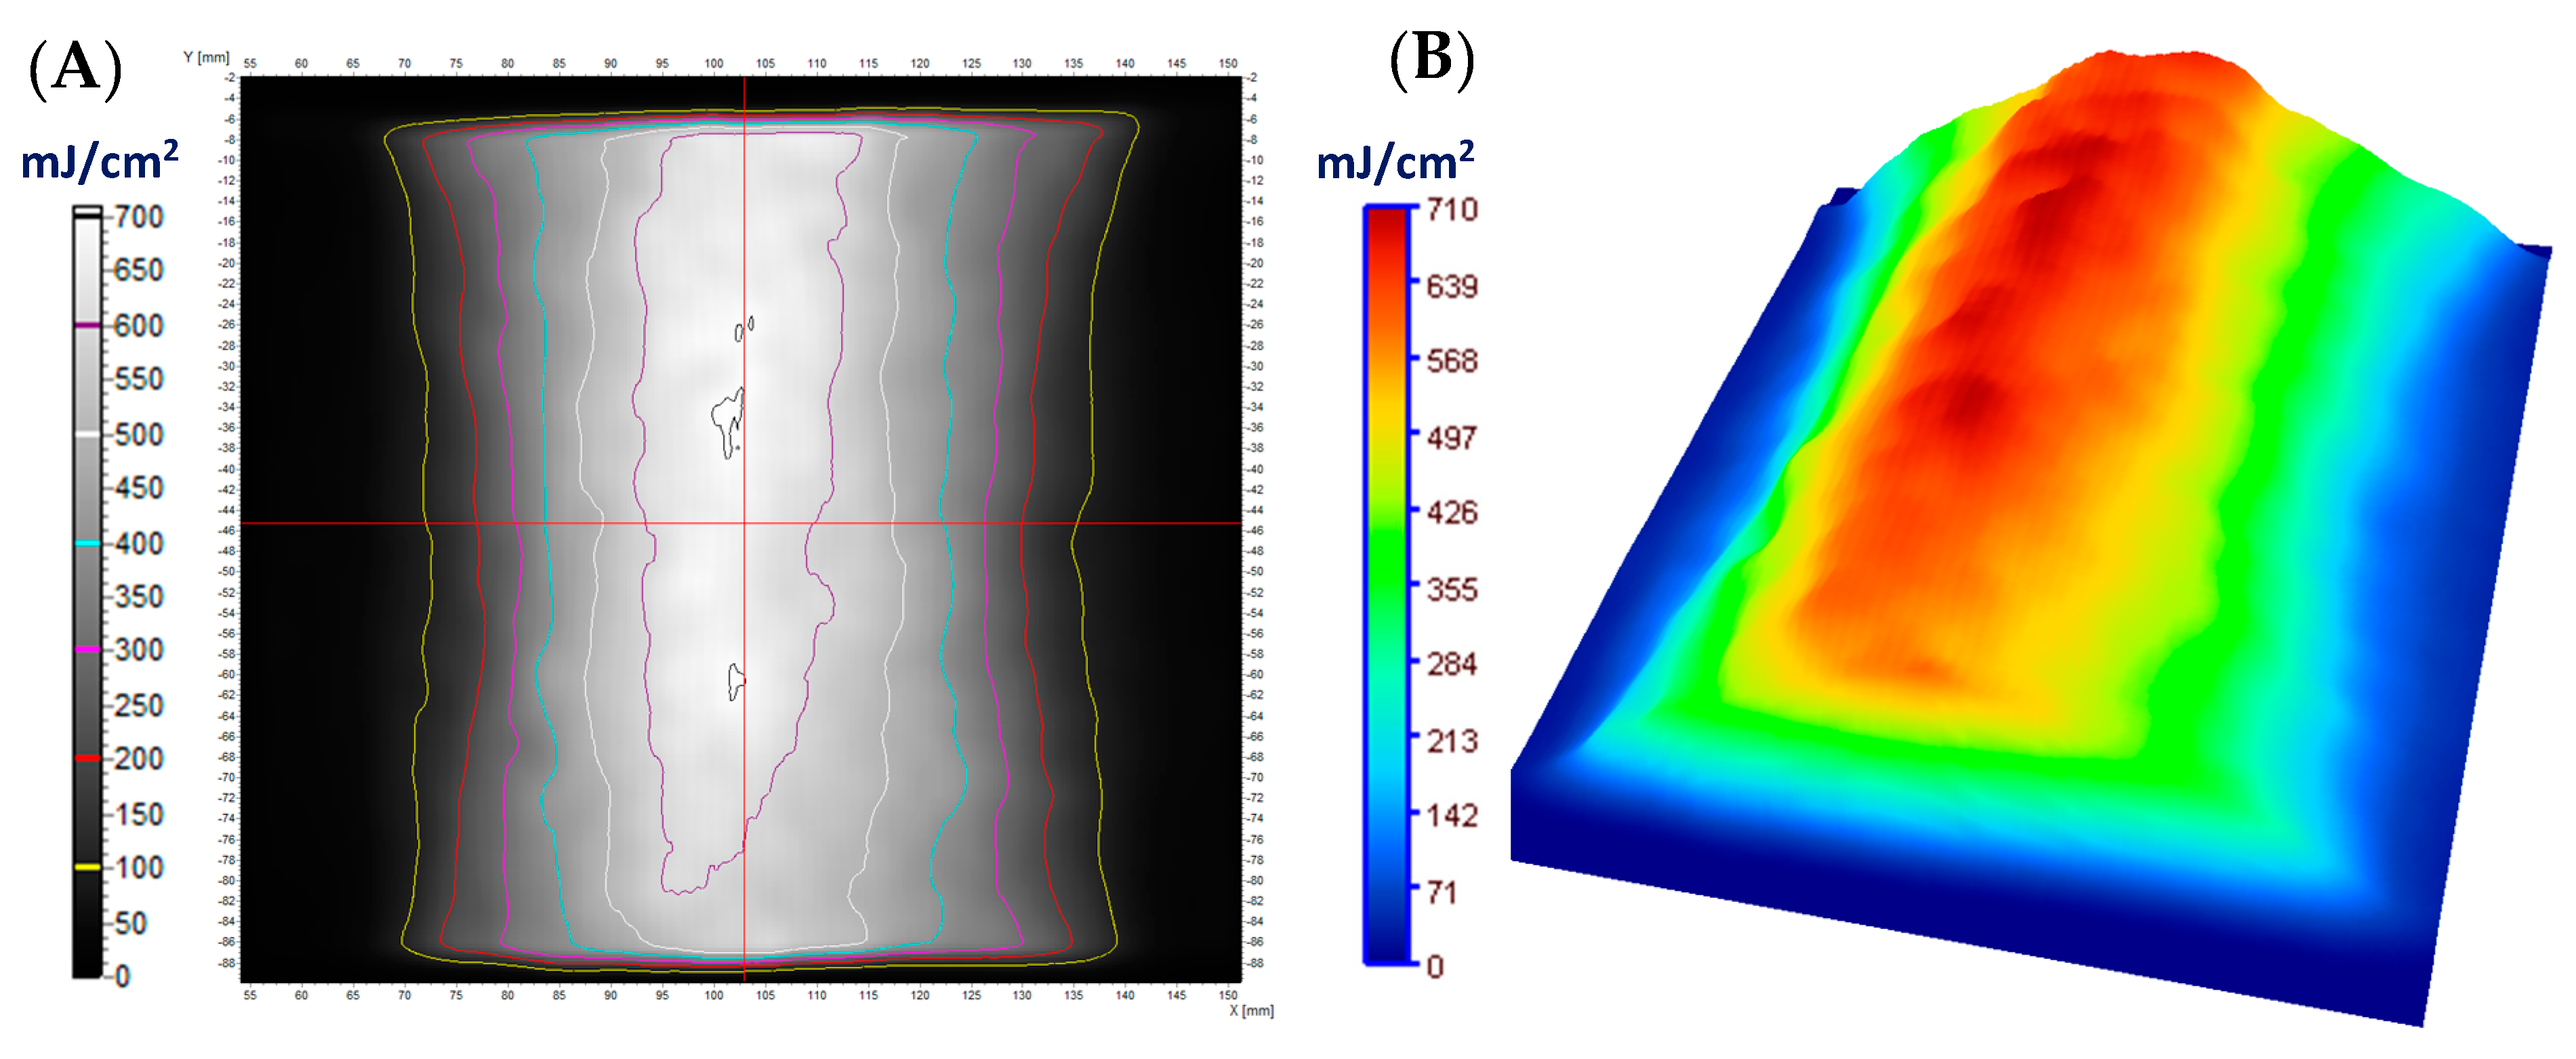
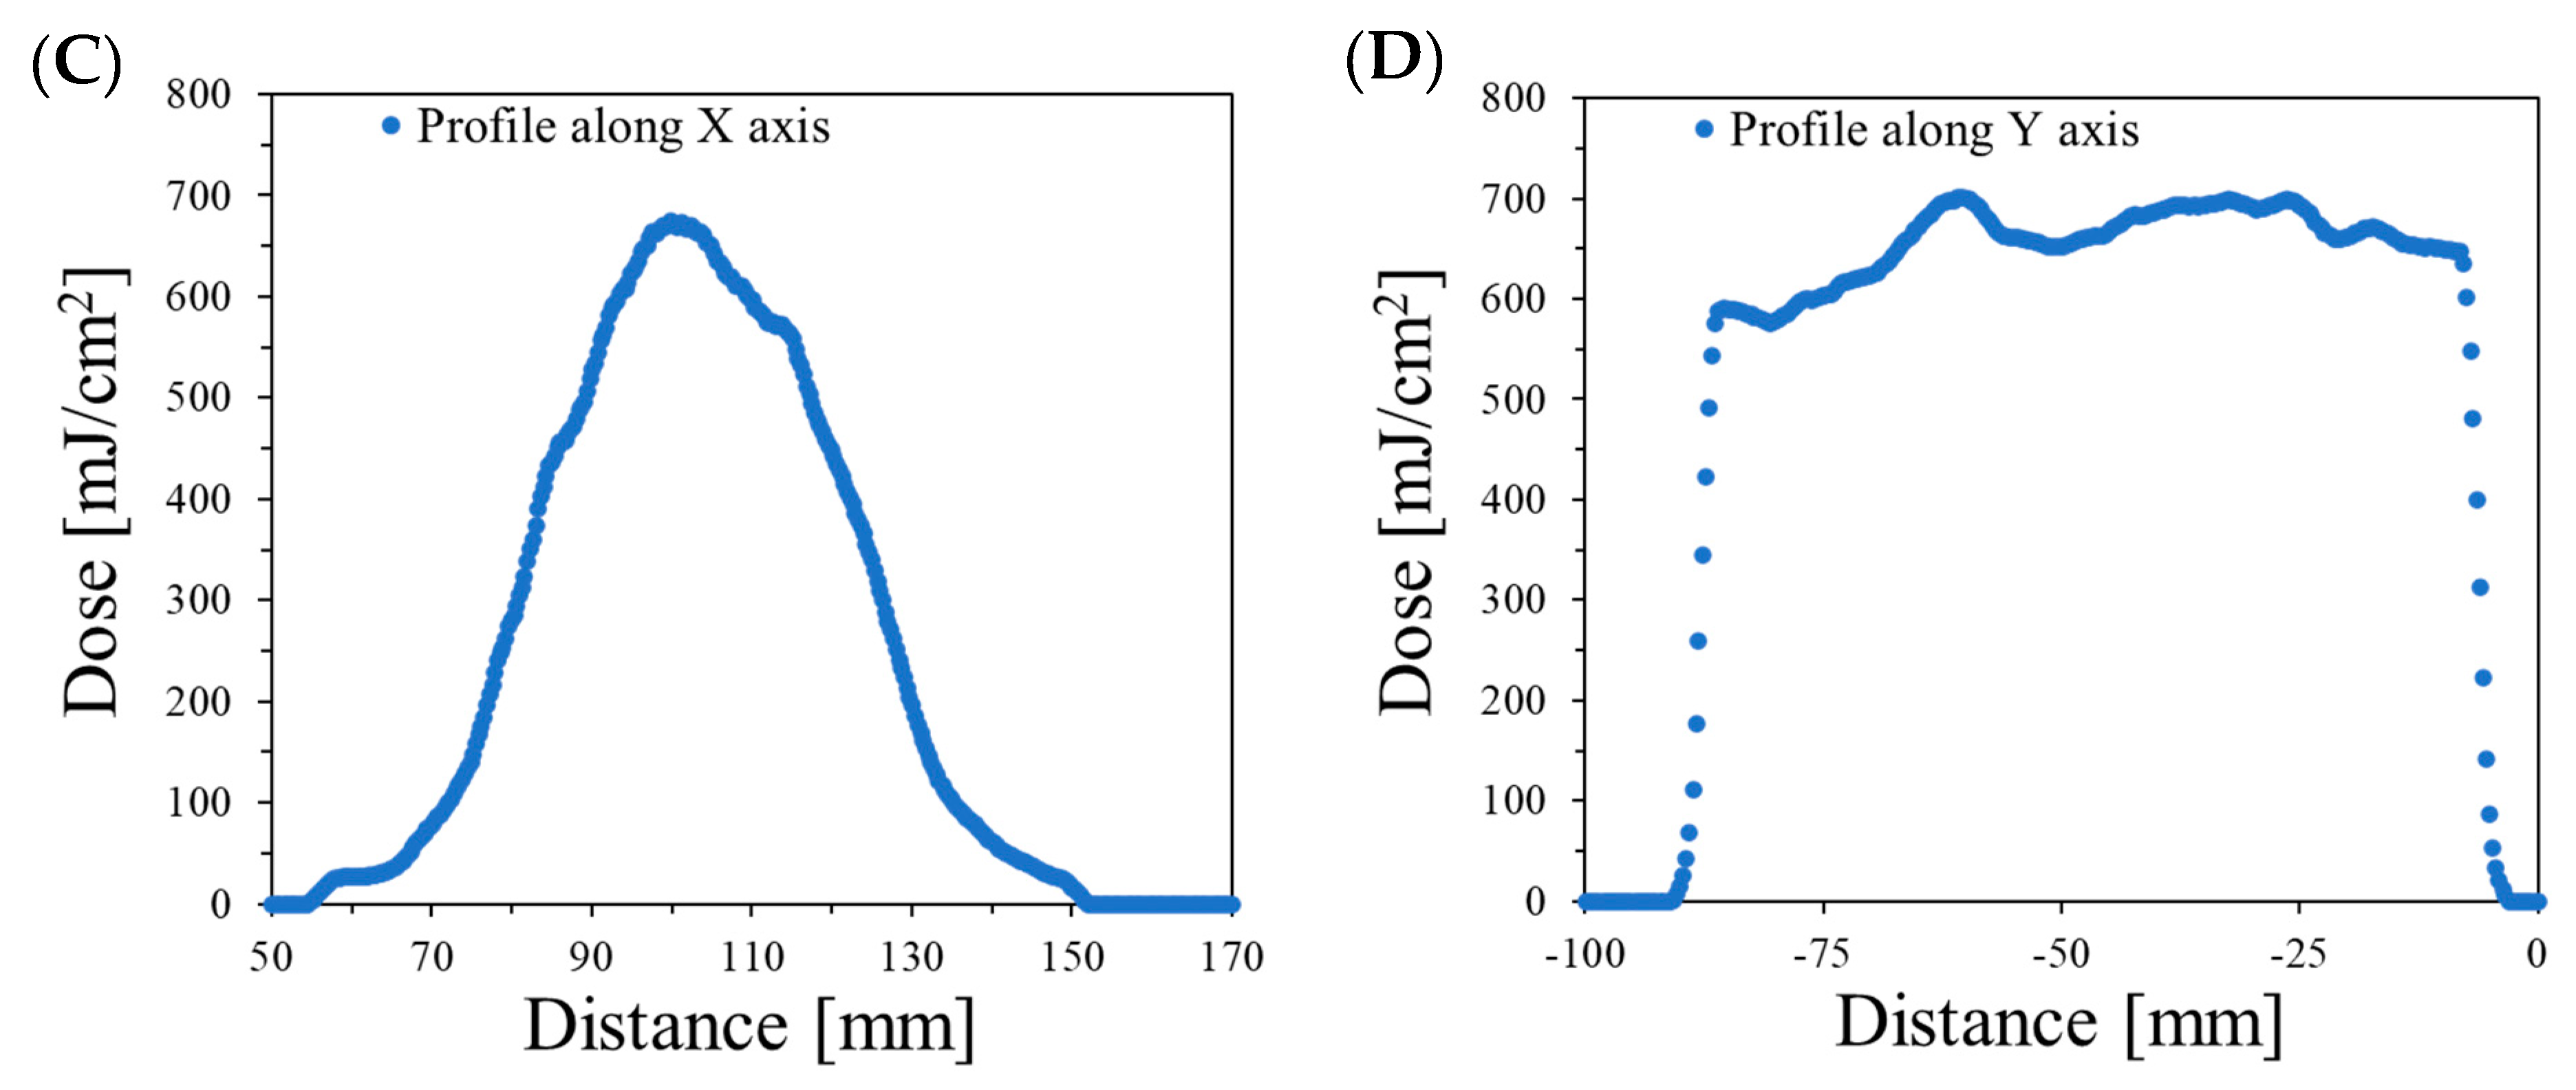
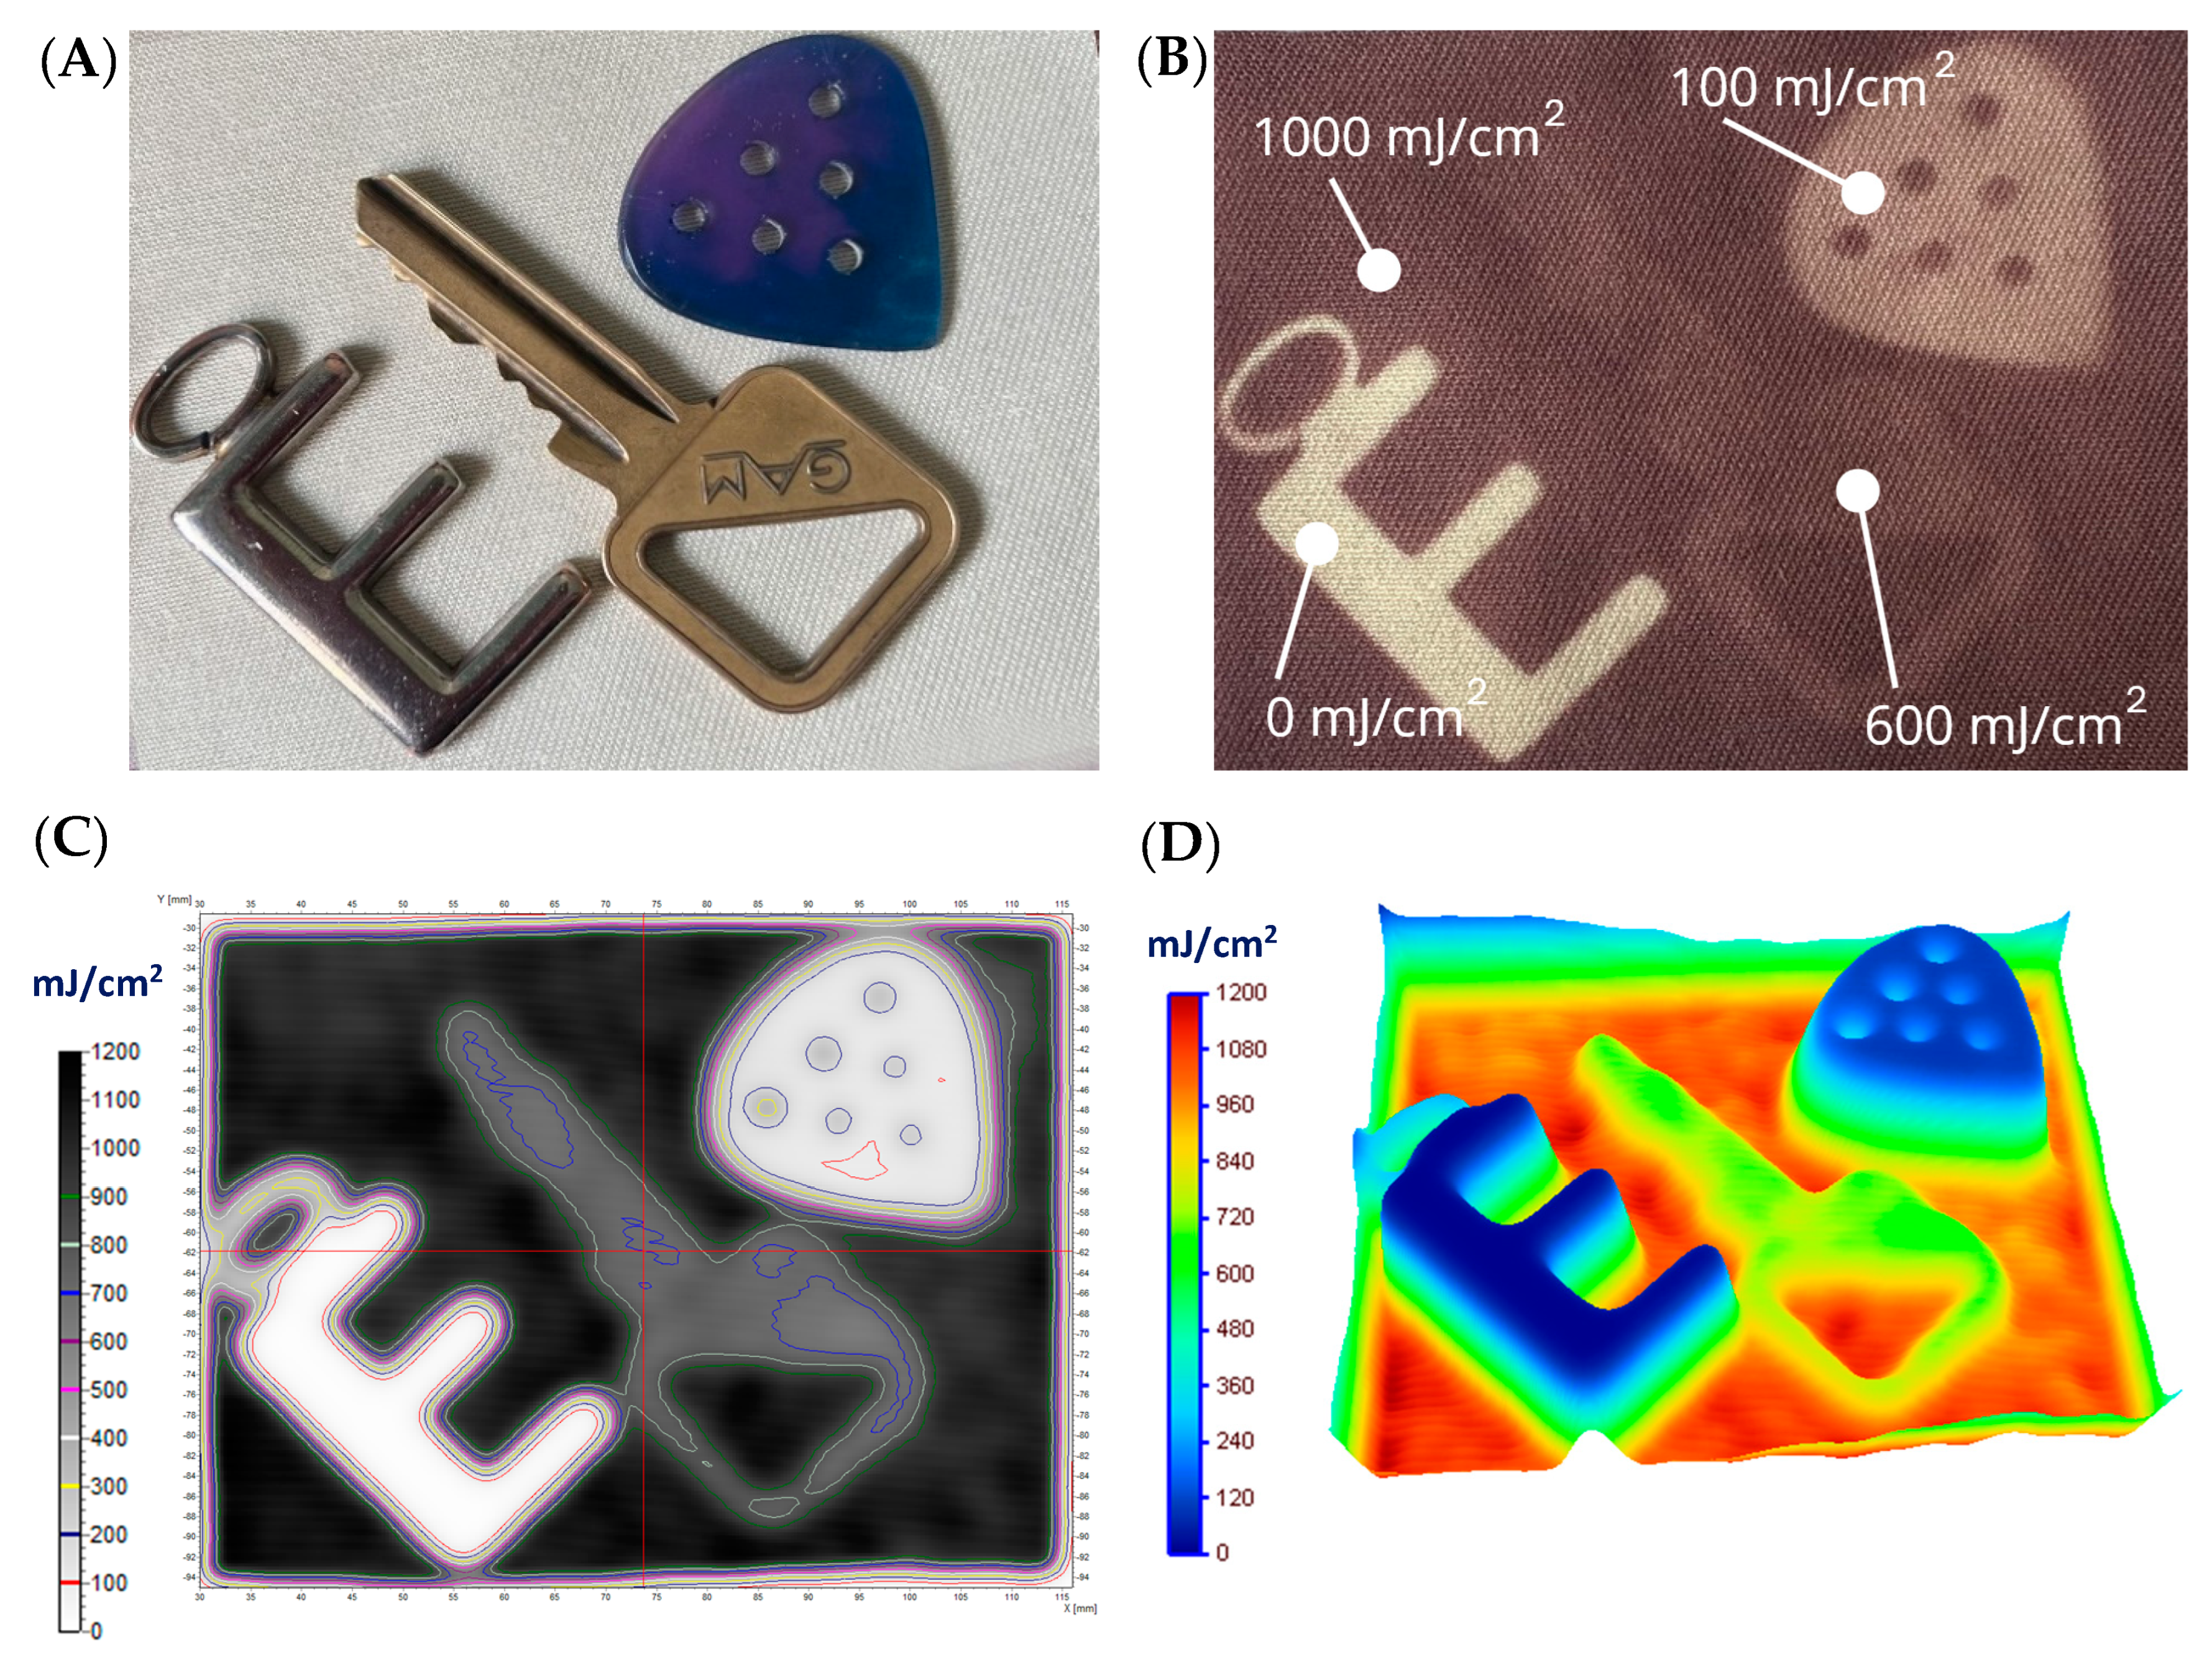
3.2. Application—Rectangular, Cylindrical, and Triangular Objects
3.3. Various Shapes of Irradiation
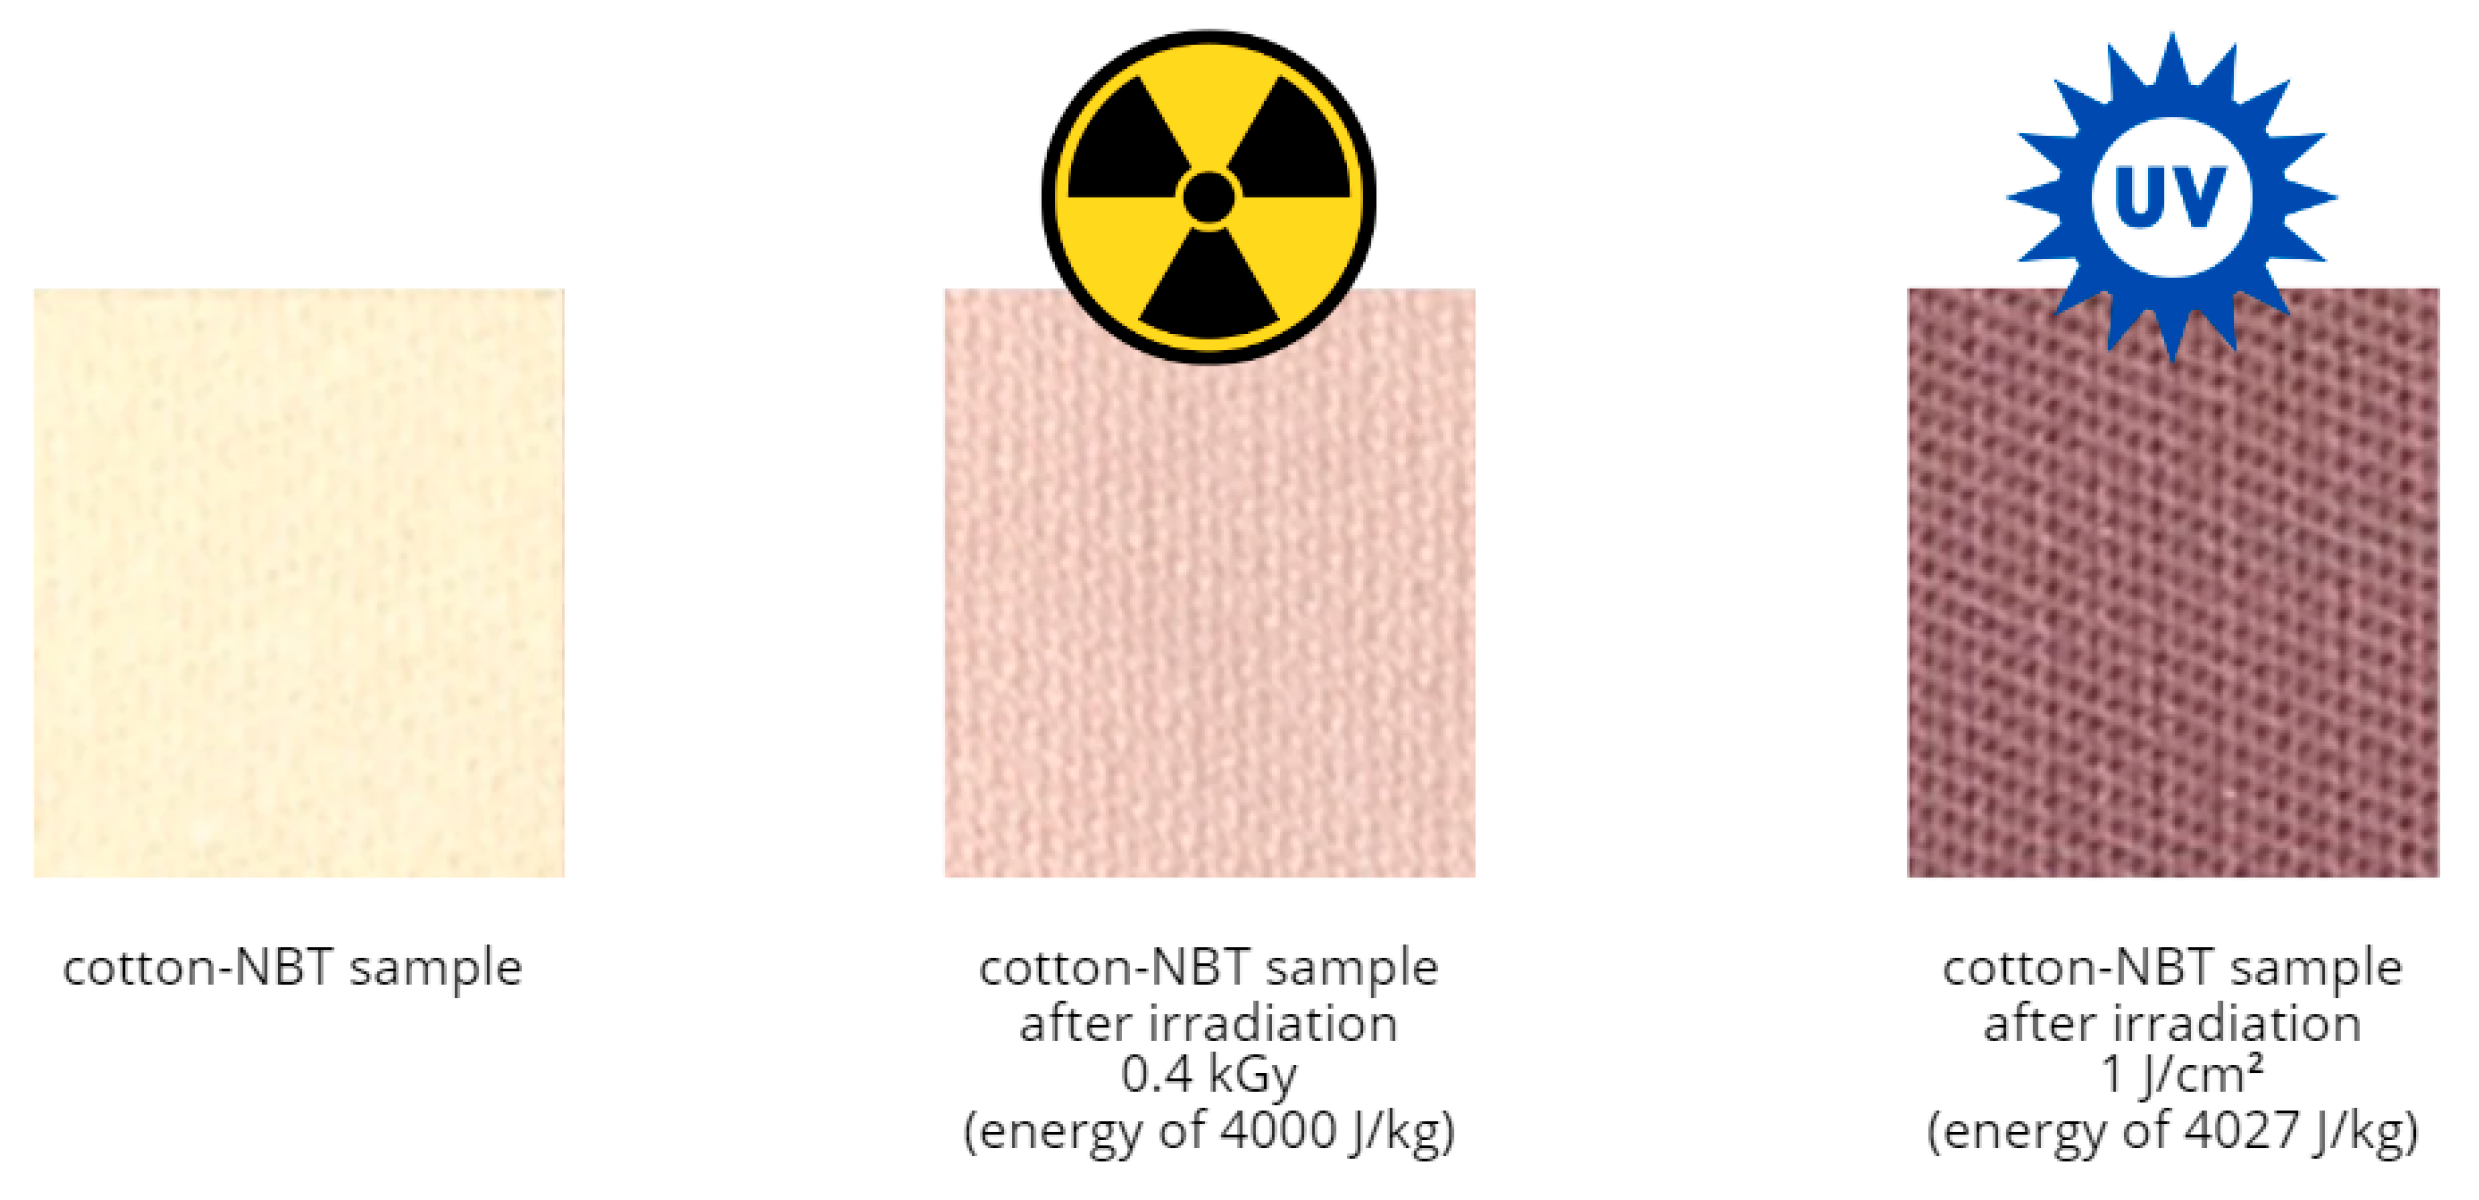
3.4. Cotton–NBT Dosimeters for UVC vs. Ionizing Radiation—Discussion
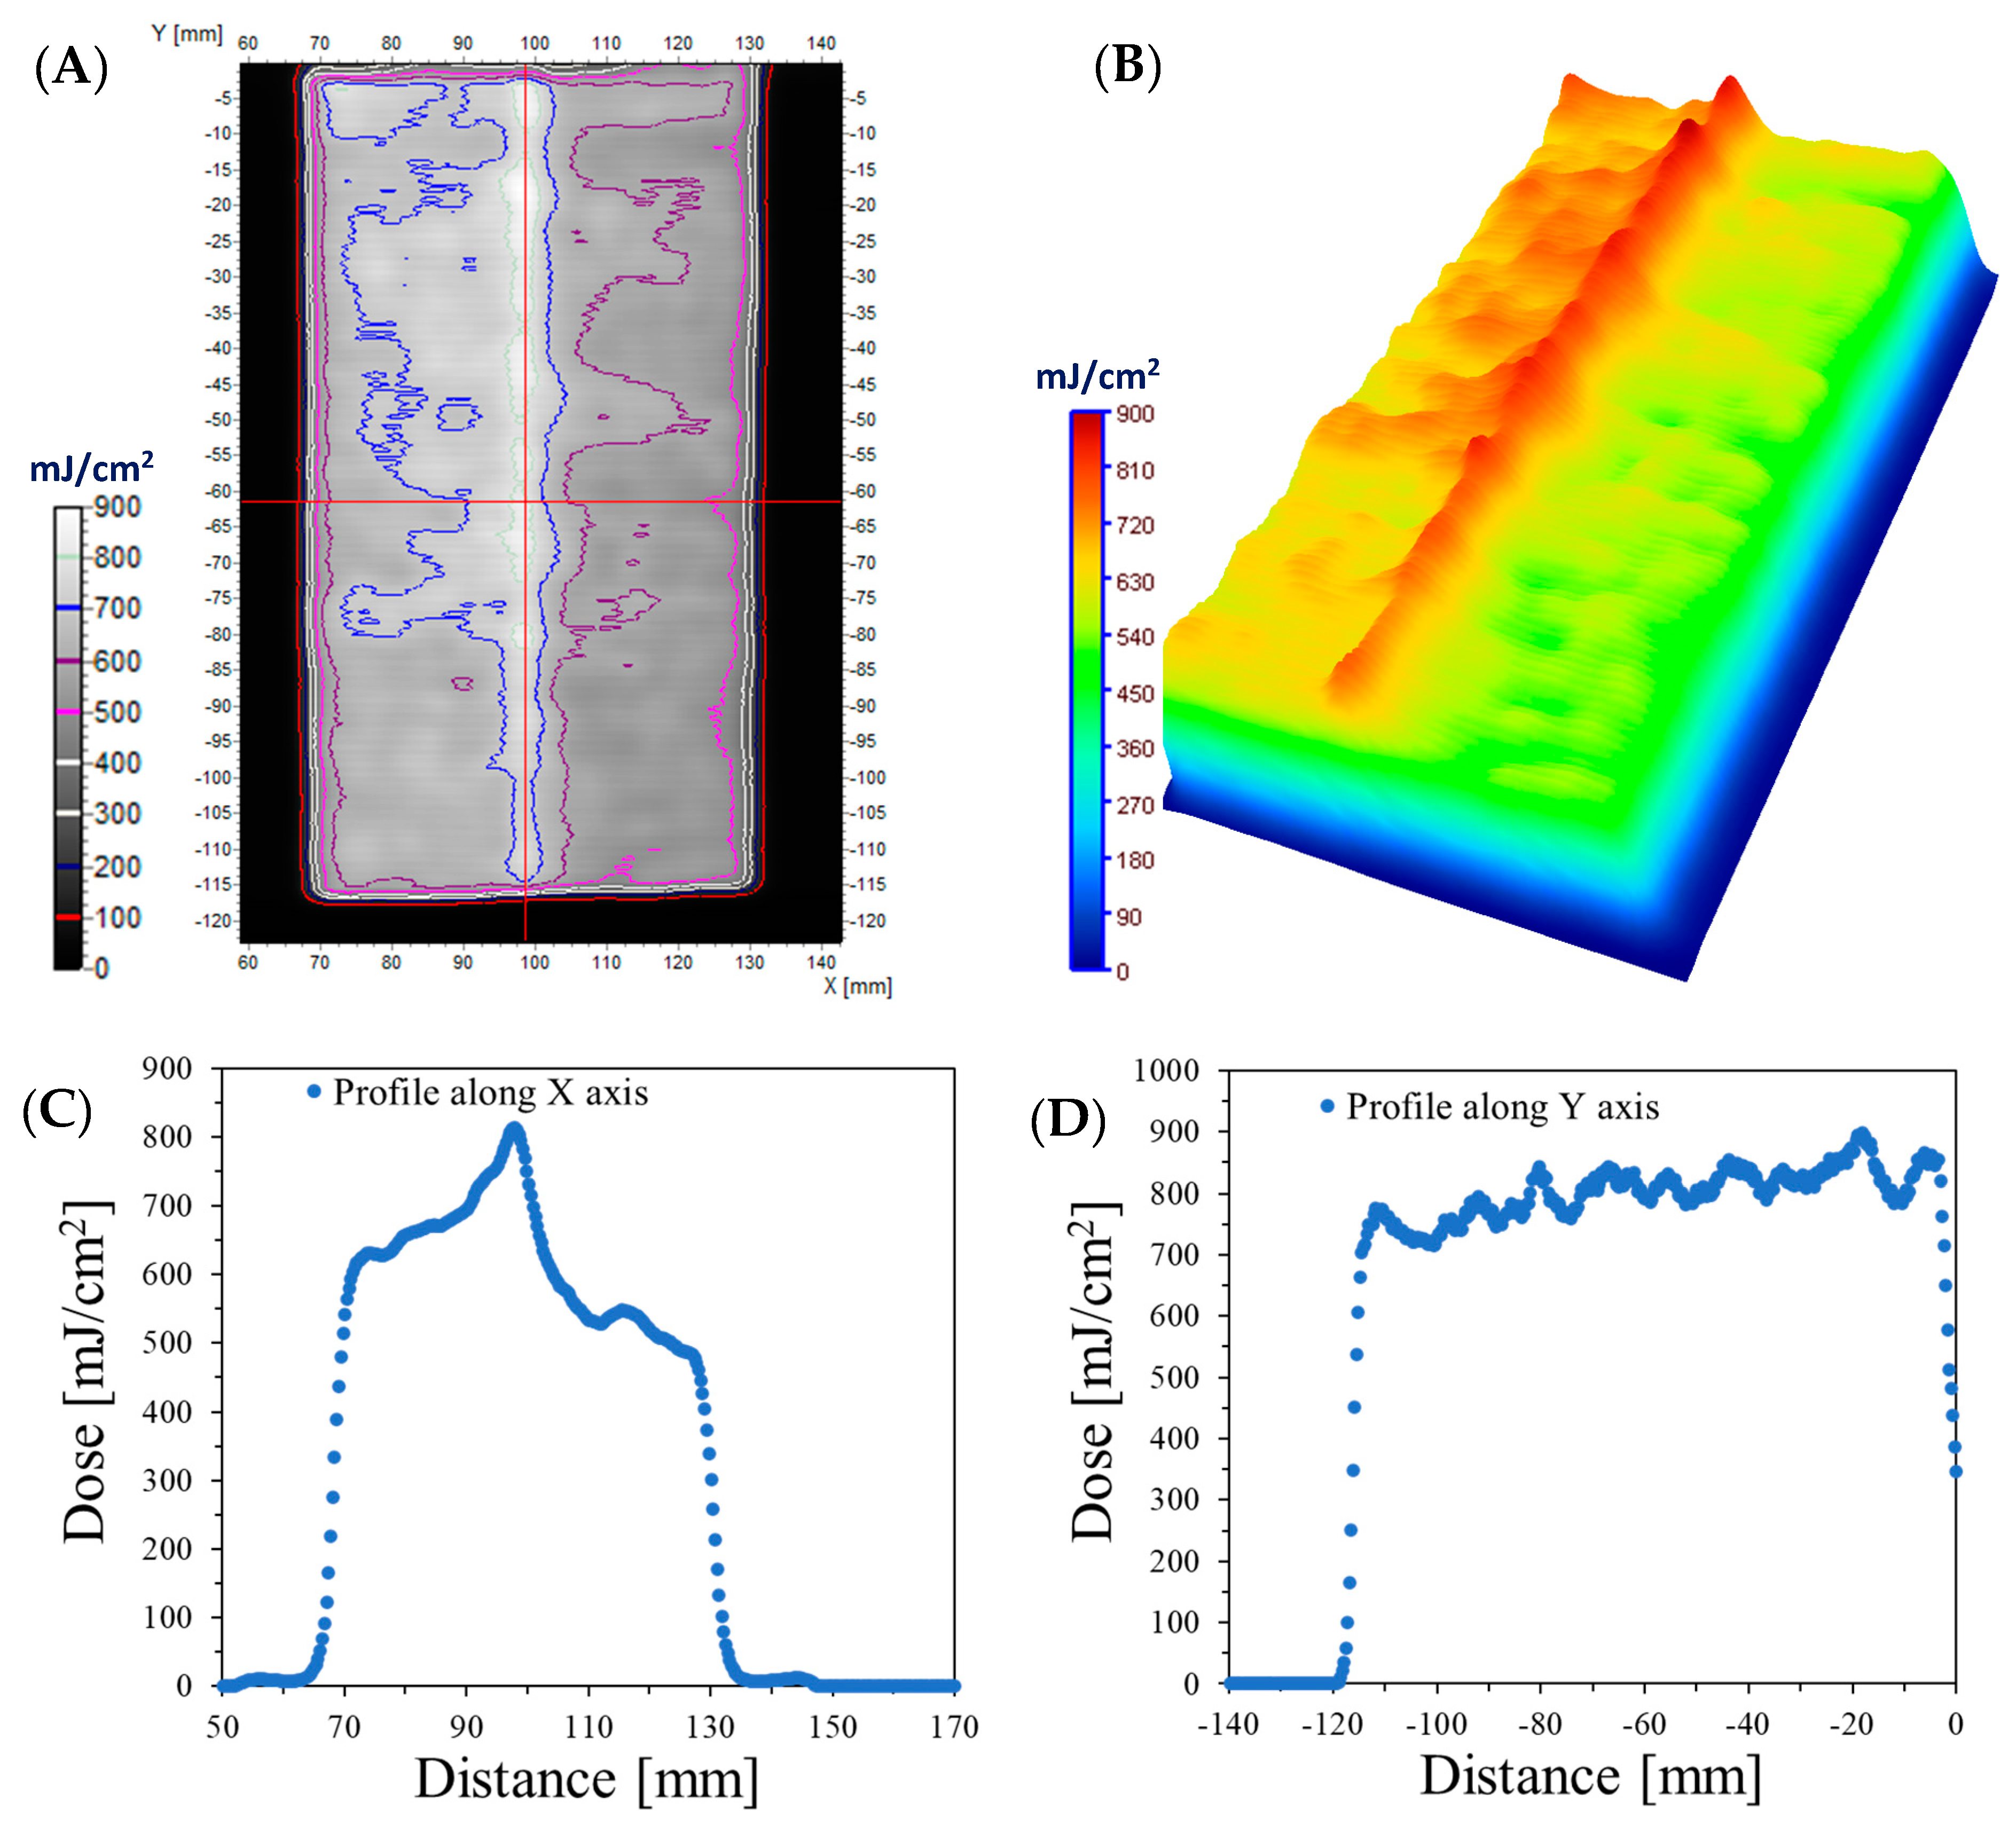
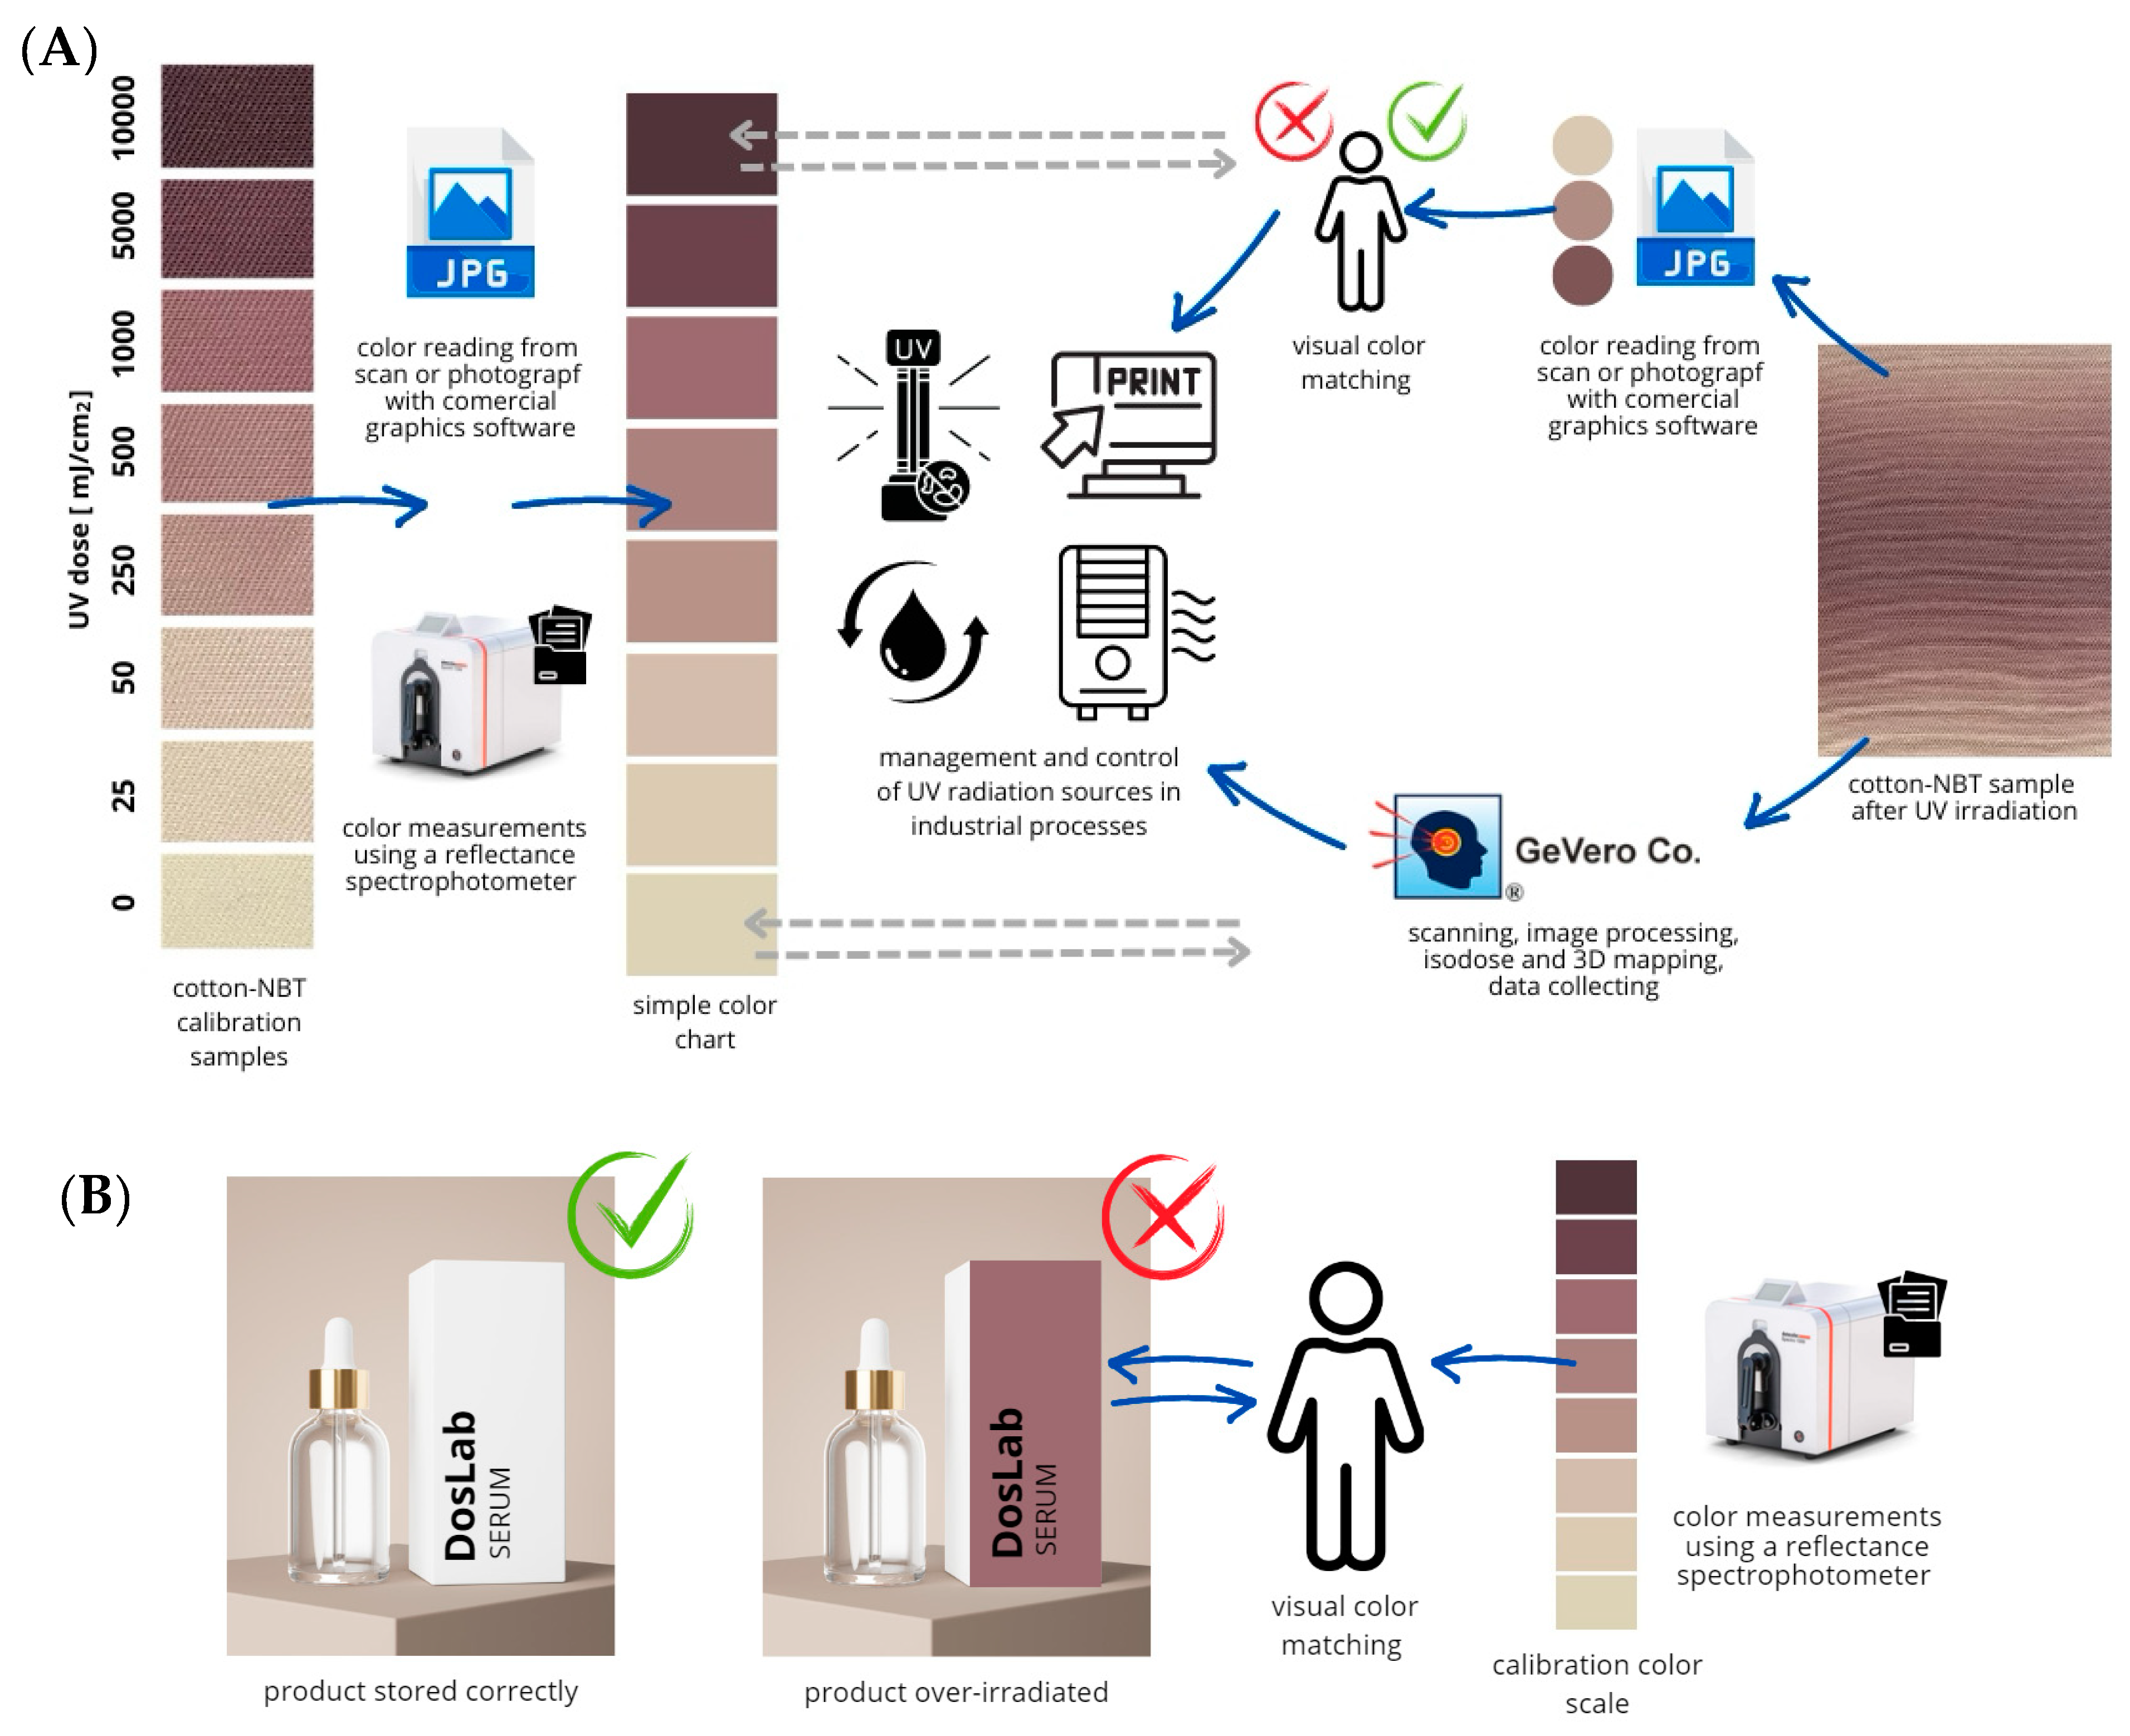
3.5. Application of the Developed Dosimeters
4. Conclusions
Author Contributions
Funding
Institutional Review Board Statement
Informed Consent Statement
Data Availability Statement
Conflicts of Interest
References
- Mendoza, K.L.; Ortega, A.; Kim, N.S. Optimization of UV LED-Curable Ink for Reverse-Offset Roll-to-Plate (RO-R2P) Printing. J. Electron. Mater. 2015, 44, 784–791. [Google Scholar] [CrossRef]
- Zhao, P.; He, Y.; Trindade, G.F.; Baumers, M.; Irvine, D.J.; Hague, R.J.M.; Ashcroft, I.A.; Wildman, R.D. Modelling the influence of UV curing strategies for optimisation of inkjet based 3D printing. Mater. Des. 2021, 208, 109889. [Google Scholar] [CrossRef]
- Oguz, A.M.; Ozcan, M. Oktav, Examination of the Optimum Use of UV Lacquers and Inks in the Offset Printing. Asian J. Chem. 2012, 24, 5133–5136. [Google Scholar]
- Bahria, H.; Erbil, Y. UV technology for use in textile dyeing and printing: Photocured applications. Dye. Pigment. 2016, 134, 442–447. [Google Scholar] [CrossRef]
- Unal, F.; Avinc, O.; Yavas, A.; Eren, H.A.; Eren, S. Contribution of UV Technology to Sustainable Textile Production and Design. In Sustainability in the Textile and Apparel Industries. Sustainable Textiles: Production, Processing, Manufacturing & Chemistry; Muthu, S., Gardetti, M., Eds.; Springer: Cham, Germany, 2020. [Google Scholar] [CrossRef]
- Meechan, P.J.; Wilson, C. Use of Ultraviolet Lights in Biological Safety Cabinets: A Contrarian View. Appl. Biosaf. 2006, 11, 222–227. [Google Scholar] [CrossRef]
- Paidalwar, A.A.; Khedikar, I.P. Overview of Water Disinfection by UV Technology–A Review. IJSTE Int. J. Sci. Technol. Eng. 2016, 2, 213–219. [Google Scholar]
- Roy, A.; Mishra, C.; Jain, S.; Solanki, N. A review of general and modern methods of air purification. J. Therm. Eng. 2019, 5, 22–28. [Google Scholar] [CrossRef]
- Barros, N.M.; Sbroglio, L.L.; Buffara, M.O.; Baka, J.L.C.S.; Pessoa, A.S.; Azulay-Abulafia, L. Phototherapy. An. Bras. Dermatol. 2021, 96, 397–407. [Google Scholar] [CrossRef]
- Orlova, T.; Terenetskaya, I. UV Phototherapy: A New Look at the UV Sources and Doses. Clin. Med. 2020, 2, 1018. [Google Scholar]
- Musters, A.H.; Mashayekhi, S.; Harvey, J.; Axon, E.; Lax, S.J.; Flohr, C.; Drucker, A.M.; Gerbens, L.; Ferguson, J.; Ibbotson, S.; et al. Phototherapy for atopic eczema. Cochrane Database Syst Rev. 2021, 28, CD013870. [Google Scholar]
- Malinowska-Borowska, J.; Buczkowska, M. Knowledge about ultraviolet radiation (UVR) and attitudes and behaviour regarding gel manicure according to the age of women. J. Educ. Health Sport 2023, 24, 44–52. [Google Scholar] [CrossRef]
- Panov, V.; Borisova-Papancheva, T. Application of ultraviolet light (UV) in dental medicine. MedInform 2015, 2, 194–200. [Google Scholar] [CrossRef]
- Nilsen, L.T.N.; Hannevik, M.; Veierød, M.B. Ultraviolet exposure from indoor tanning devices: A systematic review. Br. J. Dermatol. 2016, 174, 730–740. [Google Scholar] [CrossRef]
- Kemény, L.; Koreck, A. Ultraviolet light phototherapy for allergic rhinitis. J. Photochem. Photobiol. B Biol. 2007, 87, 58–65. [Google Scholar] [CrossRef]
- Lembo, A.J.; Ganz, R.A.; Sheth, S.; Cave, D.; Kelly, C.; Levin, P.; Kazlas, P.T.; Baldwin, P.C., III; Lindmark, W.R.; McGrath, J.R.; et al. Treatment of Helicobacter pylori Infection with Intra-Gastric Violet Light Phototherapy–a Pilot Clinical Trial. Lasers Surg Med. 2009, 41, 337–344. [Google Scholar] [CrossRef]
- Guerrero-Beltrn, J.A.; Barbosa-C·novas, G.V. Advantages and Limitations on Processing Foods by UV Light. Food Sci. Technol. Int. 2004, 10, 137–147. [Google Scholar] [CrossRef]
- Koutchma, T. UV Light for Processing Foods. Ozone Sci. Eng. 2008, 30, 93–98. [Google Scholar] [CrossRef]
- Csapó, J.; Prokisch, J.; Albert, C.; Sipos, P. Effect of UV light on food quality and safety. Acta Univ. Sapientiae Aliment. 2019, 12, 21–41. [Google Scholar] [CrossRef]
- Antonio-Gutiérrez, O.T.; López-Díaz, A.S.; López-Malo, A.; Palou, E.; Ramírez-Corona, N. UV-C Light for Processing Beverages: Principles, Applications, and Future Trends. Process. Sustain. Beverages 2019, 2, 205–234. [Google Scholar]
- Becidyan, N. Luminescent pigments in security applications. Color Res. Appl. 1995, 20, 124–130. [Google Scholar] [CrossRef]
- Singh, A.K.; Singh, S.; Gupta, B. Highly-efficient, Chemically-stable, UV/blue Light Excitable Biluminescent Security Ink to Combat Counterfeiting. ACS Appl. Mater. Interfaces 2018, 10, 44570–44575. [Google Scholar] [CrossRef] [PubMed]
- Barrera, V.; Panzer, S.; Apfelbacher, M.; Bohnert, M. Searching for biological traces on different materials using a forensic light source and infrared photography. Int. J. Legal. Med. 2016, 130, 599–605. [Google Scholar]
- Carter-Snell, C.J. Forensic Ultraviolet Lights in Clinical Practice: Evidence for the Evidence. Can. J. Police Secur. Serv. 2005, 3, 79–85. [Google Scholar]
- Taylor, H.R. The biological effects of UV-B on the eye. Photochem. Photobiol. 1989, 50, 489–492. [Google Scholar] [CrossRef] [PubMed]
- Zigman, S. Ocular light damage. Photochem. Photobiol. 1993, 57, 1060–1068. [Google Scholar] [CrossRef]
- Urbach, F. Potential effects of altered solar ultraviolet radiation on human skin cancer. Photochem. Photobiol. 1989, 50, 507–513. [Google Scholar] [CrossRef]
- Lee, J.A.H. The relationship between malignant melanoma of skin and exposure to sunlight. Photochem. Photobiol. 1989, 50, 493–496. [Google Scholar] [CrossRef]
- Soltani, M.; Veisi, R.; Rohani, A.A.; Ramzani, O.; Naji, H.R.; Bakar, E.S. UV-curable coating process on CMYK-printed duplex paperboard, Part 1: Mechanical and optical properties. BioRes 2014, 9, 86–92. [Google Scholar] [CrossRef]
- Štaffová, M.; Ondreáš, F.; Svatík, J.; Zbončák, M.; Jančář, J.; Lepcio, P. 3D printing and post-curing optimization of photopolymerized structures: Basic concepts and effective tools for improved thermomechanical properties. Polym. Test. 2022, 108, 107499. [Google Scholar] [CrossRef]
- Decker, C. UV-radiation curing chemistry. Pigment. Resin Technol. 2001, 30, 278–286. [Google Scholar] [CrossRef]
- Ravnbak, M.H. Objective determination of Fitzpatrick skin type. Dan. Med. Bull. 2021, 57, B4153. [Google Scholar]
- Salvadori, G.; Lista, D.; Burattini, C.; Gugliermetti, L.; Leccese, F.; Bisegna, F. Sun Exposure of Body Districts: Development and Validation of an Algorithm to Predict the Erythemal Ultraviolet Dose. Int. J. Environ. Res. Public Health 2019, 16, 3632. [Google Scholar] [CrossRef]
- Yeh, Y.M.; Tu, G.C.; Fu, M.N. Simulation Analysis and Experimental Verification of UV-LIGA Process for High-Aspect-Ratio Ni–Fe Micro-Mold Insert. Jpn. J. Appl. Phys. 2003, 42, 6683–6690. [Google Scholar] [CrossRef]
- Beaubien, D.J.; Beaubien, A.F. Reference Grade Solar Ultraviolet Band Pyranometer. U.S. Patent 5,331,168, 19 July 1994. [Google Scholar]
- Smith, G.J. Ultraviolet Radiation Actinometer. U.S. Patent 4,763,011, 23 August 1988. [Google Scholar]
- Chanishvili, A.; Chilaya, G.; Petriashvili, G.; Barberi, R.; Bartolino, R.; De Santo, M.P. Cholesteric liquid crystal mixtures sensitive to different ranges of solar UV irradiation. Mol. Cryst. Liq. Cryst. 2005, 434, 353–366. [Google Scholar] [CrossRef]
- Petriashvili, G.; Chanishvili, A.; Chilaya, G.; Matranga, M.A.; De Santo, M.P.; Barberi, R. Novel UV Sensor Based on a Liquid Crystalline Mixture Containing a Photoluminescent Dye. Mol. Cryst. Liq. Cryst. 2009, 500, 82–90. [Google Scholar] [CrossRef]
- Horneck, G. Quantification of biologically effective environmental UV irradiance. Adv. Space Res. 2000, 26, 1983–1994. [Google Scholar] [CrossRef]
- Kozicki, M.; Sąsiadek, E. Polyamide woven fabrics with 2,3,5-triphenyltetrazoluim chloride or nitro blue tetrazolium chloride as 2D ionizing radiation dosimeters. Radiat. Meas. 2012, 47, 614–621. [Google Scholar] [CrossRef]
- Kozicki, M.; Sąsiadek, E. UV dosimeter based on polyamide woven fabric and nitro blue tetrazolium chloride as an active compound. Radiat. Meas. 2011, 46, 1123–1137. [Google Scholar] [CrossRef]
- Kozicki, M.; Sąsiadek, E. UV-assisted screen-printing of flat textiles. Color. Technol. 2012, 128, 251–260. [Google Scholar] [CrossRef]
- Sąsiadek, E.; Jaszczak, M.; Skwarek, J.; Kozicki, M. NBT-Pluronic F–127 Hydrogels Printed on Flat Textiles as UV Radiation Sensors. Materials 2021, 14, 3435. [Google Scholar] [CrossRef]
- Kozicki, M.; Sąsiadek-Andrzejczak, E.; Wach, R.; Maras, P. Flexible Cotton Fabric-Based Ionizing Radiation Dosimeter for 2D Dose Distribution Measurements over a Wide Dose Range at High Dose Rates. Int. J. Mol. Sci. 2024, 25, 2916. [Google Scholar] [CrossRef] [PubMed]
- Kozicki, M.; Maras, P.; Karwowski, A.C. Software for 3D radiotherapy dosimetry. Validation. Phys. Med. Biol. 2014, 59, 4111–4136. [Google Scholar] [CrossRef]
- Jaszczak-Kuligowska, M.; Sąsiadek-Andrzejczak, E.; Kozicki, M. Elastic TTC–PVA gel dosimeters for personal UV exposure measurements. Measurement 2024, 228, 114332. [Google Scholar] [CrossRef]
- ISO/CIE 11664–4:2019; Colorimetry—Part 4: CIE, L*a*b* Colour Space 1976. CIE International Commission on Illumination: Vienna, Austria, 2019.
- Kozicki, M.; Sąsiadek, E. Textile UV detector with 2,3,5-triphenyltetrazolium chloride as an active compound. Radiat. Meas. 2011, 46, 510–526. [Google Scholar] [CrossRef]
- Kovács, A.; Baranyai, M.; Wojnárovits, L.; Moussa, A.; Othman, I.; McLaughlin, W.L. Aqueous-ethanol nitro blue tetrazolium solutions for high dose dosimetry. Radiat. Phys. Chem. 1999, 55, 799–803. [Google Scholar] [CrossRef]
- Cottrell, T.L. The Strengths of Chemical Bonds; Butterworth: London, UK, 1958. [Google Scholar]
- Darwent, B.B. Bond Dissociation Energies in Simple Molecues; National Standard Reference Data Series, no. 31; National Bureau of Standards: Washington, DC, USA, 1970. [Google Scholar]
- Benson, S.W. III-Bond Energies. J. Chem. Educ. 1965, 42, 502. [Google Scholar] [CrossRef]
- Kerr, J.A. Bond Dissociation Energies by Kinetic Methods. Chem. Rev. 1966, 66, 465–500. [Google Scholar] [CrossRef]
- Kozicki, M.; Sąsiadek, E. Scanning of flat textile–based radiation dosimeters: Influence of parameters on quality of results. Radiat. Meas. 2013, 58, 87–93. [Google Scholar] [CrossRef]

| UV Dose [mJ/cm2] | UVA | UVB | UVC | ||||||
|---|---|---|---|---|---|---|---|---|---|
| L* | a* | b* | L* | a* | b* | L* | a* | b* | |
| 0 | 83.45 | −1.05 | 16.31 | 83.45 | −1.05 | 16.31 | 83.45 | −1.05 | 16.31 |
| 50 | 79.82 | 2.03 | 14.51 | 79.02 | 3.15 | 13.67 | 77.92 | 4.17 | 12.54 |
| 500 | 65.26 | 9.06 | 9.12 | 63.22 | 11.79 | 9.04 | 57.65 | 12.78 | 7.43 |
| 1000 | 59.27 | 11.77 | 8.02 | 55.70 | 13.87 | 8.83 | 48.10 | 16.63 | 4.23 |
| 5000 | 49.83 | 13.83 | 6.26 | 42.66 | 15.15 | 4.72 | 32.13 | 14.55 | 1.01 |
| 10,000 | 41.55 | 13.65 | 4.00 | 35.65 | 12.07 | 3.11 | 25.10 | 10.73 | 1.04 |
Disclaimer/Publisher’s Note: The statements, opinions and data contained in all publications are solely those of the individual author(s) and contributor(s) and not of MDPI and/or the editor(s). MDPI and/or the editor(s) disclaim responsibility for any injury to people or property resulting from any ideas, methods, instructions or products referred to in the content. |
© 2024 by the authors. Licensee MDPI, Basel, Switzerland. This article is an open access article distributed under the terms and conditions of the Creative Commons Attribution (CC BY) license (https://creativecommons.org/licenses/by/4.0/).
Share and Cite
Sąsiadek-Andrzejczak, E.; Maras, P.; Kozicki, M. Flexible and Ecological Cotton-Based Dosimeter for 2D UV Surface Dose Distribution Measurements. Materials 2024, 17, 4339. https://doi.org/10.3390/ma17174339
Sąsiadek-Andrzejczak E, Maras P, Kozicki M. Flexible and Ecological Cotton-Based Dosimeter for 2D UV Surface Dose Distribution Measurements. Materials. 2024; 17(17):4339. https://doi.org/10.3390/ma17174339
Chicago/Turabian StyleSąsiadek-Andrzejczak, Elżbieta, Piotr Maras, and Marek Kozicki. 2024. "Flexible and Ecological Cotton-Based Dosimeter for 2D UV Surface Dose Distribution Measurements" Materials 17, no. 17: 4339. https://doi.org/10.3390/ma17174339
APA StyleSąsiadek-Andrzejczak, E., Maras, P., & Kozicki, M. (2024). Flexible and Ecological Cotton-Based Dosimeter for 2D UV Surface Dose Distribution Measurements. Materials, 17(17), 4339. https://doi.org/10.3390/ma17174339