Article

Chemometrics of the Environment: Hydrochemical Characterization of Groundwater in Lioua Plain (North Africa) Using Time Series and Multivariate Statistical Analysis

1
Water Resources Mobilization and Management Laboratory (LMGRE), Department of Geology, Institute of Earth and Universe Sciences, University of Batna 2, Fesdis 05078, Algeria
2
Scientific and Technical Research Center on Arid Regions (CRSTRA), Biskra 07000, Algeria
3
Laboratoire de Recherche et d’Etude en Aménagement et Urbanisme (LREAU), USTHB, Algiers 16000, Algeria
4
Environmental Research Center (CRE), Badji-Mokhtar Annaba University, Annaba 23000, Algeria
5
The Mineral and Energy Economy Research Institute of the Polish Academy of Sciences, Wybickiego 7, 31-261 Kraków, Poland
6
Laboratory of LGE, Department of Process Engineering, Faculty of Technology, Badji Mokhtar Annaba University, Annaba 23000, Algeria
7
Institute of Chemistry, University of Tartu, 14a Ravila St., 50411 Tartu, Estonia
8
Institute for Mechanics of Materials, University of Latvia, Jelgavas Street 3, LV-1004 Riga, Latvia
9
Department of Environmental Science, Faculty of Geography and Earth Sciences, University of Latvia, Raina Blvd 19, LV-1586 Riga, Latvia
*
Author to whom correspondence should be addressed.
Sustainability 2023, 15(1), 20; https://doi.org/10.3390/su15010020
Submission received: 23 November 2022 / Revised: 13 December 2022 / Accepted: 16 December 2022 / Published: 20 December 2022
(This article belongs to the Special Issue Sustainable Management of Water Resource and Environmental Monitoring)

Abstract

:
This study aims to analyze the chemical composition of Lioua’s groundwater in order to determine the geological processes influencing the composition and origin of its chemical elements. Therefore, chemometrics techniques, such as multivariate statistical analysis (MSA) and time series methods (TSM) are used. Indeed, MSA includes a component analysis (PCA) and a cluster analysis (CA), while autocorrelation analysis (AA), supplemented by a simple spectral density analysis (SDA), is used for the TMS. PCA displays three main factors explaining a total variance (TV) of 85.01 %. Factors 1, 2, and 3 are 68.72%, 11.96%, and 8.89 % of TV, respectively. In the CA, total dissolved solids (TDS) and electrical conductivity (EC) controlled three groups. The elements SO42−, K+, and Ca2+ are closely related to TDS, the elements Na+, Cl, and Mg2+ are closely related to CE, while HCO3− and NO3− indicate the dissociation of other chemical elements. AA shows a linear interrelationship of EC, Mg2+, Na+, K+, Cl, and SO42−. However, NO3 and HCO3 indicate uncorrelated characteristics with other parameters. For SDA, the correlograms of Mg2+, Na+, K+, Cl, and SO42− have a similar trend with EC. Nonetheless, pH, Ca2+, HCO3 and NO3 exhibit multiple peaks related to the presence of several distinct cyclic mechanisms. Using these techniques, the authors were able to draw the following conclusion: the geochemical processes impacting the chemical composition are (i) dissolution of evaporated mineral deposits, (ii) water–rock interaction, and (iii) evaporation process. In addition, the groundwater exhibits two bipolar characteristics, one recorded with negative and positive charges on pH and Ca+ and another recorded only with negative charges on HCO3 and NO3. On the other hand, SO42−, K+, Ca2+, and TDS are the major predominant elements in the groundwater’s chemical composition. Chloride presence mainly increases the electrical conductivity of water. The lithological factor is dominant in the overall mineralization of the Plio Quaternary surface aquifer waters. The origins of HCO3 and NO3 are as follows: HCO3 has a carbonate origin, whereas NO3 has an anthropogenic origin. The salinity was affected by Mg2+, SO42−, Cl, Na+, K+, and EC. Ca2+, HCO3, and NO3 result from human activity such as the usage of fertilizers, the carbonate facies outcrops, and domestic sewage.

1. Introduction

Water is an essential compound of everyday life, it is so familiar that we often forget its role, importance, and necessity as a vital resource for nature and living beings [1,2]. In developing countries with arid climates, groundwater is crucial since it is often the only source of drinking water [3]. Studies on water management have prioritized water conservation due to an increased reliance on groundwater [4].
Due to chemical interactions with the geological layers through which it flows and, to a lesser extent, due to other factors such as air, surface water, and anthropogenic activity, groundwater contains a vast variety of dissolved solids in varying concentrations [5,6]. Groundwater constitutes a memory that brings to the surface indications of the deeper reservoir [7]. It is clear that the chemistry of groundwater depends, particularly, on the lithological composition of the layers that have been crossed and on the contact time with those layers. Consequently, the elements, which are in the solution, are informative regarding the nature of the aquifer they have crossed [8]. Nonetheless, water quality, which is a combination of chemical, physical and biological parameters, is a somewhat subjective term since its real value depends on the specifics of a particular use [9]. An increased understanding of the hydrogeochemical systems in the water table and the geochemical evolution of water in arid and semi-arid regions may be necessary for the efficient management of water resources and their sustainable exploitation. It is vital to identify the variables impacting water quality using appropriate evaluation techniques. Before beginning any associated applied research projects, a feasibility analysis for a certain region is essential.
Presently, researchers have been using linear models and multivariate statistical analysis for sustainable groundwater resource management [10,11]. Chemometric techniques and saturation indices have been employed to better characterize the hydro-geochemistry in the literature. [12,13,14]. Chemometrics has long been considered useful in obtaining information from environmental data that could be interpreted to uncover useful correlations [15,16,17,18]. Principal component analysis (PCA), cluster analysis (CA), and geographic information system (GIS) techniques help in the interpretation of the big dataset to provide a better understanding of the geochemical dynamics and causes of the pollution in the alluvial aquifers [17].
To study the chemical changes in groundwater, linear modeling should be mentioned. These include time series, multivariate analysis, and geostatistical techniques [5,19,20,21] as well as applied multivariate analysis using cluster analysis (CA) as well as principal component analysis (PCA) [22,23]. We used factor analysis (FA) to discuss mineralization, geochemical evolution and finally, groundwater contamination. In addition, according to Roubil et al. [24], CA has been used to interpret hydrochemical data. This technique has been widely utilized by researchers to examine the chemical development of water along groundwater flow [25]. This method enables the verification of spatial and temporal variations caused by anthropogenic and natural factors [26].
Concerning time series analysis, this method is considered one of the most useful techniques applied in modeling and forecasting water quality [27]. At present, time series analyses are used in various disciplines, such as economics, natural sciences, physics, and engineering. Water resources engineering also belongs to this category since many characteristics of streams, water bodies, and groundwater resources, as well as seas and lakes, are defined using time series [28]. Therefore, it can be useful in modeling and in developing an understanding of the process or a phenomenon, as well as in forecasting future values based on past observations and data [29,30]. Autocorrelation analysis determines the linear relationship between subsequent values over a time period and the autocorrelation function is stated as the variance and auto covariance of time series data [31]. At the same time, a simple spectral density analysis completes the autocorrelation analysis [32].
Regarding Algeria, while perennial agriculture of date palms or greenhouse crops requires much more water from irrigation, the development of irrigated crops in the south of the country (a region characterized by an arid climate and located beyond the isohyet of 150 mm/year) has been based primarily on groundwater pumping. This approach has increased farmer income, but has also caused water quality to deteriorate (salinization), especially with regard to the region’s groundwater resources. The soils of the Saharan regions of Algeria are rich in soluble salts, which accumulate and often present calcareous or gypseous or calcareous–gypseous crusts. The presence of these gypsum, limestone, and saline accumulations, in general, poses many problems for the physicochemical quality of groundwater via water–soil interaction. This is the case in the Lioua region.
The aim of this study is to examine the chemical composition of groundwater while determining the origin of the chemical elements found in the water using chemometric techniques, such as time series and multivariate statistical analysis methods. The techniques mentioned will be used for all the samples taken from a potential underground water resource, massively exploited, located in the arid region of Algeria’s Lower Saharan region. This is the surface aquifer of the Plio Quaternary aquifer, intended for drinking water supply and irrigation of the Lioua region.
This article also elucidates the use of the chemometric technique for the analysis and interpretation of water quality data for the rational management of groundwater resources in arid regions. The results of this study will provide important information on the quality of groundwater in the study area and help adopt an appropriate remedial management approach in other agricultural regions similar to Lioua of the lower Sahara of Algeria.

2. Materials and Methods
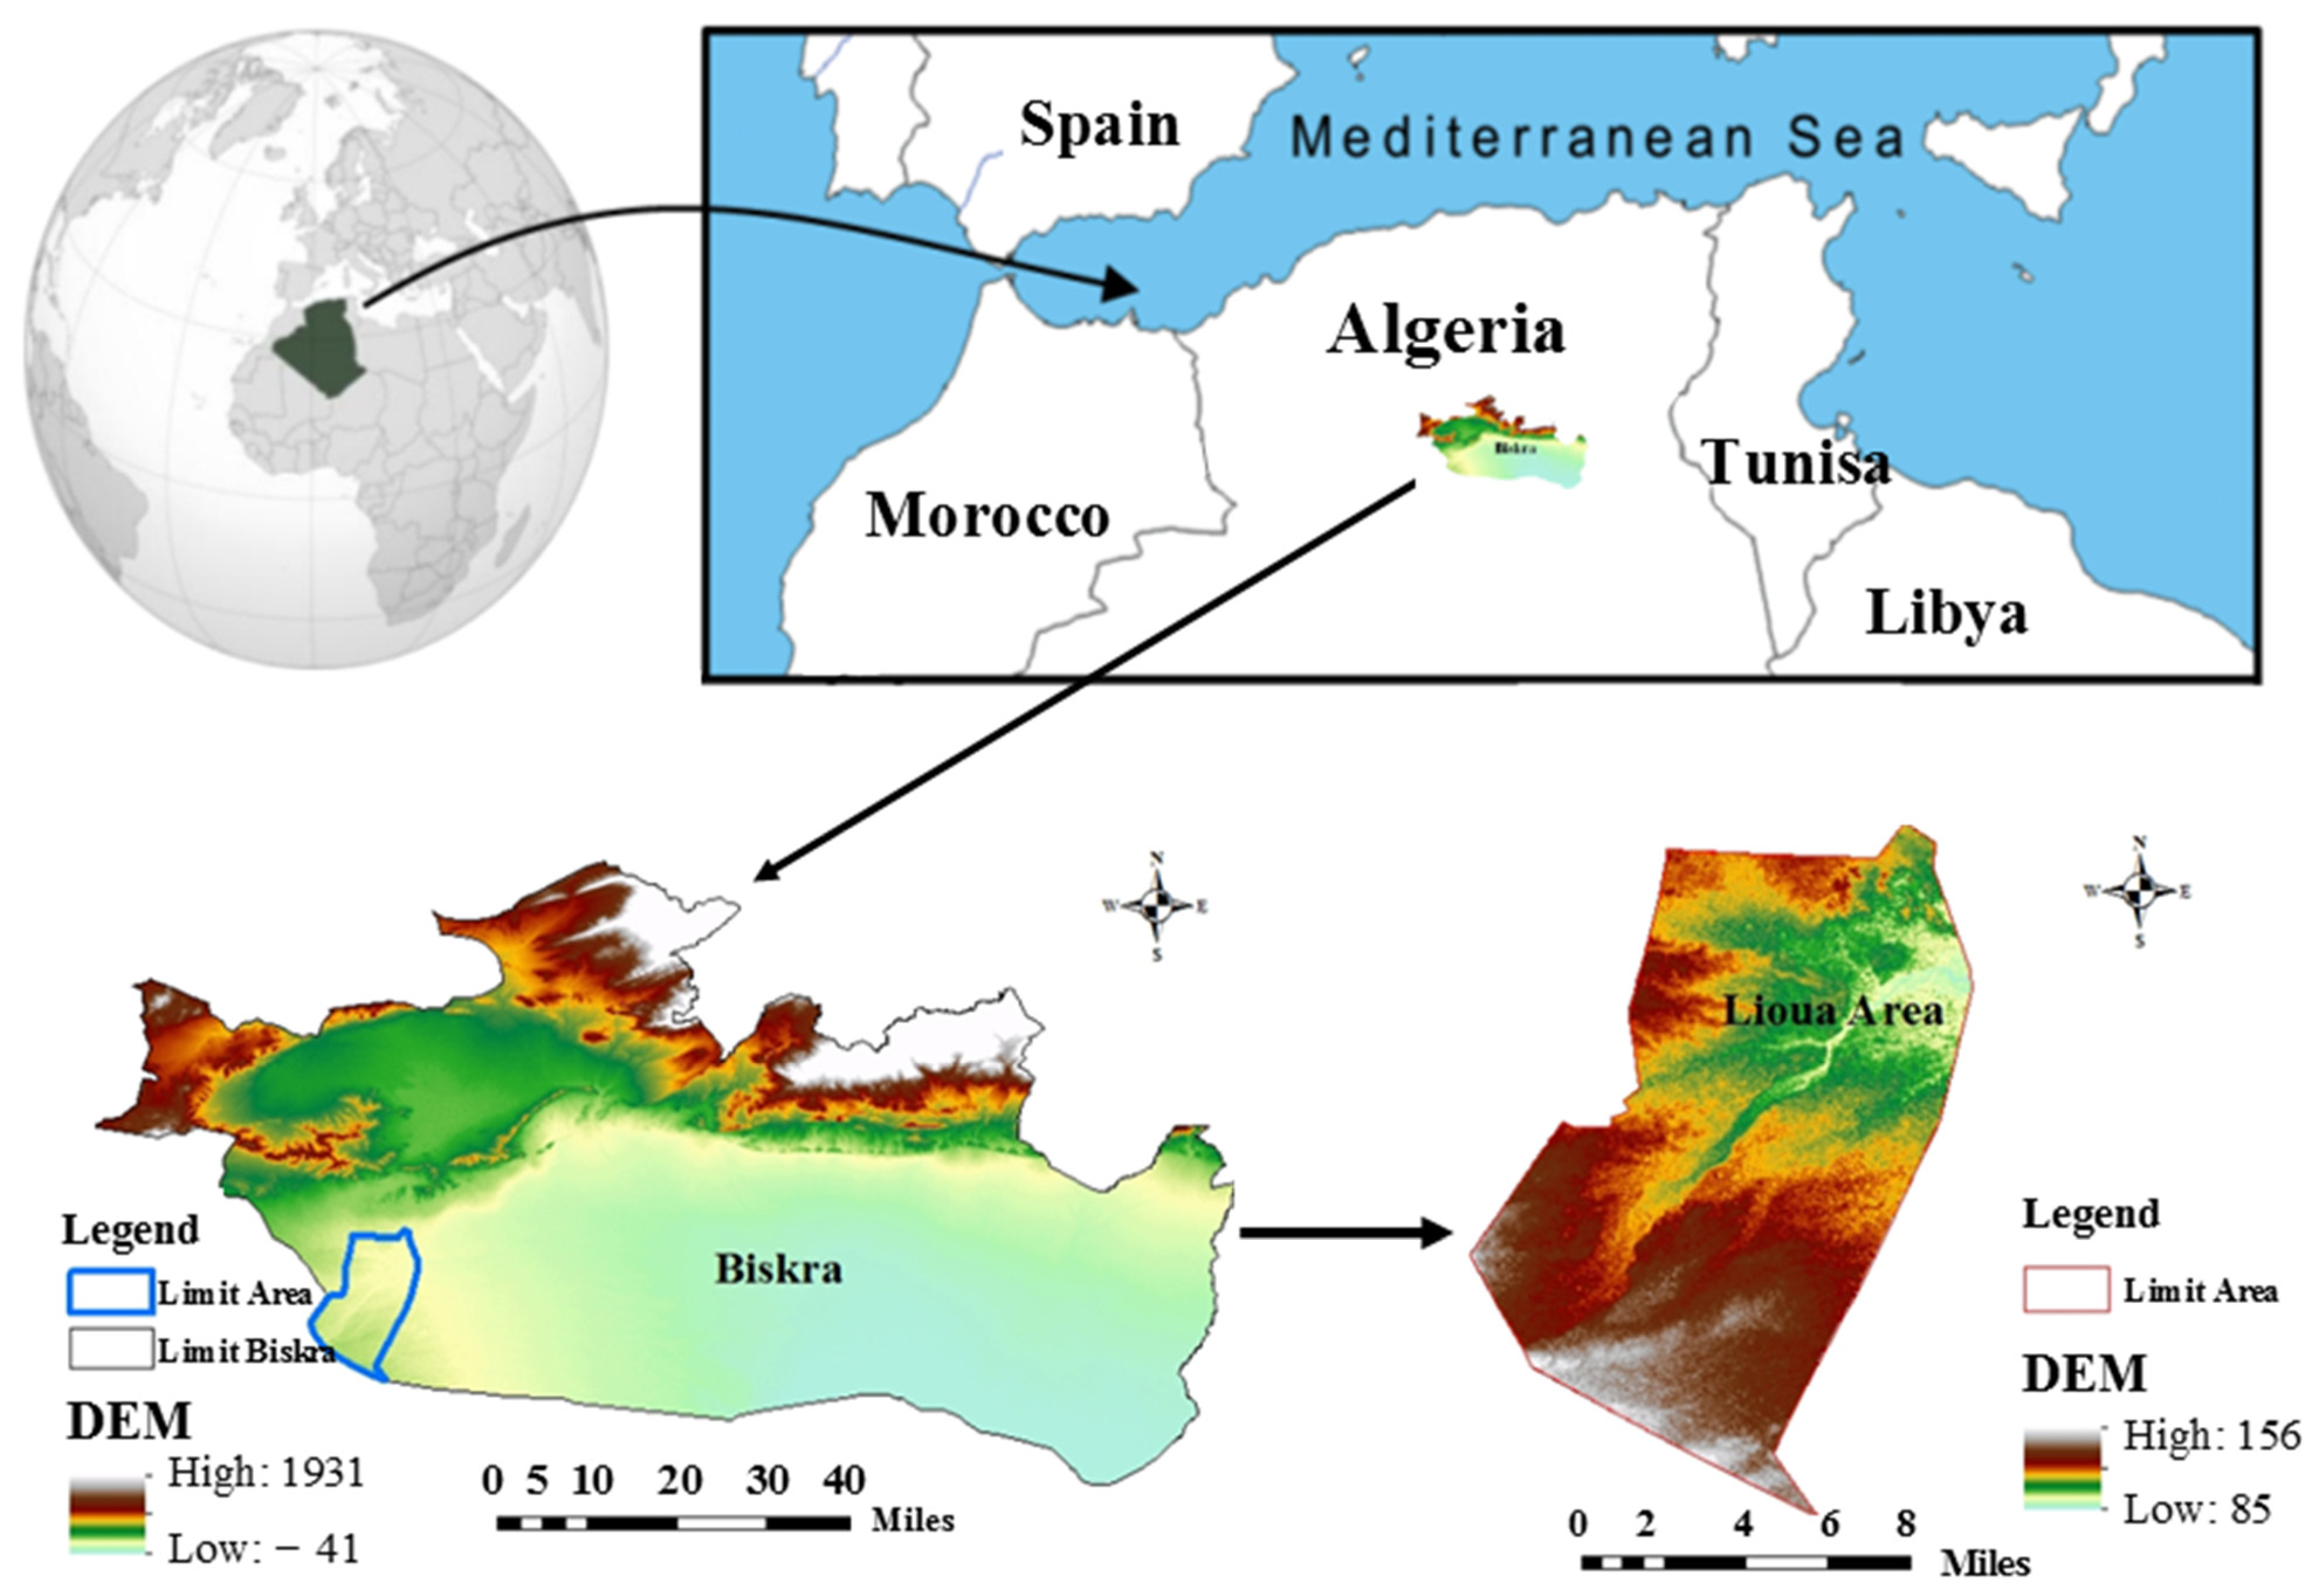
2.1. Study Area

The province of Biskra is located in the southeast of Algeria and, more precisely, in the south of the Aurès, constituting its natural limit in the north. It extends to the southeast to the Chotts area (Chott Melghir) and to the southwest to the beginning of the great eastern erg. Geo-physically, the wilaya extends over an area of 12,755 km2 and is made up of large geographical units: to the north, a mountain and high plateau area, to the southeast, an area of the Chotts to the east and to the south, an area of plateaus and steppe plains on the El Outaya–Doucen axis in the center. The majority of the lands of the wilaya have a large flat expanse followed by a low-pressure area, that of Chott Melghir, which is shown in Figure 1.
Lioua is a commune of Biskra Province that is located about forty kilometers south of Biskra (Figure 1). Located on Oued Djedi; it extends over an area of approximately 242.1 km2 at an altitude of 94 m. It is part of the Zab Gharbi palm groves in the Oued Djedi watershed. The study area belongs to the lower arid bioclimatic level (200 < p > 100 m) with a strong continental influence. Rainfalls usually fall as heavy downpours. The average temperature throughout the year is 22.4 °C, with a high seasonal variation. The maximum temperature can reach up to 50 °C during the presence of superheated air coming from the south.
The region of Lioua has an agricultural vocation par excellence where intercropping market gardening and fruit trees are practiced intensively in the oases of date palms. The region’s agricultural land is estimated to be 7495 Ha; in accordance with the agricultural services of the wilaya of Biskra, there are 50 wells and 1160 boreholes there that irrigate 116 Ha and 4902 Ha, respectively. In arid areas and faced with the virtual absence of surface water resources, the exploitation of groundwater remains the only way to meet needs. Agriculture is a productive sector characterized by the greatest demand for water, mainly due to farming needs that are higher than rainfall contributions. In addition, the generalization of irrigation is being spread over large agricultural perimeters, where the productive potential of the soil is closely linked to the availability of water during the summer period [8].

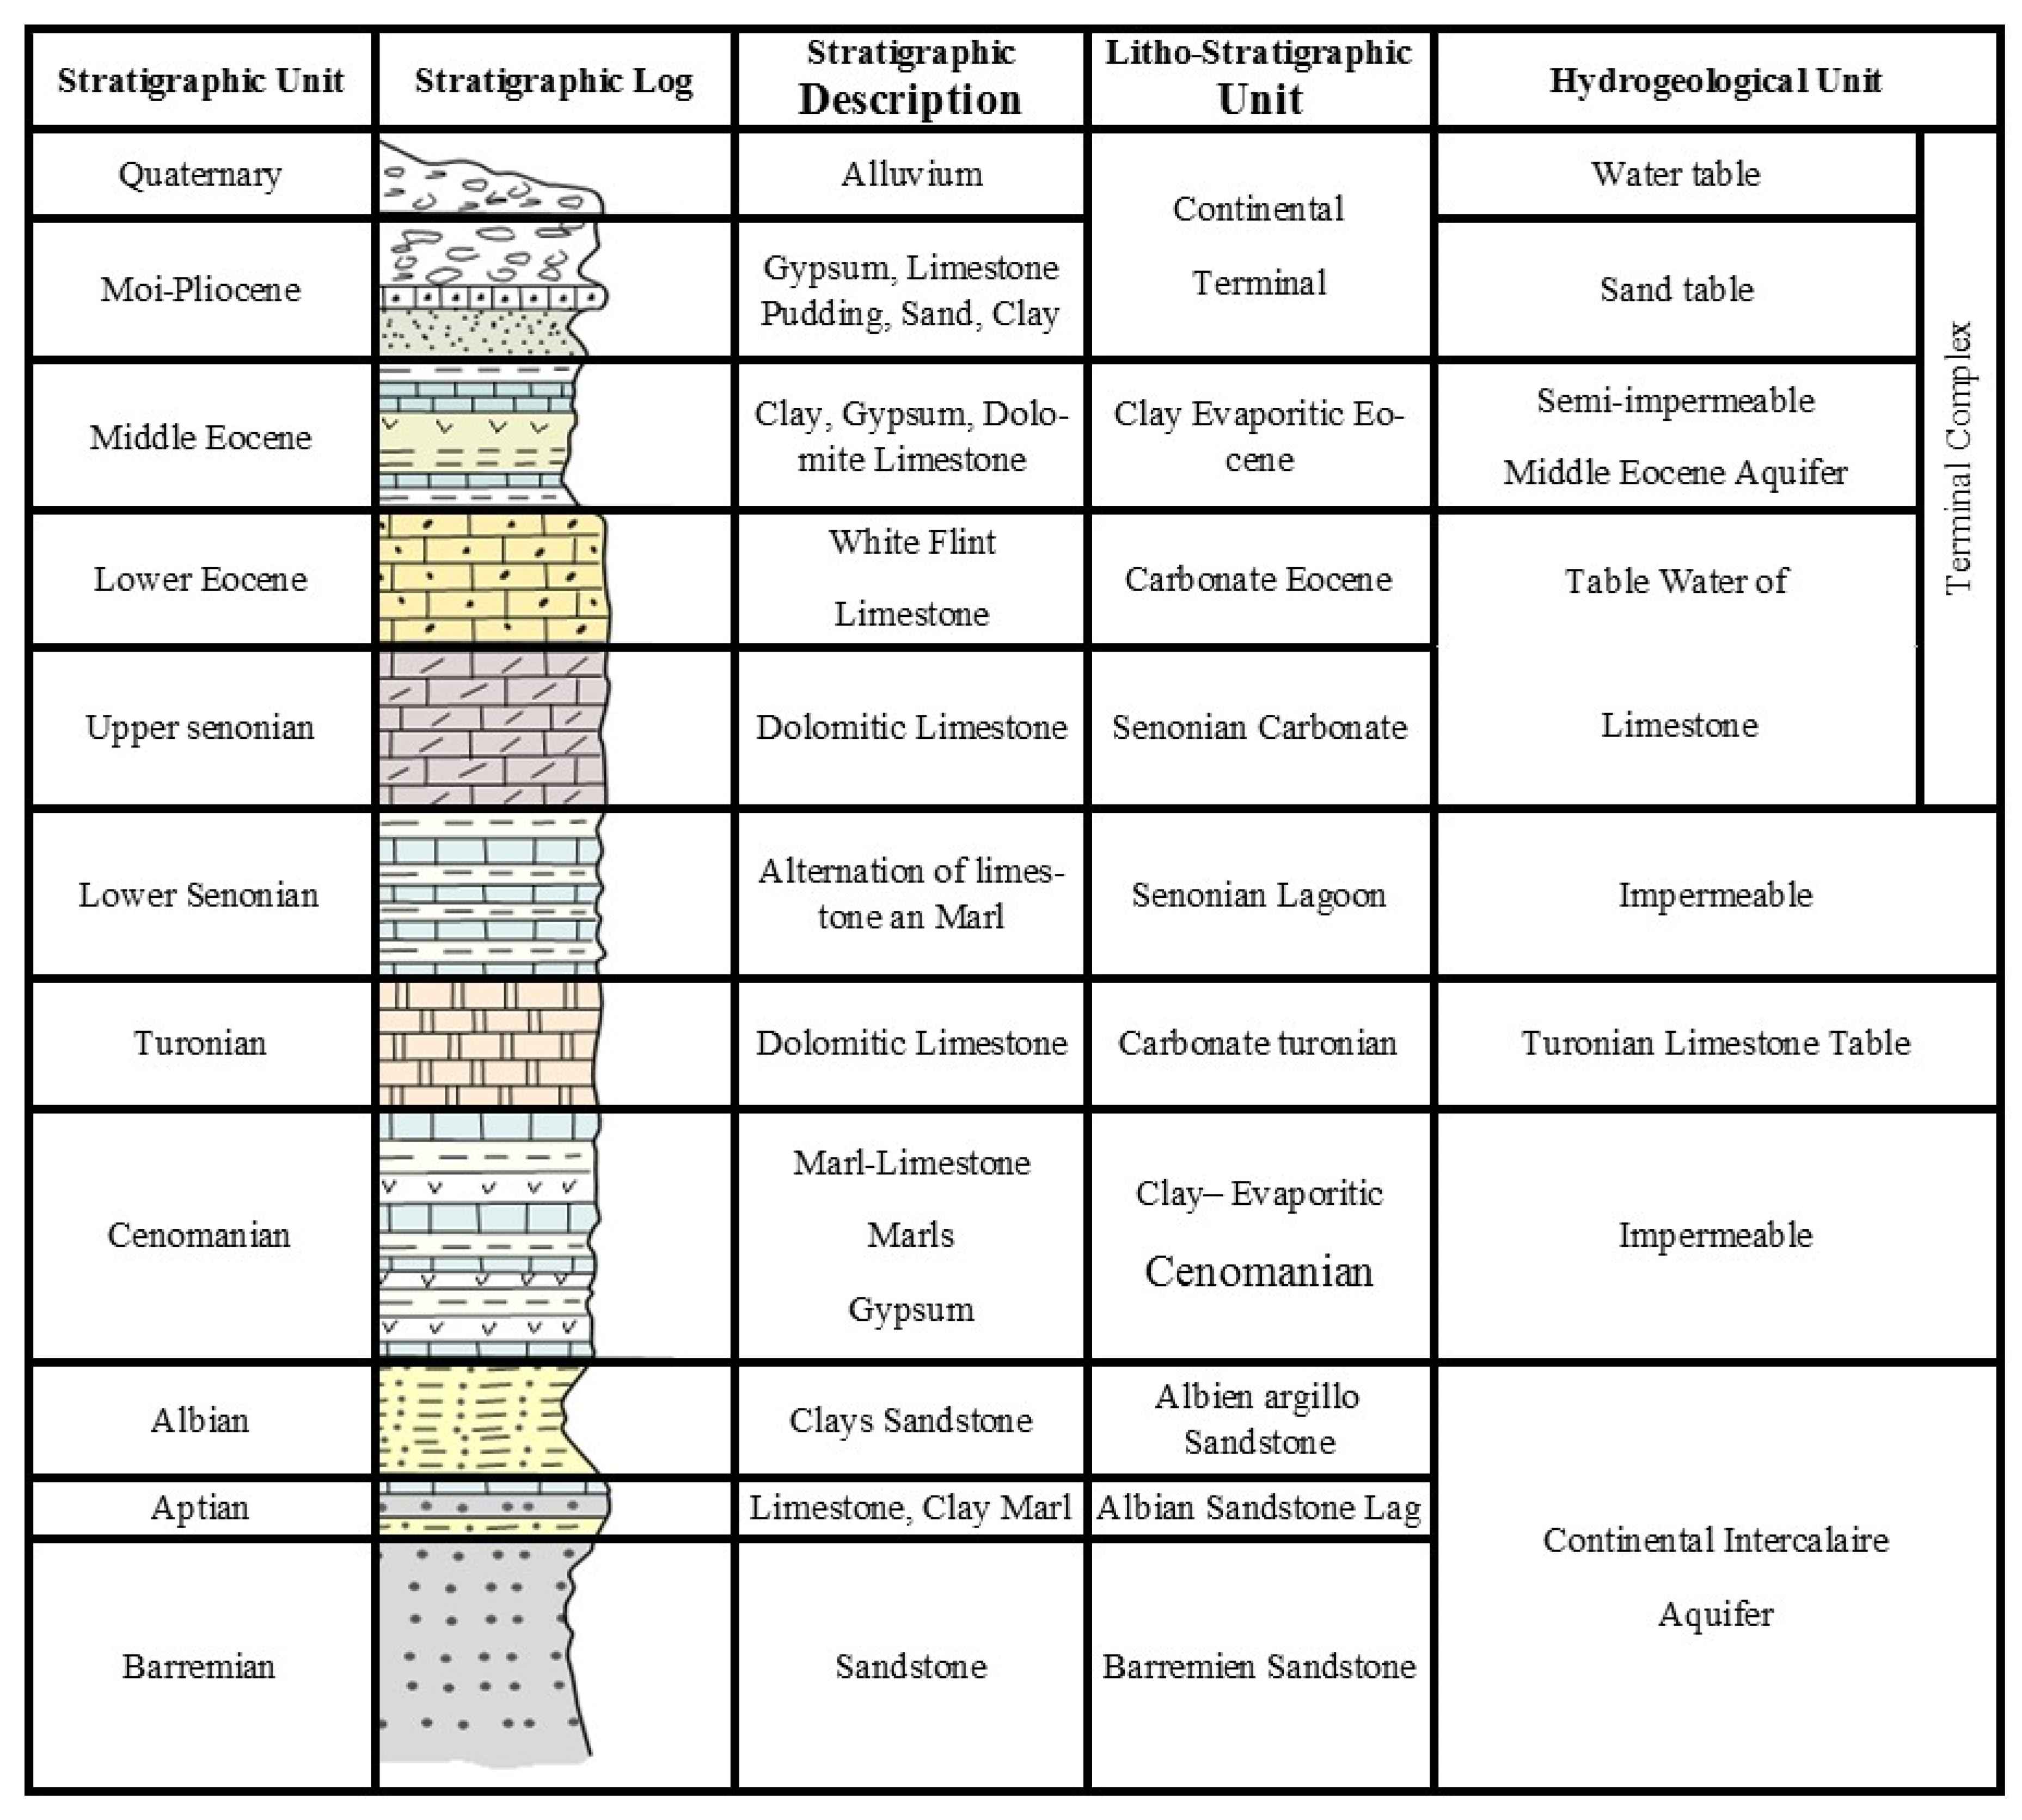
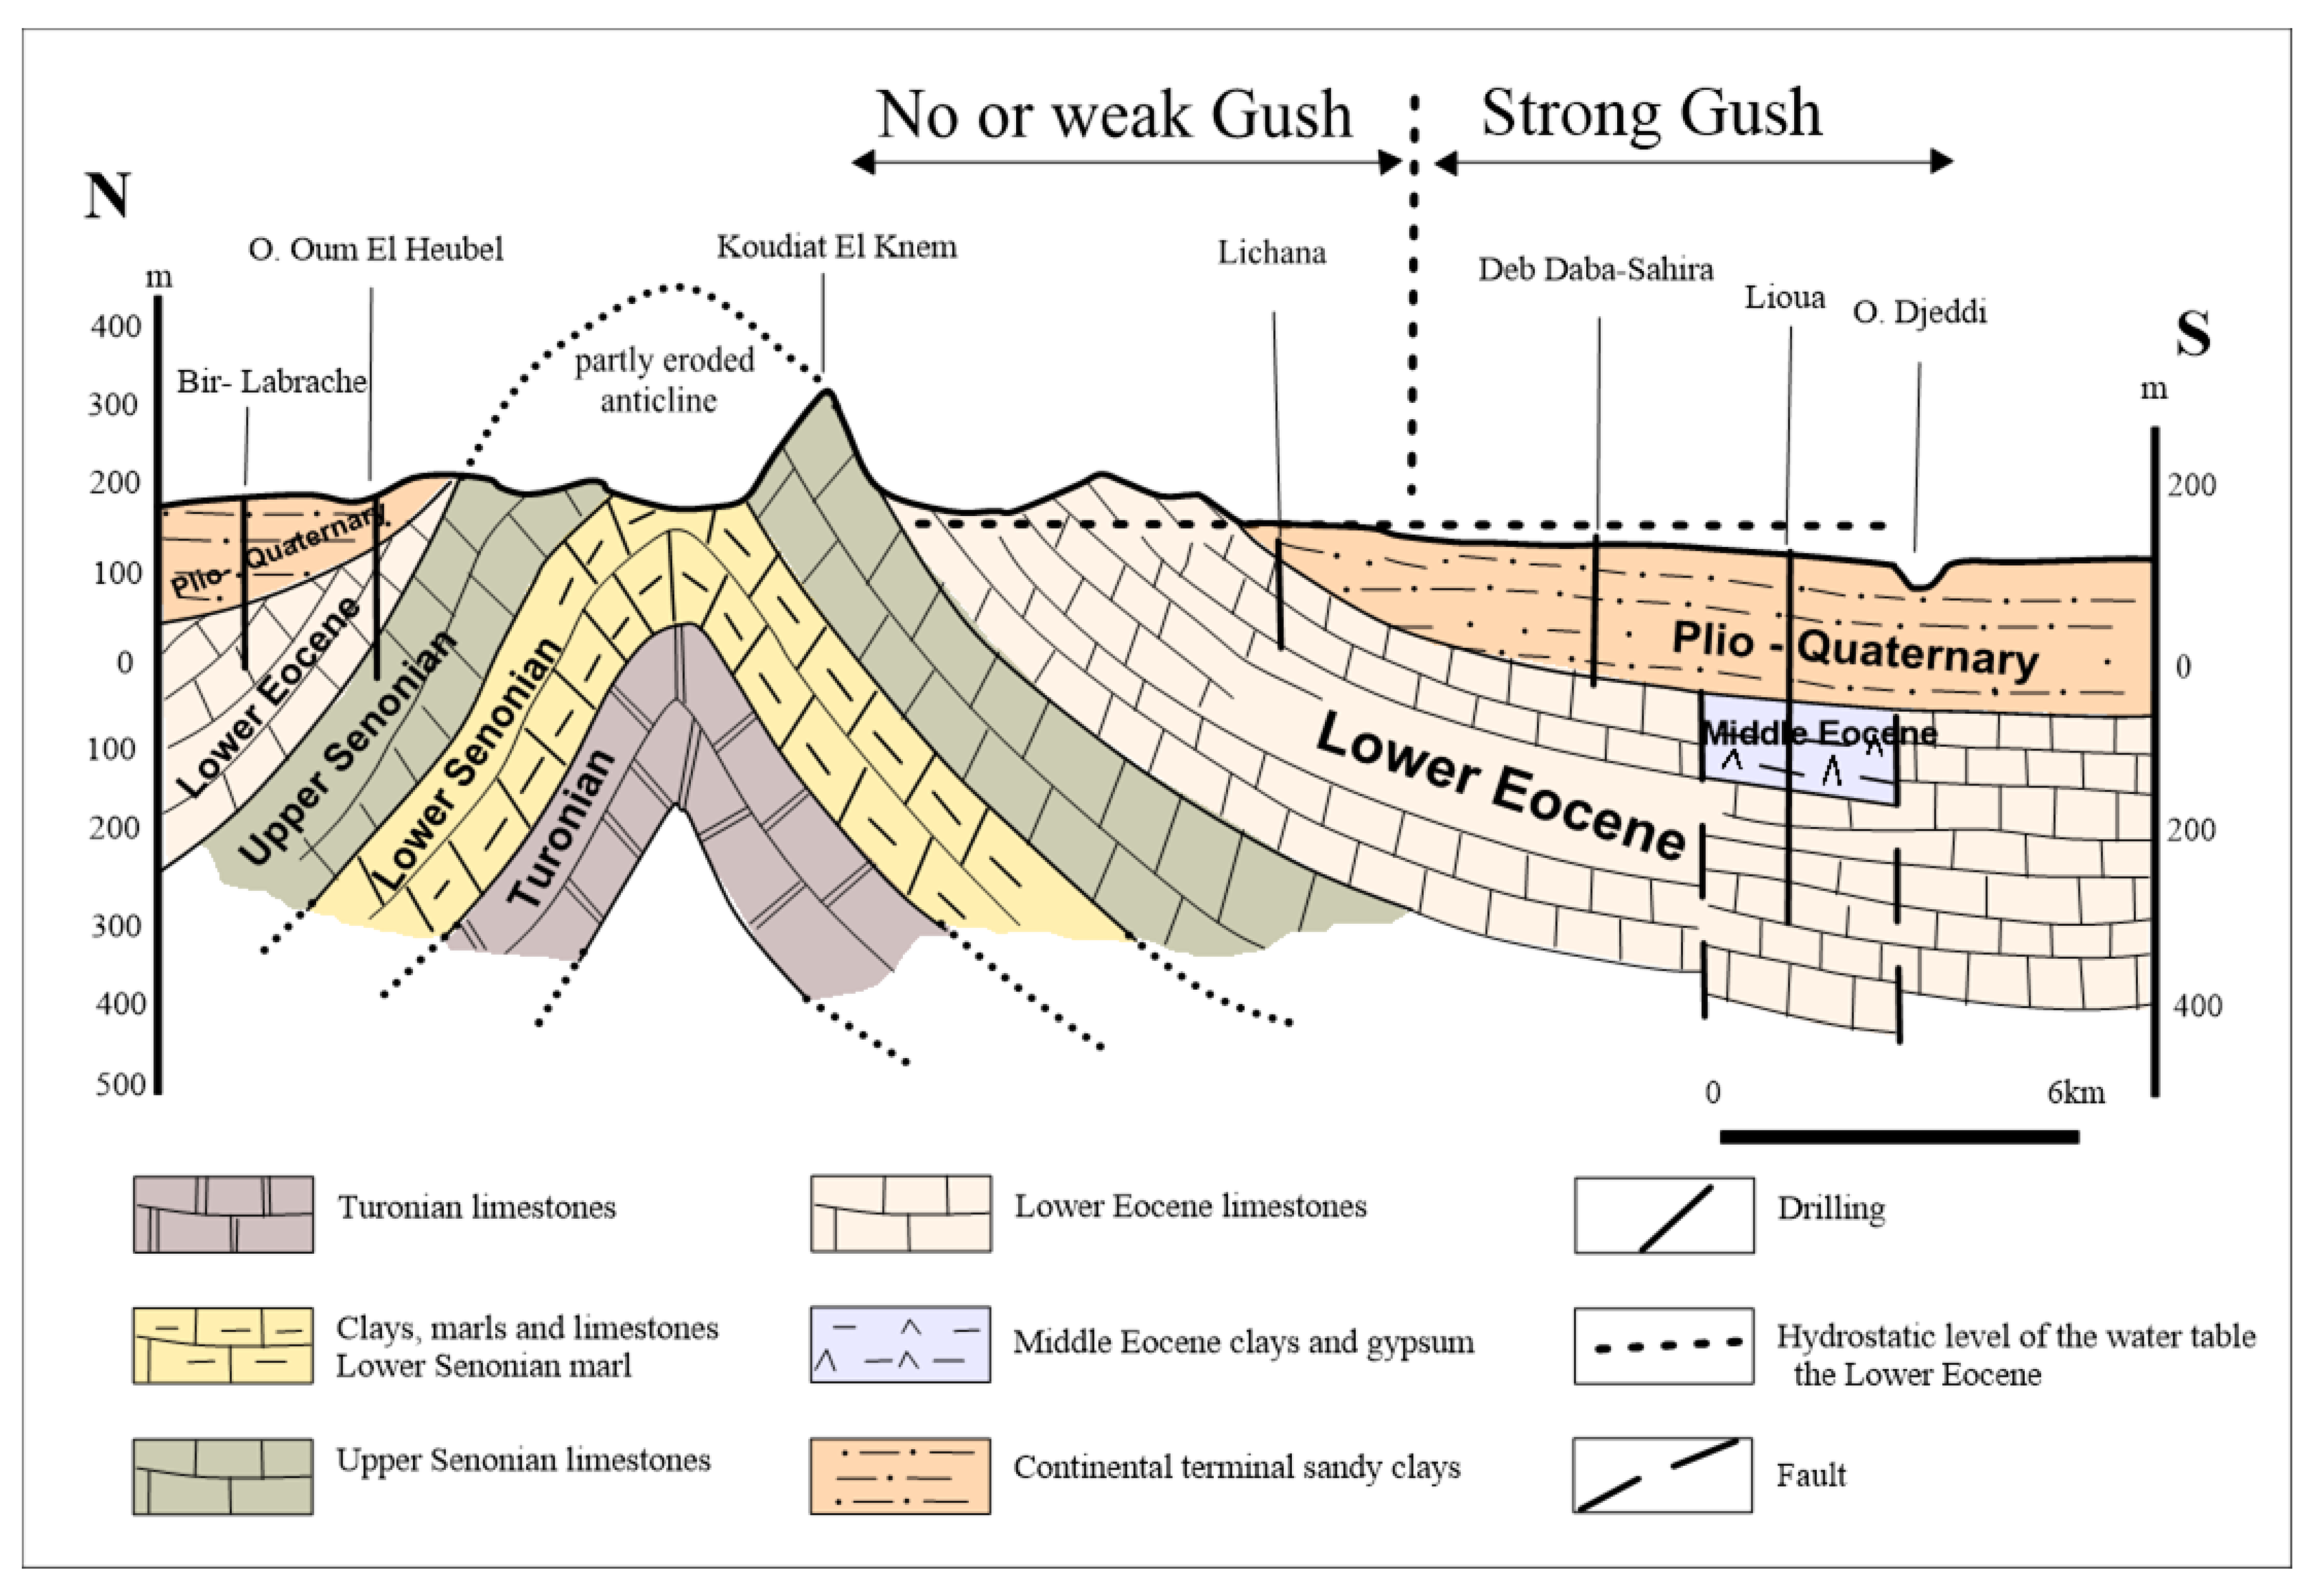
2.2. Geological and Hydrogeological Setting

The region of Biskra is mainly characterized by sedimentary terrains, ranging from Barremian (Cretaceous) at the base to Quaternary at the top. The lower Sahara is, in fact, a vast backfilling plain, which has slowly subsided since the upper Cretaceous to the Quaternary. This basin is filled with post-Eocene continental Tertiary deposits, made up of agglomerated sands intercalated with clay layers and clay-sand banks [33]. The Neogene deposits, which are mainly the product of the dismantling of the Atlas chain, completely mask the underlying folded structures. In addition, it is only thanks to geophysics and drilling logs that this structure has been updated [30].
Litho-stratigraphically, the Lioua region is made up of formations of ages ranging from Secondary to Quaternary. Secondary formations (Cretaceous) consist of limestone, crystalline limestone, dolomites sandstone, gypsum, anhydrite, clays, and marls, while Tertiary formations (Paleogene and Neogene) consisting of limestone, marls, gypsum, clays, gravel and sand red. The Quaternary formations consist of scree, pebbles, gravel, sand, gypsum limestone, sandy alluvium, and clay alluvium (Figure 2).
For the hydrogeological context, geological and hydrogeological studies have made it possible to highlight the existence of several aquifer reservoirs of very distinct importance in terms of their lithological constitution, their geological structure, and the ease with which they are exploited. These aquifers belong to the Quaternary, Mio-Pliocene, Lower Eocene and Upper Senonian (Maastrichtian), and Albian. The Albian aquifer, also called the continental intercalary (CI) aquifer, is by far the most important reservoir in the region since it covers most of the northern Saharan territory. Thus, the groundwater belongs to a complex hydrogeological basin whose main aquifer reservoirs are shown in Figure 3 and Figure 4.
The water table of Oued Djedi particularly represents the superficial water table. The thickness of this water table varies between 50 and 70 m, with an average flow of 20 L/s. The quality of the water extracted is poor to average; only south of Lioua is it is of good quality. The aquifer reservoir is heterogeneous and consists of detrital materials (pebbles, gravel, and sand). The substratum is made up of a thick clay formation; sometimes, it appears in the form of lenses of sand in discordance with the layers of clay. The water table is fed by rainwater, seepage from the Oueds, and irrigation water.
The Mio Pliocene sands table is essentially constituted by an alternation of sands, gravels, and clays. It is strongly exploited by a very important number of drillings intended essentially for the irrigation of agricultural lands. The thickness of this aquifer varies from 80 to 140 m with a flow rate of 5 to 15 L/s. The aquifer is made up of several producer levels with a heterogeneous composition: detrital materials, gravel, and sand wrapped in a clay matrix. At depth, the formation becomes predominantly sandy clay and rests on an impermeable formation composed of gypsum marl and anhydrite of the middle Eocene. The sands sheet is covered by a shallow alluvial deposit or a Quaternary gypsum sand layer. In places, the Mio Pliocene outcrops bring this aquifer into direct contact with the surface, thus ensuring its supply from surface water [34].
The Lower Eocene limestone aquifer is the most solicited aquifer in the Ziban region (Zab El-Gharbi). It has been well known for a long time for its artesianism and its natural outlets, which are the north-east springs of the Lioua region (Oumache, M’lili, Megloub). The thickness of the aquifer ranges from 150 to 250 m with a flow of 5 to 40 L/s. This aquifer contains important reserves, which are linked to the facies, the state of fissuring of the rock, and to the underground recharge from the Saharan Atlas. Its roof is constituted in the north by sandy clay formations of the Mio Pliocene and in the South by marls with gypsum of the middle Eocene, contributing to its loading [35]. The reservoir of the limestone nappe is essentially made up of limestone of the lower Eocene, upper Senonian, and Turonian.
The continental intercalary aquifer (Albo-Barremian) is a very deep nappe (more than 2000 m), often called Albian. It is characterized by warm waters whose temperature can exceed 60 °C and have a poor chemical quality. The thickness of this water table varies from 250 to 300 m with a flow of more than 25 to 120 L/s and it is characterized by its artesianism. It is made up of sandstone, limestone, and clay. It is not solicited in the region, except in Ouled Djellal and Sidi Khaled where the Albian or Barremian sandstone formations are found at depths of 1500 to 2500 m (Figure 3).

2.3. Groundwater Sampling and Analysis

Groundwater hydrochemical analysis is an important aspect of hydrogeological research, which guides the sustainable use and management of groundwater resources. Thirty-one (31) water samples were collected from different electrically pumped wells at different locations in the study area to determine the chemical parameters of the water samples. These included 12 samples collected by the authors at the beginning of the rain season (January 2021) and the rest were collected at the end of the rain season (May 2021). To determine the location sampling points, a global positioning system (GPS) (Model: GPS map 76 CSx) was used, as presented in Figure 2. It is assumed that during/after the rainy season, pollutants may have been subjected to downward leaching and thus contaminating the underlying aquifers [36]. After stabilizing the water temperature and pumping for about 15 min to remove groundwater that had been stored in the hydraulic structure, samples were collected using two polypropylene (PP) bottles that had been washed with acid in accordance with the American Public Health Association’s method (APHA) [37]. Each sample was promptly filtered locally using cellulose acetate 0.45-m filters. Filtrate was put into 100 cm3 polyethylene (PE) bottles for cations studies, where it was instantly acidified with ultrapure nitric acid to pH 2. (5 mL 6N HNO3) (Germany’s Merck). Samples for anions analysis were put into 250 cm3 plastic bottles without being acidified. Our samples were kept cold, at around 4 °C, in an ice chest; then, they were transferred to the laboratory and analyzed.
The physicochemical parameters (electric conductivity, temperature, and pH) were measured using a WTW multiparameter (P3 MultiLine pH/LF-SET), Welheim- Germany. The WTW Multi-Line P3/LF-SET multi-parameter meter is equipped with a simultaneous connection of a pH/Redox electrode and a conductivity cell, which makes it possible to measure all three parameters at the same time with a linear and non-linear temperature compensation function for ultra-pure and natural waters. Chemical analyses were carried out at the Water Control and Quality Laboratory of the Biskra Unit of the Algerian Water Company (ADE Biskra). The main dissolved chemical components of the water samples were analyzed. HCO3 is measured by titration endpoint methyl orange immediately after sampling. Ca2+ and Mg2+ were determined by complex titration. We determined the chloride concentration by titrating and precipitating AgCl until silver chromate appeared. SO42− was determined using spectrophotometry using a Mecasys UV/VIS Spectrophotometer 5U5707-14021-00. Na+ and K+ were analyzed by flame photometer and NO3 was determined by cadmium column reduction method. The TDS was estimated by weighing and drying at 103–105 °C in an oven. Nitrates were determined using the cadmium column reduction method. All samples were analyzed in triplicate with analytical uncertainty of less than 4%. To check the correctness of the analysis, the cations–anions balance was used, where it was within ±5%, indicating the reliability of the chemical analysis. This was achieved by applying standard methods of the APHA [37]. The respective ionic balance is generally around 5%. Hydrochemical results of all samples were statistically analyzed by using DIAGRAMMES version 5.8. The results of the time series analysis and the multivariate statistical techniques were produced by STATISTICA (version 14). Geographic Information System (GIS) was used to create distribution maps of the principal (anion and cation) ions in the area under study, specifically with the software ArcGIS (version 10.5.X).

2.4. Methodology

2.4.1. Data Treatment and Multivariate Statistical Analysis

Chemometric analyses, such as PCA and CA, have been widely employed as objective approaches for the retrieval of crucial information from the hydrochemical dataset in order to comprehend the origins of the primary ions and the geochemical processes impacting the quality of the groundwater [17,38,39]. In order to extract the most important components and to decrease the data with the least amount of information lost, principal component analysis (PCA) techniques are typically used to examine the correlations between various sets of groundwater hydrochemical data [1]. The chemometric analyses help to simplify and organize large data sets to provide meaningful insight. PCA is a statistical technique for reducing the initial inputs of data variables into a small number of principal components for better interpretation of the data [40,41]. The first principal component (PC1) accounts for the majority of the variance in the data set, with each succeeding component accounting for a decreasingly variance [42]. Standardization of the chemical parameters is done before the PCA is applied (scale z). In order to remove any potential biases toward a specific parameter of the distinct unit at large concentrations, this standardization makes each of the parameters dimensionless [43,44]. Principal components (PCs) were extracted using the varimax rotation approach, with eigenvalues greater than 1 considered important for interpretation [45]. In this research, the PCA method was applied to hydrochemical data obtained from the Lioua plain to attain significant information in order to understand the geochemical processes influencing the chemical composition of the groundwater and quality in the studied area.
Using cluster analysis (hierarchical clustering), one can categorize vast amounts of data into groups based on a predetermined set of traits. To identify real data groups, CA combines several multivariate approaches [46]. Based on similarities and differences between objects, the main goal of CA is to locate relatively homogenous groupings or clusters of those objects [47]. First, related objects are grouped together; then, when the degree of similarity increases, all subgroups are combined into a single cluster. In the end, this can help in identifying patterns that might be significant [48]. It is well known that in clustering, items are grouped together so that they belong to the same class [49]. Using Ward’s approach and Euclidean distance as a measure of similarity, cluster analysis (CA) is conducted on the standardized data set to produce a dendrogram.
Therefore, Ward’s method as a linkage rule for classifying the hydrogeochemical data is applied in the present study. The Euclidean distance was used as a measure of distance between samples, which is one of the most commonly adopted measures [50].

2.4.2. Time Series Analysis

The main application of a time series analysis applied to environmental systems is to understand seasonal changes and/or trends over time. Nevertheless, understanding and modeling the correlational structure in the time series is another objective that is frequently of utmost relevance. On stationary processes, this kind of study is typically performed. Any process that remains consistent across time is said to be stationary. In other words, a stationary time series is one that has no periodic variations and no systematic change in its mean or variance [51].
A short overview of the mathematical expressions of autocorrelation and spectral density is presented. The theory of correlation has been highlighted in detail in [52] and [53]. According to [54], a simple autocorrelation analysis provides quantitative information for linearly dependent successive values in time. Autocorrelation function r(K) is expressed using autocovariance C(K) and variance C(0) of the time series, such as in (Equation (1)):
r k = C k C 0   c K = 1 n t = 1 n k x t X ¯ x t + k X ¯
where k is a time lag (k = 0 − m), n is the number of events, x t is a single event, X is the mean of events and m is the cutting point. The analysis interval and the current situation are typically used to identify the cutting point. The autocorrelation function shows a slowly diminishing slope along with the non-zero values over a long lag in situations when time series are highly correlated and also involve a long-memory impact. However, when uncorrelated, such as when it rains, the autocorrelation function rapidly declines and shortly reaches zero [55]. The autocorrelation study is complemented by a straightforward spectral density analysis. By performing a Fourier transformation on the autocorrelation function, the spectral density function denotes a change from a time mode to a frequency mode [56]. The spectral density function, S(f), can be interpreted by identifying the different peaks, which stand for periodical phenomena. S(f) characterizes the system as in (Equation (2)):
S f = 2 1 + 2 k = 1 m D k r k cos 2 π fk D k = 1 + cos π k m 2
where f is the frequency and D(k) ensures that estimated values S(f) are not biased.

3. Results

Thirty-one groundwater samples from a highly agricultural plain in the Lower Sahara of Algeria were experimentally obtained and analyzed. A descriptive statistical summary of the analyzed groundwater samples’ parameters, along with the drinking water standards of the World Health Organization [57], is provided in Table 1. The spatial distribution map of major ions (Ca2+, Mg2+, Na+, K+, HCO3, SO42−, Cl, NO3) of the groundwater samples in the study region are summarized and discussed herein (Figure 5 and Figure 6).

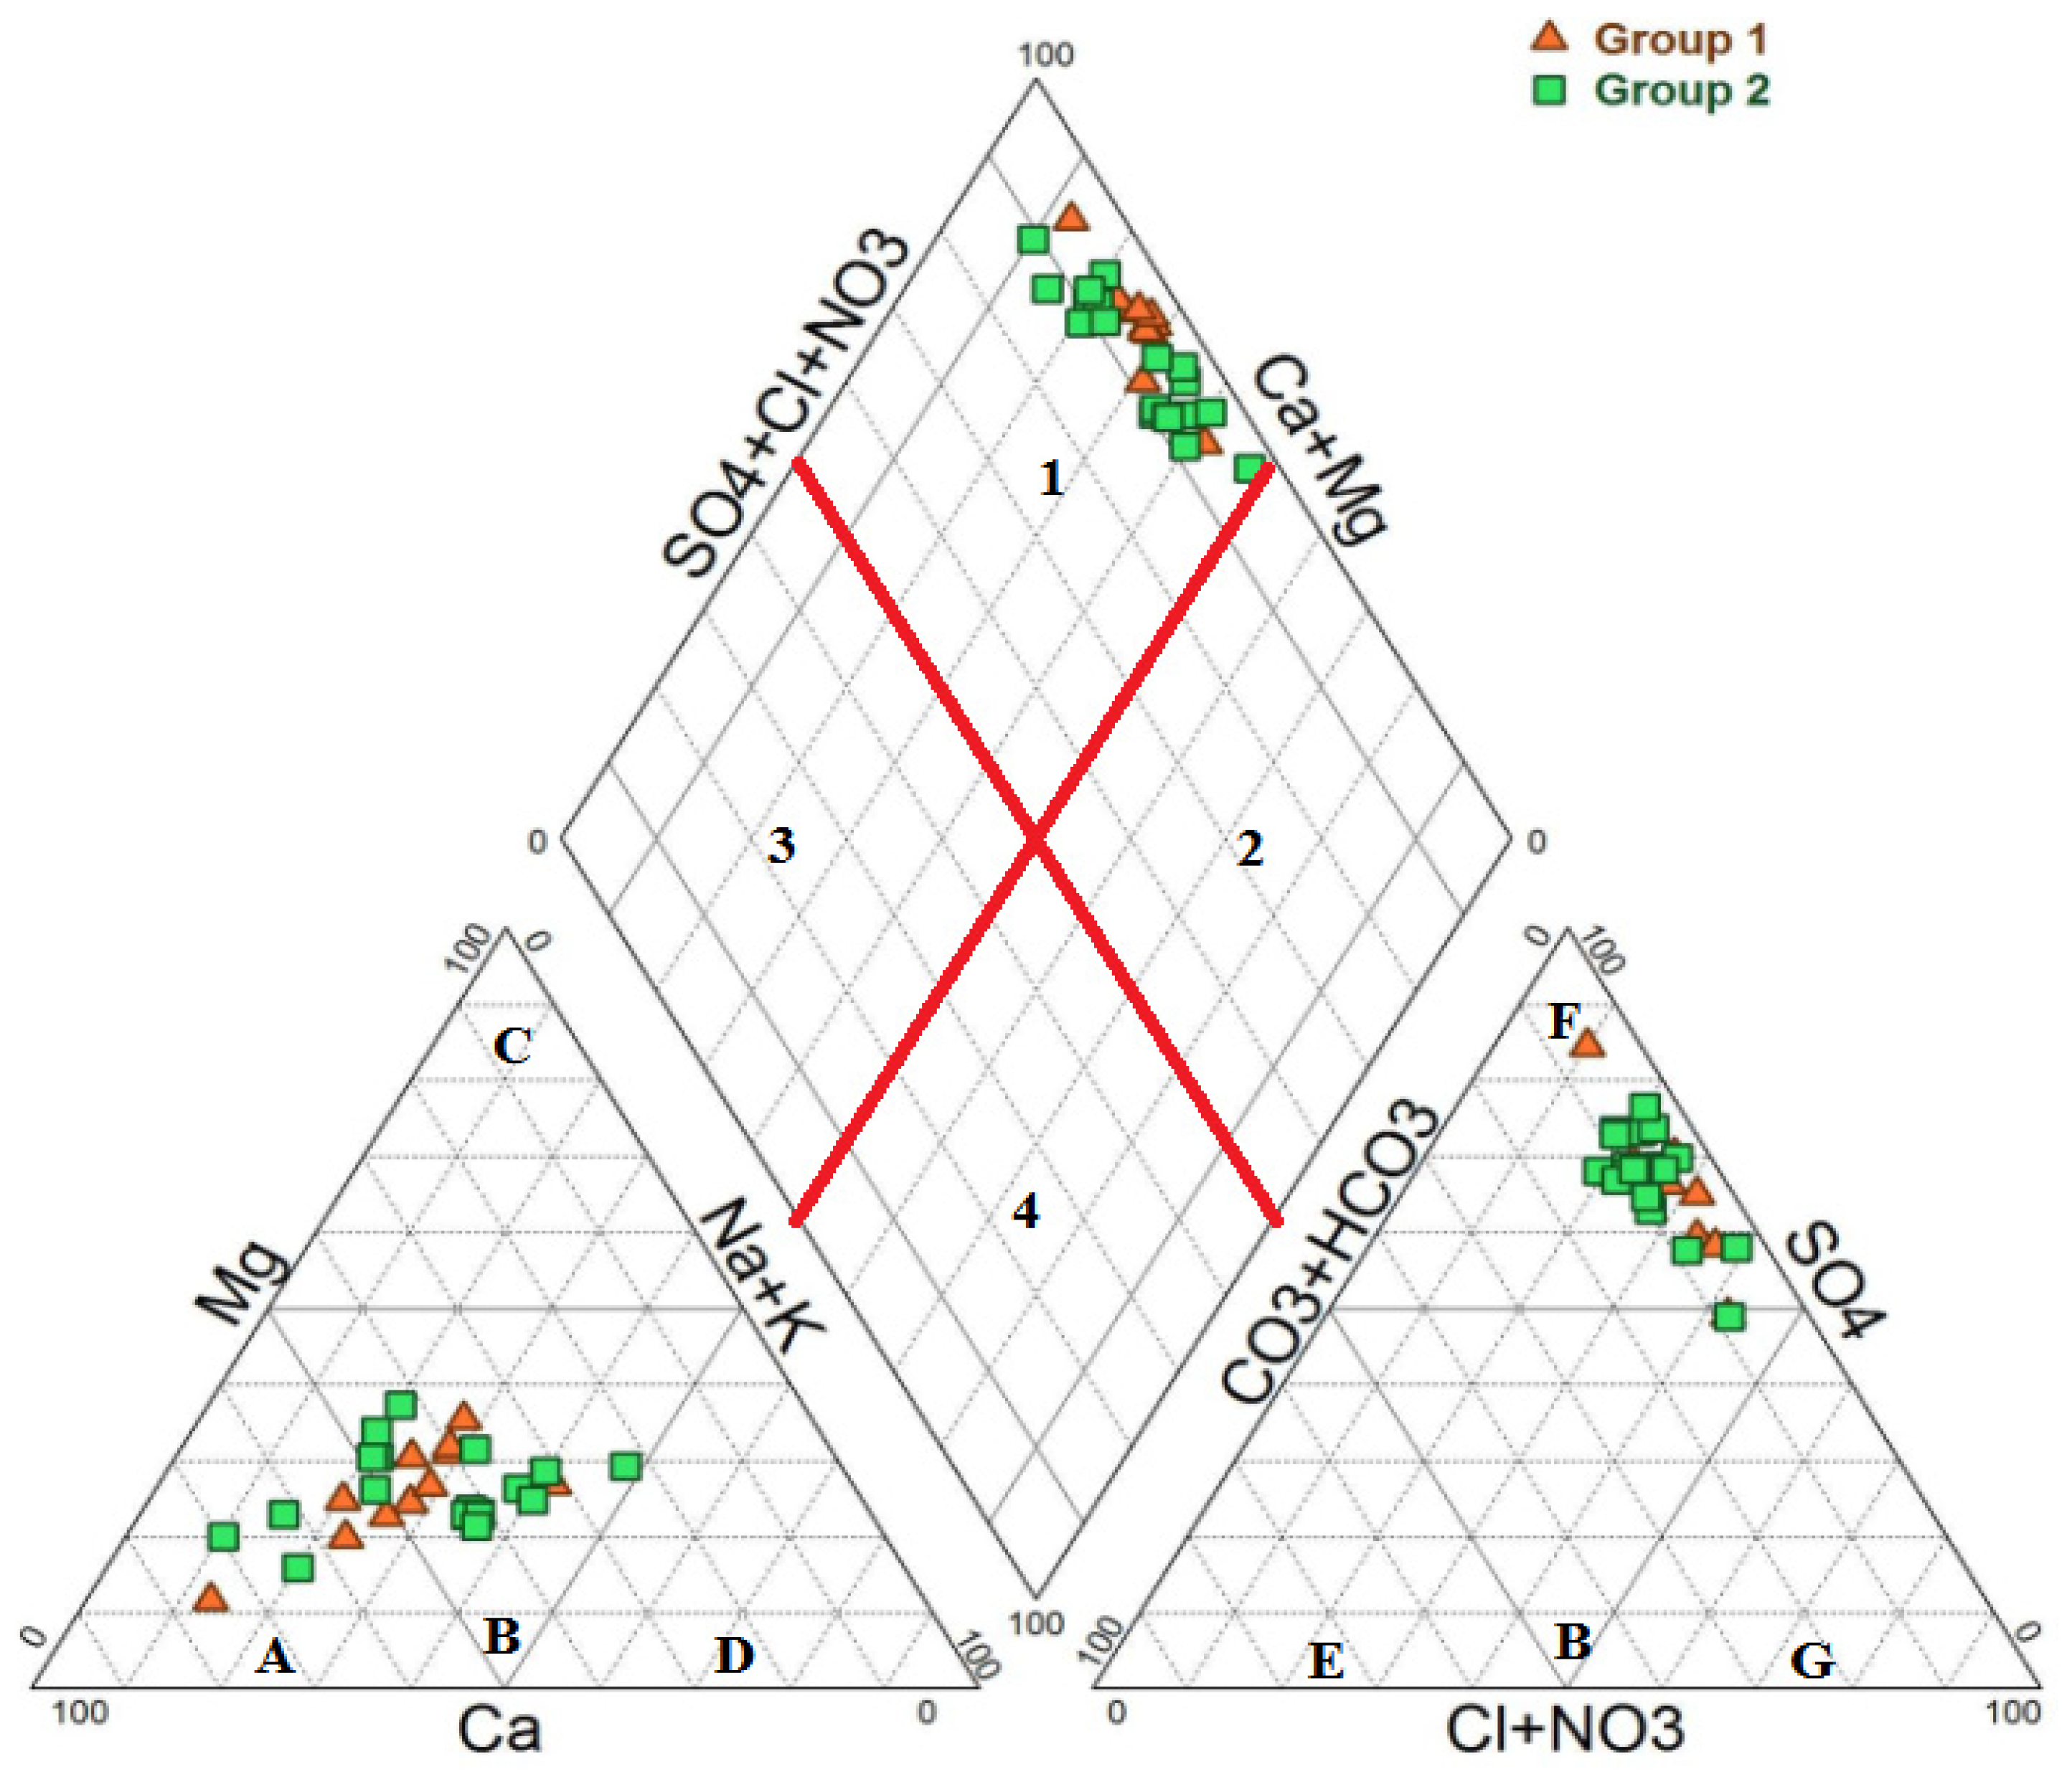
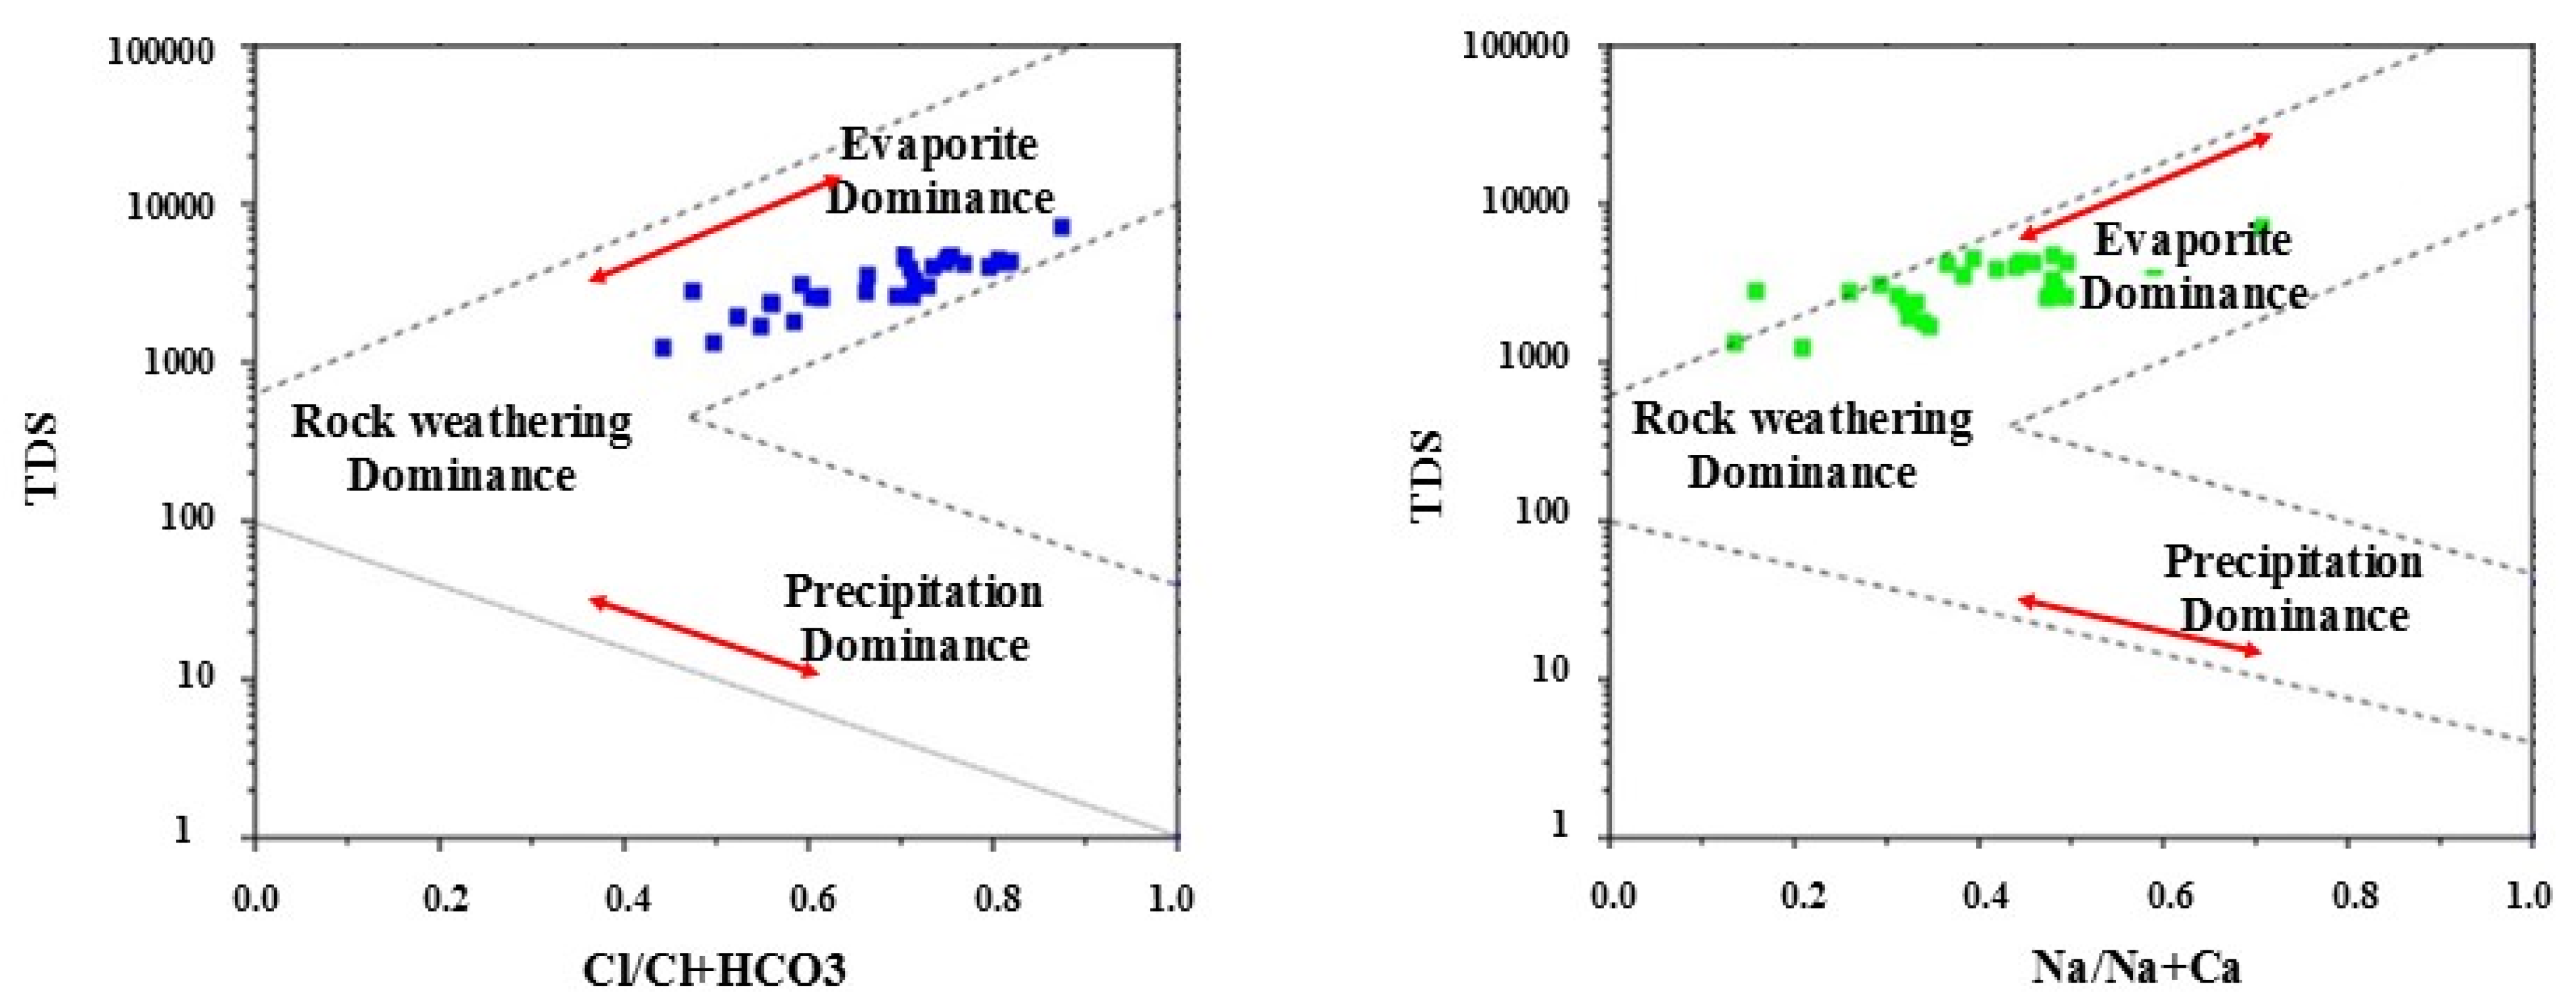
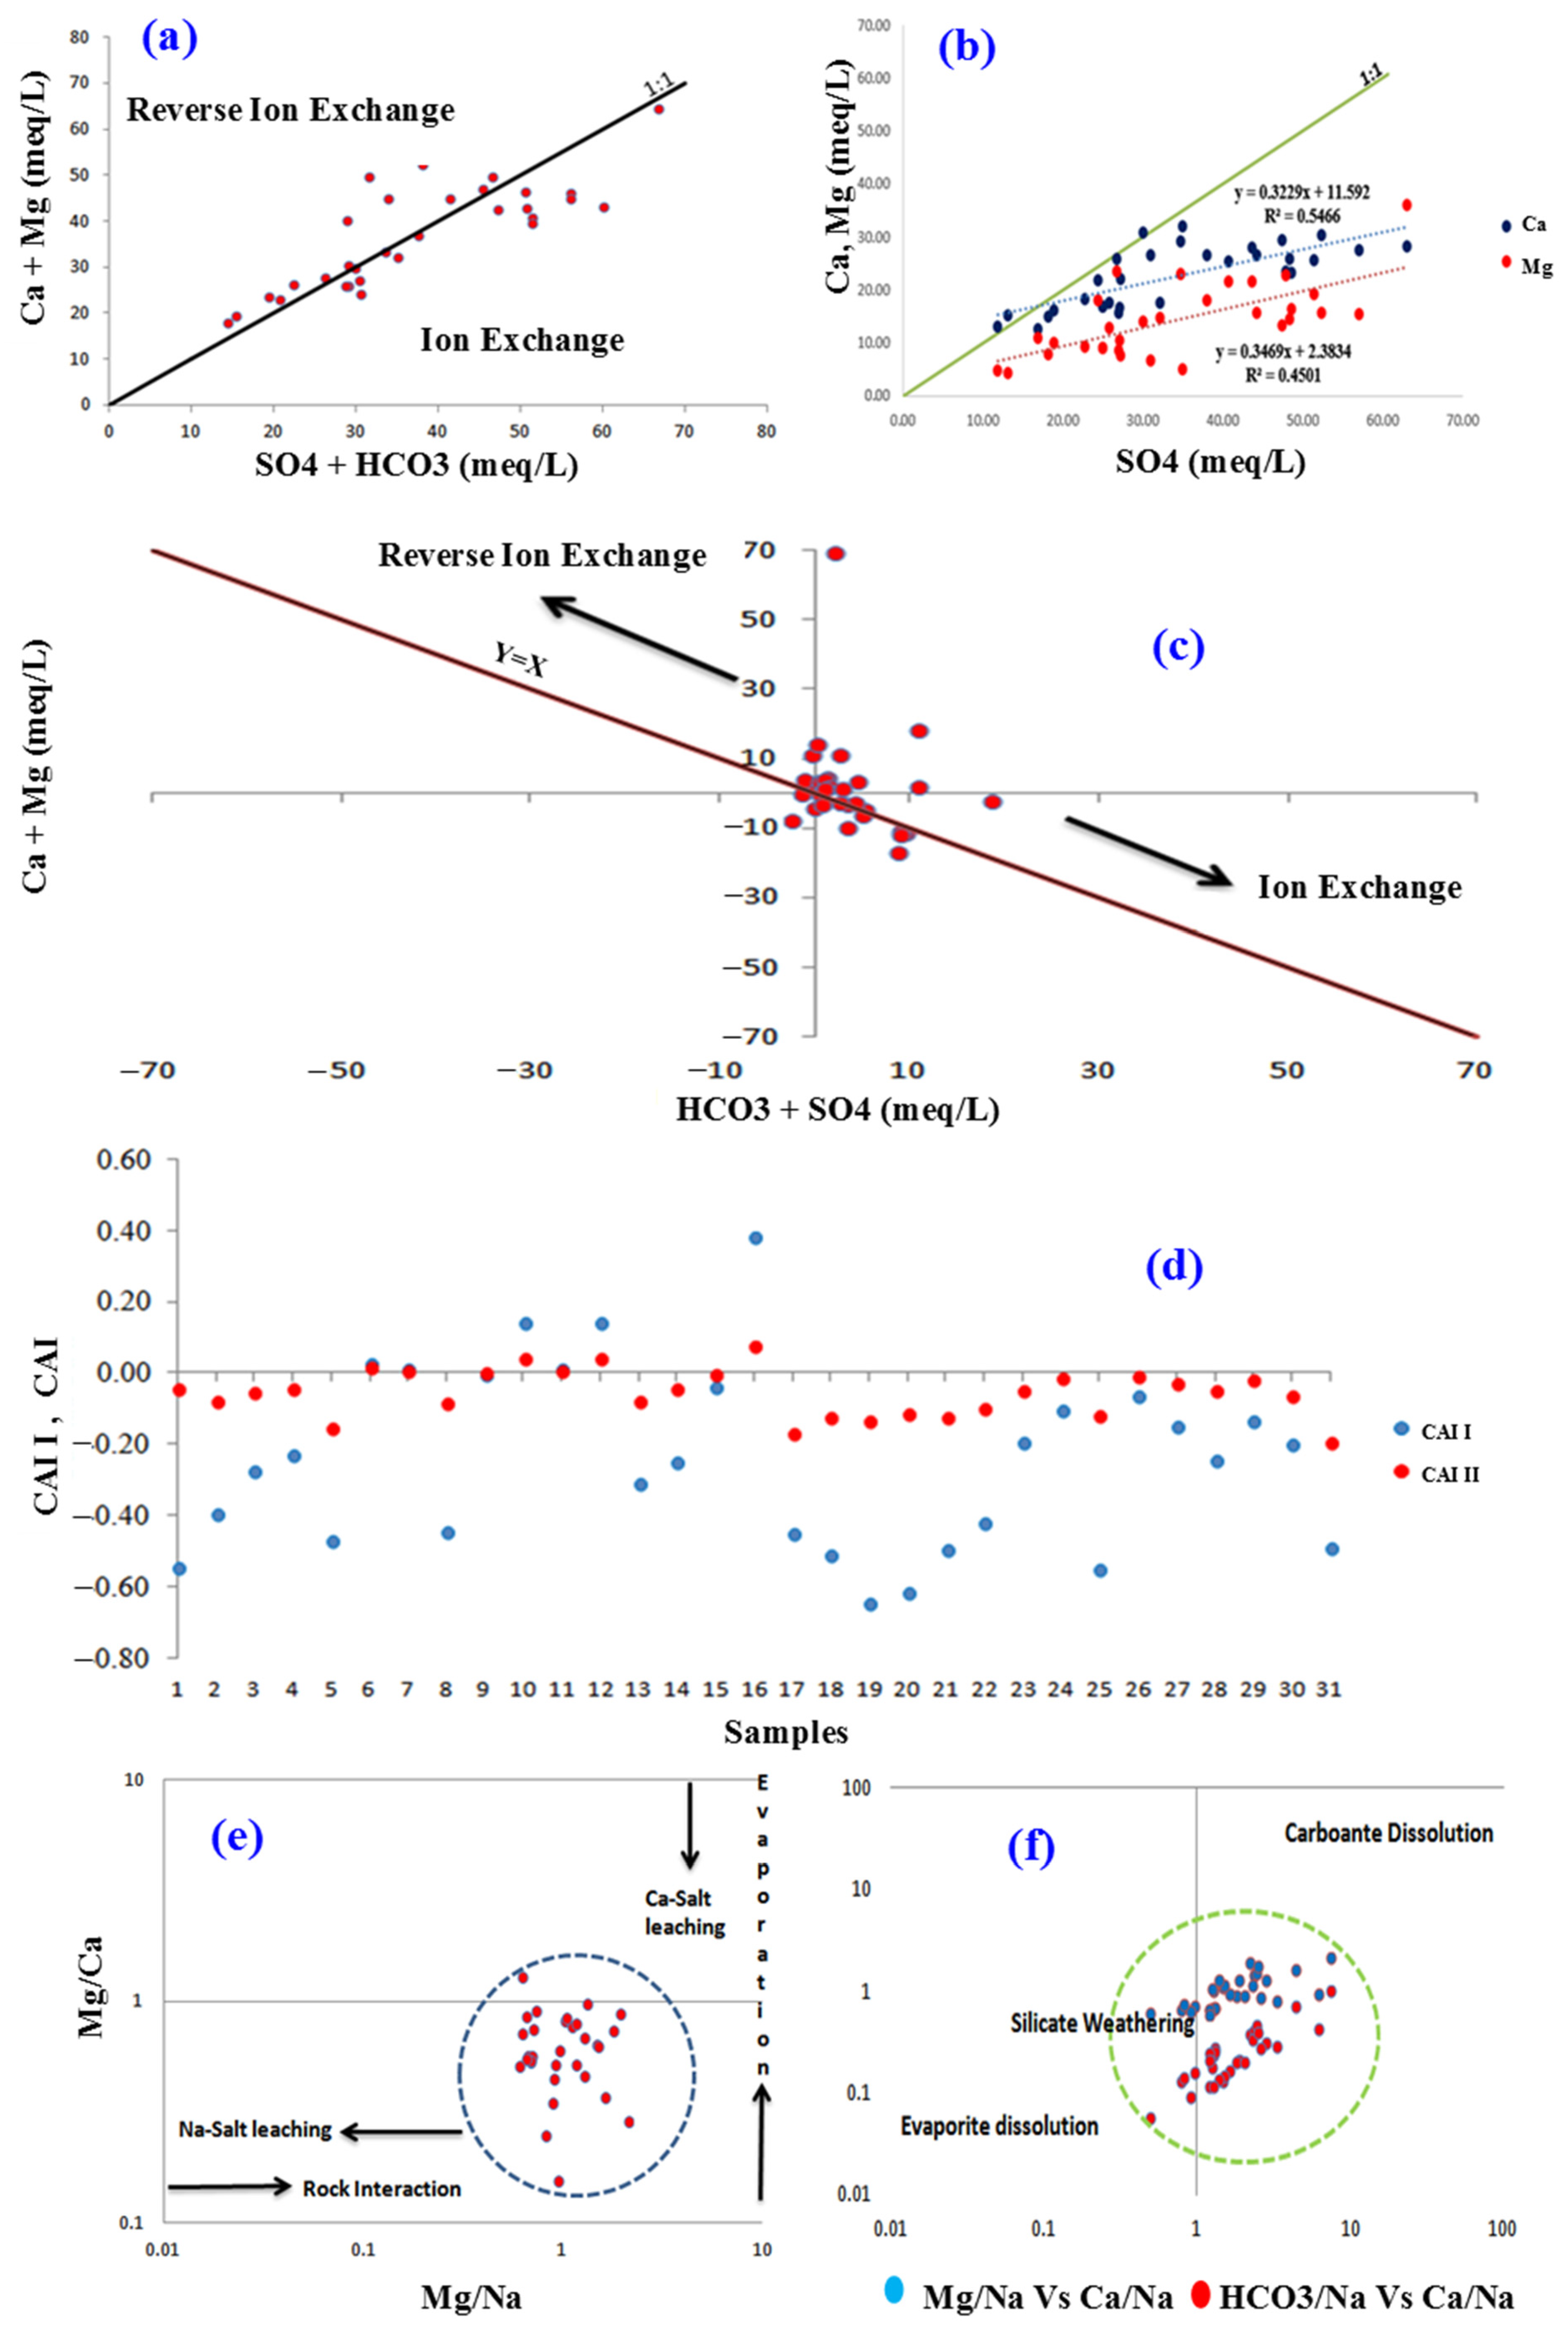
3.1. Hydrochemical Water Types and Groundwater Natural Evolution Mechanisms

The hydrochemical activities taking place in the aquifer may have an impact on the chemistry of groundwater [58]. The Piper diagram [59] (Figure 7) was used in this work to represent how key ions regulate the hydrochemical groundwater types. According to the cation–anion pairings, the plotting position reveals the relative composition of groundwater [60]. The Piper diagram’s diamond-shaped field demonstrates the existence of one of the main water types: Ca-Mg-SO4.
For a better understanding of hydrochemistry and to compare the water types, Chadha’s diagram [61] was plotted (Figure 8). In this study, all the samples are plotted in the sixth field, representing Ca2+–Mg2+–SO42− type, where Alkaline earths exceed alkali metals and strong acidic anions exceed weak acidic anions.
Gibbs plots [62] were used to investigate the main mechanisms influencing the development of water and the many hydrogeochemical processes regulating groundwater chemistry in the research region. Evaporation is a significant impact in the evolution of groundwater chemistry, as shown by the Gibbs plots (Figure 9), which show that all of the analyzed groundwater samples lie in the top half of the diagrams.
Other approaches are needed to reveal the origin and the relationship between the major elements, including: [Ca2+ + Mg2+] versus [SO42− + HCO3] (Figure 10a), [SO42−] versus [Mg2+/Ca2+] (Figure 10b), [Ca2+ + Mg2+] versus [HCO3 − SO42−] (Figure 10c), [Mg2+/Ca2+] versus [Mg2+/Na+] (Figure 10e), [Mg2+/Na+] versus [Ca2+/Na+] and [HCO3/Na+] versus [Ca2+/Na+] (Figure 10f) [63]. In order to recognize the ion exchange process between groundwater and aquifer minerals, both chloroalkaline indices were applied (CAI-I and CAI-II) (Equations (3) and (4); Figure 10d).
CAI I = Cl ( Na + +   K + ) Cl
CAI II = Cl ( Na + +   K + ) SO 4 2 +   HCO 3 +   CO 3 2 +   NO 3

3.2. Statistical Analysis

3.2.1. Correlation Analysis and Elementary Statistics

Furthermore, correlations between various chemical components and TDS and EC have been used extensively in studies of the acquisition of salinity mechanisms. When the samples’ physicochemical data were applied, Pearson’s correlation matrix showed a moderate to high correlation value (0.62–0.96) between EC, Ca2+, Mg2+, Cl, Na+, K+, and SO42− (Supplementary Materials). This demonstrates that these substances are the salinity’s primary constituents.
Coefficient of variation (Cv) is usually used to characterize the stability of the variable, which represents the ratio of the standard deviation (SD) to the mean. Where 0 < Cv < 10 percent for weak variation; 10% < Cv < 100% for moderate variability; and Cv > 100% strong variation [64]. In this study, the statistical analysis results of 31 groundwater samples from the study area are presented in Table 1.

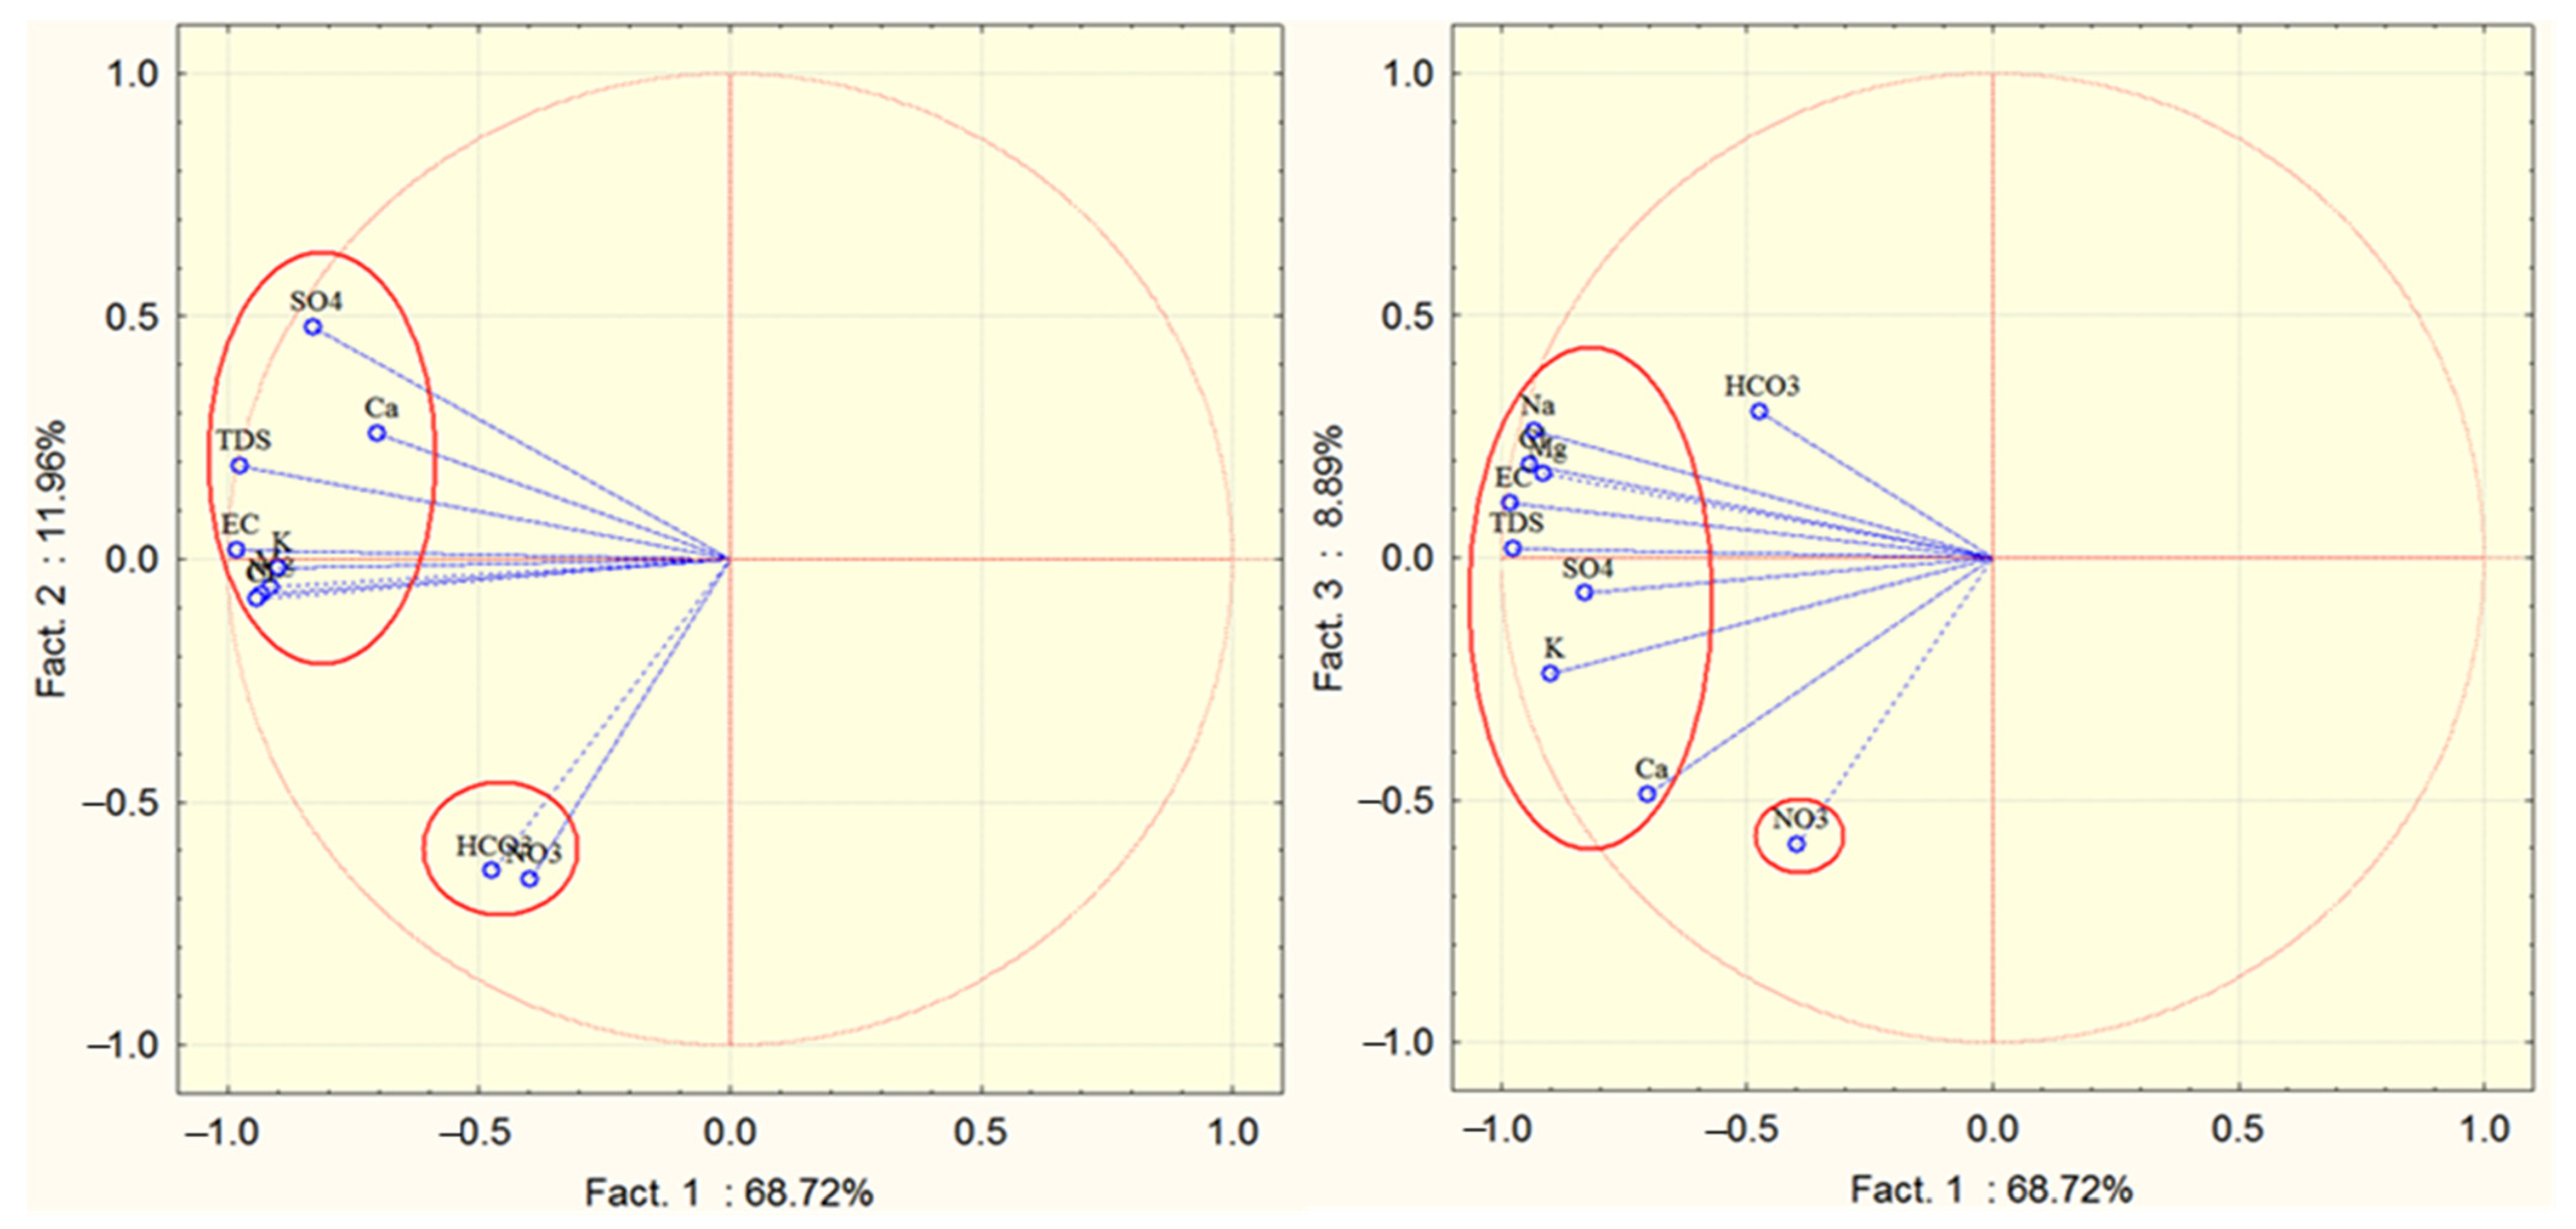
3.2.2. Principal Component Analysis (PCA)

In order to analyze the data from the 31 samples and 10 variables, PCA was used. More than 89.6% of the total variance was represented following the analysis on three factors, and Figure 11 shows the parameter weights for the three components from the PCA of the dataset. The percentage of variance, expressed by the first factor (68.72%), shows that there is a fairly good structure in the sampling carried out. This proves that many factors that affect the structure of the samples are linked to each other. This was reflected in the correlation matrix (Supplementary Materials), where there was a significant correlation between Na+, Cl, Mg2+, K+, SO42−, Ca2+, and conductivity/TDS. These correlations highlight the origin of the salinity of the water of the Plio Quaternary aquifer of Lioua.

3.2.3. Cluster Analysis (CA)

According to [65], to find clusters, we can use two alternative techniques, such as R- or Q-modes. R-mode is typically used with water quality factors to demonstrate how they interact (Figure 12). In the current study, the hydrogeochemical data are categorized using Ward’s approach as a linkage rule. One of the most often used metrics of the distance between samples is the Euclidean distance, which was utilized [50].
HCA was used to calculate the degree of similarity between the groundwater samples using a combination of Ward’s linkage technique and Euclidean distance. Figure 12 displays the spatial HCA dendrogram that was created. All variables were log-transformed and roughly matched normally distributed data for statistical reasons. The variables were then normalized to their respective standard scores (z-scores), as per [66]. The only criterion for choosing the groups in the Dendrogram is eye inspection because there is no specific test to establish the ideal number of groups in the dataset.

3.2.4. Time Series Analysis

Autocorrelation

The autocorrelation functions of selected hydrochemical parameters such as pH, Ca2+, Mg2+, HCO3, SO42−, Cl, Na+, K+, NO3 and EC are shown in Figure 13. The experimental variograms for each of the ten variables as well as the auto variogram were generated to evaluate the autocorrelation effect. Variogram functions were estimated overall (Figure 13).

Spectral Density

Spectral density functions of all the hydrochemical variables are displayed in Figure 14. The functions behave similarly, and their greatest peaks often have just one or two points. The correlograms of Mg2+, Na+, K+, Cl, and SO42− follow a pattern that is almost identical to that of EC.

4. Discussion

Several natural and anthropogenic factors can affect the evolution of groundwater chemistry. Thus, the application of statistical tools such as descriptive statistics, multivariate prospecting techniques, and time series has allowed us to understand the mechanisms of groundwater mineralization acquisition in the Lioua plain. The obtained results show that the mean temperature of the water was 22.7 °C with a minimum of 11.4 °C and maximum of 49.2 °C. The pH value in the study area ranges from 7.03 at F-03 to 8.16 at F-28 with a mean value of 7.64, indicating a weakly alkaline environment, as shown in Figure 5c. These values were found to be within the drinking water standards prescribed by the World Health Organization (WHO) [57], ranging from 6.5 to 8.5 (Table 1). The presence of calcium carbonate and magnesium carbonate contributes carbonate ions to the buffering system. Alkalinity is commonly related to hardness, as the main alkalinity source often comes from carbonate rocks (limestone), made up mostly of CaCO3 [67,68]. It is well known that the pH range of 6.5 to 7.5 is where the buffering of calcite occurs most frequently [69].
The estimation of total dissolved solids (TDS) is crucial for understanding the relationship between the environment and groundwater chemistry [70]. The suitability of groundwater with a TDS value above 3000 mg/L is often considered poor, while a TDS level above about 1000 mg/L exceeds the guideline value for human consumption, according to [57]. The average TDS for all subterranean water samples was 3333.45 mg/L, with F-17 recording the highest TDS at 7145 mg/L and F-26 the lowest at 1232 mg/L (Table 1). According to the classification of [71], the samples from the study area were classified as unsuitable for consumption and irrigation. The TDS spatial variation map (Figure 5a) shows that the TDS values increased in the southwestern and northeastern limits, which could be due to the geological characteristics and anthropogenic factors of the study area. The increase in the TDS coincides with the course of the Oueds of the study region Oued Bou-Mlih and Oued El-Ouzenn in the south-west and Oued Djedi, which crosses the plain from the south-west to the northeast. This configuration leads us to think that the runoff water towards the low points (Oueds) leads to their enrichment in dissolved salts by leaching of the saline soils before their infiltration in the basement via the Quaternary matrix. Likewise, it is known that excessive irrigation leads to increased water salinity, especially since the region is known for its intense agricultural activity.
Electrical conductivity (EC) is the measure of water’s ability to carry electrical current; it makes it possible to evaluate the total mineralization of the water. EC shows extremely variable values ranging from 10000 µS/cm measured at point F-30 in the southwest to 2000 µs/cm measured at point F-1 in the south-east, with an average value of 4370.97 µS /cm and a coefficient of variation (CV) of 37% (Table 1). However, all the samples’ values have been found to be above the guideline value for human consumption, as restricted to 1500 µS/cm according to [57]. Regarding the spatial variation of EC, the higher values were observed in the southwest and in a small area in the northeast of the study region (Figure 5b). This significant variation in electrical conductivity from one point to another shows heterogeneity in the distribution of the mineral load in the groundwater of the surface aquifer of the Plio Quaternary of the Lioua region, as in Figure 5b. This suggests the predominance of the phenomenon of the dissolution of salt minerals and the transport of agricultural inputs through the leaching of the land, which consequently leads to an increase in the mineral load in these waters. In the study area, soil salinization is serious and thus requires considerable attention.
Calcium is the preferred element of carbonate rocks. The most prevalent source of calcium in groundwater is limestone, which is created when precipitates of CaCO3 dissolve in sedimentary rocks during groundwater recharge [72,73]. The concentration of this element in groundwater is mainly controlled by the solubility of certain minerals such as carbonate minerals (calcite and dolomite), gypsum, or silicates [74]. Calcium ion concentration in our groundwater samples varied from 252 to 640 mg/L, with an average concentration of 452.71 mg/L (Table 1). The calcium values in all samples were above the guide value of 150 mg/L for drinking water, which was prescribed by [57]. The spatial variation map of Ca2+ (Figure 6a) indicates that the highest contents were located in the west and the east center of the study area. These concentrations indicate that these waters are influenced by the dissolution of gypsum formations (Equation (5)).
CaSO 4 + 2 H 2 O = Ca 2 + + SO 4 2 + 2 H 2 O
Magnesium comes from the dissolution of carbonate and salt formations. The ion exchange of ferromagnesium minerals in rocks and the water-induced dissolution of dolomite and soils can be used to explain the primary source of magnesium (Mg) in groundwater [75,76]. In the case of magnesium, the Mg2+ ions in water samples ranged from 52.8 to 439.2 mg/L (Figure 6b), with an average value of 172.61 mg/L in all groundwater samples of the study area (Table 1). The highest concentration was found in the F-11 (439.2 mg/L). For human consumption, the recommended magnesium content is 70 mg/L [57]. According to the spatial map of magnesium, 42% of our samples fall under the guide value for drinking water (Figure 6b). The waters of the Lioua plain are rich in magnesium, which leads us to consider that they were enriched following the dissolution of evaporites and salt formations such as clays—which are rich in Mg2+—during the recharge of the water table and the leaching of rich soils in magnesium minerals (Debdaba region).
Sodium is found in evaporites (halite NaCl, mirabilite Na2SO4 (10(H2O)). The presence of sodium is linked to the rapid dissolution of evaporitic formations rich in halite. The weathering of rock-forming minerals and agricultural activities may be the main sources of Na in groundwater [76]. Na+ concentration is in the range of 47.73 to 1358.54 mg/L, with an average of 373.16 mg/L. Only 29% of the samples have a Na concentration less than the value guide of drinking water quality of 200 mg/L (Table 1). As the spatial distribution map of sodium (Figure 6f), the highest Na concentration was located in the northeast (Debdaba region) parts of the study area, exactly in the F-30. These concentrations testify to a salt supply from the evaporites. Nevertheless, it is probable that during their journey, the groundwater may undergo mineralization in contact with the clays constituting the matrix of the Plio Quaternary aquifers of the region per the phenomenon of base exchange by fixing a Ca2+ ion after the release of two Na+ ions.
In general, potassium rarely exceeds 10 or 15 mg/l in natural waters. The weathering of potash feldspar minerals is likely what causes the greatest potassium concentrations [77]. The minimum and maximum concentrations of potassium in the groundwater samples of the study area varied from 5.01 to 25.63 mg/L, with an average of 12.02 mg/L (Table 1). Accordingly, [57] suggests the value guide of K in drinking water as 12 mg/L. Since the spatial distribution map of K (Figure 6e) revealed that 45% of samples in the study region fall below the value guide of [57] (Figure 6e). These potassium levels come from the alteration of potassic clays and the dissolution of chemical fertilizers (NPK), which are used massively by farmers in the region.
The alkalinity of groundwater is mostly caused by the presence of HCO3 and CO32− ions. The weathering of silicate rocks such as feldspar and the dissolution of carbonate rocks such as dolomite (CaMg(CO3)2) and calcite (CaCO3) in aquifers [78] and as described in Supplementary Materials are two significant sources of HCO3 ions in groundwater.
HCO3 concentrations are in the range of 129.32 to 283.04 mg/L, with an average of 187.6 mg/L. According to the spatial distribution map of bicarbonate in the study area (Figure 6c), all samples have HCO3 concentrations which exceed the value guide of 120 mg/L [57]. The research areas F-31 in the north-eastern portion of the study area had the greatest bicarbonate concentration (283.04 mg/L), while F-16 in the southwest portion of the study area had the lowest bicarbonate concentration (129.32 mg/L) (Figure 6c).
The presence of sulfate ions in water is linked to the dissolution of gypsum formations, the degradation of organic matter in the soil, and anthropogenic input (agricultural origin), expressed in Equation (6):
CaSO 4 + 2 H 2 O = Ca 2 + + SO 4 2 + 2 H 2 O
Corrosion may be impacted by groundwater with high concentrations of Cl and sulfate network systems for distributing water and phenomena [79]. The values of sulfates in water samples varied from 571.43 to 3028.57 mg/L, with an average of 1636.22 mg/L (Table 1). According to the spatial variation map (Figure 6g), the most significant concentrations of SO42− were observed in the southwestern parts of the study area. Moreover, all groundwater samples have SO42− concentrations that are higher than the drinking water quality guidelines offered in [57] (250 mg/L). The elevated SO42− contents, as presented in the spatial distribution map (Figure 6g), may be attributed to the dissolution of gypsum minerals and other anthropogenic influences.
The origin of chlorine is mainly linked to the dissolution of salt formations. Evaporites are the main source of this element. The effect of endorheic basins, the salting of roads, and wastewater discharges can also be the cause of this element [5]. In unconfined aquifers, the chloride concentration is directly related to the chloride content of precipitation. The concentrations measured in these systems depend on the lithology. In confined aquifers, high chloride contents are to be expected in the presence of evaporitic formations rich in chlorine [80]. Chloride concentrations for all groundwater samples ranged from 106.5–1462.6 mg/L, with an average value of 462.07 mg/L (Table 1). The highest contents (1462.6 mg/L) were registered in F-11 in the west-center part of the study area (Figure 6d). Of the groundwater samples, 74% had a Cl concentration above the drinking water quality guidelines outlined in [57]. The high chloride concentrations in the groundwater samples, in particular of the west-center part of the study area, may be due to salt inputs from evaporitic formations and probably from the agri-food industry in the region or linked to urbanization through wastewater discharges.
Nitrates can have several origins. The main anthropogenic activities that affect the high concentration of NO3 include return flow irrigation, extensive irrigation with excessive inorganic nitrogenous fertilizer application, and domestic and industrial discharges [5,81]. A high concern exists around nitrate pollution since it may harm ecosystems [82]. NO3 ion is a familiar pollutant in water [83]. The maximum value was obtained at F-6 at 153.44 mg/L and the lowest at 0.2 mg/L at F-12, with an average value of 37.13 mg/L in the groundwater of the study area (Table 1). For the spatial variation map (Figure 6h), the highest contents were observed in the central parts of the study area, which coincides with village Lioua and agricultural areas.
Cations are displayed in zones B and A in Figure 7, demonstrating that the groundwater in the study region is primarily of the calcium type and does not have a dominating type. Samples for anions are typically found in zone F, where the sulfate type is highly prevalent. All groundwater samples in the study area are plotted in zone 1, such that SO42−, Ca2+, and Mg2+ are the major ions. The examination of the molar concentrations of different elements in the area shows that the cations evolve as follows: Ca2+ > Mg2+ > Na+ > K+ while the anions evolve in the following manner: SO42− > Cl > HCO3 > NO3. The chemical profile is calcium and magnesium sulfate facies that appear due to the dissolution of evaporitic formations. The region’s lithology has a significant impact on the distribution of the principal ions (Ca2+, Mg2+, and SO42−), which are caused by anthropogenic factors such as irrigation water quality and unrestricted fertilization. The breakdown of calcium or magnesium sulfates can yield both calcium and magnesium. Dilution following mixing or precipitation of one of the ions can be used to change from one dominating ratio to another. The decomposition of organic matter in the soil and the addition of leachable sulfates to fertilizers in the intensively farmed parts of the Lioua plain are the first two clearly identified sources of SO42−, while the dissolution of gypsum is the second [84]. The presence of the evaporate sequence allows the dissolution of gypsum according to Equation (6) [85].
The results obtained from Chadha’s diagram are similar to the results obtained from the piper plot (Figure 7). Such water has permanent hardness and acquires its mineralization in the process of reverse ion exchange. Therefore, when irrigated, they do not deposit residual sodium carbonate.
Figure 9 shows that the Lioua region is in an arid climate zone and has a high evaporation rate, which causes the plots to diverge into the evaporation dominance zone (Figure 9). On the other hand, the Gibbs diagram cannot be used to describe the hydrochemical evolution processes of groundwater, which are also influenced by human activities [86]. However, it is clear that, with the enhancement of water levels induced by the intensification of irrigation and effective rainfall associated with the shallow water depth in the region, evaporation has become the main driver of ion concentration. In addition, the upper unsaturated but moist matrix especially at the approach of the saturated zone is rich in evaporites, which leads to the precipitation of evaporites by evaporation that is eventually leached into the saturated zone. Consequently, all of this leads to an increase in salinity (TDS max = 7145 mg/L), as the water level rises, groundwater evaporation becomes more severe and sulfate groundwater is more affected by evaporation than bicarbonate groundwater [5]. Other studies that have verified the sulfate type of groundwater experiencing intense evaporation in the alluvial plain lend weight to this conclusion [87].
As shown in Figure 10a, both reverse ion exchange and ion exchange affect the aquifer chemistry in the study area of Lioua. The samples are close to the 1:1 line, indicating that the dissolutions of calcite, dolomite, and gypsum are the prevalent reactions in the system of the study region. Those under the 1:1 line exhibit the processes of ion exchange, where Ca2+ is retained in the soil and the Na+ is returned in the groundwater. Inversely, those above line 1:1 exhibit the reverse ion exchange, where the Ca2+ is emitted into the groundwater and the Na+ is retained in the soil. The samples above line 1:1, are enriched in calcium and magnesium. Therefore, this suggests that the dissolution of Ca2+ and Mg2+ from evaporites is greater than from carbonates. The Ca2+, Mg2+, and SO42− contents are more related to the dissolution of evaporites, essentially gypsum, anhydrite, and magnesium sulfate. According to Appelo and Postma [88], the presence of sulfates in large amounts in groundwater could also be attributed to the dissolution of the anhydrite and pyrite. On average, the contribution of direct ion exchange and reverse ion exchange reactions is almost equal.
Figure 10b shows the ratio of Ca2+/SO42− and Mg2+/SO42−. A high correlation between Ca2+ and SO42− was found, with a value correlation coefficient of 0.74 and that of Mg2+ and SO42− is 0.67. In the scatter plot between SO42− and Ca2+ (Figure 10b), most of the samples were below the equiline (1:1), indicating the gypsum and anhydrite dissolution in groundwater [89]. The samples that showed results far from the 1:1 line indicate another source of SO42−, such as mineral weathering, ion exchange reactions, and agricultural activities.
In addition, the ion exchange mechanism commonly used to determine the occurrence of cation exchange processes is studied by plotting (Ca2+ + Mg2+ − HCO3 − SO42−) versus (Na+ − Cl) [63]. It is agreed that the excess (Ca2+ + Mg2+) could be related to sources other than carbonate and gypsum. Most water samples are close to the y = −X line (Figure 10c) and only a few points deviate from this relationship, indicating that cation exchange plays a nontrivial role in controlling the hydrochemical components of groundwater. Excess Ca2+ can exchange Na+ from aquifer minerals, resulting in increased Na+ in the groundwater.
Chloroalkalinity has been used to identify the ion exchange mechanism between groundwater and aquifer minerals. In general, Ca2+ and Mg2+ in the aquifer matrix exchange with Na+ and K+ in groundwater. Both chloroalkaline indices are negative when there is an ion exchange between Ca2+ or Mg2+ in the groundwater and Na+ and K+ in the aquifer material, and positive when there is a reverse ion exchange. Na+ and K+ levels in the groundwater fall in the Lioua system, indicating direct ion exchange. Only seven of the groundwater samples had positive CAI values in CAI-1 and CAI-2 (Figure 10d). Therefore, the main cation exchange process involves the exchange of Ca2+ and Mg2+ with Na+ and K+.
Our research has revealed that magnesium is a minor component of soil salts and does not precipitate during the early stages of low silica water evaporation because its concentrations in water are only predicted to increase as magnesium is released from ferromagnesium minerals in the bedrock during chemical weathering [90,91,92]. As a result, the influence of soil salt leaching and salt precipitation during the initial stages of water evaporation will not modify the concentration of magnesium. The groundwater in the research area is one rocky zone plot according to the Mg2+/Cations pattern (Figure 10e). The samples were found in the rock-dominated zone and had average Mg2+/Na+ and Mg2+/Ca2+ ratios (Figure 10e). The plot shows that the major ions in the study area are different from the interactions between the water and the rocks, whereas soil–salt leaching may be a subdominant process and evaporation is only a minor process.
Mineral dissolution is likely to be the primary natural activity in charge of the principal solutes in natural water [92]. A Na-normalized molar ratio has been suggested by Gaillardet et al. [93] as a way to represent various hydrochemical processes under non-mixed conditions. The Na-normalized Ca2+ versus Mg2+ plot and Na-normalized Ca2+ versus HCO3 diagrams demonstrate how water–rock interactions, including silicate weathering and mild carbonate dissolution, affect the natural water samples in the Lioua plain. Figure 10f demonstrates that the main method used to regulate the concentration of groundwater solutes was silicate weathering.
When there are fewer components, PCA results are more effective [94]. Of the variance, 68.72% is explained by factor 1, which has highly negative loadings in EC, TDS, Cl, Na+, Mg2+, Ca2+, K+, and SO42−, according to the factorial analysis, which were −0.98, −0.97, −0.94, −0.93, −0.91, −0.89, −0.70 and −0.82, respectively (Supplementary Materials). High EC and TDS scores are the outcome of lithologic variables and numerous hydrogeochemical processes controlling them (mineralized water). On the F1–F2 factorial plan (Figure 11), the factor F1 is determined negatively by TDS, EC, Cl, Na+, Mg2+, SO42−, K+, and Ca2+, which highlight the origin of the salinity by weathering of silicate, limestone, halite, and gypsum, pyrite dissolution and various ion exchange processes in the water system [95]. Therefore, the factor can be termed a salinization factor.
Factor 2 has substantial negative loadings in NO3 and HCO3, which were −0.66 and −0.64 (Figure 11), and accounts for 11.96% of the dataset’s overall variance. This indicates that the element has no effect on the overall mineralization of the water, predicts the origin of HCO3 as a result of weathering of carbonates, and may indicate the impact of acid–base equilibrium conditions on the chemistry of groundwater [96].
On the factorial plane F1–F3, factor 3 explains 8.89 % of the total variance of the dataset (Figure 11) and shows significant negative loading in NO3 (−0.59), which predicts the association of this factor with chemical fertilizers, animal waste, crop residues and mineralization of soil and non-agricultural sources such as septic tanks or deep water mixing with surface water. As we know, long-term applications of huge volumes of fertilizer, including urea and commercial composite, which is a significant component of the return flow from the development of irrigation, have been made. The nitrification process quickly converts NH4+, the primary component of fertilizers, to NO3 in hazardous conditions [97], as reported in Equation (7).
NH 4 + + 2 O 2 =   NO 3 +   H 2 O   + 2 H +
The dendrogram of the ten physicochemical parameters (Ca2+, Mg2+, Na+, K+, Cl, HCO3, SO42−, NO3, EC and TDS) can be divided into three main groups (Figure 12) and reveals that TDS and EC can be the major elements of distinction between parameters. G1 reveals a close association with SO42−, K+, Ca2+, and TDS, which reflects the major predominance of these elements in the chemical composition of groundwater in the region (sulfates and anhydride, calcium sulfates). This is clearly visible by the calcium sulfate chemical facies. Similarly, group G1 shows a distant association between K+ and Ca2+, which reflects the probably different origins of these two elements. G2 reveals a close association between Na+, Cl, Mg2+, and EC, which reflects the major participation of salts and chlorides in the electrical conductivity of water. The G1 and G2 together reflect the dominance of the lithological factor in the overall mineralization of the waters of the Plio Quaternary surface aquifer of Lioua. G3 shows the dissociation of bicarbonates and nitrates from other chemical elements present in groundwater, which reflects the different origins of these two elements, carbonated for HCO3 and anthropogenic for NO3. It should be noted that these analyses corroborate well with the results of the analysis of the correlation matrix between variables.
The autocorrelation functions of pH recorded a high number. This is an indicator of the pH’s weak relationship to various other factors [98]. On the other hand, the autocorrelation functions of Mg2+, SO42−, Cl, Na+, K+, and EC displayed a sine-wave pattern. Therefore, throughout the study period, specific factors had significant associations. However, mean autocorrelation coefficients decrease slowly from 0.7 to −0.3 for pH and Ca2+. Obtained results show a mean linear relationship of Mg2+, EC, K+, Na+, SO42−, and Cl autocorrelation. Furthermore, the parameters NO3 and HCO3 are an indicator of the uncorrelated characteristics with other parameters. In the study area, the NO3 resulted from human activity—fertilizer and domestic sewage. However, HCO3 resulted from the carbonate facies outcrops, [99] also report these results.
Spectral density functions of all the hydrochemical variables have shown that the salinity was affected by these elements and that EC showed a more important role in the quality of groundwater. The preparation of activated carbon from wooden or other materials has helped to receive efficient adsorbents for the removal of pollutants from water [100,101]. pH, Ca2+, HCO3 and NO3 exhibit multiple peaks, which means that several distinct cyclic mechanisms are present [102]. The multiple peaks of these elements initiated the anthropogenic activity of fertilizer, the carbonate facies domestic sewage, and outcrops [103,104].

5. Conclusions

In this study, the hydrochemistry of Lioua’s groundwater in Algeria’s Lower Sahara was experimentally explored using chemometrics methods. The aim was to deduce the geochemical processes influencing the chemical composition and to determine chemical elements’ origins. The multivariate statistical analysis and time series approaches were used. Principal component analysis (PCA) and cluster analysis (CA) were applied when autocorrelation analysis supplemented by simple spectral density analysis was used as time series methods. The main finding obtained is that PCA showed the three most important parameters proving a total overall variance (TV) of 85.01 %. Factors 1, 2, and 3 are 68.72, 11.96 and 8.89 % of TV. Those results indicate that the dissolution of evaporated mineral deposits, evaporation, and water–rock interaction processes are processes of a geochemical nature that influence the chemical composition. Within the CA, tree parameters are regulated by the EC and TDS. G1 showed a high correlation with K+, SO42−, TDS, and Ca2+, and G2 showed a high correlation between Cl, Na+, EC, and Mg2+. G3 showed the bicarbonates dissociation and NO3 formation from other geochemical processes. These results indicate that the groundwater also exhibits two bipolar characteristics, one recorded with negative and positive charges on pH and on Ca+ and another recorded only with negative charges on HCO3 and NO3. The autocorrelation analysis showed a linear relationship of Mg2+, EC, K+, Na+, SO42−, and Cl. While HCO3 and NO3 indicated that no correlation with characteristics of parameters from other compounds were seen. In addition, SDA shows that the correlograms of Mg2+, K+, Na+, SO42−, and Cl had a similar correlation toward EC. However, Ca2+, pH, NO3 and HCO3 showed multiple high values, possibly due to the existence of various distinct factors. The main participation of chlorides and other salts was due to the water’s electrical conductance. The combination of autocorrelation analysis and simple spectral density analysis results confirm the following findings: firstly, the prevalence of factors such as lithology in the mineralization of surface aquifer waters from the Plio Quaternary; secondly, that the presence of NO3 and HCO3 are from various sources—specifically, that carbonatization for HCO3 originates from carbonate while NO3 originates from human activities; thirdly, that the salinity levels were varied by SO42−, Mg2+, Na+, Cl, EC and K+; and, finally, that HCO3, Ca2+, and NO3 enter the system from the agricultural use of fertilizers, and the carbonate facies from domestic sewage and outcrops. The results shown in the current study help elucidate the possibilities of the chemometrics methods when applied to hydrochemistry.

Supplementary Materials

The following supporting information can be downloaded at: https://www.mdpi.com/article/10.3390/su15010020/s1, Table S1: Matrix of correlation of variables. Table S2: Factor-variable correlations (factor loadings), based on correlation analysis. Equations (S1) and (S2).

Author Contributions

Conceptualization, A.A. and A.G.; methodology, A.G., J.B., A.E.K. and I.Z.; software, H.A.A.; validation, A.A., A.G. and H.A.A.; formal analysis, A.A. and A.G.; investigation, A.A.; resources, A.A. and A.G.; data curation, S.B. and A.E.K.; writing—original draft preparation, A.G. and H.A.A.; writing—review and editing, H.A.A., S.B., J.B., I.Z. and A.E.K.; visualization, S.B., J.B. and I.Z.; supervision, A.E.K.; project administration, A.A.; funding acquisition, H.A.A., J.B., A.E.K. and I.Z. All authors have read and agreed to the published version of the manuscript.

Funding

The work was supported by the PASIFIC program GeoReco project funding from the European Union’s Horizon2020 research and innovation program under the Marie Sklodowska-Curie grant agreement No. 847639 and from the Ministry of Education and Science. A.E. Krauklis’ contribution was supported by the LZP Project Nr. lzp-2021/1-0090 CircleP. The research was conducted under the collaborative project ‘Identifying best available technologies for decentralized wastewater treatment and resource recovery for India (SARASWATI 2.0)’; co-funding from the European Commission within the Horizon 2020 Framework Program (grant agreement number 821427) and from the Government of India (Department for Science and Technology) is gratefully acknowledged and SLTKT20427 “Sewage sludge treatment from heavy metals, emerging pollutants and recovery of metals by fungi” and by PLTKT ARENG53. This study was also supported by the Ministry of Higher Education and Scientific Research of Algeria (MESRS) and the General Direction (DGRSDT).

Institutional Review Board Statement

Not applicable.

Informed Consent Statement

Not applicable.

Data Availability Statement

The datasets used and/or analyzed during the current study are available from the corresponding author upon a reasonable request.

Acknowledgments

Many thanks are addressed to the MESRS and the DGRSDT. Andrey is grateful to Oksana.

Conflicts of Interest

The authors declare that they have no competing interest. The funders had no role in the design of the study; in the collection, analyses, or interpretation of data; in the writing of the manuscript, or in the decision to publish the results.

References

  1. Burlakovs, J.; Lacis, D. The Developmental Trends of Groundwater Horizon Surface Depression and Sea Water Intrusion Impact in Liepaja City. In Proceedings of the SGEM2012 Conference Proceedings, Albena, Bulgaria, 12–13 June 2012. [Google Scholar]
  2. Gul, S.; Gul, H.; Gul, M.; Khattak, R.; Rukh, G.; Khan, M.S.; Aouissi, H.A. Enhanced Adsorption of Rhodamine B on Biomass of Cypress/False Cypress (Chamaecyparis Lawsoniana) Fruit: Optimization and Kinetic Study. Water 2022, 14, 2987. [Google Scholar] [CrossRef]
  3. Travi, Y. Hydrogéologie et hydrochimie des aquifères du Sénégal. Hydrogéochimie du fluor dans les eaux souterraines. Sci. Géol. Bull. Mém. 1993, 1, 95. [Google Scholar]
  4. Xu, P.; Zhang, Q.; Qian, H.; Zheng, L. Spatial Distribution Characteristics of Irrigation Water Quality Assessment in the Central-Western Guanzhong Basin, China. IOP Conf. Ser. Earth Environ. Sci. 2021, 647, 012143. [Google Scholar] [CrossRef]
  5. Athamena, A.; Menani, M.R. Nitrogen Flux and Hydrochemical Characteristics of the Calcareous Aquifer of the Zana Plain, North East of Algeria. Arab. J. Geosci. 2018, 11, 356. [Google Scholar] [CrossRef]
  6. Vincevica-Gaile, Z.; Sachpazidou, V.; Bisters, V.; Klavins, M.; Anne, O.; Grinfelde, I.; Hanc, E.; Hogland, W.; Ibrahim, M.A.; Jani, Y.; et al. Applying Macroalgal Biomass as an Energy Source: Utility of the Baltic Sea Beach Wrack for Thermochemical Conversion. Sustainability 2022, 14, 13712. [Google Scholar] [CrossRef]
  7. Boudoukha, A.; Athamena, M. Caractérisation des eaux thermales de l’ensemble Sud sétifien. Est. Algérien. Rseau 2012, 25, 103–118. [Google Scholar] [CrossRef] [Green Version]
  8. Belalite, H.; Menani, M.R.; Athamena, A. Calculation of Water Needs of the Main Crops and Water Resources Available in a Semi-Arid Climate, Case of Zana-Gadaïne Plain, Northeastern Algeria. Alger. J. Environ. Sci. Technol. 2022, 8, 2477–2488. [Google Scholar]
  9. Gaagai, A.; Aouissi, H.A.; Krauklis, A.E.; Burlakovs, J.; Athamena, A.; Zekker, I.; Boudoukha, A.; Benaabidate, L.; Chenchouni, H. Modeling and Risk Analysis of Dam-Break Flooding in a Semi-Arid Montane Watershed: A Case Study of the Yabous Dam, Northeastern Algeria. Water 2022, 14, 767. [Google Scholar] [CrossRef]
  10. Al-Barakah, F.N.; Aly, A.A.; Abaakhel, E.H.S.; Al-Rizkid, A.M.; Alghamdi, A.G.; Al-Sewailem, M.S. Comparison and Hydrochemical Characterization of Groundwater Resources in the Arabian Peninsula: A Case Study of Al-Baha and Al-Qassim in Saudi Arabia. Water Resour. 2020, 47, 877–891. [Google Scholar] [CrossRef]
  11. Mfonka, Z.; Kpoumié, A.; Ngouh, A.N.; Mouncherou, O.F.; Nsangou, D.; Rakotondrabe, F.; Takounjou, A.F.; Zammouri, M.; Ngoupayou, J.R.N.; Ndjigui, P.-D. Water Quality Assessment in the Bamoun Plateau, Western-Cameroon: Hydrogeochemical Modelling and Multivariate Statistical Analysis Approach. J. Water Resour. Prot. 2021, 13, 112–138. [Google Scholar] [CrossRef]
  12. Awasthi, A.; Rishi, M.S.; Panjgotra, S. Groundwater Quality Assessment for Drinking and Industrial Purposes in Transboundary Aquifers of Gurdaspur District, Punjab, India. Int. J. Environ. Anal. Chem. 2021, 3, 1–15. [Google Scholar] [CrossRef]
  13. Khelifi, W.; Bencedira, S.; Azab, M.; Riaz, M.S.; Abdallah, M.; Abdel Baki, Z.; Krauklis, A.E.; Aouissi, H.A. Conservation Environments’ Effect on the Compressive Strength Behaviour of Wood–Concrete Composites. Materials 2022, 15, 3572. [Google Scholar] [CrossRef] [PubMed]
  14. Singh, P.; Rishi, M.S.; Kaur, L. Multi-Parametric Analysis of Groundwater Quality to Assess Human Health Risk and Hydrogeochemical Processes in an Agriculturally Intensive Alluvial Aquifer of Northwest India. Int. J. Environ. Anal. Chem. 2022, 1–19. [Google Scholar] [CrossRef]
  15. Krauklis, A.E.; Kreicbergs, I.; Dreyer, I. Modified Ginstling-Brounshtein Model for Wet Precipitation Synthesis of Hydroxyapatite: Analytical and Experimental Study. Acta Bioeng. Biomech. 2018, 20, 47–57. [Google Scholar]
  16. Belhadj, M.Z.; Boudoukha, A.; Amroune, A.; Gaagai, A.; Ziani, D. Statistical characterization of groundwater quality of the northern area of the basin of hodna, m’sila. southeastern algeria. Larhyss J. 2017, 31, 177–194. [Google Scholar]
  17. Herojeet, R.; Rishi, M.S.; Lata, R.; Dolma, K. Quality Characterization and Pollution Source Identification of Surface Water Using Multivariate Statistical Techniques, Nalagarh Valley, Himachal Pradesh, India. Appl. Water Sci. 2017, 7, 2137–2156. [Google Scholar] [CrossRef]
  18. Rajkumar, H.; Naik, P.K.; Rishi, M.S. Evaluation of Heavy Metal Contamination in Soil Using Geochemical Indexing Approaches and Chemometric Techniques. Int. J. Environ. Sci. Technol. 2019, 16, 7467–7486. [Google Scholar] [CrossRef]
  19. Aouissi, H.A.; Petrişor, A.-I.; Ababsa, M.; Boştenaru-Dan, M.; Tourki, M.; Bouslama, Z. Influence of Land Use on Avian Diversity in North African Urban Environments. Land 2021, 10, 434. [Google Scholar] [CrossRef]
  20. Belkhiri, L.; Narany, T.S. Using Multivariate Statistical Analysis, Geostatistical Techniques and Structural Equation Modeling to Identify Spatial Variability of Groundwater Quality. Water Resour. Manag. 2015, 29, 2073–2089. [Google Scholar] [CrossRef]
  21. Gaagai, A.; Boudoukha, A.; Boumezbeur, A.; Benaabidate, L. Hydrochemical Characterization of Surface Water in the Babar Watershed (Algeria) Using Environmetric Techniques and Time Series Analysis. Int. J. River Basin Manag. 2017, 15, 361–372. [Google Scholar] [CrossRef]
  22. Meng, S.X.; Maynard, J.B. Use of Statistical Analysis to Formulate Conceptual Models of Geochemical Behavior: Water Chemical Data from the Botucatu Aquifer Is Sao Paulo State, Brazil. J. Hydrol. 2001, 250, 78–97. [Google Scholar] [CrossRef]
  23. Farnham, I.M.; Stetzenbach, K.J.; Singh, A.K.; Johannesson, K.H. Deciphering Groundwater Flow Systems in Oasis Valley, Nevada, Using Trace Element Chemistry, Multivariate Statistics, and Geographical Information System. Math. Geol. 2000, 32, 943–968. [Google Scholar] [CrossRef]
  24. Roubil, A.; El Ouali, A.; Bülbül, A.; Lahrach, A.; Mudry, J.; Mamouch, Y.; Essahlaoui, A.; El Hmaidi, A.; El Ouali, A. Groundwater Hydrochemical and Isotopic Evolution from High Atlas Jurassic Limestones to Errachidia Cretaceous Basin (Southeastern Morocco). Water 2022, 14, 1747. [Google Scholar] [CrossRef]
  25. Lu, Y.; Tang, C.; Chen, J.; Chen, J. Groundwater Recharge and Hydrogeochemical Evolution in Leizhou Peninsula, China. J. Chem. 2015, 2015, e427579. [Google Scholar] [CrossRef]
  26. Shen, F.; Yang, L.; He, X.; Zhou, C.; Adams, J.M. Understanding the Spatial–Temporal Variation of Human Footprint in Jiangsu Province, China, Its Anthropogenic and Natural Drivers and Potential Implications. Sci. Rep. 2020, 10, 13316. [Google Scholar] [CrossRef]
  27. Wan, L.; Li, Y.C. Time Series Trend Analysis and Prediction of Water Quality in a Managed Canal System, Florida (USA). IOP Conf. Ser. Earth Environ. Sci. 2018, 191, 012013. [Google Scholar] [CrossRef]
  28. Loucks, D.P.; van Beek, E. Water resources planning and management: An overview. In Water Resource Systems Planning and Management: An Introduction to Methods, Models, and Applications; Loucks, D.P., van Beek, E., Eds.; Springer International Publishing: Cham, Switzerland, 2017; pp. 1–49. ISBN 978-3-319-44234-1. [Google Scholar]
  29. Aouissi, H.A.; Ababsa, M.; Gaagai, A.; Bouslama, Z.; Farhi, Y.; Chenchouni, H. Does Melanin-Based Plumage Coloration Reflect Health Status of Free-Living Birds in Urban Environments? Avian Res. 2021, 12, 45. [Google Scholar] [CrossRef]
  30. Koull, N.; Helimi, S.; Mihoub, A.; Mokhtari, S.; Kherraze, M.E.; Aouissi, H.A.; Koull, N.; Helimi, S.; Mihoub, A.; Mokhtari, S.; et al. Integración de SIG y Análisis Jerárquico Multi-Criterio Para Analizar La Idoneidad de La Tierra Para Los Cereales En La Zona Árida de Argelia. Int. J. Agric. Nat. Resour. 2022, 49, 36–50. [Google Scholar] [CrossRef]
  31. Teegavarapu, R.S.V. Chapter 1—Methods for analysis of trends and changes in hydroclimatological time-series. In Trends and Changes in Hydroclimatic Variables; Teegavarapu, R., Ed.; Elsevier: Amsterdam, The Netherlands, 2019; pp. 1–89. ISBN 978-0-12-810985-4. [Google Scholar]
  32. Reghunath, R.; Murthy, T.R.S.; Raghavan, B.R. The Utility of Multivariate Statistical Techniques in Hydrogeochemical Studies: An Example from Karnataka, India. Water Res. 2002, 36, 2437–2442. [Google Scholar] [CrossRef]
  33. Chorfi, A.; Hafid, H.; Baaloudj, A.; Rizi, H.; Aouissi, H.A.; Chaib, S.; Ababsa, M.; Allaoua, N.; Houhamdi, M. Characterization and Diversity of Macroin-Vertebrates in Groundwater in the Region of Souk-Ahras (North-East of Algeria). Ekológia 2022, 41, 219–227. [Google Scholar] [CrossRef]
  34. Ahcène, S.; Bachir, H.; Bourafai, S. Hydrochemical Characteristics of Aquifers and Their Predicted Impact on Soil Properties in Biskra Region, Algeria. Egypt. J. Agric. Res. 2021, 99, 205–220. [Google Scholar] [CrossRef]
  35. Guettaia, S.; Hacini, M.; Boudjema, A.; Zahrouna, A. Vulnerability Assessment of an Aquifer in an Arid Environment and Comparison of the Applied Methods: Case of the Mio-Plio-Quaternary Aquifer. Energy Procedia 2017, 119, 482–489. [Google Scholar] [CrossRef]
  36. Obeidat, M.; Awawdeh, M. Assessment of Groundwater Quality in the Area Surrounding Al- Zaatari Camp, Jordan, Using Cluster Analysis and Water Quality Index (WQI). JJEES 2021, 12, 187. [Google Scholar]
  37. Amer Public Health Assn. Standard Methods for the Examination of Water & Wastewater, Centennial Edition, 21st ed.; Eaton, A.D., Clesceri, L.S., Rice, E.W., Greenberg, A.E., Franson, M.A.H., Eds.; Amer Public Health Assn: Washington, DC, USA, 2005; ISBN 978-0-87553-047-5. [Google Scholar]
  38. Singh, G.; Rishi, M.S.; Herojeet, R.; Kaur, L.; Sharma, K. Evaluation of Groundwater Quality and Human Health Risks from Fluoride and Nitrate in Semi-Arid Region of Northern India. Environ. Geochem Health 2020, 42, 1833–1862. [Google Scholar] [CrossRef] [PubMed]
  39. Singh, G.; Rishi, M.S.; Herojeet, R.; Kaur, L.; Priyanka; Sharma, K. Multivariate Analysis and Geochemical Signatures of Groundwater in the Agricultural Dominated Taluks of Jalandhar District, Punjab, India. J. Geochem. Explor. 2020, 208, 106395. [Google Scholar] [CrossRef]
  40. Simeonov, V.; Stratis, J.A.; Samara, C.; Zachariadis, G.; Voutsa, D.; Anthemidis, A.; Sofoniou, M.; Kouimtzis, T. Assessment of the Surface Water Quality in Northern Greece. Water Res. 2003, 37, 4119–4124. [Google Scholar] [CrossRef] [PubMed]
  41. Singh, K.P.; Malik, A.; Sinha, S. Water Quality Assessment and Apportionment of Pollution Sources of Gomti River (India) Using Multivariate Statistical Techniques—A Case Study. Anal. Chim. Acta 2005, 538, 355–374. [Google Scholar] [CrossRef]
  42. Vieira, J.S.; Pires, J.C.M.; Martins, F.G.; Vilar, V.J.P.; Boaventura, R.A.R.; Botelho, C.M.S. Surface Water Quality Assessment of Lis River Using Multivariate Statistical Methods. Water Air Soil Pollut. 2012, 223, 5549–5561. [Google Scholar] [CrossRef]
  43. Simeonov, V.; Simeonova, P.; Tzimou-Tsitouridou, R. Chemometric Quelity Assessment of Surface Waters: Two Case Studies. Chem. Inżynieria Ekol. 2004, 11, 449–469. [Google Scholar]
  44. Yang, K.; Xu, C.; Chi, M.; Wang, P. Analytical Analysis of the Groundwater Drawdown Difference Induced by Foundation Pit Dewatering with a Suspended Waterproof Curtain. Appl. Sci. 2022, 12, 10301. [Google Scholar] [CrossRef]
  45. Kaiser, H.F. The Application of Electronic Computers to Factor Analysis. Educ. Psychol. Meas. 1960, 20, 141–151. [Google Scholar] [CrossRef]
  46. Devkota, J.U. Multivariate Analysis of COVID-19 for Countries with Limited and Scarce Data: Examples from Nepal. J. Environ. Public Health 2021, 2021, 8813505. [Google Scholar] [CrossRef] [PubMed]
  47. Wai, W.W.; AlKarkhi, A.F.M.; Easa, A.M. Comparing Biosorbent Ability of Modified Citrus and Durian Rind Pectin. Carbohydr. Polym. 2010, 79, 584–589. [Google Scholar] [CrossRef]
  48. Swanson, S.K.; Bahr, J.M.; Schwar, M.T.; Potter, K.W. Two-Way Cluster Analysis of Geochemical Data to Constrain Spring Source Waters. Chem. Geol. 2001, 179, 73–91. [Google Scholar] [CrossRef]
  49. Danielsson, Å.; Cato, I.; Carman, R.; Rahm, L. Spatial Clustering of Metals in the Sediments of the Skagerrak/Kattegat. Appl. Geochem. 1999, 14, 689–706. [Google Scholar] [CrossRef]
  50. Fovell, R.G.; Fovell, M.-Y.C. Climate Zones of the Conterminous United States Defined Using Cluster Analysis. J. Clim. 1993, 6, 2103–2135. [Google Scholar] [CrossRef]
  51. Taheri Tizro, A.; Ghashghaie, M.; Georgiou, P.; Voudouris, K. Time Series Analysis of Water Quality Parameters. J. Appl. Res. Water Wastewater 2014, 1, 40–50. [Google Scholar]
  52. Mangin, A. The use of autocorrelation and spectral analyses to obtain a better understanding of hydrological systems. J. Hydrol. 1984, 67, 25–43. [Google Scholar] [CrossRef]
  53. Padilla, A.; Pulido-Bosch, A.; Mangin, A. Relative Importance of Baseflow and Quickflow from Hydrographs of Karst Spring. Groundwater 1994, 32, 267–277. [Google Scholar] [CrossRef]
  54. Chung, S.Y.; Venkatramanan, S.; Park, N.; Rajesh, R.; Ramkumar, T.; Kim, B.W. An Assessment of Selected Hydrochemical Parameter Trend of the Nakdong River Water in South Korea, Using Time Series Analyses and PCA. Environ. Monit. Assess. 2015, 187, 4192. [Google Scholar] [CrossRef]
  55. Lee, J.-Y.; Lee, K.-K. Use of Hydrologic Time Series Data for Identification of Recharge Mechanism in a Fractured Bedrock Aquifer System. J. Hydrol. 2000, 229, 190–201. [Google Scholar] [CrossRef]
  56. Box, G.E.P. Time Series Analysis: Forecasting and Control, 3rd ed.; Prentice Hall: Englewood Cliffs, NJ, USA, 1994; ISBN 978-0-13-060774-4. [Google Scholar]
  57. WHO. WHO Guidelines for Drinking-Water Quality, 3rd ed.; WHO: Geneva, Switzerland, 2017; Volume 1, ISBN 978-92-4-154995-0.
  58. Jain, C.K.; Sharma, S.K.; Singh, S. Physico-Chemical Characteristics and Hydrogeological Mechanisms in Groundwater with Special Reference to Arsenic Contamination in Barpeta District, Assam (India). Environ. Monit. Assess. 2018, 190, 417. [Google Scholar] [CrossRef] [PubMed]
  59. A Graphic Procedure in the Geochemical Interpretation of Water-Analyses. Eos Trans. Am. Geophys. Union 1944, 25, 914–928. [CrossRef]
  60. Thilagavathi, R.; Chidambaram, S.; Prasanna, M.V.; Thivya, C.; Singaraja, C. A Study on Groundwater Geochemistry and Water Quality in Layered Aquifers System of Pondicherry Region, Southeast India. Appl. Water Sci. 2012, 2, 253–269. [Google Scholar] [CrossRef] [Green Version]
  61. Chadha, D.K. A Proposed New Diagram for Geochemical Classification of Natural Waters and Interpretation of Chemical Data. Hydrogeol. J. 1999, 7, 431–439. [Google Scholar] [CrossRef]
  62. Gibbs, R.J. Mechanisms Controlling World Water Chemistry. Science 1970, 170, 1088–1090. [Google Scholar] [CrossRef]
  63. Fisher, R.S.; William, F.; Mullican, I.I.I. Hydrochemical Evolution of Sodium-Sulfate and Sodium-Chloride Groundwater Beneath the Northern Chihuahuan Desert, Trans-Pecos, Texas, USA. Hydrogeol. J. 1997, 2, 4–16. [Google Scholar] [CrossRef]
  64. Yang, Q.; Li, Z.; Ma, H.; Wang, L.; Martín, J.D. Identification of the Hydrogeochemical Processes and Assessment of Groundwater Quality Using Classic Integrated Geochemical Methods in the Southeastern Part of Ordos Basin, China. Environ. Pollut. 2016, 218, 879–888. [Google Scholar] [CrossRef]
  65. Dalton, M.G.; Upchurch, S.B. Interpretation of Hydrochemical Facies by Factor Analysis. Groundwater 1978, 16, 228–233. [Google Scholar] [CrossRef]
  66. Güler, C.; Thyne, G.D.; McCray, J.E.; Turner, K.A. Evaluation of Graphical and Multivariate Statistical Methods for Classification of Water Chemistry Data. Hydrogeol. J. 2002, 10, 455–474. [Google Scholar] [CrossRef]
  67. Amin, M.; Yousuf, M.; Ahmad, N.; Attaullah, M.; Ahmad, S.; Zekker, I.; Latif, M.; Buneri, I.D.; Khan, A.A.; Ali, H.; et al. Application of Alkaline Phosphatase to Assess the Health of Oreochromis Niloticus Exposed to Organophosphates and Synthetic Pyrethroid Pesticides In Vivo. J. Hazard. Toxic Radioact. Waste 2022, 26, 04022029. [Google Scholar] [CrossRef]
  68. Grochowska, J. Assessment of Water Buffer Capacity of Two Morphometrically Different, Degraded, Urban Lakes. Water 2020, 12, 1512. [Google Scholar] [CrossRef]
  69. Cocomazzi, G.; Grieco, G.; Sinojmeri, A.; Cavallo, A.; Bussolesi, M.; Ferrari, E.S.; Destefanis, E. Buffering Copper Tailings Acid Mine Drainage: Modeling and Testing at Fushë Arrëz Flotation Plant, Albania. Water 2022, 14, 2398. [Google Scholar] [CrossRef]
  70. Ghodbane, M.; Benaabidate, L.; Boudoukha, A.; Gaagai, A.; Adjissi, O.; Chaib, W.; Aouissi, H.A. Analysis of groundwater quality in the lower Soummam Valley, North-East of Algeria. J. Water Land Dev. 2022, 54, 1–12. [Google Scholar] [CrossRef]
  71. Davis, S.N.; De Weist, R.J.M. Hydrogeology; John Wiley and Sons: Hoboken, NJ, USA, 1966; 463p. [Google Scholar]
  72. Tang, H.; Zhong, H.; Pan, Y.; Zhou, Q.; Huo, Z.; Chu, W.; Xu, B. A New Group of Heterocyclic Nitrogenous Disinfection Byproducts (DBPs) in Drinking Water: Role of Extraction PH in Unknown DBP Exploration. Environ. Sci. Technol. 2021, 55, 6764–6772. [Google Scholar] [CrossRef]
  73. Krauklis, A.E.; Aouissi, H.A.; Bencedira, S.; Burlakovs, J.; Zekker, I.; Bute, I.; Klavins, M. Influence of Environmental Parameters and Fiber Orientation on Dissolution Kinetics of Glass Fibers in Polymer Composites. J. Compos. Sci. 2022, 6, 210. [Google Scholar] [CrossRef]
  74. Blowes, D.W.; Ptacek, C.J.; Jambor, J.L.; Weisener, C.G.; Paktunc, D.; Gould, W.D.; Johnson, D.B. 11.5—The geochemistry of acid mine drainage. In Treatise on Geochemistry, 2nd ed.; Holland, H.D., Turekian, K.K., Eds.; Elsevier: Oxford, UK, 2014; pp. 131–190. ISBN 978-0-08-098300-4. [Google Scholar]
  75. Sujatha, D.; Reddy, B.R. Quality Characterization of Groundwater in the South-Eastern Part of the Ranga Reddy District, Andhra Pradesh, India. Environ. Geol. 2003, 44, 579–586. [Google Scholar] [CrossRef]
  76. Selvam, S.; Venkatramanan, S.; Chung, S.Y.; Singaraja, C. Identification of Groundwater Contamination Sources in Dindugal District of Tamil Nadu, India Using GIS and Multivariate Statistical Analyses. Arab. J. Geosci. 2016, 5, 407. [Google Scholar] [CrossRef]
  77. Mokadem, N.; Dennis, R.; Dennis, I. Hydrochemical and Stable Isotope Data of Water in Karst Aquifers during Normal Flow in South Africa. Environ. Earth Sci 2021, 80, 519. [Google Scholar] [CrossRef]
  78. Rishi, M.S.; Kaur, L.; Sharma, S. Groundwater Quality Appraisal for Non-Carcinogenic Human Health Risks and Irrigation Purposes in a Part of Yamuna Sub-Basin, India. Hum. Ecol. Risk Assess. Int. J. 2020, 26, 2716–2736. [Google Scholar] [CrossRef]
  79. Liu, G.; Zhang, Y.; Knibbe, W.-J.; Feng, C.; Liu, W.; Medema, G.; van der Meer, W. Potential Impacts of Changing Supply-Water Quality on Drinking Water Distribution: A Review. Water Res. 2017, 116, 135–148. [Google Scholar] [CrossRef] [PubMed]
  80. Svensson, T.; Kylin, H.; Montelius, M.; Sandén, P.; Bastviken, D. Chlorine Cycling and the Fate of Cl in Terrestrial Environments. Environ. Sci. Pollut. Res. 2021, 28, 7691–7709. [Google Scholar] [CrossRef] [PubMed]
  81. Mokadem, N.; Demdoum, A.; Hamed, Y.; Bouri, S.; Hadji, R.; Boyce, A.; Laouar, R.; Sâad, A. Hydrogeochemical and Stable Isotope Data of Groundwater of a Multi-Aquifer System: Northern Gafsa Basin—Central Tunisia. J. Afr. Earth Sci. 2016, 114, 174–191. [Google Scholar] [CrossRef] [Green Version]
  82. Guerzou, M.; Aouissi, H.A.; Guerzou, A.; Burlakovs, J.; Doumandji, S.; Krauklis, A.E. From the Beehives: Identification and Comparison of Physicochemical Properties of Algerian Honey. Resources 2021, 10, 94. [Google Scholar] [CrossRef]
  83. Das, N.; Sarma, K.P.; Patel, A.K.; Deka, J.P.; Das, A.; Kumar, A.; Shea, P.J.; Kumar, M. Seasonal Disparity in the Co-Occurrence of Arsenic and Fluoride in the Aquifers of the Brahmaputra Flood Plains, Northeast India. Environ. Earth Sci. 2017, 76, 183. [Google Scholar] [CrossRef]
  84. Pant, D.; Keesari, T.; Rishi, M.S.; Sharma, D.A.; Jaryal, A.; Kamble, S.N.; Sinha, U.K. Hydrochemical Evolution of Groundwater in the Waterlogged Area of Southwest Punjab. Arab. J. Geosci. 2020, 13, 773. [Google Scholar] [CrossRef]
  85. Stumm, W.; Morgan, J.J. Aquatic Chemistry: Chemical Equilibria and Rates in Natural Waters; Wiley: Hoboken, NJ, USA, 1996; ISBN 978-0-471-51184-7. [Google Scholar]
  86. Li, P.; Wu, J.; Qian, H. Preliminary Assessment of Hydraulic Connectivity between River Water and Shallow Groundwater and Estimation of Their Transfer Rate during Dry Season in the Shidi River, China. Environ. Earth Sci. 2016, 75, 99. [Google Scholar] [CrossRef]
  87. Chebotarev, I.I. Metamorphism of Natural Waters in the Crust of Weathering—1. Geochim. Cosmochim. Acta 1955, 8, 22–48. [Google Scholar] [CrossRef]
  88. Appelo, C.A.J. Geochemistry, Groundwater and Pollution, 2nd ed.; Appelo, C.A.J., Appelo, C.A.J., Postma, D., Postma, D., Eds.; CRC Press: London, UK, 2005; ISBN 978-0-429-15232-0. [Google Scholar]
  89. Kumari, R.; Datta, P.S.; Rao, M.S.; Mukherjee, S.; Azad, C. Anthropogenic Perturbations Induced Groundwater Vulnerability to Pollution in the Industrial Faridabad District, Haryana, India. Environ. Earth Sci. 2018, 77, 187. [Google Scholar] [CrossRef]
  90. Hardie, L.W.A.; Eugster, H.P. The evolution of closed-basin brines. Min. Soc. Spec. Pap. 1970, 3, 273–290. [Google Scholar]
  91. Xiao, J.; Jin, Z.D.; Wang, J.; Zhang, F. Hydrochemical Characteristics, Controlling Factors and Solute Sources of Groundwater within the Tarim River Basin in the Extreme Arid Region, NW Tibetan Plateau. Quat. Int. 2015, 380–381, 237–246. [Google Scholar] [CrossRef]
  92. Zhu, B.; Yang, X.; Rioual, P.; Qin, X.; Liu, Z.; Xiong, H.; Yu, J. Hydrogeochemistry of Three Watersheds (the Erlqis, Zhungarer and Yili) in Northern Xinjiang, NW China. Appl. Geochem. 2011, 26, 1535–1548. [Google Scholar] [CrossRef]
  93. Gaillardet, J.; Dupré, B.; Louvat, P.; Allègre, C.J. Global Silicate Weathering and CO2 Consumption Rates Deduced from the Chemistry of Large Rivers. Chem. Geol. 1999, 159, 3–30. [Google Scholar] [CrossRef]
  94. Aouissi, H.A.; Hamimes, A.; Ababsa, M.; Bianco, L.; Napoli, C.; Kebaili, F.K.; Krauklis, A.E.; Bouzekri, H.; Dhama, K. Bayesian Modeling of COVID-19 to Classify the Infection and Death Rates in a Specific Duration: The Case of Algerian Provinces. Int. J. Environ. Res. Public Health 2022, 19, 9586. [Google Scholar] [CrossRef] [PubMed]
  95. Srivastava, S.K.; Ramanathan, A.L. Geochemical Assessment of Groundwater Quality in Vicinity of Bhalswa Landfill, Delhi, India, Using Graphical and Multivariate Statistical Methods. Environ. Geol. 2008, 53, 1509–1528. [Google Scholar] [CrossRef]
  96. Kraiem, Z.; Zouari, K.; Chkir, N.; Agoune, A. Geochemical Characteristics of Arid Shallow Aquifers in Chott Djerid, South-Western Tunisia. J. Hydro-Environ. Res. 2014, 8, 460–473. [Google Scholar] [CrossRef]
  97. Byrne, M.P.; Tobin, J.T.; Forrestal, P.J.; Danaher, M.; Nkwonta, C.G.; Richards, K.; Cummins, E.; Hogan, S.A.; O’Callaghan, T.F. Urease and Nitrification Inhibitors—As Mitigation Tools for Greenhouse Gas Emissions in Sustainable Dairy Systems: A Review. Sustainability 2020, 12, 6018. [Google Scholar] [CrossRef]
  98. Halecki, W.; Stachura, T.; Fudała, W.; Rusnak, M. Evaluating the Applicability of MESS (Matrix Exponential Spatial Specification) Model to Assess Water Quality Using GIS Technique in Agricultural Mountain Catchment (Western Carpathian). Environ. Monit. Assess. 2018, 191, 26. [Google Scholar] [CrossRef]
  99. Aflatooni, M. Time Series Analysis of Ground Water Table Fluctuations Due to Temperature and Rainfall Change in Shiraz Plain. Int. J. Water Resour. Environ. Eng. 2011, 3, 176–188. [Google Scholar]
  100. Alam, S.; Khan, M.S.; Bibi, W.; Zekker, I.; Burlakovs, J.; Ghangrekar, M.M.; Bhowmick, G.D.; Kallistova, A.; Pimenov, N.; Zahoor, M. Preparation of Activated Carbon from the Wood of Paulownia Tomentosa as an Efficient Adsorbent for the Removal of Acid Red 4 and Methylene Blue Present in Wastewater. Water 2021, 13, 1453. [Google Scholar] [CrossRef]
  101. Alam, S.; Ullah, B.; Khan, M.S.; Rahman, N.U.; Khan, L.; Shah, L.A.; Zekker, I.; Burlakovs, J.; Kallistova, A.; Pimenov, N.; et al. Adsorption Kinetics and Isotherm Study of Basic Red 5 on Synthesized Silica Monolith Particles. Water 2021, 13, 2803. [Google Scholar] [CrossRef]
  102. Wahsner, J.; Gale, E.M.; Rodríguez-Rodríguez, A.; Caravan, P. Chemistry of MRI Contrast Agents: Current Challenges and New Frontiers. Chem. Rev. 2019, 119, 957–1057. [Google Scholar] [CrossRef] [PubMed]
  103. Taussi, M.; Gozzi, C.; Vaselli, O.; Cabassi, J.; Menichini, M.; Doveri, M.; Romei, M.; Ferretti, A.; Gambioli, A.; Nisi, B. Contamination Assessment and Temporal Evolution of Nitrates in the Shallow Aquifer of the Metauro River Plain (Adriatic Sea, Italy) after Remediation Actions. Int. J. Environ. Res. Public Health 2022, 19, 12231. [Google Scholar] [CrossRef] [PubMed]
  104. Gaagai, A. Etude de L’évolution de la Qualité des Eaux du Barrage de Babar (Sud-Est Algérien) et L’impact de la Rupture de la Digue sur L’environnement. Ph.D. Thesis, University of Batna 2, Batna, Algeria, 2017. [Google Scholar] [CrossRef]
Figure 1. Location map of the study area.
Sustainability 15 00020 g001
Figure 2. Extract from the geological map of Biskra, Sheet N°48, Scale 1/200,000, with groundwater sampling points of the research area [34] (redrawn by the authors).
Sustainability 15 00020 g002
Figure 3. Summary of the geological and hydrogeological units of the Biskra region [34] (redrawn by the authors).
Sustainability 15 00020 g003
Figure 4. Schematic geological of the study region; established based on Ahcène et al. [34] and updated.
Sustainability 15 00020 g004
Figure 5. The spatial variation map of the Lioua plain: TDS (a), EC (b), and pH (c).
Sustainability 15 00020 g005
Figure 6. The spatial distribution map of the Lioua plain: major ion concentrations. Ca (a), Mg (b), HCO3 (c), Cl (d), K (e), Na (f), SO4 (g), NO3 (h).
Sustainability 15 00020 g006
Figure 7. Piper diagram of groundwater samples.
Sustainability 15 00020 g007
Figure 8. Chadha diagram of groundwater samples.
Sustainability 15 00020 g008
Figure 9. Gibbs diagram of groundwater samples.
Sustainability 15 00020 g009
Figure 10. Stoichiometric relations of the major cations and anions of the study water.
Sustainability 15 00020 g010
Figure 11. Plots of PCA scores for F2 vs. F1 (left) and F3 vs. F1 (right).
Sustainability 15 00020 g011
Figure 12. Cluster dendrogram for variables.
Sustainability 15 00020 g012
Figure 13. Auto-correlation function physicochemical parameters time series.
Sustainability 15 00020 g013
Figure 14. Spectral Density patterns of hydrochemical components in the study area.
Sustainability 15 00020 g014
Table 1. Descriptive analysis results of the groundwater samples in the study area.
ParametersMinMeanMaxSt DevCoef. of Variation (CV, %)WHO (2017) Second Addendum 2021
Ca2+252452.71640117.890.26150
Mg2+52.8172.61439.284.660.4970
Na+47.73373.161358.54260.410.7200
K+5.0112.0225.634.660.3912
HCO3129.32187.6283.0443.320.23500
SO42−571.431636.223028.57647.010.4250
Cl106.5462.071462.6277.650.6250
NO30.237.13153.4430.310.8250
pH7.037.648.160.30.046.5–8.5
EC20004370.97100001617.880.371500
TDS1232.003333.457145.001269.120.381000
Remark: units in mg/L except for pH (unitless) and EC (µS/cm); St Dev for standard deviation.
Disclaimer/Publisher’s Note: The statements, opinions and data contained in all publications are solely those of the individual author(s) and contributor(s) and not of MDPI and/or the editor(s). MDPI and/or the editor(s) disclaim responsibility for any injury to people or property resulting from any ideas, methods, instructions or products referred to in the content.

