Article

Investigation of Irrigation Water Requirement and Evapotranspiration for Water Resource Management in Southern Punjab, Pakistan

1
Department of Environmental Sciences, COMSATS University Islamabad, Vehari Campus, Vehari 61100, Pakistan
2
Department of Agronomy, Faculty of Agriculture and Environment, The Islamia University of Bahawalpur, Bahawalpur 63100, Pakistan
3
Department of Agronomy, Abdul Wali Khan University Mardan, Mardan 23200, Pakistan
4
International Research Institute for Climate and Society, Earth Institute at Columbia University, Palisades, New York, NY 10964, USA
5
School of Agriculture Engineering, Jiangsu University, Zhenjiang 212013, China
*
Authors to whom correspondence should be addressed.
Sustainability 2023, 15(3), 1768; https://doi.org/10.3390/su15031768
Submission received: 29 December 2022 / Revised: 11 January 2023 / Accepted: 14 January 2023 / Published: 17 January 2023
(This article belongs to the Special Issue Sustainable Management of Water Resource and Environmental Monitoring)

Abstract

:
Water scarcity and water quality degradation are exacerbated by climate change in all countries, including Pakistan. The use of water in agriculture is one of the most predominant resources, so reducing consumption and improving resource management is of utmost importance. In the past few decades, excessive irrigation has led to severe water scarcity and reduced water quality. This study determined the irrigation requirements for cotton, rice, and wheat, using the CROPWAT model in Southern Punjab (Multan District). In the study area, evapotranspiration ranged from 1.8 to 10.24 mm/day, while effective rainfall ranged from 2 to 31.3 mm. Rice, cotton, and wheat each required 996.4, 623.3, and 209.5 mm of irrigation, respectively. Among rice, cotton, and wheat, the total net irrigation was 72.4, 67.8, and 44.1 mm, respectively, while the total gross irrigation was 103.5, 99.8, and 63 mm. The CROPWAT model showed a moderately useful result for identifying irrigation needs in Southern Punjab. The study emphasizes the need for groundwater harvesting and water management technologies to implement a water management system that reduces water shortages.

1. Introduction

Due to increasing water needs all over the world, water has become a valuable resource in a variety of fields, including agriculture irrigation, hydropower, and water supply [1]. In many parts of the world, water demands are increasing along with population growth, yet fresh water resources are becoming scarcer. [2]. The arid climate in the southern Punjab of Pakistan makes wheat, cotton, rice, and sugarcane difficult to grow due to low precipitation rates [3], limited water, and high evapotranspiration. For planning, building, operating, and managing farm systems, an accurate assessment of crop water requirements (CWR) is necessary [4,5,6]. An accurate assessment of CWR can help to maintain the economically efficient use of water supplies for irrigation. The sustainability of irrigation water is greatly influenced by ET (evapotranspiration) resources [7,8].
The CROPWAT model can play a significant role in developing practical recommendations for boosting yield output in conditions of limited water [9]. The CROPWAT model is used to calculate the water requirements, as well as irrigation planning for important crops, including sugarcane, wheat, cotton, and rice, among others [10]. It enables the development of recommendations for better irrigation techniques, the management of irrigation schedules under various water utilization needs, and the calculation of productivity under rainfed conditions or shortfall watering [11]. The expected yield loss is driven by climate conditions and water pressure [12]. The simulation results suggest that the primary yield reduction occurred in the developing stage in both rainfed and irrigated situations [13,14]. CROPWAT software is an important practice used by various scientists for the valuation of CWR and crop evapotranspiration, as well as irrigation scheduling [15]. These software programs were introduced by the FAO (Food and Agriculture Organization) to identify the CWR and irrigation scheduling and management [16,17,18,19].
Pakistan has one of the highest population growth rates in the world [20,21,22]. Increasing the population in urban areas being observed worldwide is most striking in developing countries [23], for example, Pakistan, where several urban centers have sprung up during the last few years [24,25,26,27]. Previously, a number of studies were conducted on urban growth of some Pakistani districts, e.g., Multan, Lahore and Faisalabad, and these studies have discussed the cities in terms of open spaces, housing types, building density, city layout, as well as functional characteristics [28,29,30,31,32]. A region’s cropping patterns are very much affected by the historical, socioeconomic, political and geo-climatic elements [33,34,35,36,37].
Since ancient times, Punjab has been referred to as the “land of the five rivers” [38,39]. For many farmlands in Punjab, water does not arrive in a timely way or in sufficient quantities to reach the crops [40,41]. Because of insufficient levelling, less awareness, as well as poor water management techniques, water is frequently not delivered properly to the flood-irrigated areas in Punjab [42,43,44]. Punjab’s primary user of water is agriculture; hence, irrigation systems need to be managed and modernized effectively by carefully assessing water system requirements [
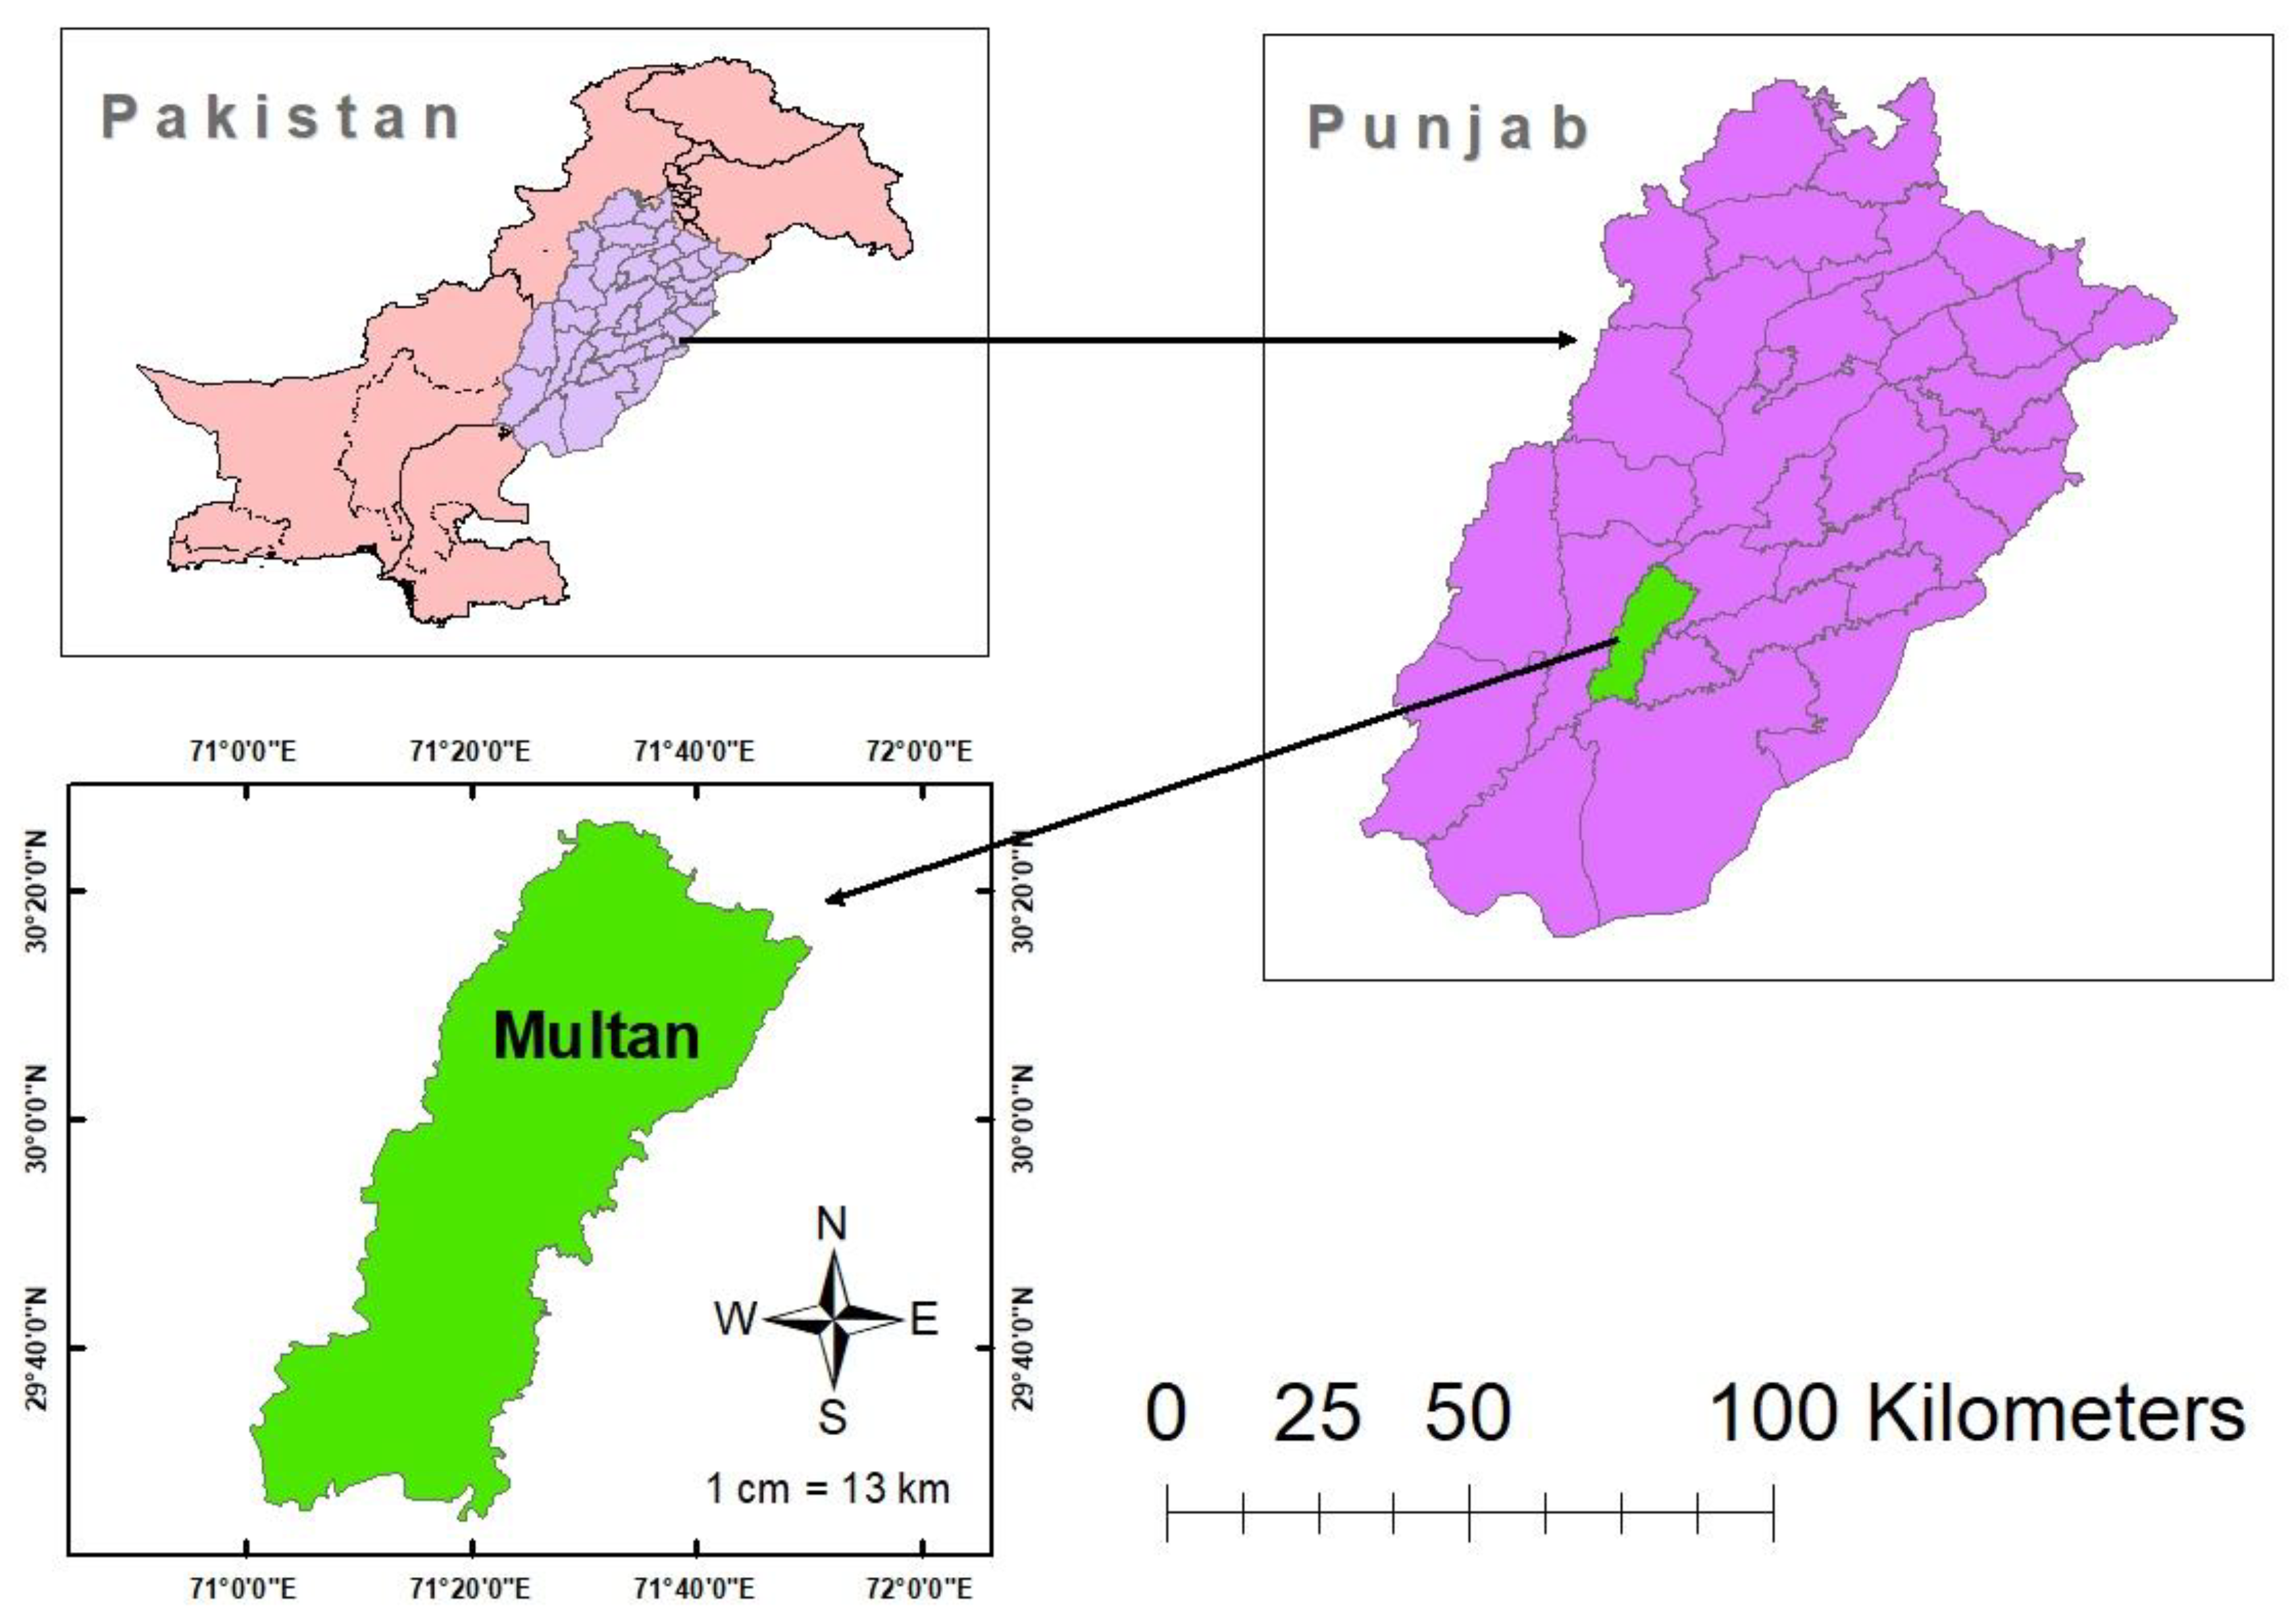
45]. To meet the demand for irrigation, it is important to understand the crop water required (CWRs), as well as irrigation scheduling. In the current study, using ArcGIS and CROPWAT tools, we analyzed the evapotranspiration (ET) and crop water requirements, as well as the irrigation scheduling of the main crops (cotton, rice, and wheat) in the Multan District of Pakistan.

2. Materials and Method

2.1. Study Area

This study was conducted in the Multan District of Pakistan. Multan is one of the oldest cities in Pakistan’s Southern Punjab. Multan City, which has four tehsils (Shujaabad, Jalalpur Pirwala, Multan City, and Multan Saddar), serves as the district headquarters (Figure 1). This region is roughly located between 70°58′34″ to 71°43′25″ longitude and 29°19′11″ to 30°28′16″ latitude. Multan District is primarily a flat and agricultural territory, bounded on the west by the Chenab River. Due to their proximity to the Chenab River, the tehsils of Shujaabad and Multan Saddar regularly flood during the monsoon season. Multan’s climate is arid, with severe winters and heated summers. The highest temperature ever recorded was 50 °C (122 °F), while the average least temperature is 4.5 °C (40.1 °F).

2.2. Satellite Data and Image Classification

Landsat 4, 5 TM (Thematic Mapper) for the year 1990, as well as Landsat 8 for the year 2020 were used to examine changes in land cover using the USGS (United States Geological Survey) website (earthexplorer.usgs.gov). Software ERDAS Imagine 15 was used to pre-process the data for layer stacking, mosaicking, and image sub-setting. The changes in land cover were discovered using a supervised classification algorithm after pre-processing using ArcGIS 10.6.

2.3. CROPWAT 8.0 Model Description

The FAO created CROPWAT 8.0, software based on a variety of equations, to determine irrigation schedule, irrigation water requirements, reference evapotranspiration (ET0), and CWR using diverse climatic data [46]. This system includes standard information for diverse crop capabilities, soil properties, and nearby climate. It aids in the optimization of irrigation scheduling, as well as the calculation of plan water supply for distinctive crop types under irrigated situations [47].

2.4. Data Requirement

The CROPWAT requires the use of four different types of data: rainfall data, climate data, and soil, as well as crop data [48]. The CLIMWAT 2.0 climatic database, which can be used in conjunction with the CROPWAT software to calculate IRs for various crops for a variety of meteorological places, was used to collect the meteorological data from 1990 to 2020 [49]. CLIMWAT includes the location’s coordinates and altitude together with seven consecutive months’ climatic parameters. These metrics include the monthly wind speed (km/h), minimum and maximum temperatures (in degrees Celsius), sunlight hours (in hours), mean relative humidity (in percentage), rainfall data (in millimeters), and effective rainfall (in millimeters).
The FAO Manual [50] information included the rooting depth, yield response factor, critical depletion, crop coefficient, and duration of crop growth stages for the crops of white maize, wheat, tomatoes, and barley, which were incorporated to the CROPWAT software [51]. The CROPWAT 8.0 model’s soil parameters provide precise data on the soil close to the climate station, such as the maximum rooting depth, the initial moisture depletion, the total amount of moisture that is available, and the maximum rate of rain penetration [46]. According to FAO standards, the soil in the study area is classified as medium types.

2.5. Reference Evapotranspiration (ET0)

Evapotranspiration is the term for the simultaneous loss of water by transpiration (from the surface of plants) and evaporation (from the surface of the soil). The ET0 is the rate of ET from a hypothetical crop with albedo of 0.23, height of 0.12 m, and fixed canopy resistance of 70 sm1 [52]. The FAO Penman–Monteith equation, which derives the majority of its parameters from meteorological data, is used by the CROPWAT model to calculate ET:
E T = Δ R n G + P a C p e s e a r a Δ + γ 1 + r s r s
where (es ea) is the vapor pressure deficiency of the soil, Rn is the net radiation, G is the soil heat flux, Pa is the average of air density at constant pressure, Cp is the air’s specific heat, γ is psychometric constant, rs (surface resistances) and ra (aerodynamic resistances), and ∆ is the slope of air temperature and vapor pressure [53].
The “bulk” rs and ra are calculated using the standard height for wind speed and theoretical crop characteristics, respectively. ET0 can be expressed as the following equation:
E T 0 = 0.408 Δ R n G + γ 900 T + 273 u 2 e s e a Δ + γ 1 + 0.34 u 2
where ET0 is the reference evapotranspiration (mm/day), es and ea are the saturation, actual vapor pressure (kPa), T is the average temperature (°C) at 2 m height, and u2 is the wind speed at 2 m height (ms−1).

2.6. Crop Water Requirement (CWR)

The amount of water needed for crops is determined by the rate of ET in mm/day and is equal to the amount of water lost from a planted field by ET. CWR is estimated using crop evapotranspiration (ETc), which may be computed using the following equation [54]:
E T c = K c × E T 0
where Kc denotes the crop coefficient. It is the crop ETc to ET0 ratio, as well as its reflection of an integration of the impacts of 4 fundamental properties that distinguish the crop from reference grass. It encompasses albedo (reflectance) of soil evaporation, crop height, crop-soil surface, and canopy resistance. The crop’s Kc will change during the growing period, which may be classified into 4 separate stages: beginning, crop development, mid-season, and late season, as a result of ET variations over the developmental stages.

2.7. Irrigation Water Requirement (IR)

By using the following equation, the CROPWAT Model can calculate the daily water balance of the root zone as far as root zone depletion at the end of the day [55]:
D r , i = D r , i 1 P R O i I i C R i + E T c i + D P i
where Dr,i is the root zone depletion at the day’s end i (mm), Dr,i−1 is the water content in the root zone in last day’s (mm), Pi is rainfall on day i (mm), Ii is the net irrigation depth on day I, ROi is the surface soil runoff on day i (mm), ETci is the crop evapotranspiration on day i (mm), CRi is the capillary rise from the groundwater on day i (mm), and DPi is the lost water of the root zone on day i (mm).

2.8. Irrigation Schedule

The optimum quantity of water to irrigate, as well as the right time to water are determined by irrigation scheduling. The CROPWAT model computes the CWR, ET0, and IRs to create irrigation plans for various administrative scenarios and water supply strategies [56]. Figure 2 shows the detail of the methodology.

3. Results

3.1. Urbanization and Land Cover Changes

Urban growth has been a main part of the research of geographic information system (GIS), as well as remote sensing (RS) all over the world [57]. Therefore, the use of RS and GIS applications provided an excellent monitoring and mapping of urban growth. These RS and GIS technologies, e.g., geo-informatics advanced techniques, have played a significant role in identifying the patterns and sustainable management of urbanization. Moreover, population data were used to expand the results obtained through image analysis. The ‘‘Built-up area’’ in 1990 occupied 28,246 Ha (7.74%) of all the classes. However, in 2020, the build-up area increased, 57,581 Ha (15.78%), as compared to 1990 (Table 1). However, between 1990 and 2020, there was a significant growth in “build-up area” (increased to 8%). The vegetation area occupied 301,244 Ha (82.53%) during 1990, which was decreased, 286,023 Ha (78.36%), during 2020 in the study area (Figure 3).
The main development concentrated in the east, south and in the central portion. Multan’s population as a whole was 1.9 million in 1981; it climbed to 4.7 million in 2017, demonstrating a gain of more than 2.8 million people in the Multan District, which has contributed to the expansion of the urban area (Table 2). In 1981, the urban and rural populations were 0.7 M and 1.12 M, respectively, which shifted to 2 M and 2.6 M, respectively in 2017, showing that more than 3% of respondents migrated from the rural area to the urban area in District Multan. Many new colonies have been built in District Multan, which mostly contributed to the expansion of the urban area during the last few years. In the future, the expansion of Multan is projected to be administered by the building of different roads, mainly, M4 motorway and Vehari road. It is the additional reason that urban growth is expected to receive momentum if regeneration and redevelopment of central areas remain the policy priority of city administrators, particularly if industrial units moved to the new lands outside the urban area. As a result, the findings indicate that urbanization is the form of land use that has the biggest detrimental impact on water quality.

3.2. Climate Change in Multan Region

The data submitted to the CLIMWAT and CROPWAT applications of Multan were division, crop kind, climatic station, soil type (clay and heavy), and cultivation date. By entering all of the data in the software, it estimated the meteorological factors, ET0, overall irrigation required, and effective rainfall for the crop under consideration. The next paragraph, tables, and charts demonstrate additional outcomes of CROPWAT. Table 3 comprises the climate data of the Multan region. The average annual rainfall of 30 years (1990–2020) and the CROPWAT rainfall from the USDA S.C. method are used here to estimate the effective rainfall and to calculate the water requirements and irrigation schedules for the four crops. As shown in Table 3, the results indicate that the average annual rainfall value was 180 mm and about 170 mm was effective rainfall.

3.3. Effective Rainfall Estimation and Reference Evapotranspiration

Alfalfa was used as the reference crop for estimating the ET0 because it has a homogenous, actively growing grassy cover that totally shades the surface. The ET of the different crops (ETc) can be calculated by regulating ET0 using crop coefficient (Kc) using the following Equation [47]:
E T 0 = E T c K c
The ET0 readings for various months as determined by the CROPWAT software are as shown in Table 3. Summertime temperatures cause it to be high, and June had the greatest value (10.24 mm). Wintertime saw a decline, and January saw the lowest value (1.8 mm) because of the chilly weather. The yearly mean value was 5.38 mm. The variations in ET0 values are a result of the changing meteorological conditions in the research region. In the dry seasons, the relationship of high temperatures, strong winds, and low relative humidity boosted evapotranspiration [49].
Table 4, Table 5 and Table 6 show, through the growth phases, that the ETc increased, and then at the latter stages, it somewhat decreased. The fluctuations seen here may be a result of the crop coefficient, as demonstrated in Equation (3). Even though the Kc changed just a little, it was never consistent during any stage of development, which also reflects the seasonal crop water requirements [50]. The ETc readings were seen to be higher in the middle of all four crops, lower at the beginning, and finish when the crops were at their most productive stage. Productive rainfall, which is used to assess CWR, is the portion of precipitation that is successfully utilized by the crop following losses due to surface runoff and deep filtering. The primary characteristics of precipitation are its quantity, intensity and frequency, all of which vary in time and space. Planning its full utilization requires precise awareness of these three characteristics. Table 4, Table 5 and Table 6 show that wheat, cotton and rice have successfully utilized 37.7%, 113.9%, and 102.6% of the rainfall, respectively.

3.4. Crop Water Requirement of Cotton, Wheat and Rice

The amount (or depth) of water required by the crop is equal to the water lost through ET. Depending on the location, temperature, soil type, cultivation technique, effective rain, etc., crops have varying water needs, and the total amount of water needed for crop development is not distributed evenly over the course of the crop’s life. The three crops’ irrigation requirements (IRs) for water in the Multan region are in the following order (mm/dec) unit:
Cotton (996.4) > Rice (823.2) > Wheat (209.5)
Table 4, Table 5 and Table 6 demonstrate CROPWAT’s calculations of the effective rain and IR for cotton, wheat, and rice.

3.5. Irrigation Scheduling and Net Irrigation Requirement (NIR)

Improved irrigation management in major crops results from understanding the irrigation scheduling and crop water requirements. The goal of water management for irrigation is to efficiently and deliberately regulate the quantity, frequency, and rate of irrigation. Table 7, Table 8 and Table 9 and Figure 4, Figure 5 and Figure 6 describe the wheat, cotton, and rice crops’ field crop irrigation schedules. For wheat, 103.5 mm and 72.4 mm, for cotton, 99.8 mm and 67.8 mm, and for rice, 63 mm and 44.1 mm, respectively, are the average gross irrigations, as well as the average net irrigations. For rice, there are 12 irrigation schedules, 21 for cotton, and 5 for wheat. The NIR is the amount of water required to fill the soil’s field capacity or amount of water necessary for the crop to grow. NIR is influenced by the weather and cropping schedule. To convert the NIR into the net irrigation requirement, information about irrigation efficiency is required. When applying and transporting irrigation water, several losses, including runoff, seepage, evaporation and percolation, occur. [58]. Water is necessary for some processes, including leaching, transplanting and soil preparation. Therefore, ET losses from applying water for these reasons are included in CWR as Equation (6).
N I R = E T c E f f . r a i n
Farmers may pick the sort of crops to cultivate based on the water resources available with the use of this type of study. The term “total available moisture” (TAM) in the figures above refers to the entire amount of water that is accessible to the crop. The plant may obtain the amount of water from the root zone without experiencing water stress or immediate access to water (TAM).
In Southern Punjab, agriculture plays a significant role in the national economy. It served as Punjab’s main economic driver. There is currently a heated discussion regarding the direction Punjab agriculture should take in order to revive and contribute to the country, taking into account the growing competition on a national and regional level for limited water resources, as well as the difficulties posed by climate change.

4. Discussion

The main objective of this research, irrigation water requirement and evapotranspiration for the main crops have been determined using the ArcGIS 10.6 and CROPWAT 8.0 software in Southern Punjab, Pakistan. The relation of freshwater flows and higher temperatures caused by climate change is anticipated to have an influence on both the amount and quality of water [59]. The water quality of rivers is likely to be negatively impacted by both growing urbanization and climate change. This could have important economic repercussions for the societies that depend on rivers, both directly through their use and indirectly through water-dependent industries such as agriculture.
According to Hussain et al. [25], rapid expansion in urban areas is often perceived as an indicator of the commercial growth; together, it impacts on environmental services and resources. These effects may consist of a loss of biodiversity, decrease in vegetation area, effect of urban heat island, emissions of greenhouse gases and spatial separation of natural environments, soil, light, water, as well as noise pollution [37,
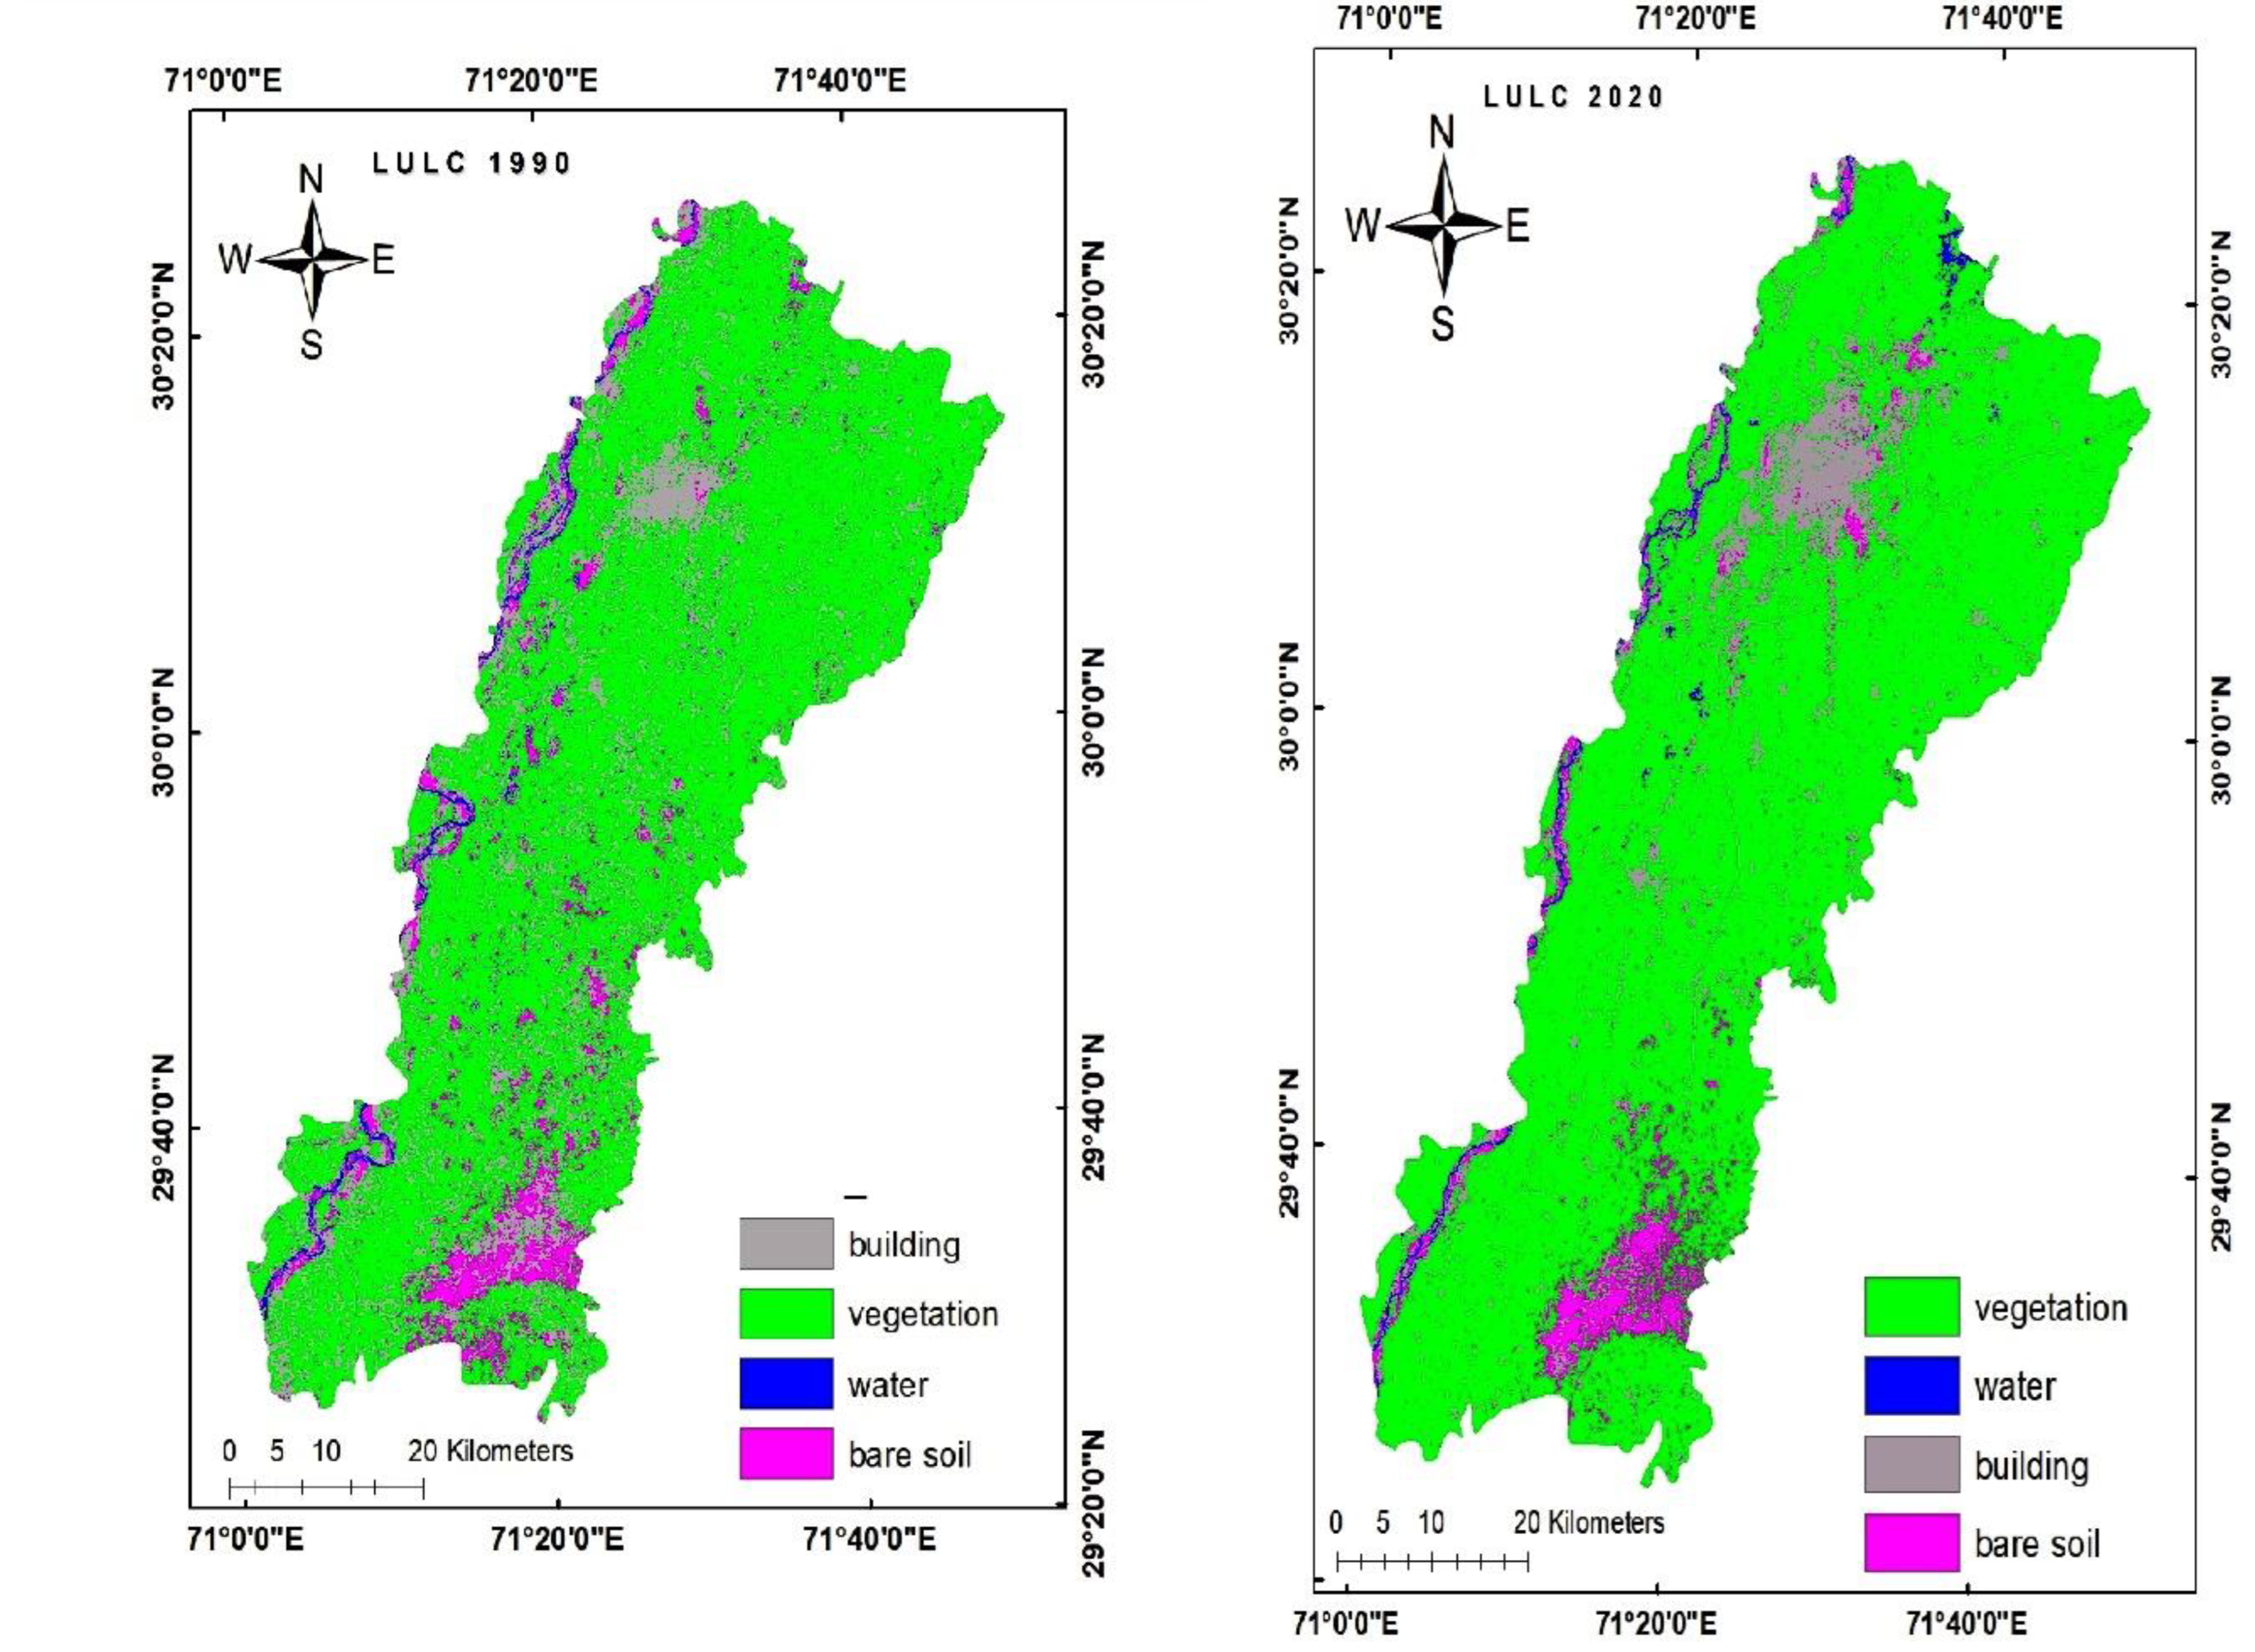
41]. According to our study, between 1990 and 2020, there was a significant growth in “build-up area” (increased to 8%). As a result, the findings indicate that urbanization is the form of land use that has the biggest detrimental impact on water quality.
Another perception of drop in agricultural yield is also congruent with scientific research conducted by Schnepf [60], where they have shown that 1℃ increase in temperature can lead to 3–6% reduction in yield of various crops (e.g., wheat, rice, maize and soybean). The perception of farmers on the change in crop patterns is also in agreement with the ground reality of installing sugar mills in cotton areas of Punjab [9,18], which has led to a shift from growing cotton to growing sugarcane. Moreover, the perceived LULC changes are in accordance with recent studies such as Hussain et al. [21] and Waleed et al. [21]. These studies have shown that rapid LULC changes are taking place at national and local levels in Pakistan. In the survey, a greater fraction of farmers agrees that climate change can be mitigated. Regarding the rainfall intensity, respondents’ perception is in agreement with local increase in the precipitation in recent years [61,62]. However, Wahaj et al. [63] show that the average rainfall intensity has declined for the whole country over the study period of seven years (i.e., 2010–2017). The perception of the respondent on the decrease in the rainfall events is also corroborated from the data presented by Ewaid et al. [
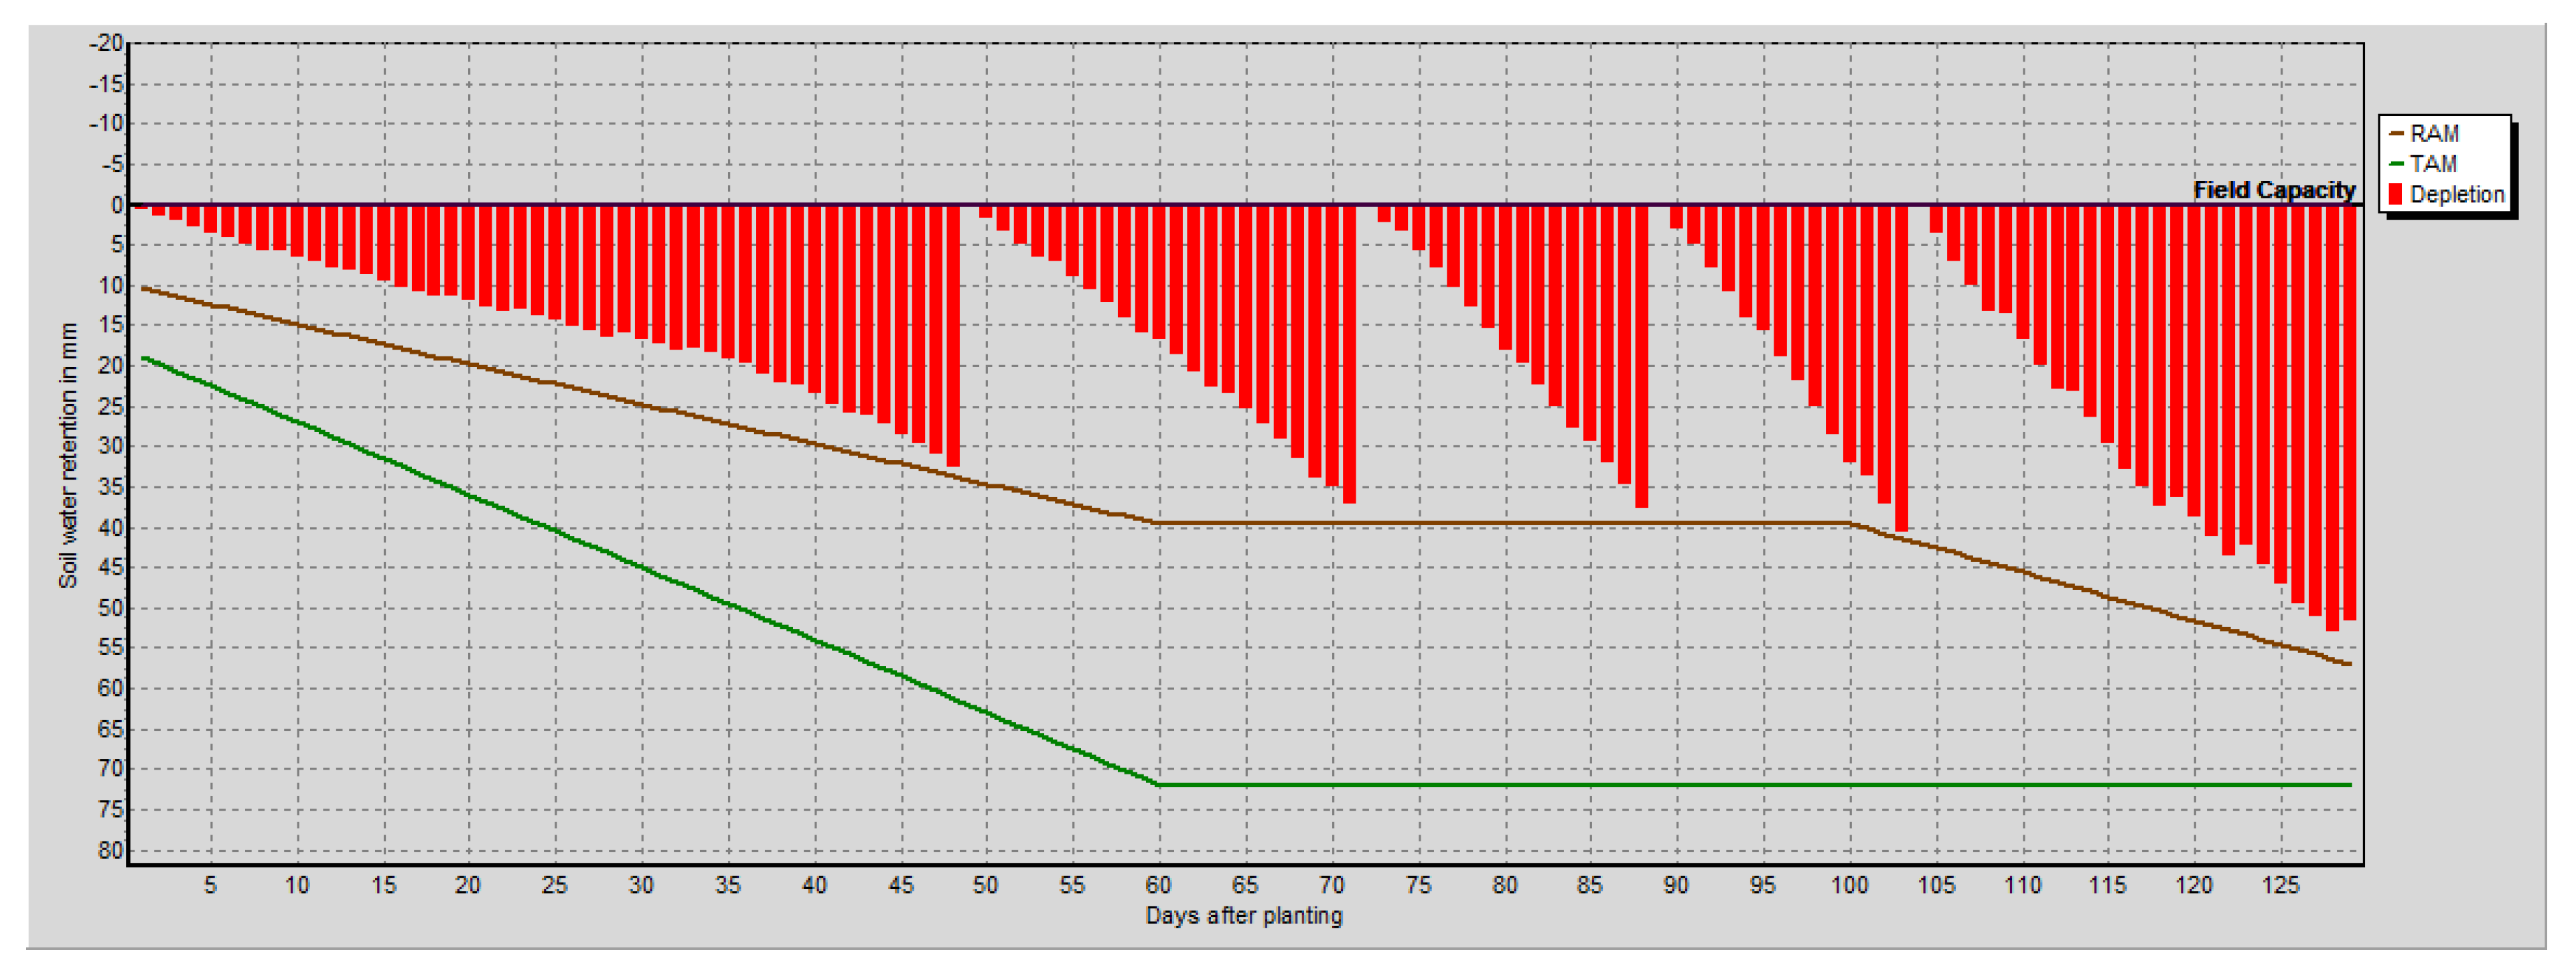
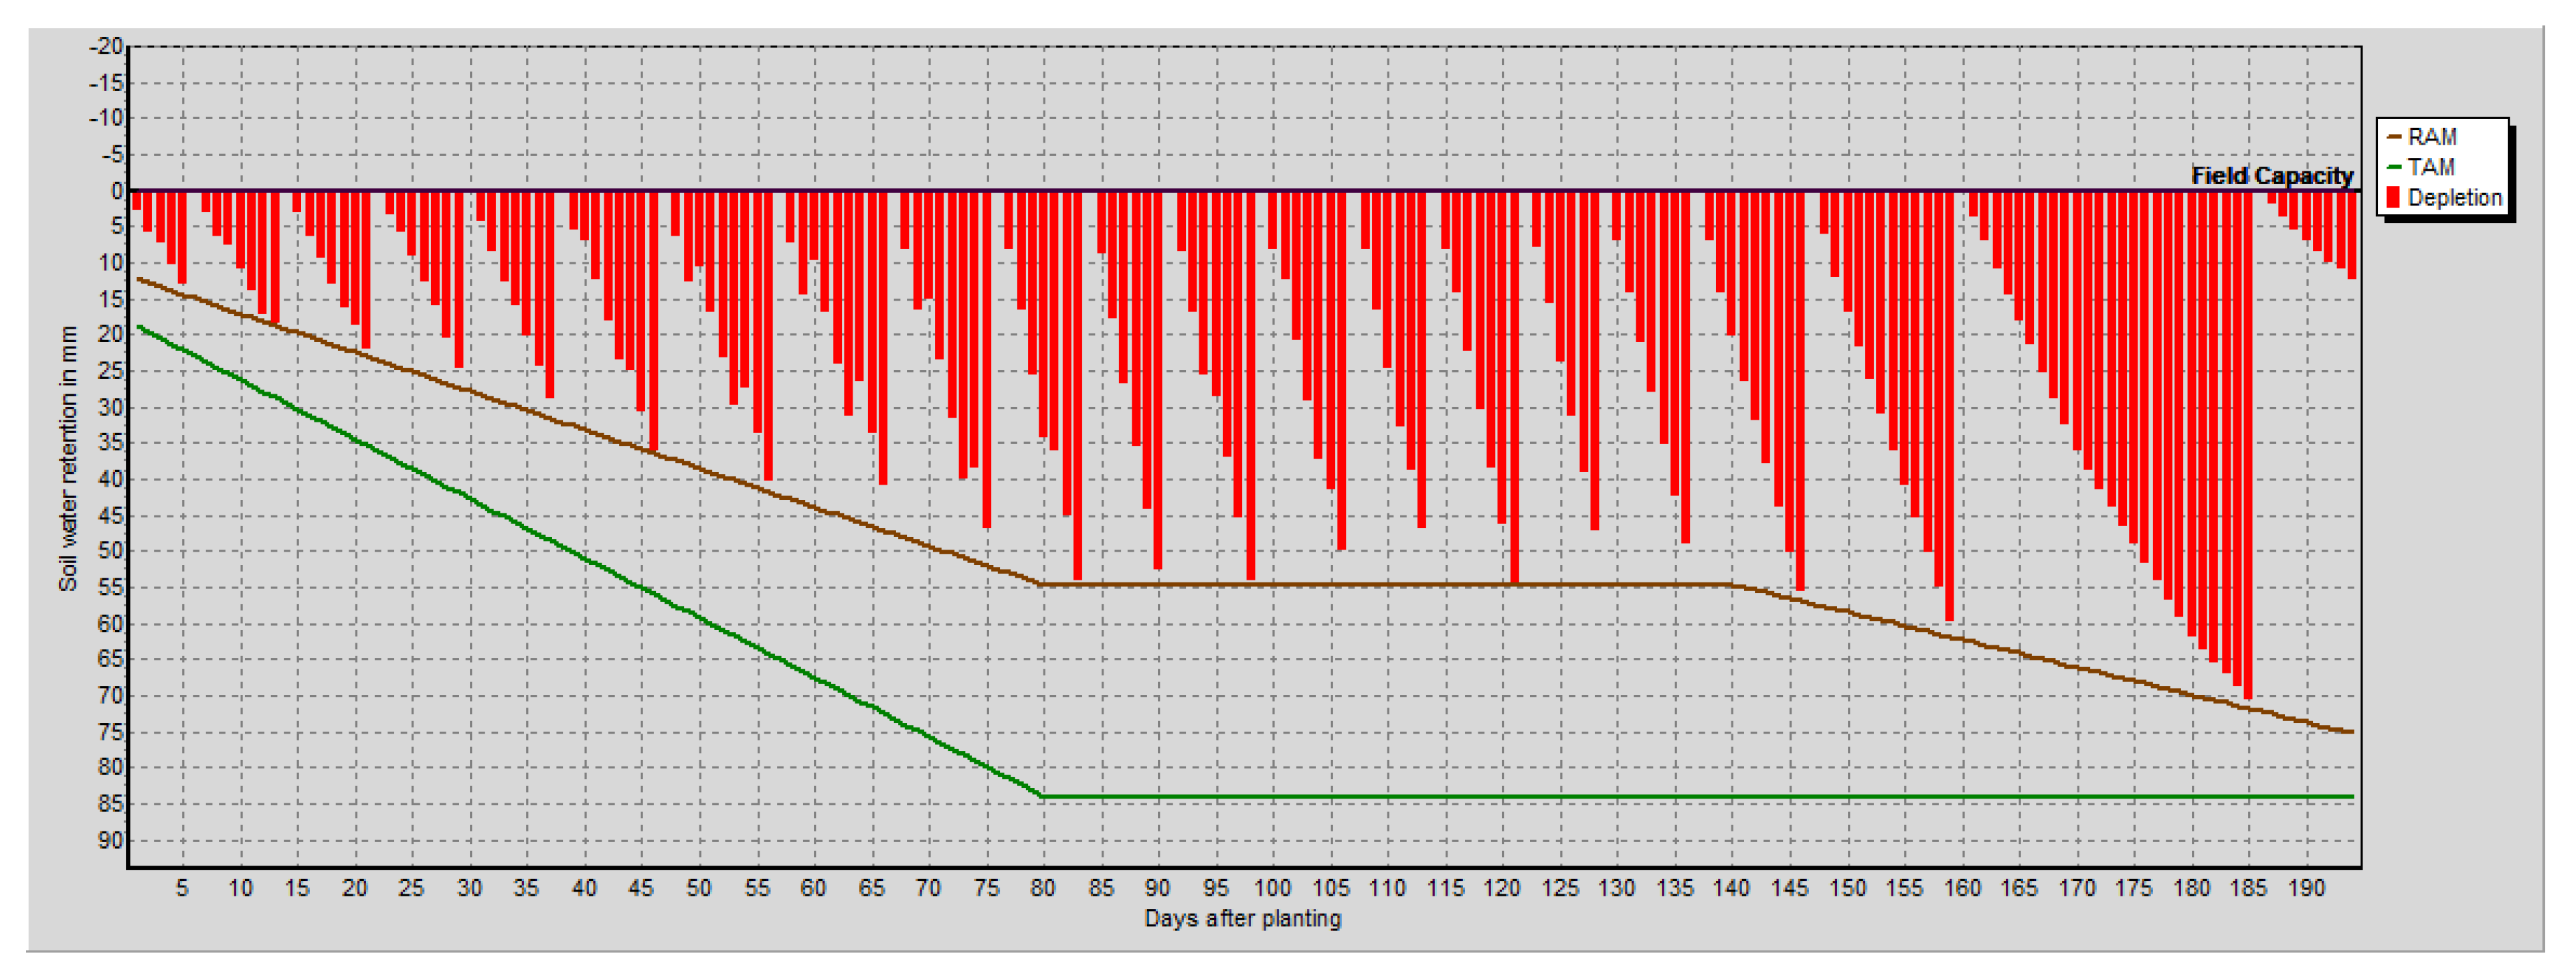
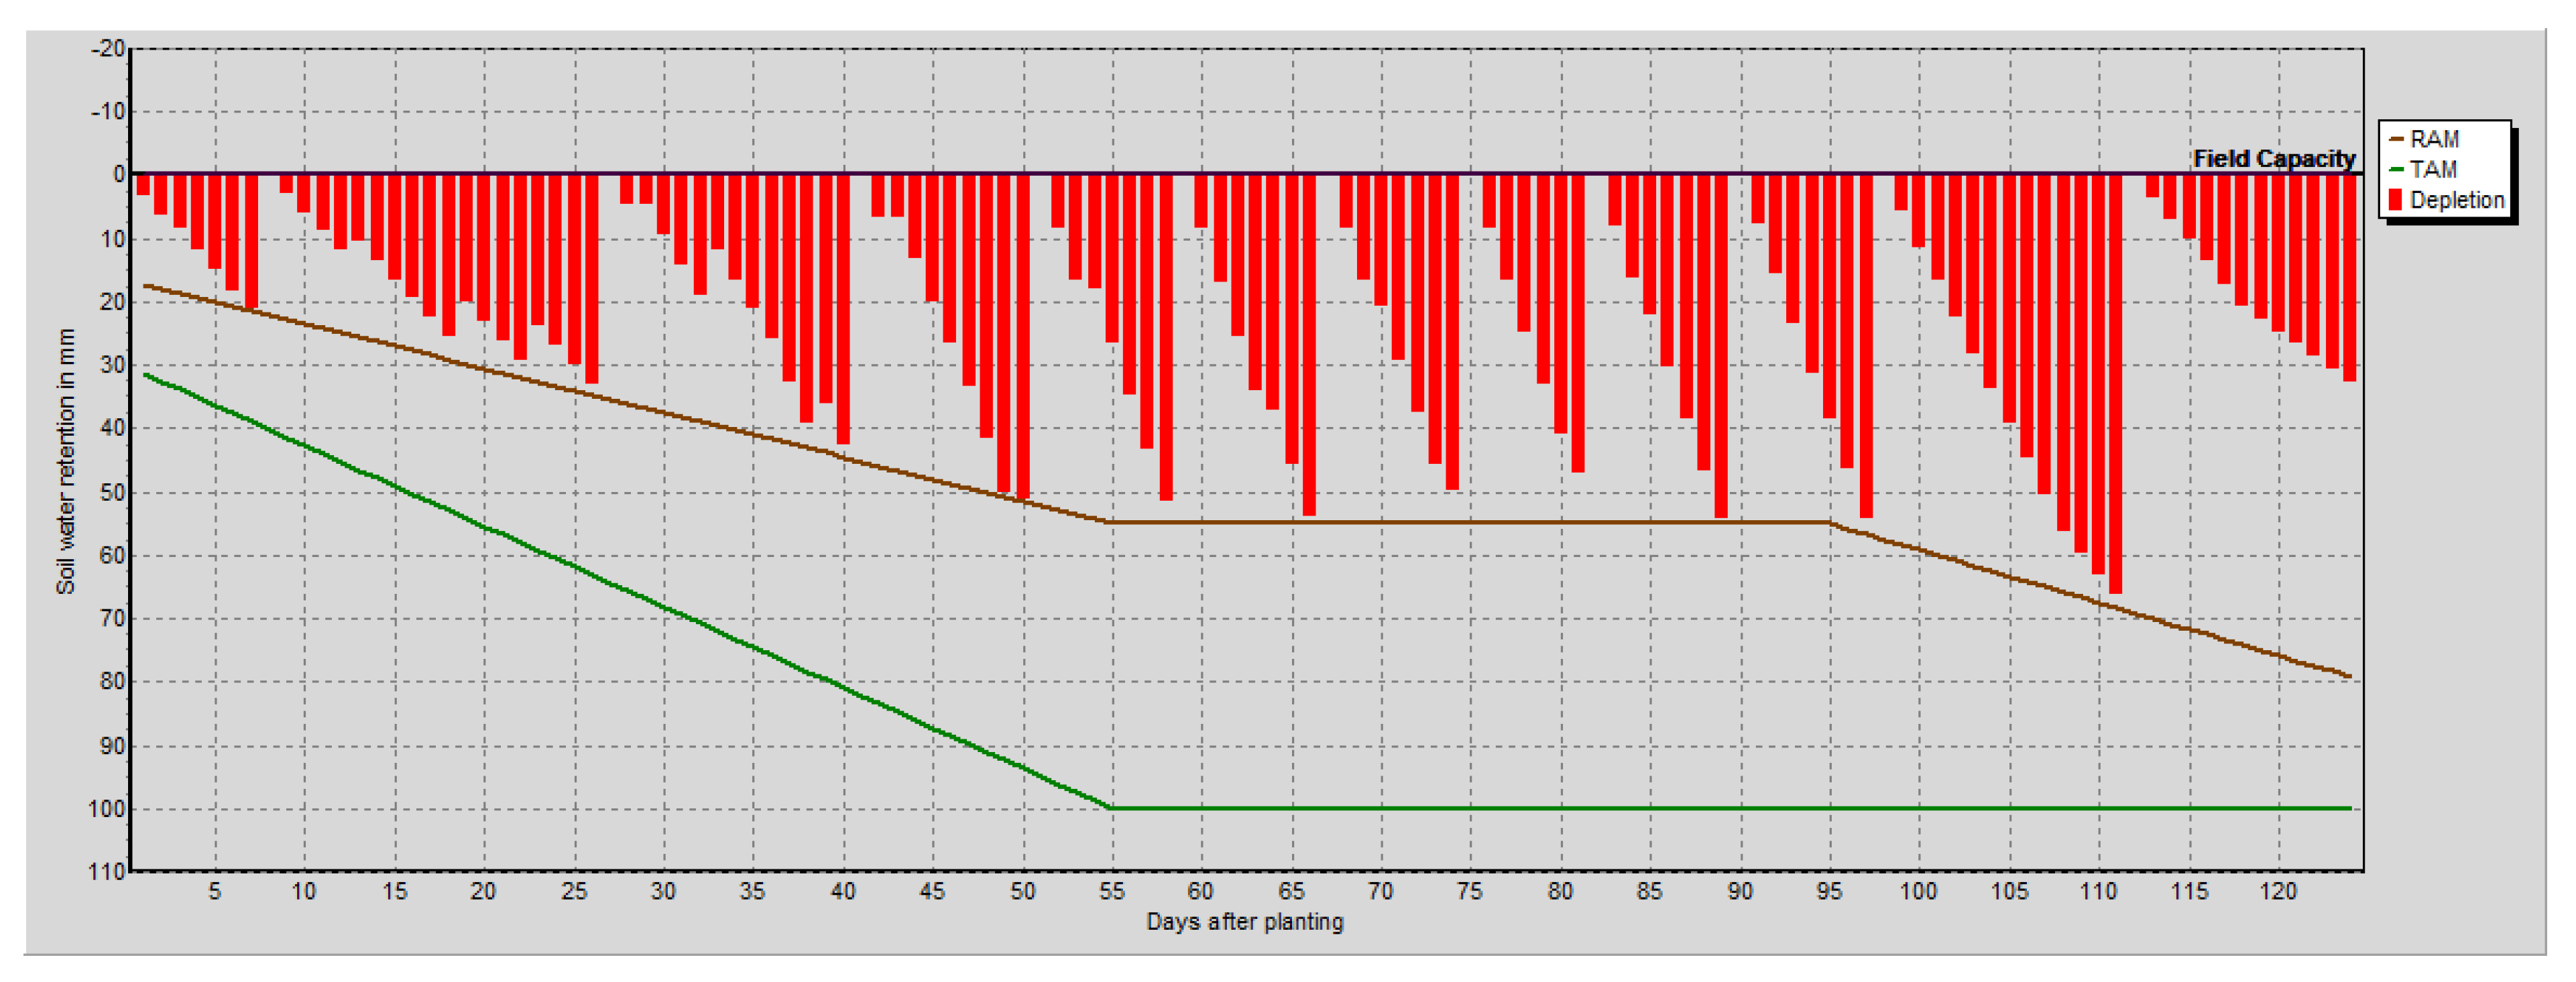
62], where it is shown that the rainfall frequency has decreased causing an increase in the number of dry days. The study’s findings revealed that ET0 ranged from 1.8 to 10.24 mm/day, while effective rainfall ranged from 2 to 31.3 mm in the Multan Region. Irrigation requirement for wheat, cotton, and rice were 209.5, 996.4, and 623.2 mm/dec, respectively. Crop water consumption is higher during the dry seasons (autumn and summer) and lower during the wet seasons (spring and winter).
The entire evaluation of this study revealed that the watershed has a water supply and demand disparity. Due to the lack of an effective irrigation committee and water management system, there is also a lot of conflict among users. The usage of conventional irrigation systems, which waste water and reduce water use efficiency, is the other issue in the watershed. Therefore, alternative water supply sources, including water harvesting technologies, should be researched, as well as various agricultural water management solutions should be put into practice in order to overcome the water deficit [64]. Additionally, alternative irrigation techniques, such as drip irrigation, should be established in the region, and irrigation scheduling should be used to increase the efficiency of irrigation water. There were similar findings from other studies on issues with water management; a lack of water availability and disputes between water users were also revealed. One of the difficulties in allocating water is the water demand brought on by the fast growth of the population and the rising need for agricultural irrigation. As a result of the tremendous demands placed on water resources and their unprecedented effects on socioeconomic development, this rapid rate of increase has serious repercussions. One of the issues in the river basins is a shortage of water. The main causes are the increased demand for fresh water caused by population development, the deteriorated water quality and contamination of surface and groundwater sources, and the loss of prospective fresh water supply sources brought on by outdated and inefficient water management techniques. Conflicts frequently occur when several river users compete for a constrained source of water [65].
There are other factors involved in water scarcity besides availability. It is a very contentious global problem that some have predicted may lead to the world’s next fatal conflicts, including the vice president of the World Bank. There are connections among many water issues in Northern Africa. Drinking water is frequently in scarce supply, precipitation is infrequent and uncertain, and the current infrastructure causes massive water losses through evaporation. In certain metropolitan locations, inhabitants only receive water once every 3 days. In other regions of the continent, the United Nations believe that patterns of unsustainable water usage, inadequate management, pollution, rising demand, and rapid population increase are to blame for a number of conflicts. According to UN predictions, by 2025, one in two Africans will reside in nations with water shortages [66,67]. In irrigation plans in the Southern Punjab Province, there are significant water losses. The majority of the time, earth canals and ditches used to distribute water to farmers’ fields are very badly maintained and suffer significant water loss through flow, infiltration, and leakage.

5. Conclusions

In this study, irrigation water requirement and evapotranspiration for the main crops have been determined using the ArcGIS 10.6 and CROPWAT 8.0 software in Southern Punjab, Pakistan. According to our finding, the build-up area increased, 57,581 Ha (15.78%), as compared to 1990. Urbanization is finished by the expansion of roadways, residences, and commercial and industrial structures. The total net irrigation and total gross irrigation were 72.4 mm and 103.5 mm for cotton, 67.8 mm and 99.8 mm for rice, and 44.1 mm and 63 mm for wheat. A few stream courses were altered to make room for new development. There may be some deep large-capacity wells that industries dig. Since less water will permeate the earth as a result of more pavement, there will be less water available to replenish the subsurface water table. The water table will drop as a result. Several existing wells can dry up because they are not deep enough to draw water from. Evapotranspiration ranged from 1.8 to 10.24 mm/day, while effective rainfall ranged from 2 to 31.3 mm in the study area. Irrigation requirements for cotton, rice, and wheat were 996.4, 623.3, and 209.5 mm/dec respectively. Due to this research area’s seasonal and biological characteristics, it is clear that irrigation scheduling and CWR were unique to the Multan territory. Cotton, the summer crop, required higher evapotranspiration, water, and frequent watering plans than the three main crops in the following order:
Cotton (996.4) > Rice (823.2) > Wheat (209.5)
The main results of the research increase our information of several important crops in the Multan region’s water needs, which can assist in the improvement of the water resources and yield through advanced technology based on these results. To calculate CWRs for all parts of Pakistan that lack such research, a thorough plan should be created. Additionally, there are no guidelines or regulations for managing the watershed or using the river appropriately. in irrigation plans in the Southern Punjab Province, there are significant water losses. Therefore, alternative water supply sources, including water harvesting technologies, should be researched, as well as various agricultural water management solutions should be put into practice in order to overcome the water deficit. Moreover, various irrigation techniques, such as drip irrigation, should be enhanced in the region to increase irrigation water efficiency. The findings of this research may be employed as a guidance for farmers to choose the quantity and frequency of irrigation for the crops being investigated, as well as by water resource planners for future planning, helping to conserve water in fulfilling the crop water requirements.

Author Contributions

Conceptualization: S.H., M.A.E. and W.N.; methodology, M.M., S.H. and A.R.; formal analysis, M.M., S.F., M.A.E. and M.A.; writing—original draft preparation, M.M., S.F., W.N. and A.R.; writing—review and editing, M.M., S.F. and A.R.; supervision, S.H. All authors have read and agreed to the published version of the manuscript.

Funding

This research received no external funding.

Institutional Review Board Statement

Not applicable.

Informed Consent Statement

Not applicable.

Data Availability Statement

The datasets used and/or analyzed during the current study are available in the article from the corresponding author on request.

Conflicts of Interest

The authors declare no conflict of interest.

References

  1. Al-Ansari, N.; Ali, A.; Knutsson, S. Iraq Water Resources Planning: Perspectives and Prognoses. In Proceedings of the International Conference on Civil and Construction Engineering, Jeddah, Saudi Arabia, 26–27 January 2015. [Google Scholar]
  2. Ehsan, M.A.; Tippett, M.K.; Almazroui, M.; Ismail, M.; Yousef, A.; Kucharski, F.; Omar, M.; Hussein, M.; Alkhalaf, A.A. Skill and predictability in multimodel ensemble forecasts for Northern Hemisphere regions with dominant winter precipitation. Clim. Dyn. 2017, 48, 3309–3324. [Google Scholar] [CrossRef]
  3. Ehsan, M.A.; Tippett, M.K.; Kucharski, F.; Almazroui, M.; Ismail, M. Predicting peak summer monsoon precipitation over Pakistan in ECMWF SEAS5 and North American Multimodel Ensemble. Inter. J. Climatol. 2020, 40, 5556–5573. [Google Scholar] [CrossRef]
  4. Ehsan, M.A.; Kucharski, F.; Almazroui, M. Potential predictability of boreal winter precipitation over central Southwest Asia in the North American Multi-Model Ensemble. Clim. Dyn. 2020, 54, 473–490. [Google Scholar] [CrossRef]
  5. Ewaid, S.H.; Abed, S.A. Water quality index for Al-Gharraf River, Southern Iraq. Egypt. J. Aquat. Res. 2017, 43, 117–122. [Google Scholar] [CrossRef]
  6. Al-Ansari, N.; Knutsson, S. Toward prudent management of water resources in Iraq. J. Adv. Sci. Eng. Res. 2011, 2011, 53–67. [Google Scholar]
  7. Ewaid, S.H.; Abed, S.A.; Kadhum, S.A. Predicting the Tigris River water quality within Baghdad, Iraq by using water quality index and regression analysis. Environ. Technol. Innov. 2018, 11, 390–398. [Google Scholar] [CrossRef]
  8. Ewaid, S.H. Irrigation water quality of Al-Gharraf Canal, south of Iraq. J. Phys. Conf. Ser. 2018, 1003, 012006. [Google Scholar] [CrossRef] [Green Version]
  9. Al-Ansari, N. Management of water resources in Iraq: Perspectives and prognoses. Engineering 2013, 5, 667–684. [Google Scholar] [CrossRef] [Green Version]
  10. Clarke, D.; Smith, M.; El-Askari, K. CropWat for Windows: User Guide; University of Southampton: Southampton, UK, 2001. [Google Scholar]
  11. Tariq, A.; Yan, J.; Ghaffar, B.; Qin, S.; Mousa, B.G.; Sharifi, A.; Huq, M.E.; Aslam, M. Flash Flood Susceptibility Assessment and Zonation by Integrating Analytic Hierarchy Process and Frequency Ratio Model with Diverse Spatial Data. Water 2022, 14, 3069. [Google Scholar] [CrossRef]
  12. Shah, S.H.I.A.; Jianguo, Y.; Jahangir, Z.; Tariq, A.; Aslam, B. Integrated geophysical technique for groundwater salinity delineation, an approach to agriculture sustainability for Nankana Sahib Area, Pakistan. Geomat. Nat. Hazards Risk 2022, 13, 1043–1064. [Google Scholar] [CrossRef]
  13. Khaydar, D.; Chen, X.; Huang, Y.; Ilkhom, M.; Liu, T.; Friday, O.; Farkhod, A.; Khusen, G.; Gulkaiyr, O. Investigation of crop evapotranspiration and irrigation water requirement in the lower Amu Darya River Basin, Central Asia. J. Arid. Land 2021, 13, 23–39. [Google Scholar] [CrossRef]
  14. Afzaal, H.; Farooque, A.A.; Abbas, F.; Acharya, B.; Esau, T. Computation of evapotranspiration with artificial intelligence for precision water resource management. Appl. Sci. 2020, 10, 1621. [Google Scholar] [CrossRef] [Green Version]
  15. Akram, R.; Turan, V.; Hammad, H.M.; Ahmad, S.; Hussain, S.; Hasnain, A.; Maqbool, M.M.; Rehmani, M.I.A.; Rasool, A.; Masood, N.; et al. Fate of organic and inorganic pollutants in paddy soils. In Environmental Pollution of Paddy Soils 2018; Springer: Cham, Switzerland, 2018; pp. 197–214. [Google Scholar] [CrossRef]
  16. Wahla, S.S.; Kazmi, J.H.; Sharifi, A.; Shirazi, S.A.; Tariq, A.; Joyell Smith, H. Assessing spatio-temporal mapping and monitoring of climatic variability using SPEI and RF machine learning models. Geocarto Int. 2022, 1–20. [Google Scholar] [CrossRef]
  17. Ghaderizadeh, S.; Abbasi-Moghadam, D.; Sharifi, A.; Tariq, A.; Qin, S. Multiscale Dual-Branch Residual Spectral-Spatial Network with Attention for Hyperspectral Image Classification. IEEE J. Sel. Top. Appl. Earth Obs. Remote Sens. 2022, 15, 5455–5467. [Google Scholar] [CrossRef]
  18. Farhan, M.; Moazzam, U.; Rahman, G.; Munawar, S.; Tariq, A.; Safdar, Q.; Lee, B. Trends of Rainfall Variability and Drought Monitoring Using Standardized Precipitation Index in a Scarcely Gauged Basin of Northern Pakistan. Water 2022, 14, 1132. [Google Scholar]
  19. Karuppasamy, M.B.; Natesan, U.; Karuppannan, S.; Chandrasekaran, L.N.; Hussain, S.; Almohamad, H.; Abdo, H.G. Multivariate Urban Air Quality Assessment of Indoor and Outdoor Environments at Chennai Metropolis in South India. Atmosphere 2022, 13, 1627. [Google Scholar] [CrossRef]
  20. Hussain, S.; Qin, S.; Nasim, W.; Bukhari, M.A.; Mubeen, M.; Fahad, S.; Aslam, M. Monitoring the Dynamic Changes in Vegetation Cover Using Spatio-Temporal Remote Sensing Data from 1984 to 2020. Atmosphere 2022, 13, 1609. [Google Scholar] [CrossRef]
  21. Waleed, M.; Mubeen, M.; Ahmad, A.; Habib-ur-Rahman, M.; Amin, A.; Farid, H.U.; El Sabagh, A. Evaluating the efficiency of coarser to finer resolution multispectral satellites in mapping paddy rice fields using GEE implementation. Sci. Rep. 2022, 12, 13210. [Google Scholar] [CrossRef]
  22. Hussain, S.; Mubeen, M.; Ahmad, A.; Majeed, H.; Qaisrani, S.A.; Hammad, H.M.; Nasim, W. Assessment of land use/land cover changes and its effect on land surface temperature using remote sensing techniques in Southern Punjab, Pakistan. Environ. Sci. Pollut. Res. 2022, 1–17. [Google Scholar] [CrossRef]
  23. Hussain, S.; Lu, L.; Mubeen, M.; Nasim, W.; Karuppannan, S.; Fahad, S.; Aslam, M. Spatiotemporal Variation in Land Use Land Cover in the Response to Local Climate Change Using Multispectral Remote Sensing Data. Land 2022, 11, 595. [Google Scholar] [CrossRef]
  24. Hussain, S.; Mubeen, M.; Karuppannan, S. Land use and land cover (LULC) change analysis using TM, ETM+ and OLI Landsat images in district of Okara, Punjab, Pakistan. Phy. Chem. Earth Parts A/B/C 2022, 126, 103117. [Google Scholar] [CrossRef]
  25. Hussain, S.; Mubeen, M.; Ahmad, A.; Masood, N.; Hammad, H.M.; Amjad, M.; Waleed, M. Satellite-based evaluation of temporal change in cultivated land in Southern Punjab (Multan region) through dynamics of vegetation and land surface temperature. Open Geosci. 2021, 13, 1561–1577. [Google Scholar] [CrossRef]
  26. Hussain, S.; Mubeen, M.; Ahmad, A.; Fahad, S.; Nasim, W.; Hammad, H.M.; Parveen, S. Using space–time scan statistic for studying the effects of COVID-19 in Punjab, Pakistan: A guideline for policy measures in regional agriculture. Environ. Sci. Pollut. Res. 2021, 1–14. [Google Scholar] [CrossRef] [PubMed]
  27. Majeed, M.; Tariq, A.; Anwar, M.M.; Khan, A.M.; Arshad, F.; Shaukat, S. Monitoring of Land Use–Land Cover Change and Potential Causal Factors of Climate Change in Jhelum District, Punjab, Pakistan, through GIS and Multi-Temporal Satellite Data. Land 2021, 10, 1026. [Google Scholar] [CrossRef]
  28. Hussain, S.; Karuppannan, S. Land use/land cover changes and their impact on land surface temperature using remote sensing technique in district Khanewal, Punjab Pakistan. Geo. Eco. Landsc. 2021, 1–13. [Google Scholar] [CrossRef]
  29. Mubeen, M.; Bano, A.; Ali, B.; Islam, Z.U.; Ahmad, A.; Hussain, S.; Fahad, S.; Nasim, W. Effect of plant growth promoting bacteria and drought on spring maize (Zea mays L.). Pak. J. Bot. 2021, 53, 731–739. [Google Scholar] [CrossRef]
  30. Hussain, S.; Mubeen, M.; Akram, W.; Ahmad, A.; Habib-ur-Rahman, M.; Ghaffar, A.; Amin, A.; Awais, M.; Farid, H.U.; Farooq, A.; et al. Study of land cover/land use changes using RS and GIS: A case study of Multan district, Pakistan. Environ. Monit. Assess. 2020, 192, 2. [Google Scholar] [CrossRef]
  31. Hussain, S.; Mubeen, M.; Ahmad, A.; Akram, W.; Hammad, H.M.; Ali, M.; Masood, N.; Amin, A.; Farid, H.U.; Sultana, S.R.; et al. Using GIS tools to detect the land use/land cover changes during forty years in Lodhran District of Pakistan. Environ. Sci. Pollut. Res. 2020, 27, 39676–39692. [Google Scholar] [CrossRef]
  32. Akram, R.; Amanet, K.; Iqbal, J.; Fatima, M.; Mubeen, M.; Hussain, S.; Fahad, S. Climate Change, Insects and Global Food Production. In Climate Change Ecosys; CRC Press: Boca Raton, FL, USA, 2022; pp. 47–60. [Google Scholar]
  33. Hussain, S.; Mubeen, M.; Sultana, S.R.; Ahmad, A.; Fahad, S.; Nasim, W.; Ahmad, S.; Ali, A.; Farid, H.U.; Javeed, H.M.R.; et al. Managing Greenhouse Gas Emission. In Modern Techniques of Rice Crop Production; Sarwar, N., Atique-ur-Rehman, Ahmad, S., Hasanuzzaman, M., Eds.; Springer: Singapore, 2022. [Google Scholar] [CrossRef]
  34. Din, M.S.U.; Mubeen, M.; Hussain, S.; Ahmad, A.; Hussain, N.; Ali, M.A.; Nasim, W. World Nations Priorities on Climate Change and Food Security. In Building Climate Resilience in Agriculture; Springer: Cham, Switzerland, 2022; pp. 365–384. [Google Scholar] [CrossRef]
  35. Naz, S.; Fatima, Z.; Iqbal, P.; Khan, A.; Zakir, I.; Ullah, H.; Ahmad, S. An Introduction to Climate Change Phenomenon. In Building Climate Resilience in Agriculture; Springer: Cham, Switzerland, 2022; pp. 3–16. [Google Scholar] [CrossRef]
  36. Masood, N.; Akram, R.; Fatima, M.; Mubeen, M.; Hussain, S.; Shakeel, M.; Nasim, W. Insect Pest Management Under Climate Change. In Building Climate Resilience in Agriculture; Springer: Cham, Switzerland, 2022; pp. 225–237. [Google Scholar] [CrossRef]
  37. Akram, R.; Jabeen, T.; Bukari, M.A.; Wajid, S.A.; Mubeen, M.; Rasul, F.; Hussain, S.; Aurangzaib, M.; Bukhari, M.A.; Hammad, H.M.; et al. Research on Climate Change Issues. In Building Climate Resilience in Agriculture; Jatoi, W.N., Mubeen, M., Ahmad, A., Cheema, M.A., Lin, Z., Hashmi, M.Z., Eds.; Springer: Cham, Switzerland, 2022; pp. 255–268. [Google Scholar] [CrossRef]
  38. Ahmed, M.; Aslam, M.A.; Hayat, R.; Nasim, W.; Akmal, M.; Mubeen, M.; Ahmad, S. Nutrient Dynamics and the Role of Modeling. In Building Climate Resilience in Agriculture; Springer: Cham, Switzerland, 2022; pp. 297–316. [Google Scholar] [CrossRef]
  39. Hussain, S.; Amin, A.; Mubeen, M.; Khaliq, T.; Shahid, M.; Hammad, H.M.; Nasim, W. Climate Smart Agriculture (CSA) Technologies. In Building Climate Resilience in Agriculture; Springer: Cham, Switzerland, 2022; pp. 319–338. [Google Scholar] [CrossRef]
  40. Islam, M.S.; Fahad, S.; Hossain, A.; Chowdhury, M.K.; Iqbal, M.A.; Dubey, A.; Sabagh, A.E. Legumes under Drought Stress: Plant Responses, Adaptive Mechanisms, and Management Strategies in Relation to Nitrogen Fixation. In Engineering Tolerance in Crop Plants against Abiotic Stress; CRC Press: Boca Raton, FL, USA, 2021; pp. 179–207. [Google Scholar]
  41. Sabagh, A.E.; Hossain, A.; Islam, M.S.; Iqbal, M.A.; Fahad, S.; Ratnasekera, D.; Llanes, A. Consequences and Mitigation Strategies of Heat Stress for Sustainability of Soybean (Glycine max L. Merr.) Production under the Changing Climate. In Plant Stress Physiology; IntechOpen: London, UK, 2020. [Google Scholar] [CrossRef]
  42. Hussain, S.; Ahmad, A.; Wajid, A.; Khaliq, T.; Hussain, N.; Mubeen, M.; Farid, H.U.; Imran, M.; Hammad, H.M.; Awais, M.; et al. Irrigation Scheduling for Cotton Cultivation. In Cotton Production and Uses; Springer: Singapore, 2020; pp. 59–80. [Google Scholar] [CrossRef]
  43. Zahoor, S.A.; Ahmad, S.; Ahmad, A.; Wajid, A.; Khaliq, T.; Mubeen, M.; Hussain, S.; Din, M.S.U.; Amin, A.; Awais, M.; et al. Improving Water Use Efficiency in Agronomic Crop Production. In Agronomic crops; Springer: Singapore, 2019; pp. 13–29. [Google Scholar] [CrossRef]
  44. Ali, M.; Mubeen, M.; Hussain, N.; Wajid, A.; Farid, H.U.; Awais, M.; Hussain, S.; Akram, W.; Amin, A.; Akram, R.; et al. Role of ICT in Crop Management. In Agronomic Crops; Springer: Singapore, 2019; pp. 637–652. [Google Scholar] [CrossRef]
  45. Iqbal, J.; Su, C.; Rashid, A.; Yang, N.; Baloch, M.Y.J.; Talpur, S.A.; Sajjad, M.M. Hydrogeochemical assessment of groundwater and suitability analysis for domestic and agricultural utility in Southern Punjab, Pakistan. Water 2021, 13, 3589. [Google Scholar] [CrossRef]
  46. CROPWAT Software, FAO, Land and Water Division. 2018. Available online: http://www.fao.org/land-water/databases-and-software/cropwat/en/ (accessed on 20 August 2022).
  47. Muñoz, G.; Grieser, J. CLIMWAT 2.0 for CROPWAT; Water Resources, Development and Management Service, Environment and Natural Resources Service; FAO: Rome, Italy, 2006; Available online: https://vdocuments.mx/climwat-20-for-cropwat-giovanni-munoz-and-juergen-grieser-.html?page=1 (accessed on 6 October 2022).
  48. Buringh, P. Soils and Soil Conditions in Iraq; Ministry of Agriculture: Baghdad, Iraq, 1960.
  49. Allen, R.G.; Pereira, L.S.; Raes, D.; Smith, M. Crop Evapotranspiration—Guidelines for Computing Crop Water Requirements—FAO Irrigation and Drainage Paper 56; FAO: Rome, Italy, 1998. [Google Scholar]
  50. FAO. Agriculture and Climate Change—Challenges and Opportunities at the Global and Local Level—Collaboration on Climate-Smart Agriculture; FAO: Rome, Italy, 2019; 52p. [Google Scholar]
  51. Smith, M.; Kivumbi, D.; Heng, L.K. Use of the FAO CROPWAT model in deficit irrigation studies. In Deficit Irrigation Practices; FAO: Rome, Italy, 2002. [Google Scholar]
  52. Pereira, L.S.; Allen, R.G.; Smith, M.; Raes, D. Crop evapotranspiration estimation with FAO 56: Past and future. Agric. Water Manag. 2015, 147, 4–20. [Google Scholar] [CrossRef]
  53. Valiantzas, J.D. Simplified forms for the standardized FAO-56 Penman–Monteith reference evapotranspiration using limited weather data. J. Hydrol. 2013, 505, 13–23. [Google Scholar] [CrossRef]
  54. Allen, R.G.; Pereira, L.S.; Smith, M.; Raes, D.; Wright, J.L. FAO-56 dual crop coefficient method for estimating evaporation from soil and application extensions. J. Irrig. Drain. Eng. 2005, 131, 2–13. [Google Scholar] [CrossRef] [Green Version]
  55. Djaman, K.; Irmak, S. Actual crop evapotranspiration and alfalfa-and grass-reference crop coefficients of maize under full and limited irrigation and rainfed conditions. J. Irrig. Drain. Eng. 2012, 139, 433–446. [Google Scholar] [CrossRef]
  56. Alemayehu, Y.A.; Steyn, J.M.; Annandale, J.G. FAO-type crop factor determination for irrigation scheduling of hot pepper (Capsicum annuum L.) cultivars. S. Afr. J. Plant Soil 2009, 26, 186–194. [Google Scholar] [CrossRef] [Green Version]
  57. Das, N.; Mondal, P.; Sutradhar, S.; Dhosh, R. Assessment of variation of land use/land cover and its impact on land surface temperature of Asansol subdivision. Egypt J. Remote Sens. 2021, 24, 131–149. [Google Scholar] [CrossRef]
  58. Azevedo, P.V.; de Souza, C.B.; da Silva, B.B.; da Silva, V.P. Water requirements of pineapple crop grown in a tropical environment, Brazil. Agric. Water Manag. 2007, 88, 201–208. [Google Scholar] [CrossRef]
  59. Some, L.; Dembele, Y.; Ouedraogo, M.; Some, B.M.; Kambire, F.L.; Sangare, S. Analysis of Crop Water Use and Soil Water Balance in Burkina Faso Using CROPWAT; CEEPA DP36; University of Pretoria: Pretoria, South Africa, 2006. [Google Scholar]
  60. Schnepf, R.D. Iraq’s Agriculture: Background and Status; Congressional Research Service, Library of Congress: Washington, DC, USA, 2003.
  61. Howell, T.A. Irrigation efficiency. In Encyclopedia of Water Science; Stewart, B.A., Howell, T.A., Eds.; Marcel Dekker: New York, NY, USA, 2003; pp. 467–472. [Google Scholar]
  62. Ewaid, S.H.; Abed, S.A.; Al-Ansari, N. Crop water requirements and irrigation schedules for some major crops in Southern Iraq. Water 2019, 11, 756. [Google Scholar] [CrossRef] [Green Version]
  63. Wahaj, R.; Maraux, F.; Munoz, G. Actual Crop Water Use in Project Countries: A Synthesis at the Regional Level; World Bank Publications: Washington, DC, USA, 2007; Volume 4288. [Google Scholar]
  64. Bhat, S.A.; Pandit, B.A.; Khan, J.N.; Kumar, R.; Jan, R. Water requirements and irrigation scheduling of maize crop using CROPWAT model. Int. J. Curr. Microbiol. Appl. Sci. 2017, 6, 1662–1670. [Google Scholar] [CrossRef]
  65. Hossain, M.B.; Yesmin, S.; Maniruzzaman, M.; Biswas, J.C. Irrigation scheduling of rice (Oryza sativa L.) using CROPWAT model in the western region of Bangladesh. Agriculturists 2017, 15, 19–27. [Google Scholar] [CrossRef] [Green Version]
  66. Memon, A.V.; Jamsa, S. Crop Water Requirement and Irrigation scheduling of Soybean and Tomato crop using CROPWAT 8.0. Inter. Res. J. Engineer. Technol. 2018, 5, 669–671. [Google Scholar]
  67. El-Shafei, A.A.; Mattar, M.A. Irrigation Scheduling and Production of Wheat with Different Water Quantities in Surface and Drip Irrigation: Field Experiments and Modelling Using CROPWAT and SALTMED. Agronomy 2022, 12, 1488. [Google Scholar] [CrossRef]
Figure 1. Location of study area (Multan District).
Sustainability 15 01768 g001
Figure 2. Flow chart for methodology.
Sustainability 15 01768 g002
Figure 3. Map of LULC for the years 1990 and 2020 in District Multan.
Sustainability 15 01768 g003
Figure 4. Irrigation schedules for wheat.
Sustainability 15 01768 g004
Figure 5. Irrigation scheduling for cotton.
Sustainability 15 01768 g005
Figure 6. Irrigation schedules for rice.
Sustainability 15 01768 g006
Table 1. LULC area distribution of District Multan from 1990 to 2020.
LULC Classes1990 2020 Change 1990–2020
Area (ha.)Area (%)Area (ha.)Area (%)Area (ha.)Area (%)
Vegetation area301,24482.53286,02378.36−152−4.17
Built-up area28,2467.7457,58115.7829,3358.037
Water bodies52861.4532190.88−2067−0.57
Bare soil30,2368.2818,1894.98−12,047−3.3
Total365,012100365,012100
Table 2. District Multan census 1981 to 2017.
CensusUrbanRuralTotalUrban RatioRural Ratio
1981797,4841,172,5911,970,07540.48%59.52%
19981,314,7481,802,1033,116,85142.18%57.82%
20172,058,2902,686,8194,745,10943.3856.62%
Change
1981–2017
1,260,8061,514,2282,775,0343%−3%
Table 3. Using software CLIMWAT tool integrated into the CROPWAT, rainfalls, climate parameters, and ET0 were determined on average for the years 1990 to 2020.
MonthMin TMax THumidityWindSunRadEToRainEff Rain
°C°C%km/DayhMJ/m2/Daymm/Daymmmm
January6.121.173957.112.61.876.9
February8.323.3661308.816.72.6898.9
March14.430521569.320.24.391918.4
April2036.74417310.924.96.441211.8
May25.541.74320712.2288.39109.8
June28.942.24533712.128.210.241312.7
July28.940633111024.98.026155
August28.338.3662949.222.77.033331.3
September2538.358225920.66.4565.9
October18.335.5531308.917.74.622
November11.729.459697.713.62.6222
December7.222.864866.711.51.9265.9
Average18.633.3571849.320.15.38180170.7
Table 4. Detail of the ETc, effective rainfall and CWR for wheat.
MonthDecadeStageKcETcETcEff RainIrr. Req.
Coeffmm/Daymm/Decmm/Decmm/Dec
Nov2Init0.30.764.50.34.3
Nov3Init0.30.7715.9
Dec1Init0.30.656.51.64.8
Dec2Deve0.360.696.92.14.8
Dec3Deve0.641.213.22.211.1
Jan1Deve0.941.6616.62.214.4
Jan2Mid1.141.9419.42.317.1
Jan3Mid1.152.3325.62.523.1
Feb1Mid1.152.7427.42.524.9
Feb2Mid1.153.0830.82.728.1
Feb3Late1.083.5283.824.1
Mar1Late0.823.1531.55.625.9
Mar2Late0.542.3823.86.916.9
Mar3Late0.341.7472.14
248.137.8209.5
Table 5. Detail of the ETc, effective rainfall and CWR for cotton.
MonthDecadeStageKcETcETcEff RainIrr. Req.
Coeffmm/Daymm/Decmm/Decmm/Dec
May2Init0.352.9417.61.816.1
May3Init0.353.1534.73.531.2
Jun1Init0.353.4934.92.732.2
Jun2Deve0.44.2842.82.440.4
Jun3Deve0.565.5555.57.747.8
Jul1Deve0.746.46415.748.3
Jul2Deve0.917.1971.921.450.5
Jul3Deve1.098.391.317.873.5
Aug1Mid1.218.8988.913.175.8
Aug2Mid1.218.58510.574.6
Aug3Mid1.218.27917.683.3
Sep1Mid1.218.1281.24.177
Sep2Mid1.217.9279.2178.3
Sep3Mid1.217.1371.30.970.5
Oct1Late1.166.0560.5159.5
Oct2Late1.054.8348.30.547.7
Oct3Late0.933.6840.50.639.9
Nov1Late0.822.6326.30.625.7
Nov2Late0.711.7917.90.517.3
Nov3Late0.631.457.30.56.8
1110113.9996.4
Table 6. Detail of the ETc, effective rainfall and CWR for rice.
MonthDecadeStageKcETcETcEff RainIrr. Req.
Coeffmm/DayMm/Decmm/Decmm/Dec
Jun2Init0.33.2219.31.418.1
Jun3Init0.32.9529.57.721.8
Jul1Deve0.353.0830.815.715.1
Jul2Deve0.64.7447.421.426
Jul3Deve0.876.6573.117.855.3
Aug1Mid1.148.3783.713.170.6
Aug2Mid1.218.5185.110.574.6
Aug3Mid1.218.27917.683.4
Sep1Mid1.218.1281.24.177.1
Sep2Late1.197.8178.1177.2
Sep3Late0.975.7570.956.1
Oct1Late0.683.5435.4134.4
Oct2Late0.442140.413.5
725.8102.6623.2
Table 7. Irrigation schedules for wheat.
DateDayStageRainKsEtaDeplNet IrrDeficitLossGr. IrrFlow
mmFract.%%mmmmmmmml/s/ha
2-Jan49Dev011005534.20048.90.12
25-Jan72Mid011005539.60056.60.28
11-Feb89Mid011005640.70058.10.4
26-Feb104End011006144.100630.49
24-MarEndEnd01072
Table 8. Irrigation schedules for cotton.
DateDayStageRainKsEtaDeplNet IrrDeficitLossGr. IrrFlow
mmFract.%%mmmmmmmml/s/ha
20-May6Init011007016.10022.90.44
28-May14Init011007321.700310.45
5-Jun22Init011007125.60036.60.53
13-Jun30Init1.111006527.80039.80.58
21-Jun38Dev011007034.40049.10.71
30-Jun47Dev011007341.70059.60.77
10-Jul57Dev011007246.60066.60.77
20-Jul67Dev0110065480068.50.79
29-Jul76Dev011006855.10078.71.01
6-Aug84Mid011007562.90089.81.3
13-Aug91Mid5.511006655.60079.41.31
21-Aug99Mid011007462.300891.29
29-Aug107Mid011006958.20083.11.2
5-Sep114Mid0110065550078.51.3
13-Sep122Mid0.511007361.70088.21.28
20-Sep129Mid0110065550078.61.3
28-Sep137Mid011006756.20080.31.16
8-Oct147End011007361.60088.11.02
21-Oct160End011007663.50090.70.81
16-Nov186End011008672.400103.50.46
25-NovEndEnd01015
Table 9. Irrigation schedules for rice.
DateDayStageRainKsEtaDeplNet IrrDeficitLossGr. IrrFlow
mmFract.%%mmmmmmmml/s/ha
22-Jun8Init011006024.10034.50.5
11-Jul27Dev011005837.60053.80.33
25-Jul41Dev011006049.40070.50.58
4-Aug51Dev011006359.60085.20.99
12-Aug59Mid011006060.200861.24
20-Aug67Mid011006362.60089.41.29
28-Aug75Mid011005858.20083.11.2
4-Sep82Mid011005555.20078.81.3
12-Sep90Mid011006262.20088.91.29
20-Sep98End0110062620088.61.28
4-Oct112End011007069.80099.80.82
17-OctEndEnd0110032
Disclaimer/Publisher’s Note: The statements, opinions and data contained in all publications are solely those of the individual author(s) and contributor(s) and not of MDPI and/or the editor(s). MDPI and/or the editor(s) disclaim responsibility for any injury to people or property resulting from any ideas, methods, instructions or products referred to in the content.

