Abstract
In the attainment of digitization and sustainable solutions under Industry 4.0, effective and economical technology like photogrammetry is gaining popularity in every field among professionals and researchers alike. In the market, various photogrammetry tools are available. These tools employ different techniques and it is hard to identify the best among them. This study is an attempt to develop a methodology for the assessment of photogrammetry tools. Overall, 37 photogrammetry tools were found via literature review and open sources, out of which 12 tools were shortlisted. The evaluation process consisted of three steps, i.e., metadata and visual inspection, comparison with the ground truth model, and comparison with the averaged-merged point cloud model. In addition, a validation test was also performed on the final sorted photogrammetry tools. This study followed a sustainable construction progress monitoring theme for rebar and covered the maximum number of photogrammetry tools for comparison by considering the most authentic evaluation and validation techniques, which make it exclusive.
1. Introduction
The development of digital data-acquisition technologies towards the attainment of 3-dimensional (3D) informational models has attracted the interest of the research community [1] (p. 1) and the construction sector [2,3]. Researchers are working to achieve sustainable solutions for enhancing the accuracy of construction progress monitoring operations via digitalization, as it reduces the required effort and human errors [4]. Three-dimensional (3D) reconstruction allows for capturing the appearance and geometry of a targeted scene or object [5]. Videogrammetry, photogrammetry, and laser scanning are renowned point cloud reconstruction techniques [4,6]. For scanning, Kinect sensors and terrestrial laser scanners (TLSs) are renowned scanning devices. At the same time, videogrammetry and photogrammetry operations can be achieved by data capturing via any video or image-capturing device, such as a camera, closed-circuit television (CCTV), smartphone, drone, or unmanned aerial vehicle (UAV). The literature reveals that laser scanning is the more applied technique compared with photogrammetry. In comparison, videogrammetry has been identified as the least favorite point cloud generation technique among researchers [7]. Moreover, laser scanning is considered to generate more reliable, accurate, and dense 3D point clouds [8]. However, laser scanning technology has some operational constraints, i.e., difficult to employ in a congested indoor environment, operational sensitivity, and high cost [9,10]. In recent times, significant advancement in computer vision and photogrammetry technology has been observed for generating detailed point cloud models [1]. There are a few significant aspects that make photogrammetry stand out as a competitor to laser scanners: (1) the input data (digital images can be captured via any imaging device), (2) 3D point cloud models can be densified and contain color information, (3) frames from video streams can be intercepted for the generation of the point cloud model, (4) photogrammetry has the capability of providing a high degree of automation, and (5) most importantly, the photogrammetry process is more economical than laser scanning [11,12]. Researchers have also integrated point cloud techniques with building information modeling (BIM) via comparing or superimposing 3D models and worked on devising cost-effective and sustainable solutions [7,13]. On the other hand, the evolution of UAV technology has decreased its cost, increasing its usage for photogrammetry operations [14]. Photogrammetry via UAVs has been adopted for both close-range and long-range applications, such as construction processes, post-disaster operations [15], cultural heritage, and especially for topographic monitoring [16], whereas few studies also identified promising results of photogrammetry for submerged topography [17]. Researchers have also utilized the photogrammetric technique for geodetic measurements along with the global navigation satellite system (GNSS) [18], and compared the UAV-based point cloud models (photogrammetric) with TLS-based point cloud models for inaccuracies [19].
In construction, rebar is considered a secondary structural element, but the main component of reinforced concrete (RC). Rebar monitoring is a time-consuming and rigorous process [20,21]. Researchers have performed very few studies via photogrammetry for rebar detection; mostly, researchers have adopted laser scanning for rebar progress monitoring [7]. The photogrammetric 3D reconstruction via point clouds is commonly performed by the structure from motion (SfM)-based pipeline, which may be densified by applying multi-view stereo (MVS) [5,22]. Generally, the 3D photogrammetric reconstruction tools consist of five steps, i.e., (1) feature detection, triangulation, (2) bundle adjustment and sparse reconstruction, (3) dense point cloud generation, (4) surface/ mesh generation, and (5) texture generation.
Based on internet sources and a literature review, almost 37 various photogrammetry tools and techniques were identified, out of which nine were found to be open-source and the remaining were commercial-paid [5,22,23,24,25,26]. Table 1 illustrates the general information related to the photogrammetry tools and techniques, parent developers, and mode of operation.

Table 1.
General information of photogrammetry tools and techniques.
It can be observed from the gathered information that several photogrammetry tools are available in the market, although better options among available photogrammetry tools are required to be assessed considering the construction working environment. The construction industry is inclined towards adopting Industry 4.0 (I4.0) technologies to achieve sustainability in construction processes and, by introducing less expensive solutions, the I4.0 working theme will be more successful [27,28]. Similarly, in the construction progress monitoring domain, among laser scanning, videogrammetry, and photogrammetry, researchers have declared photogrammetry as a less expensive technique with effective outcomes [3,6]. In light of the above discussion, this study aims to devise the most suitable methodology for assessing the most reliable preferences among available photogrammetry tools. Photogrammetry tools have been evaluated by considering a unique construction item, i.e., rebar as a test subject, via photogrammetric testing and simulations. Moreover, testing will be performed considering construction site data collection limitations and determining the minimum threshold limits for related parameters to achieve maximum outcomes. It is believed that the outcomes from this study will support researchers and industry professionals in comprehending the limitations among the tested photogrammetry tools and selecting the most suitable tool for their project. This study will improve the confidence of the research community and industry professionals in the implementation of photogrammetry techniques for construction processes in place of costly data-acquisition technologies emending a sustainable construction environment. Moreover, this study will promote the utilization of photogrammetry technologies in construction processes by giving confidence to industry stakeholders. One of the main hurdles to the digitalization of construction processes and I4.0 is the cost of technologies. Therefore, promoting economical solutions with effective outcomes will change the attitude of construction industry professionals towards the adoption of digital solutions, making the sustainable automated I4.0 dream successful.
Furthermore, the structure of this manuscript is composed of a literature review (Section 2) for studies focused on photogrammetry software applications, methodology (Section 3) discussing the evaluation criteria and validation testing procedures, results and discussion (Section 4) for analyzing the outcomes, and conclusion (Section 5).
2. Literature Review
2.1. Relevant Literature Collection
Studies related to performance assessment of various photogrammetry tools by comparison against various quality parameters were explored to attain the guidelines for progressing this study. Relevant articles were searched on Scopus and Web of Science (WoS) in the last six years, keeping particular search protocol, i.e., “(photogrammet* OR mvs OR sfm OR structure-from-motion OR multi-view stereo) AND (image* OR picture* OR photo) AND (algorithm OR tool* OR technique*)”. Following the study objective and defined protocols, a list of relevant articles was refined. The summary of collected related articles is illustrated in Table 2.

Table 2.
Summary of the related literature.
2.2. Summary of the Collected Literature
The main focus was given to those articles in which comparisons between several photogrammetry tools or software were studied based on various performed tests. A. H. Qureshi et al. [21] compared photogrammetry models of rebar grids for nine tools, i.e., ReCap Pro, 3DF Zephyr, Meshroom, VisualSFM, COLMAP, Regard 3D, PhotoModeler, Agisoft Metashape, and RealityCapture. The models were evaluated for basic information (such as computation time and number of dense point cloud) and values of percentage (%) model completion and % noise, which were calculated statistically. The comparison revealed that 3DF Zephyr and Agisoft Metashape outcomes were better than others. Eltner and Schneider [37] performed the quality assessment of digital elevation models (DEMs) via UAV-based images. Photogrammetry models were generated by VisualSfM, Bundler, APERO (cloud densification supported by MicMac), Pix4D, and Agisoft for datasets from three different cameras. The study also compared the 3D point cloud models of soil surface generated by TLS with UAV-image-based DEMs, and it was concluded that accurate results for soil surface reconstruction could be obtained by adopting photogrammetry tools. Murtiyoso and Grussenmeyer [36] reviewed the fundamental concepts in structure from motion (SfM) 3D point cloud reconstruction and photogrammetry. Case studies were performed for close-range images of buildings, i.e., a palace and church, taken by two different UAVs. Photogrammetry models were generated by Agisoft, Pix4D, APERO-MicMac, and PhotoModeler. Moreover, dense matching and aerial triangulation results were also assessed and compared for laser scanning data and photogrammetry point cloud models. The study illustrated that centimeter-level precision could be achieved for dense matching from the images. However, the quality of the onboard sensor may obstruct the accuracy. Alidoost and Arefi [35] compared 3DSurvey, Pix4Dmapper Pro, Agisoft Photoscan, and SURE for their capabilities by generating digital surface models, with high-density point clouds, of the historical site using an aerial view approach. This study covers the image acquisition process, generation of the point cloud, and accuracy assessment by evaluating the quality of 3D dense point cloud models and digital surface models by considering geometric as well as visual inspections. Delgado-Vera et al. [34] analyzed and compared several photogrammetry tools, i.e., Qgis, MicMac, OpenDrone Map, Ensoamic, VisualSFM, Insight3d, Agisoft, and Pix4d, considering the aerial view images for agricultural land. A case study was performed on the land of the “Agrarian University of Ecuador Experimental Research Center based in Mariscal Sucre, Milagro” using a drone and photogrammetry process to obtain orthophoto. Gabara and Sawicki [22] performed a study based on an image-based point cloud model of a railway track to determine the geometric parameters. Using a Digital Single-Lens-Reflex (DSLR) camera, six images of the railway track section were acquired. PhotoScan and RealityCapture were utilized to reconstruct 3D point cloud models and generate dense point clouds and the 3Dmesh models. The track cant and gauge were determined by another application named CloudCompare, for the defined cross sections. This study compared the result outcomes between adopted photogrammetry tools with the results of direct geodetic measurements. Verykokou and Ioannidis [33] developed a novel algorithm and compared its outcomes with Agisoft for image datasets containing planar surface, i.e., building roof. The testing was performed on UAV-captured images; the assessment was made in terms of the correctness and automation of the computed exterior orientation parameters. Bianco et al. [5] reported a comparison between different photogrammetry tools, i.e., Theia, COLMAP, VisualSFM, and OpenMVG, by reconstructed 3D point cloud models. This study also proposed an assessment procedure in which SfM pipelines were stressed by utilizing a realistic synthetic dataset and dataset attained by high-end devices. Moreover, a plug-in was developed for Blender software to manage the assessment of SfM pipeline and the formation of synthetic datasets. The evaluation procedure contained estimation errors and reconstruction errors for camera poses used in the reconstruction process. Catalucci et al. [23] defined the metrological characteristics and performances of photomodelling, which is based on photogrammetry principles and leads to the generation of 3D models from simple digital images. Moreover, the full potential was also tested for photogrammetric-based processing software, i.e., Agisoft, VisualSfM, and Autodesk Remake. The study verifies the precision and accuracy of photomodelling by utilizing a modified ICP algorithm for superficial, volumetric, and spatial evaluation criteria. Cui et al. [24] proposed a novel SfM methodology to address united framework issues. The designed hybrid structure-from-motion (HSfM)-BSfM method was compared for outcomes with available photogrammetry tools, i.e., Bundler, VisualSFM, and Theia COLMAP, for evaluation. The designed model was better at reconstructing 3D models for ambiguous and normal image datasets with robust and efficient outcomes. Rahaman and Champion [26] studied open-source photogrammetry software, i.e., Regard3D, VisualSfM, Python Photogrammetry Toolbox, COLMAP, and Agisoft, for their workflow, features, accuracy, and processing time. The evaluation and comparison were performed on two different datasets and 3D point cloud models were generated. A reference model or ground truth model (GTM) was produced via Metashape (Photoscan) for assessment of the average deviation of open-source software and CloudCompare software was used for comparison. Promising outcomes were achieved from open source software for usage and accuracy. Luo et al. [32] presented a subgraph-based efficient approach for improving the 3D point cloud reconstruction process following the optimization of the locally visible graph. The evaluation was performed between the proposed method, i.e., local readjustment method, and subgraph-based reconstruction pipeline, with photogrammetry software, i.e., VisualSFM, Thiea, HSFM, and COLMAP. The assessment process was performed via various synthetic and real datasets; the proposed methodology achieved good reconstruction quality and computational cost results. Zhang et al. [25] presented a novel “semantic-driven multi-view reconstruction technique” to generate realistic 3D point cloud models considering humans as test objects. Evaluations were made by comparing the proposed method fragmentation-based multi-view technique with OpenMVS, PMVS, and COLMAP. Good results were achieved with the developed methodology in terms of accuracy and robustness, on textureless regions and near occlusion boundaries. The method implies the deep-learning-based estimation of proxy models and performs 3D-fragmented labeling on warped proxy models separating various portions. Afterward, the multi-view stereo reconstruction process was performed by employing fragment labels and depth of proxy human models. Reljić et al. [31] evaluated various photogrammetric models considering image data on software packages, i.e., Agisoft Metashape, RealityCapture, Meshroom, and 3DF Zephyr. The study via visual qualitative inspections examined the major parameters on reconstructed 3D face statue models. Peña-Villasenín et al. [30] performed a study by employing SfM to analyze historical building façade (San Martín Pinario). The comparison was examined between Autodesk Remake, Agisoft PhotoScan, and Pix4D for performance, accuracy, visual quality, geometric quality, operational usefulness, and ease of use. Y. Wang et al. [29] proposed MVS based on a novel methodology for the evaluation of complex fabric appearances by reconstructing 3D models to overcome visual expression difficulty, information loss, and low accuracy. High accuracy and effective dense point cloud reconstruction were achieved by adopting varying scale-wise planar patches, the normalized cross-correlation (NCC) algorithm, and particle swarm optimization (PSO) method. The reconstructed models were analyzed for the proposed PSO method with multi-view environment (MVE) and cluster multi-view stereo- patch based multi view stereo (CMVS-PMVS) for evaluation of the precision of the 3D fabric surface, as well as a 3D illustration, structural analysis, and quality evaluation. The study also highlighted and suggested the importance of artificial intelligence (AI) in production processes in the textile industry.
The overview of the abovementioned literature identifies that VisualSFM, Agisoft Metashape, MicMac, and COLMAP are the most adopted photogrammetry tools in comparative studies. However, the outcomes show that, depending on the type of test object, site conditions, and mode of data collection, the performance of the photogrammetry tool may vary. Moreover, for evaluation criteria, most of the studies have attained basic 3D point cloud information and visual inspections and very few have performed comparative analyses with ground truth models (GTMs) or basic models of test objects. For aerial point clouds, evaluation was performed by adopting absolute point cloud assessments (spatial errors) and relative point cloud assessments (RMSE). Few studies have also compared point cloud models attained via photogrammetry tools with laser-scanned models and found photogrammetric models accurate enough to attain reliable details.
3. Methodology
A methodology was designed to appraise and identify the better options among the listed photogrammetry tools considering past literature and expert opinions from professionals. Following this, the expert views were taken from the research platform named Research Gate. The study was distributed into three main phases, i.e., the sorting phase, evaluation phase, and validation phase. A summary of the layout of the devised study methodology and strategy flow chart is illustrated in Figure 1.
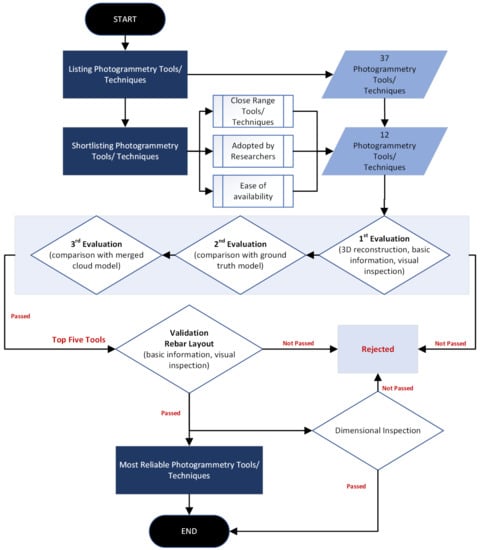
Figure 1.
Study flow chart.
As already discussed, following the past literature and internet sources, 37 photogrammetry tools were identified, out of which nine were open-source and the remaining were paid software. Out of these 37 photogrammetry tools, 12 tools were shortlisted. The criteria were established based on a defined protocol for the shortlisting of photogrammetry tools. The protocol was set for photogrammetry tools offering close-range photogrammetry, being adopted by researchers in various studies, and ease of availability of tools for testing purposes via the internet. Out of these selected tools, eight were open-source (i.e., Regard 3D, 3DF Zephyr, COLMAP, Meshroom, VisualSFM, MicMac, OpenMVG, and MVE) and the remaining four were commercial-paid tools (RealityCapture, PhotoModeler, Agisoft Metashape, and ReCap Pro).
For initial testing, two rebar datasets were developed for evaluating these tools, consisting of 50 images (dataset 1) and 100 images (dataset 2). At this stage, the main purpose was to perform the preliminary screening evaluation process, based on each photogrammetry tool’s effectiveness and performance outcomes. Therefore, datasets were developed by considering single rebar and images were taken from all angles and sides. The sample images of the generated datasets are shown in Figure 2.
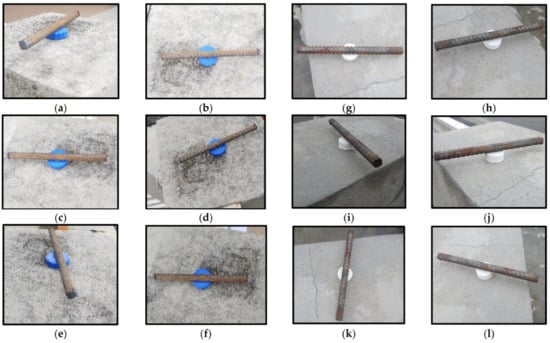
Figure 2.
Sample images of dataset 1 (a–f) and dataset 2 (g–l).
While capturing images for datasets 1 and 2, the angle of capture was established in line with the object from 0 to all over to 180 and all-around to 360, as shown in Figure 3. The object was covered considering significant view angles to evaluate sorted tools for maximum input details with the best outcomes.
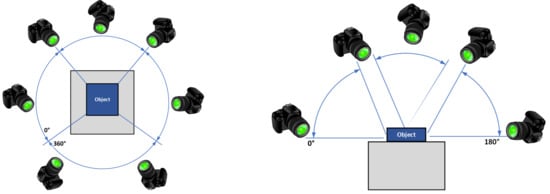
Figure 3.
Angle of capture for 0 to 360 all around and 0 to 180 all over.
Testing of shortlisted photogrammetry tools was performed by following three evaluation processes. In the first process, by following the developer guidelines, point cloud models were generated from the selected tools. In this evaluation, models were compared in terms of information such as the number of dense points, computational time, point cloud density, visual inspection of the 3D model for noise, and percentage (%) completion. CloudCompare [38] was used for collecting the aforementioned information from the reconstructed point cloud models. In the second evaluation process, point clouds from each tool were compared with the rebar’s ground truth model (GTM), developed by computer-aided design (CAD) software. The comparison with GTM helps to identify the error and accuracy of the reconstructed point cloud, the point cloud geometry, and non-uniform point cloud densities [39]. Such a comparison may be achieved by applying the iterative closest point algorithm (ICP) [40,41], which determines the translation and rotation alignment errors (registration errors) of one point cloud in reference to another, labeled as a measured point cloud and reference point cloud. Moreover, geometric distortion errors can be evaluated by applying a first-order approximation of the point-to-point distance between point cloud models [42]. The results are concluded in terms of volumetric errors and deviation distributions [23]. Therefore, two comparison methods were adopted via CloudCompare, the cloud-to-cloud (C2C), which is based on ICP, and multiscale model-to-model cloud comparison (M3C2). The M3C2 algorithm developed by Lague et al. [43] evaluates the changes in 3D features by considering the time-based spatial information in the cloud models [41]. Thus, the evaluation was based on the attained mean and standard deviation (SD) of the volumetric error distribution. Other than the aforementioned evaluations, to assess photogrammetry tools in a more refined way, a state-of-the-art evaluation methodology was devised. In this third evaluation process, an average point-cloud model was generated by merging reconstructed point cloud models attained from each tool. Afterwards, the averaged-merged point cloud (AMPC) model was compared with the point cloud model of each tool for C2C and M3C2 analyses via CloudCompare to assess volumetric errors.
Later, based on the initial three evaluation processes, five photogrammetry tools were selected for final testing and validation. The validation process was performed by considering basic metadata information, statistical analyses, and visual inspection of the generated 3D point cloud models. For this validation process, two new datasets were developed by considering the rebar layout formation, with 30 images (dataset 3) and 50 images (dataset 4). Datasets were prepared by considering the rebar layout along with rebar overlapping at random joints, as shown in Figure 4.
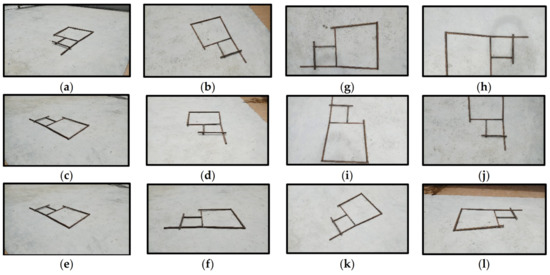
Figure 4.
Sample images of dataset 3 (a–f) and dataset 4 (g–l).
The ground truth dimensions (GTDs) of both datasets (3 and 4) were noted; Figure 5 illustrates the GTD details of the datasets (3 and 4).
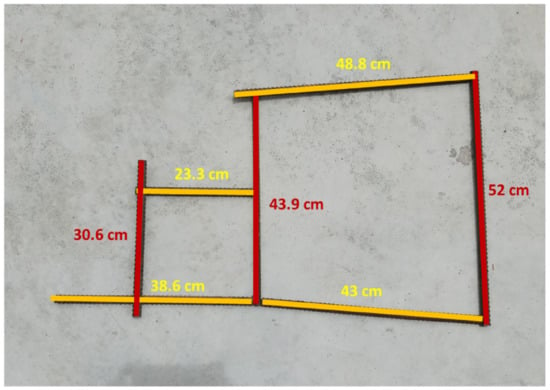
Figure 5.
GTD details of the datasets (3 and 4).
Moreover, images were taken following specific guidelines, i.e., the angle of capture for these datasets (3 and 4) was set between 30 and 150 all over and 0 and 360 all around, as shown in Figure 6.
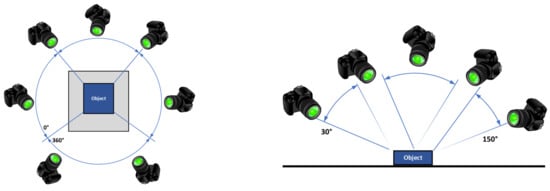
Figure 6.
Angle of capture 0 to 360 all around and 30 to 150 all over.
3.1. Basic Metadata and Statistical Analyses
In this part of the validation test, the attained point clouds were evaluated for five parameters, i.e., the number of dense points cloud, the computational time, point cloud density, percentage (%) model completion, and % noise. The models were imported into CloudCompare and analyzed to determine the point cloud density and the number of dense points cloud. However, the computational time of each tool was noted separately until the complete photogrammetry process was achieved.
The statistical analyses were performed considering two criteria, i.e., the % model completion and % noise. For % model completion, the generated models were imported into CloudCompare and scaled up to the GTDs. In each model, the generated rebars were measured for lengths considering all seven rebars individually. The GTD length of each rebar in the datasets varies (Figure 5); however, the cumulative running length for each dataset for all seven rebars in the grid framework was 280 ± 1 cm. To attain the percentage completion of the generated point cloud model, the rebar lengths of each attained point cloud model were compared to GTDs of the rebar dataset. Equation (1) was employed to calculate the % completion of each model.
where %C = % completion of rebar, LG = GTD of rebars, and LC = calculated length of rebars.
In contrast, to evaluate the % noise, each scaled-up model was cropped for nearby 65 cm × 100 cm (±5 cm), i.e., an approximately 6500 sq.cm area around the rebar grid framework using CloudCompare. The overall number of points cloud was noted and regions with noise were identified. Using CloudCompare, the noise was removed for each model separately and the number of points cloud was noted again. Thus, the % noise for each model was determined by evaluating the difference between the two readings using Equation (2).
where %N = % noise, NC = number points cloud in the cleaned model, and Ni = number of points cloud in the initial model.
3.2. Visual Inspection
In this part of the validation test, models were evaluated by performing a visual inspection for shape distortion and reviewing models’ layouts for rebar overlaps. In the rebar layout, the rebars were overlapped on random joints to evaluate the outcome for better overlapped joint details. However, the reason for such an arrangement was to validate the models by considering the practical site condition of image capturing for the rebar layout.
4. Results and Discussion
The 12 shortlisted photogrammetry tools were tested following three different evaluation criteria. Subsequent to these evaluations, validation was performed on the top five finest photogrammetry tools to identify the most reliable options among them. The attained results from the performed tests were discussed in the below sections.
4.1. Metadata and Visual Inspection
In the first evaluation, by following the developers’ guidelines, 3D point cloud rebar models were generated from each photogrammetry tool. However, a few aspects and constraints were identified among these selected tools while testing. It was found that commercial-paid photogrammetry tools were designed with an elite software-based graphical user interface (GUI) and many options. On the other hand, open-source photogrammetry tools and techniques GUI vary in this regard, i.e., few open-source photogrammetry tools provide simple GUI, while few perform photogrammetry processes on developed binaries operated via Command Prompt (cmd) or Windows PowerShell or python pipeline files such as MicMac OpenMVG + OpenMVS, and MVE. Unlike other software, most of the tutorials available for MicMac are in the French language. Three-dimensional (3D) point cloud generation with OpenMVG requires OpenMVS for densification, but it is optional. Moreover, 3DF Zephyr provides free processing for up to 50 images; for over 50 images, a paid subscription is required. ReCap Pro upload pictures to Autodesk-ReCap Pro-based cloud server; the processing and downloading of point cloud file from a server depends upon the availability of slot, as projects get in-line for point cloud processing. It was also observed that each tool’s level of difficulty in executing the photogrammetry process varies.
All 12 of the selected photogrammetry tools were tested for 3D reconstruction of point clouds for the same rebar images of dataset 1 and dataset 2, separately. Although dataset 1 and dataset 2 were prepared according to the same guidelines, different criteria were set for evaluation for both datasets. Dataset 1 was evaluated for attained 3D models considering the surroundings, whereas dataset 2 was evaluated only considering rebar. Thus, each photogrammetry tool was tested by considering two different scenarios for the same circumstances. This helped in the evaluation process to highlight the discrepancies in the 3D model generation by each tool for feature assessment and detailing capability. Figure 7 represents the outcomes of 3D point cloud models attained from dataset 1 (50 images).
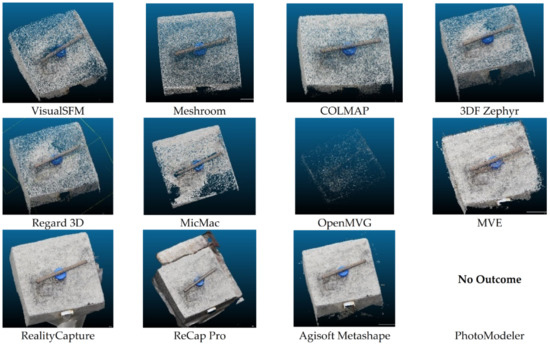
Figure 7.
3D point cloud models attained from dataset 1.
Figure 8 represents the outcomes of 3D point cloud models attained from dataset 2 (100 images), respectively.
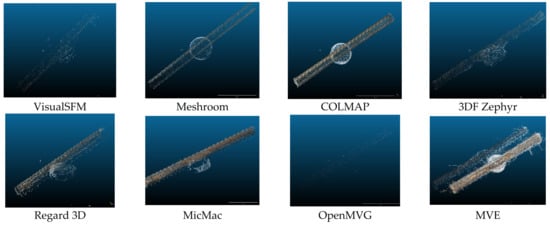

Figure 8.
3D point cloud models attained from dataset 2.
In this evaluation, basic 3D model parameters were examined, which include computational time, number of dense points, volume density, percentage (%) model completion, and so on. Moreover, shape distortion and noise in the generated models were measured by setting a scale between ‘very high’, ‘high’, ‘medium’, ‘low’, ‘very low’, and ‘nil’. Moreover, the level of model generation difficulty was assessed for each tool and the scale was set between ‘hard’, ‘medium’, and ‘easy’. Table 3 summarizes the information attained from the assessment of the generated point cloud models.

Table 3.
Metadata of reconstructed 3D point clouds.
Major parameters that were analyzed in this evaluation were computational time, the number of generated points cloud, volume density, visual inspection of the model, and related information. It can be observed among open-source tools VisualSFM (5 min for dataset 1, 7 min for dataset 2) and among commercial tools that RealityCapture (3 min for dataset 1, 5 min 30 s for dataset 2) performed the 3D point cloud model generation in less time than the other tools. Moreover, the highest number of dense points was attained by MVE (5,536,179 points for dataset 1,874,108 points for dataset 2), Agisoft Metashape (2,028,693 points dataset 1), and COLMAP (173,715 points for dataset 2). However, the high number of dense points does not guarantee the best model, as the MVE reconstructed models were noisy and the model completion percentage was 85% (dataset 1) and 70% (dataset 2). Overall, unsatisfactory outcomes were obtained by PhotoModeler, i.e., for dataset 1, no outcome was obtained and, for dataset 2, a distorted model shape was observed (60% completion rate). Likewise, very low results were obtained by OpenMVG + OpenMVS with a completion rate of 60% for dataset 1 and 50% for dataset 2. ReCap Pro gave almost 90% completed models for both datasets; however, noise level and shape distortion were observed at a high rate. Overall, satisfactory outcomes were attained by Meshroom, COLMAP, 3DF Zephyr, RealityCapture, and Agisoft Metashape.
4.2. Comparison with GTMs
In the second evaluation process, the GTMs of rebar were developed, for dataset 1 and dataset 2, using CAD software. Three-dimensional (3D) reconstructed models (point cloud models generated during the first evaluation) and GTMs were compared using CloudCompare for C2C and M3C2 comparisons tests. Both tests were performed on all 3D reconstructed models with GTM and differences between models were observed by evaluating the mean, SD, and volumetric error graphical representation. Hence, the greater the SD, the greater the deviation from GTM. Likewise, the greater the color band distributions in the graphs, the greater the volumetric differences in the reconstructed models. Figure 9 illustrates the output view of the compared models, i.e., GTMs with 3D point cloud models of dataset 1 (50 images).
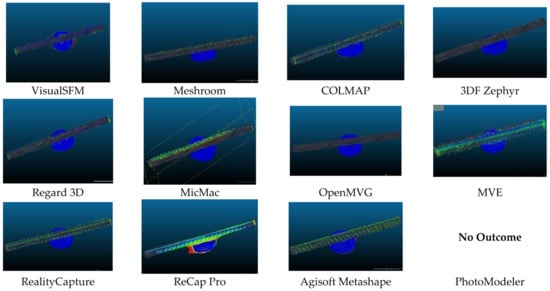
Figure 9.
GTMs with 3D point cloud models of dataset 1.
Figure 10 illustrates the output view of compared models, i.e., GTMs with 3D point cloud models of dataset 2 (100 images).
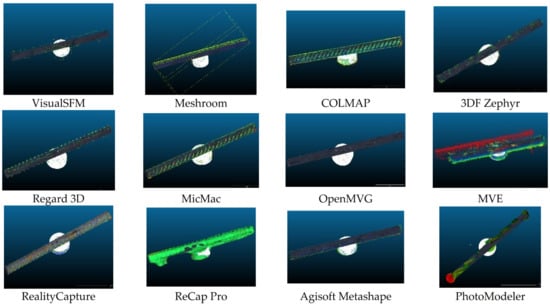
Figure 10.
GTMs with 3D point cloud models of dataset 2.
Table 4 illustrates the summary of the comparison of 3D point cloud models with GTMs for mean and SD, whereas Figure 11 and Figure 12 show the graphical representation of volumetric differences for M3C2 for dataset 1 and dataset 2, respectively.

Table 4.
Comparison of 3D point cloud models with GTMs for mean and SD.
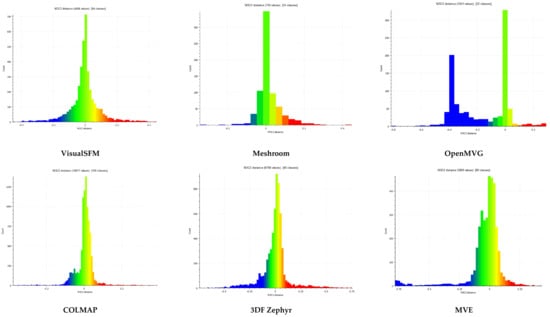
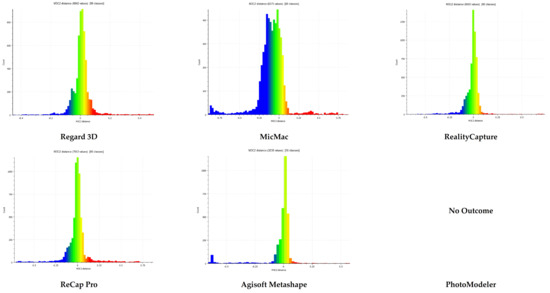
Figure 11.
M3C2 graphical representation of volumetric differences for GTMs (dataset 1).
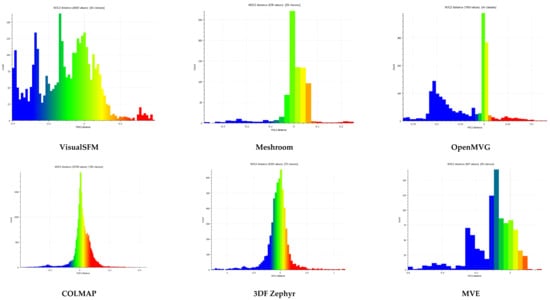
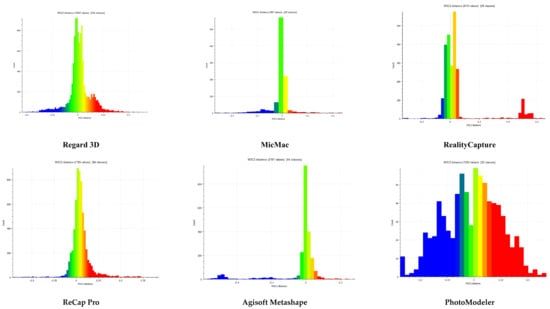
Figure 12.
M3C2 graphical representation of volumetric differences for GTMs (dataset 2).
PhotoModeler, MVE, and OpenMVG were disregarded in this evaluation due to their unsatisfactory 3D reconstructed point cloud models. Likewise, MicMac (dataset 2) and ReCap Pro (dataset 1) 3D reconstructed models were also disregarded due to incomplete model reconstruction (75%) and shape distortion (high) (referred to Table 3), respectively. Among open-source tools, the lowest SD and less volumetric error were observed in Meshroom and COLMAP models for both C2C and M3C2 comparisons. However, satisfactory results were also observed for VisualSFM (dataset 1: C2C and M3C2), 3DF Zephyr (dataset 1: C2C), and Regard 3D (dataset 1: C2C and M3C2). Among commercial-paid tools, RealityCapture (dataset 1) was found to be with the lowest SD and low volumetric error for both C2C and M3C2 comparisons. However, satisfactory outcomes were observed for Agisoft Metashape (dataset 1 and dataset 2: C2C).
4.3. Comparison with AMPC Models
To evaluate the best photogrammetry tools, a state-of-the-art methodology was devised. An averaged point cloud model was developed by merging the reconstructed 3D point cloud models into one averaged-merged point cloud (AMPC) model. Two AMPC models were developed, one for each dataset, i.e., dataset 1 and dataset 2. In this process, noisy and distorted reconstructed models, such as OpenMVG, MVG, PhotoModeler, and ReCap Pro, were disregarded to obtain a significant merged model. Afterward, the comparison between attained AMPC and each 3D reconstructed point cloud model was performed to evaluate their volumetric error differences. Figure 13 illustrates the comparison of 3D point cloud models with the AMPC model for dataset 1 (50 images).
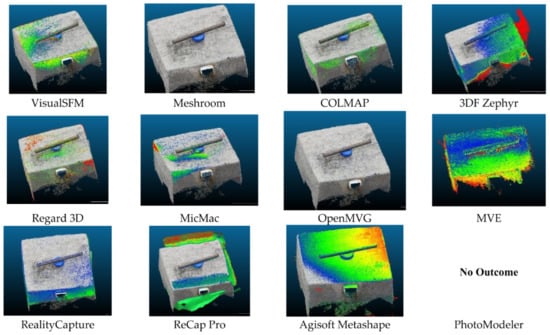
Figure 13.
Comparison of 3D point cloud models and the AMPC model for dataset 1.
Figure 14 illustrates the comparison of 3D point cloud models with the AMPC model for dataset 2 (100 images).
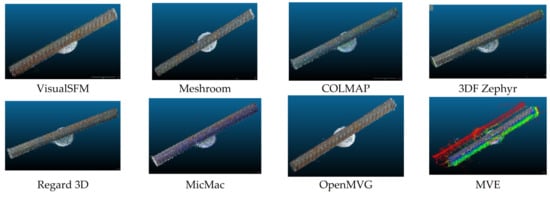

Figure 14.
Comparison of 3D point cloud models and AMPC model for dataset 2.
Table 5 illustrates the summary of the comparison of 3D point cloud models with the AMPC model for mean and SD under C2C and M3C2, and Figure 15 and Figure 16 illustrate the volumetric error distribution via M3C2 for dataset 1 and dataset 2, respectively.

Table 5.
Comparison with the merged model.
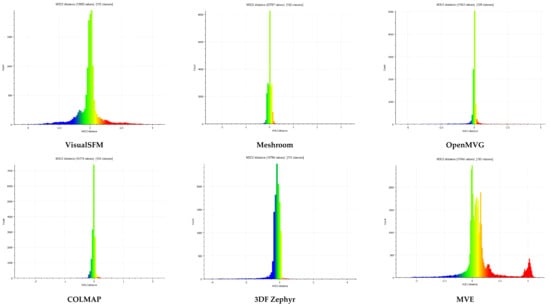
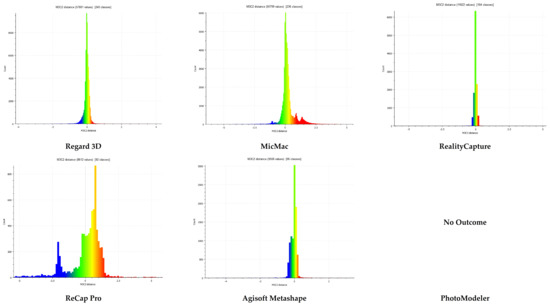
Figure 15.
M3C2 graphical representation of volumetric differences for AMPC (dataset 1).
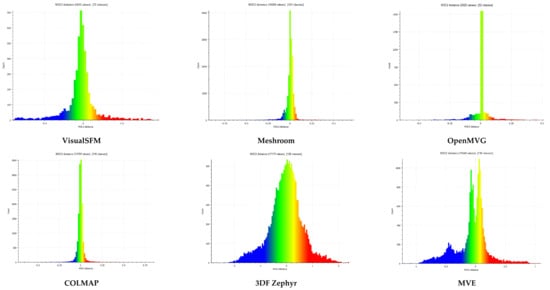
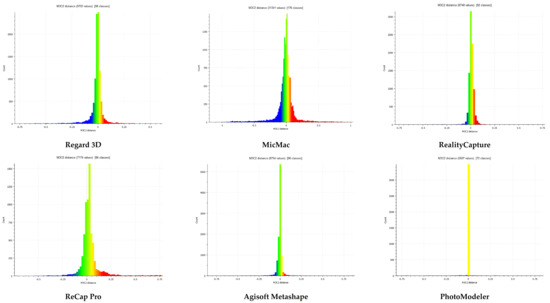
Figure 16.
M3C2 graphical representation of volumetric differences for AMPC (dataset 2).
The photogrammetric models of PhotoModeler, MVE, Regard 3D (dataset 2), OpenMVG, and MicMac (dataset 2) were disregarded in this evaluation because of unsatisfactory or incomplete 3D point cloud reconstructions, as well as ReCap Pro because of noise issues. Among open-source tools, Meshroom and COLMAP were found to have the lowest SD and less volumetric error for both C2C and M3C2 comparisons. Meanwhile, among commercial-paid tools, better results were achieved for Agisoft Metashape, 3DF Zephyr (dataset 2: C2C), and RealityCapture (dataset 1: C2C, dataset 2: C2C and M3C2).
4.4. Validation Testing
Based on the previously performed three evaluations, five photogrammetry tools were selected based on better outcome results. Three tools were selected from open-source, i.e., Meshroom, COLMAP, and 3DF Zephyr, whereas two were selected from commercial-paid tools, i.e., RealityCapture and Agisoft Metashape. Two more datasets, considering the same rebar arrangement, were prepared for validation testing: dataset 3 with 30 images and dataset 4 with 50 images. Two validation-based comparison tests were performed; test 1 consisted of basic metadata and statistical analyses and test 2 was evaluated based on visual inspection. Figure 17 illustrates the obtained point cloud models from dataset 3 and dataset 4, respectively.
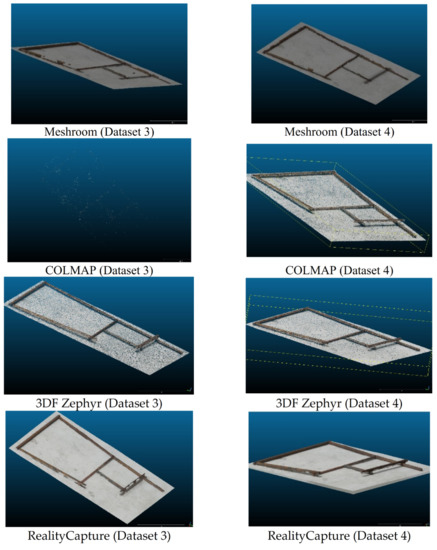

Figure 17.
Validation models from dataset 3 and dataset 4.
4.4.1. Validation Test 1
In the first validation test, the basic metadata, i.e., the number of dense points cloud and point cloud density, were noted in CloudCompare. However, for statistical analyses, % model completion and % noise were calculated via Equations (1) and (2) for each generated model separately. Table 6 summarizes the validation test summary relating to validation test 1 for 3D point cloud information and statistical analysis outcomes (dataset 3 and dataset 4).

Table 6.
Summary of results for validation test 1.
It was observed that the 3D reconstructed model by Meshroom could not generate complete layout details, i.e., dataset 3 and dataset 4, with 55.6% and 44.2% completion rates. Moreover, COLMAP failed to generate a model with dataset 3, whereas a detailed 3D model was attained for dataset 4. In contrast, detailed and complete 3D models were generated by 3DF Zephyr for both dataset 3 and dataset 4, with 98.9% and 99.3% completion rates, respectively. Moreover, the completion rate for Agisoft Metashape was found to be less for dataset 3 at 95.3%, while it was 99.4% for dataset 4. In contrast, RealityCapture achieved 88.9% with dataset 3 and 99.2% with dataset 4 as a % model completion rate of generated 3D point cloud models. For % noise, not much noise was observed in the generated model sets, except a very small portion was calculated for Meshroom (dataset 3), and RealityCapture (dataset 4) with 0.69% and 0.49%, respectively.
4.4.2. Validation Test 2
The second validation test was performed by overviewing the generated models for shape distortion. The scale was set to measure this parameter, i.e., “very high”, “high”, “medium”, “low”, “very low”, and “nil”. Each generated model was inspected in CloudCompare and based on visual inspection, the level of shape distortion was selected for each point cloud model under each dataset. Table 7 illustrates the summary of the attained outcomes for the level of shape distortion.

Table 7.
Summary of the results for validation test 2.
It can be observed only for Meshroom that high shape distortion was observed for both datasets, whereas small shape distortion was observed in the remaining ones. In contrast, very low shape distortion was observed by cloud models generated via 3DF Zephyr (dataset 3) and Agisoft Metashape (dataset 4). Other than this, the models were also analyzed for overlap joints. For this part, Meshroom (dataset 3 and dataset 4), COLMAP (dataset 3), and RealityCapture (dataset 3) generated point clouds were not considered owing to incomplete model generations. Figure 18 illustrates the pictorial view of overlapped joints for the models that passed validation test 2.
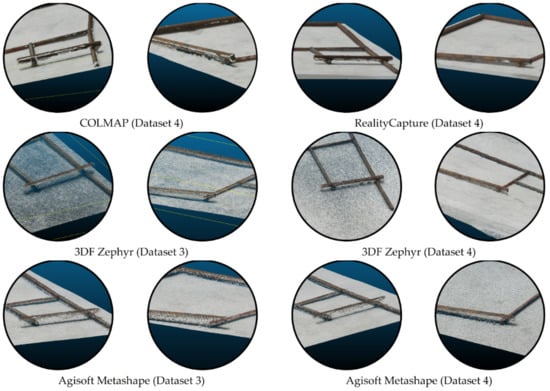
Figure 18.
Pictorial view of overlapped joints of the models.
It can be observed from Figure 18 that all of the tools qualified in the validation test were able to reconstruct good rebar overlap details. However, better joint details with less noise and shape distortion were achieved by 3DF Zephyr and Agisoft Metashape for both datasets (3 and 4). Meanwhile, COLMAP and RealityCapture were able to generate a reasonable model only with dataset 4, and the attained rebar joints from both tools were not clean, but a little noisy and distorted. Overall, the most excellent results were received for 3DF Zephyr in the validation phase. In comparison, the outcomes received via Agisoft Metashape were also highly satisfactory.
One of the main aspects of this study is the evaluation of 12 photogrammetry tools being screened from 37 tools and techniques, which makes this study exclusive. Most of the performed studies have evaluated considering up to eight [34] or nine [21] photogrammetry software by following one or two evaluation criteria. However, considering close-range photogrammetry, three evaluation criteria were adopted in this study, considering distinct strategies. In this study, one more critical observation was made, i.e., a dataset with multitudinous images is not surety for attaining an effective 3D point cloud model. Meanwhile, effective models can also be attained by a dataset with fewer images, properly covering the targeted object and accurate angle of capture. Moreover, it is advisable to test two or more photogrammetry tools for each dataset, as the outcome varies; each tool shows varying behavior on the same datasets. Moreover, in light of past literature and this study, it can be established that every photogrammetry software has some exceptional features and the outcomes are dependent on the type of the targeted object, nature of the job, and site conditions. Hence, it cannot be proclaimed that some particular software is the best; software should be chosen or selected depending upon the job description and guidance may be taken from the available literature.
5. Conclusions
The purpose of this study was to evaluate available photogrammetry tools and assess their outcomes by considering rebar as a test object in the case of progress monitoring inspection and attainment of a sustainable solution. Considering the offered characteristics, popularity among researchers, and ease of availability of the listed tools, 12 of the photogrammetry tools were shortlisted for testing. Initially, three evaluation strategies were devised for assessment on the basis of the identified criteria. The strategy consists of metadata and visual inspection of reconstructed 3D models, comparison of reconstructed 3D models with GTM, and comparison of reconstructed 3D models with AMPC models. Based on the initial evaluations, Meshroom, COLMAP, 3DF Zephyr, RealityCapture, and Agisoft Metashape were found to comply with the criteria and were selected for the final validation testing. The final validation testing was designed for the rebar layout formation as a test object with rebar overlapping at joints. Considering basic information (metadata) of reconstructed 3D point clouds and visual assessment of overlapped rebar joints, most of the models in the final validation testing were found to be acceptable. However, 3D reconstructed models by 3DF Zephyr and Agisoft Metashape were better for model completion rates and good detailing of overlapped rebar with less noise.
This study also suggests a future direction in the field of photogrammetry. During this study, a hypothesis was established during the experimentation process. The null hypothesis was developed, stated as “there is no scale-based calibration required for 3D point cloud model, which is generated by images with same working distance”. In terms of photography, the working distance is defined as the distance from the lens to the targeted object. Mostly, for photogrammetry, the object images are taken at varying distances, as per the ease of the cameraman and for covering the object from all directions. Such generated 3D models require scale-based calibrations for real-time dimensional measurements, and the output model of different photogrammetry tools varies in size and scale. A lab-controlled environment and equipment will be required to test this hypothesis and it can be tested and performed as a future study.
Author Contributions
Conceptualization, W.S.A. and A.H.Q.; methodology, W.S.A., S.J.H., A.M. and A.H.Q.; software, A.H.Q., S.S., S.A. and A.M.; validation, K.M.A., A.H.Q., A.O.B. and A.M.; resources, W.S.A. and A.H.Q.; data curation, A.H.Q.; writing—original draft preparation, A.H.Q.; writing—review and editing, W.S.A., S.J.H. and A.M.; supervision, W.S.A.; funding acquisition, W.S.A. and A.H.Q. All authors have read and agreed to the published version of the manuscript.
Funding
This research received no external funding.
Data Availability Statement
All data, models, and code generated or used during the study appear in the submitted article.
Acknowledgments
The authors would like to acknowledge the technical guidance provided by Peter Falkingham (Reader in Vertebrate Biology at Liverpool John Moores University, UK). This research did not receive any specific grant from funding agencies in the public, commercial, or not-for-profit sectors.
Conflicts of Interest
The authors declare no conflict of interest.
References
- Shao, Z.; Yang, N.; Xiao, X.; Zhang, L.; Peng, Z. A Multi-View Dense Point Cloud Generation Algorithm Based on Low-Altitude Remote Sensing Images. Remote Sens. 2016, 8, 381. [Google Scholar] [CrossRef]
- Manzoor, B.; Othman, I.; Pomares, J.C. Digital Technologies in the Architecture, Engineering and Construction (AEC) Industry—A Bibliometric—Qualitative Literature Review of Research Activities. Int. J. Environ. Res. Public Health 2021, 18, 6135. [Google Scholar] [CrossRef] [PubMed]
- Hannan Qureshi, A.; Alaloul, W.S.; Wing, W.K.; Saad, S.; Ammad, S.; Musarat, M.A. Factors Impacting the Implementation Process of Automated Construction Progress Monitoring. Ain Shams Eng. J. 2022, 13, 101808. [Google Scholar] [CrossRef]
- Mahami, H.; Nasirzadeh, F.; Hosseininaveh Ahmadabadian, A.; Nahavandi, S. Automated Progress Controlling and Monitoring Using Daily Site Images and Building Information Modelling. Buildings 2019, 9, 70. [Google Scholar] [CrossRef]
- Bianco, S.; Ciocca, G.; Marelli, D. Evaluating the Performance of Structure from Motion Pipelines. J. Imaging 2018, 4, 98. [Google Scholar] [CrossRef]
- Qureshi, A.H.; Alaloul, W.S.; Wing, W.K.; Saad, S.; Ammad, S.; Altaf, M. Characteristics-Based Framework of Effective Automated Monitoring Parameters in Construction Projects. Arab. J. Sci. Eng. 2022. [Google Scholar] [CrossRef] [PubMed]
- Alaloul, W.S.; Qureshi, A.H.; Musarat, M.A.; Saad, S. Evolution of Close-Range Detection and Data Acquisition Technologies towards Automation in Construction Progress Monitoring. J. Build. Eng. 2021, 43, 102877. [Google Scholar] [CrossRef]
- Xu, Y.; Ye, Z.; Huang, R.; Hoegner, L.; Stilla, U. Robust Segmentation and Localization of Structural Planes from Photogrammetric Point Clouds in Construction Sites. Autom. Constr. 2020, 117, 103206. [Google Scholar] [CrossRef]
- Lu, R.; Brilakis, I. Digital Twinning of Existing Reinforced Concrete Bridges from Labelled Point Clusters. Autom. Constr. 2019, 105, 102837. [Google Scholar] [CrossRef]
- Woodhead, R.; Stephenson, P.; Morrey, D. Digital Construction: From Point Solutions to IoT Ecosystem. Autom. Constr. 2018, 93, 35–46. [Google Scholar] [CrossRef]
- Zhu, H.; Wu, W.; Chen, J.; Ma, G.; Liu, X.; Zhuang, X. Integration of Three Dimensional Discontinuous Deformation Analysis (DDA) with Binocular Photogrammetry for Stability Analysis of Tunnels in Blocky Rockmass. Tunn. Undergr. Sp. Technol. 2016, 51, 30–40. [Google Scholar] [CrossRef]
- Kortaberria, G.; Mutilba, U.; Gomez-Acedo, E.; Tellaeche, A.; Minguez, R. Accuracy Evaluation of Dense Matching Techniques for Casting Part Dimensional Verification. Sensors 2018, 18, 3074. [Google Scholar] [CrossRef] [PubMed]
- Baarimah, A.O.; Alaloul, W.S.; Liew, M.S.; Al-Aidrous, A.H.M.H.; Alawag, A.M.; Musarat, M.A. Integration of Building Information Modeling (BIM) and Value Engineering in Construction Projects: A Bibliometric Analysis. 2021 3rd Int. Sustain. Resil. Conf. Clim. Chang. 2021, 362–367. [Google Scholar] [CrossRef]
- Nikolakopoulos, K.G.; Lampropoulou, P.; Fakiris, E.; Sardelianos, D.; Papatheodorou, G. Synergistic Use of UAV and USV Data and Petrographic Analyses for the Investigation of Beachrock Formations: A Case Study from Syros Island, Aegean Sea, Greece. Minerals 2018, 8, 534. [Google Scholar] [CrossRef]
- Baarimah, A.O.; Alaloul, W.S.; Liew, M.S.; Kartika, W.; Al-Sharafi, M.A.; Musarat, M.A.; Alawag, A.M.; Qureshi, A.H. A Bibliometric Analysis and Review of Building Information Modelling for Post-Disaster Reconstruction. Sustainability 2022, 14, 393. [Google Scholar] [CrossRef]
- Erena, M.; Atenza, J.F.; García-Galiano, S.; Domínguez, J.A.; Bernabé, J.M. Use of Drones for the Topo-Bathymetric Monitoring of the Reservoirs of the Segura River Basin. Water 2019, 11, 445. [Google Scholar] [CrossRef]
- Tonina, D.; McKean, J.A.; Benjankar, R.M.; Wright, C.W.; Goode, J.R.; Chen, Q.; Reeder, W.J.; Carmichael, R.A.; Edmondson, M.R. Mapping River Bathymetries: Evaluating Topobathymetric LiDAR Survey. Earth Surf. Process. Landforms 2019, 44, 507–520. [Google Scholar] [CrossRef]
- Specht, C.; Lewicka, O.; Specht, M.; Dabrowski, P.; Burdziakowski, P. Methodology for Carrying out Measurements of the Tombolo Geomorphic Landform Using Unmanned Aerial and Surface Vehicles near Sopot Pier, Poland. J. Mar. Sci. Eng. 2020, 8, 384. [Google Scholar] [CrossRef]
- Specht, M.; Specht, C.; Mindykowski, J.; Dabrowski, P.; Masnicki, R.; Makar, A. Geospatial Modeling of the Tombolo Phenomenon in Sopot Using Integrated Geodetic and Hydrographic Measurement Methods. Remote Sens. 2020, 12, 737. [Google Scholar] [CrossRef]
- Wang, Q.; Cheng, J.C.P.; Sohn, H. Automated Estimation of Reinforced Precast Concrete Rebar Positions Using Colored Laser Scan Data. Comput. Civ. Infrastruct. Eng. 2017, 32, 787–802. [Google Scholar] [CrossRef]
- Qureshi, A.H.; Alaloul, W.S.; Murtiyoso, A.; Saad, S.; Manzoor, B. Comparison of Photogrammetry Tools Considering Rebar Progress Recognition. Int. Arch. Photogramm. Remote Sens. Spat. Inf. Sci. 2022, XLIII-B2-2, 141–146. [Google Scholar] [CrossRef]
- Gabara, G.; Sawicki, P. A New Approach for Inspection of Selected Geometric Parameters of a Railway Track Using Image-Based Point Clouds. Sensors 2018, 18, 791. [Google Scholar] [CrossRef]
- Catalucci, S.; Marsili, R.; Moretti, M.; Rossi, G. Comparison between Point Cloud Processing Techniques. Measurement 2018, 127, 221–226. [Google Scholar] [CrossRef]
- Cui, H.; Shen, S.; Gao, W.; Liu, H.; Wang, Z. Efficient and Robust Large-Scale Structure-from-Motion via Track Selection and Camera Prioritization. ISPRS J. Photogramm. Remote Sens. 2019, 156, 202–214. [Google Scholar] [CrossRef]
- Zhang, Y.; Luo, X.; Yang, W.; Yu, J. Fragmentation Guided Human Shape Reconstruction. IEEE Access 2019, 7, 45651–45661. [Google Scholar] [CrossRef]
- Rahaman, H.; Champion, E. To 3D or Not 3D: Choosing a Photogrammetry Workflow for Cultural Heritage Groups. Heritage 2019, 2, 1835–1851. [Google Scholar] [CrossRef]
- Qureshi, A.H.; Alaloul, W.S.; Manzoor, B.; Musarat, M.A.; Saad, S.; Ammad, S. Implications of Machine Learning Integrated Technologies for Construction Progress Detection Under Industry 4.0 (IR 4.0). In Proceedings of the 2020 Second International Sustainability and Resilience Conference: Technology and Innovation in Building Designs(51154), Sakheer, Bahrain, 11–12 November 2020; pp. 1–6. [Google Scholar]
- Alaloul, W.S.; Liew, M.S.; Zawawi, N.A.W.A.; Mohammed, B.S. Industry Revolution IR 4.0: Future Opportunities and Challenges in Construction Industry. MATEC Web Conf. 2018, 203, 02010. [Google Scholar] [CrossRef]
- Wang, Y.; Deng, N.; Xin, B.; Wang, W.; Xing, W.; Lu, S. A Novel Three-Dimensional Surface Reconstruction Method for the Complex Fabrics Based on the MVS. Opt. Laser Technol. 2020, 131, 106415. [Google Scholar] [CrossRef]
- Peña-Villasenín, S.; Gil-Docampo, M.; Ortiz-Sanz, J. Desktop vs Cloud Computing Software for 3D Measurement of Building Façades: The Monastery of San Martín Pinario. Measurement 2020, 149, 106984. [Google Scholar] [CrossRef]
- Reljić, I.; Dunder, I.; Seljan, S. Photogrammetric 3D Scanning of Physical Objects: Tools and Workflow. TEM J. 2019, 8, 383–388. [Google Scholar] [CrossRef]
- Luo, K.; Pan, H.; Zhang, Y.; Guan, T. Partial Bundle Adjustment for Accurate Three-dimensional Reconstruction. IET Comput. Vis. 2019, 13, 666–675. [Google Scholar] [CrossRef]
- Verykokou, S.; Ioannidis, C. A photogrammetry-based structure from motion algorithm using robust iterative bundle adjustment techniques. ISPRS Ann. Photogramm. Remote Sens. Spat. Inf. Sci. 2018, VI-4/W6, 73–80. [Google Scholar] [CrossRef]
- Delgado-Vera, C.; Aguirre-Munizaga, M.; Jiménez-Icaza, M.; Manobanda-Herrera, N.; Rodríguez-Méndez, A. Aguirre-Munizaga, M.; Jiménez-Icaza, M.; Manobanda-Herrera, N.; Rodríguez-Méndez, A. A Photogrammetry Software as a Tool for Precision Agriculture: A Case Study. In Communications in Computer and Information Science; Springer: Cham, Switzerland, 2017; Volume 749, pp. 282–295. ISBN 978-3-319-67282-3. [Google Scholar]
- Alidoost, F.; Arefi, H. Comparison of uas-based photogrammetry software for 3d point cloud generation: A survey over a historical site. ISPRS Ann. Photogramm. Remote Sens. Spat. Inf. Sci. 2017, IV-4/W4, 55–61. [Google Scholar] [CrossRef]
- Murtiyoso, A.; Grussenmeyer, P. Documentation of Heritage Buildings Using Close-Range UAV Images: Dense Matching Issues, Comparison and Case Studies. Photogramm. Rec. 2017, 32, 206–229. [Google Scholar] [CrossRef]
- Eltner, A.; Schneider, D. Analysis of Different Methods for 3D Reconstruction of Natural Surfaces from Parallel-Axes UAV Images. Photogramm. Rec. 2015, 30, 279–299. [Google Scholar] [CrossRef]
- CloudCompare. Available online: https://www.danielgm.net/cc/ (accessed on 1 March 2022).
- Chen, J.; Mora, O.E.; Clarke, K.C. Assessing the accuracy and precision of imperfect point clouds for 3d indoor mapping and modeling. ISPRS Ann. Photogramm. Remote Sens. Spat. Inf. Sci. 2018, IV-4/W6, 3–10. [Google Scholar] [CrossRef]
- Besl, P.J.; McKay, N.D. Method for Registration of 3-D Shapes. In Sensor Fusion IV: Control Paradigms and Data Structures; International Society for Optics and Photonics: Bellingham, WA, USA, 1992; Volume 1611, pp. 586–606. [Google Scholar]
- DiFrancesco, P.-M.; Bonneau, D.; Hutchinson, D.J. The Implications of M3C2 Projection Diameter on 3D Semi-Automated Rockfall Extraction from Sequential Terrestrial Laser Scanning Point Clouds. Remote Sens. 2020, 12, 1885. [Google Scholar] [CrossRef]
- Takimoto, R.Y.; de Sales Guerra Tsuzuki, M.; de Castro Martins, T.; Ueda, E.K.; Gotoh, T.; Kagei, S. 3D Reconstruction Scene Error Analysis. In Proceedings of the XXII COBEM, Ribeirao Preto, Brazil, 3–7 November 2013; pp. 5499–5508. [Google Scholar]
- Lague, D.; Brodu, N.; Leroux, J. Accurate 3D Comparison of Complex Topography with Terrestrial Laser Scanner: Application to the Rangitikei Canyon (N–Z). ISPRS J. Photogramm. Remote Sens. 2013, 82, 10–26. [Google Scholar] [CrossRef]
Disclaimer/Publisher’s Note: The statements, opinions and data contained in all publications are solely those of the individual author(s) and contributor(s) and not of MDPI and/or the editor(s). MDPI and/or the editor(s) disclaim responsibility for any injury to people or property resulting from any ideas, methods, instructions or products referred to in the content. |
© 2022 by the authors. Licensee MDPI, Basel, Switzerland. This article is an open access article distributed under the terms and conditions of the Creative Commons Attribution (CC BY) license (https://creativecommons.org/licenses/by/4.0/).