Article

Quantifying Mangrove Extent Using a Combination of Optical and Radar Images in a Wetland Complex, Western Region, Ghana

by
Daniel Aja
1,
Michael K. Miyittah
1,2,* and
Donatus Bapentire Angnuureng
1
1
Africa Center of Excellence in Coastal Resilience, Center for Coastal Management, University of Cape Coast, Cape Coast P.O. Box UC56, Ghana
2
Department of Environmental Science, North Campus, University Avenue, Science Building, University of Cape Coast, Cape Coast P.O. Box UC56, Ghana
*
Author to whom correspondence should be addressed.
Sustainability 2022, 14(24), 16687; https://doi.org/10.3390/su142416687
Submission received: 1 November 2022 / Revised: 12 November 2022 / Accepted: 14 November 2022 / Published: 13 December 2022

Abstract

:
The classification of mangrove forests in tropical coastal zones, based only on passive remote sensing methods, is hampered by mangrove complexities, topographical considerations, and cloud cover effects, among others. This paper reports on a study that combines optical and radar data to address the challenges of distinguishing mangrove stands in cloud-prone regions. The Google Earth Engine geospatial processing platform was used to extract multiple scenes of Landsat surface reflectance Tier 1 and synthetic aperture radar (C-band and L-band). The images were enhanced by creating a feature that removes clouds from the optical data and using speckle filters to remove noise from the radar data. The random forest algorithm proved to be a robust and accurate machine learning approach for mangrove classification and assessment. Classification was evaluated using three scenarios: classification of optical data only, classification of radar data only, and combination of optical and radar data. Our results revealed that the scenario that combines optical and radar data performed better. Further analysis showed that about 16.9% and 21% of mangrove and other vegetation/wetland cover were lost between 2009 and 2019. Whereas water body and bare land/built-up areas increased by 7% and 45%, respectively. Accuracy was evaluated based on the three scenarios. The overall accuracy of the 2019 classification was 98.9% (kappa coefficient = 0.979), 84.6% (kappa coefficient = 0.718), and 99.1% (kappa coefficient = 0.984), for classification of optical data only, classification of radar data only, and combination of optical and radar data, respectively. This study has revealed the potential to map mangroves correctly, enabling on-site conservation practices in the climate change environment.

1. Introduction

Mangroves grow and thrive in an environment that acts as a buffer zone for terrestrial and marine ecosystems. They are globally important ecosystems restricted to coastal areas where mean monthly air temperatures are above 20 °C and where there is, with rare exceptions, no ground ice formation [1,2]. These ecosystems are composed of trees and shrubs found in flat, sandy, or muddy areas adapted to estuarine or saline environments [2,3]. They are truly unique because they are the only trees that can tolerate large amounts of salt and water. This ability, as well as surviving in oxygen-poor soils, is a result of root adaptations. Mangrove forests occupy an insignificant fraction of land area (<1%) but are considered to be the most carbon-rich ecosystems in the tropics [2]. Mangrove ecosystems have recently been included in the IPCC climate protection strategy through a series of amendments to wetlands [4].
In Africa, mangrove forests occupy roughly 2,746,500 ha in 2010 [5] and support vulnerable coastal populations by providing important ecosystem services such as natural marine protection, coastal erosion mitigation, water quality improvement, and alternative livelihoods [6,7,8,9]. Fatoyinbo and Simard [10] reported that mangroves cover about 7600 ha along the coast of Ghana and seven major mangrove species have been confirmed, including Laguncularia racemose (white mangrove), Avicennia germinans (black mangrove), Rhizophora harrisonii (red mangrove), Rhizophora racemose (red mangrove), Rhizophora mangle (red mangrove), Acrostichum aureum (golden leatherback), and Cornocarpus erectus (bottom mangrove) [11,12].
Although these ecosystems provide many valuable services, they have experienced significant degradation, are threatened, or lost [13,14]. The rate of loss over the past two decades has been estimated to be twice the rate of terrestrial rainforest loss over the same period [15]. It is also estimated that about two-thirds of mangrove forests have been lost in the past century, representing 1–8% mangrove loss per annum and at least 20–50% global land area decline (more than 3.6 million ha) in the last 4–5 decades [16,17,18]. The main cause of mangrove loss has been deforestation for land conversion, primarily for aquaculture, establishment of salt pans, and other agricultural intensification.
Quantification of changes for mangrove ecosystems is crucial for an improved understanding of many coastal and sea processes. Conventional mapping of mangrove forests involve huge capital for field work due to the difficulties associated with accessibility within the mangrove ecosystem [19]. Space-based technology, such as remote sensing, has a huge capacity to map and monitor changes in mangrove forests owing to the fact that data can be captured from a landscape which is otherwise difficult to access [20]. Several authors recommend the combination of synthetic aperture radar with optical satellite data for more accurate quantification of mangrove extent [21,22,23]. There are added advantages to utilizing the unique features of both optical and radar data to improve upon landcover classification. Using both datasets can provide more detailed characterization of landcover changes. This can be useful for agriculture, forest disturbances, and land degradation. Additionally, vegetation health indices such as NDVI can be used in conjunction with plant structure and volume data available from the radar.
The Google Earth Engine (GEE) provides a straightforward but robust mangrove assessment and monitoring framework with a high level of automation that can be easily implemented for frequent and accurate mapping at local, regional, or global scales [24,25]. GEE has a variety of ready-to-use non-parametric classifiers including but not limited to: classification and regression trees (CART), random forest (RF), naïve Bayes, and support vector machine (SVM) which are recommended for the classification of multi-source data in complex environments [2,21,26,27]. The random forest (RF) algorithm has the advantage of using a series of decision trees to select the best classification for all pixels within the imagery to reduce the risk of overfitting, training time, sensitivity to outliers in training data, and runs efficiently for a large dataset [2]. Accordingly, RF-supervised classification is reported to have the highest accuracy among the widely used machine learning algorithms [2,26,28].
There have been several studies on the mangrove extent across Africa [7,10,29,30,31,32,33,34,35,36], with most of them largely concentrating on few countries such as Gambia, Guinea-Bissau, Guinea, Mauritania, Mozambique, Madagascar, Nigeria, Senegal, Sierra Leone, South Africa, and Tanzania. However, a good number of the studies are global in nature but lack spatially explicit resolution suitable for locally tracking progress in the sustainable development goals (SDGs) adopted by the United Nations (2030 agenda) and the African Union (2063 agenda).
Mangroves support a number of SDGs, most notably Goal 6 (clean water and sanitation) and Goal 15 (life on land), as they serve as important indicators for monitoring progress at local, regional, and global levels. Specifically, indicator 6.6.1 (change in extent of water-related ecosystems over time) of Goal 6 aims to protect and restore water-related ecosystems such as mangroves. While indicator 15.1.1 of Goal 15 focuses on quantifying forest area as a proportion of total land area. Therefore, understanding mangrove ecosystems and mapping their extent both locally and globally is crucial to achieving these goals [37,38]. This can help coastal managers focus on conservation practices and reduce degradation of water-related ecosystems by improving their knowledge of these ecosystems to drive conservation and restoration actions.
The coast of Ghana, as other coastal zones, faces the threat of flooding, erosion, and saltwater intrusion with rising sea levels. Mangroves in this area may be threatened by a rise in sea levels. There is a need to understand where mangroves are currently found and how they have changed over time, by constantly monitoring and modeling their vulnerability to climate change or land use change. Therefore, the main objective of this case study is to map and quantify the changes in the mangrove ecosystem over time to show how mangrove mapping can help coastal managers to focus on conservation practices.

2. Materials and Methods
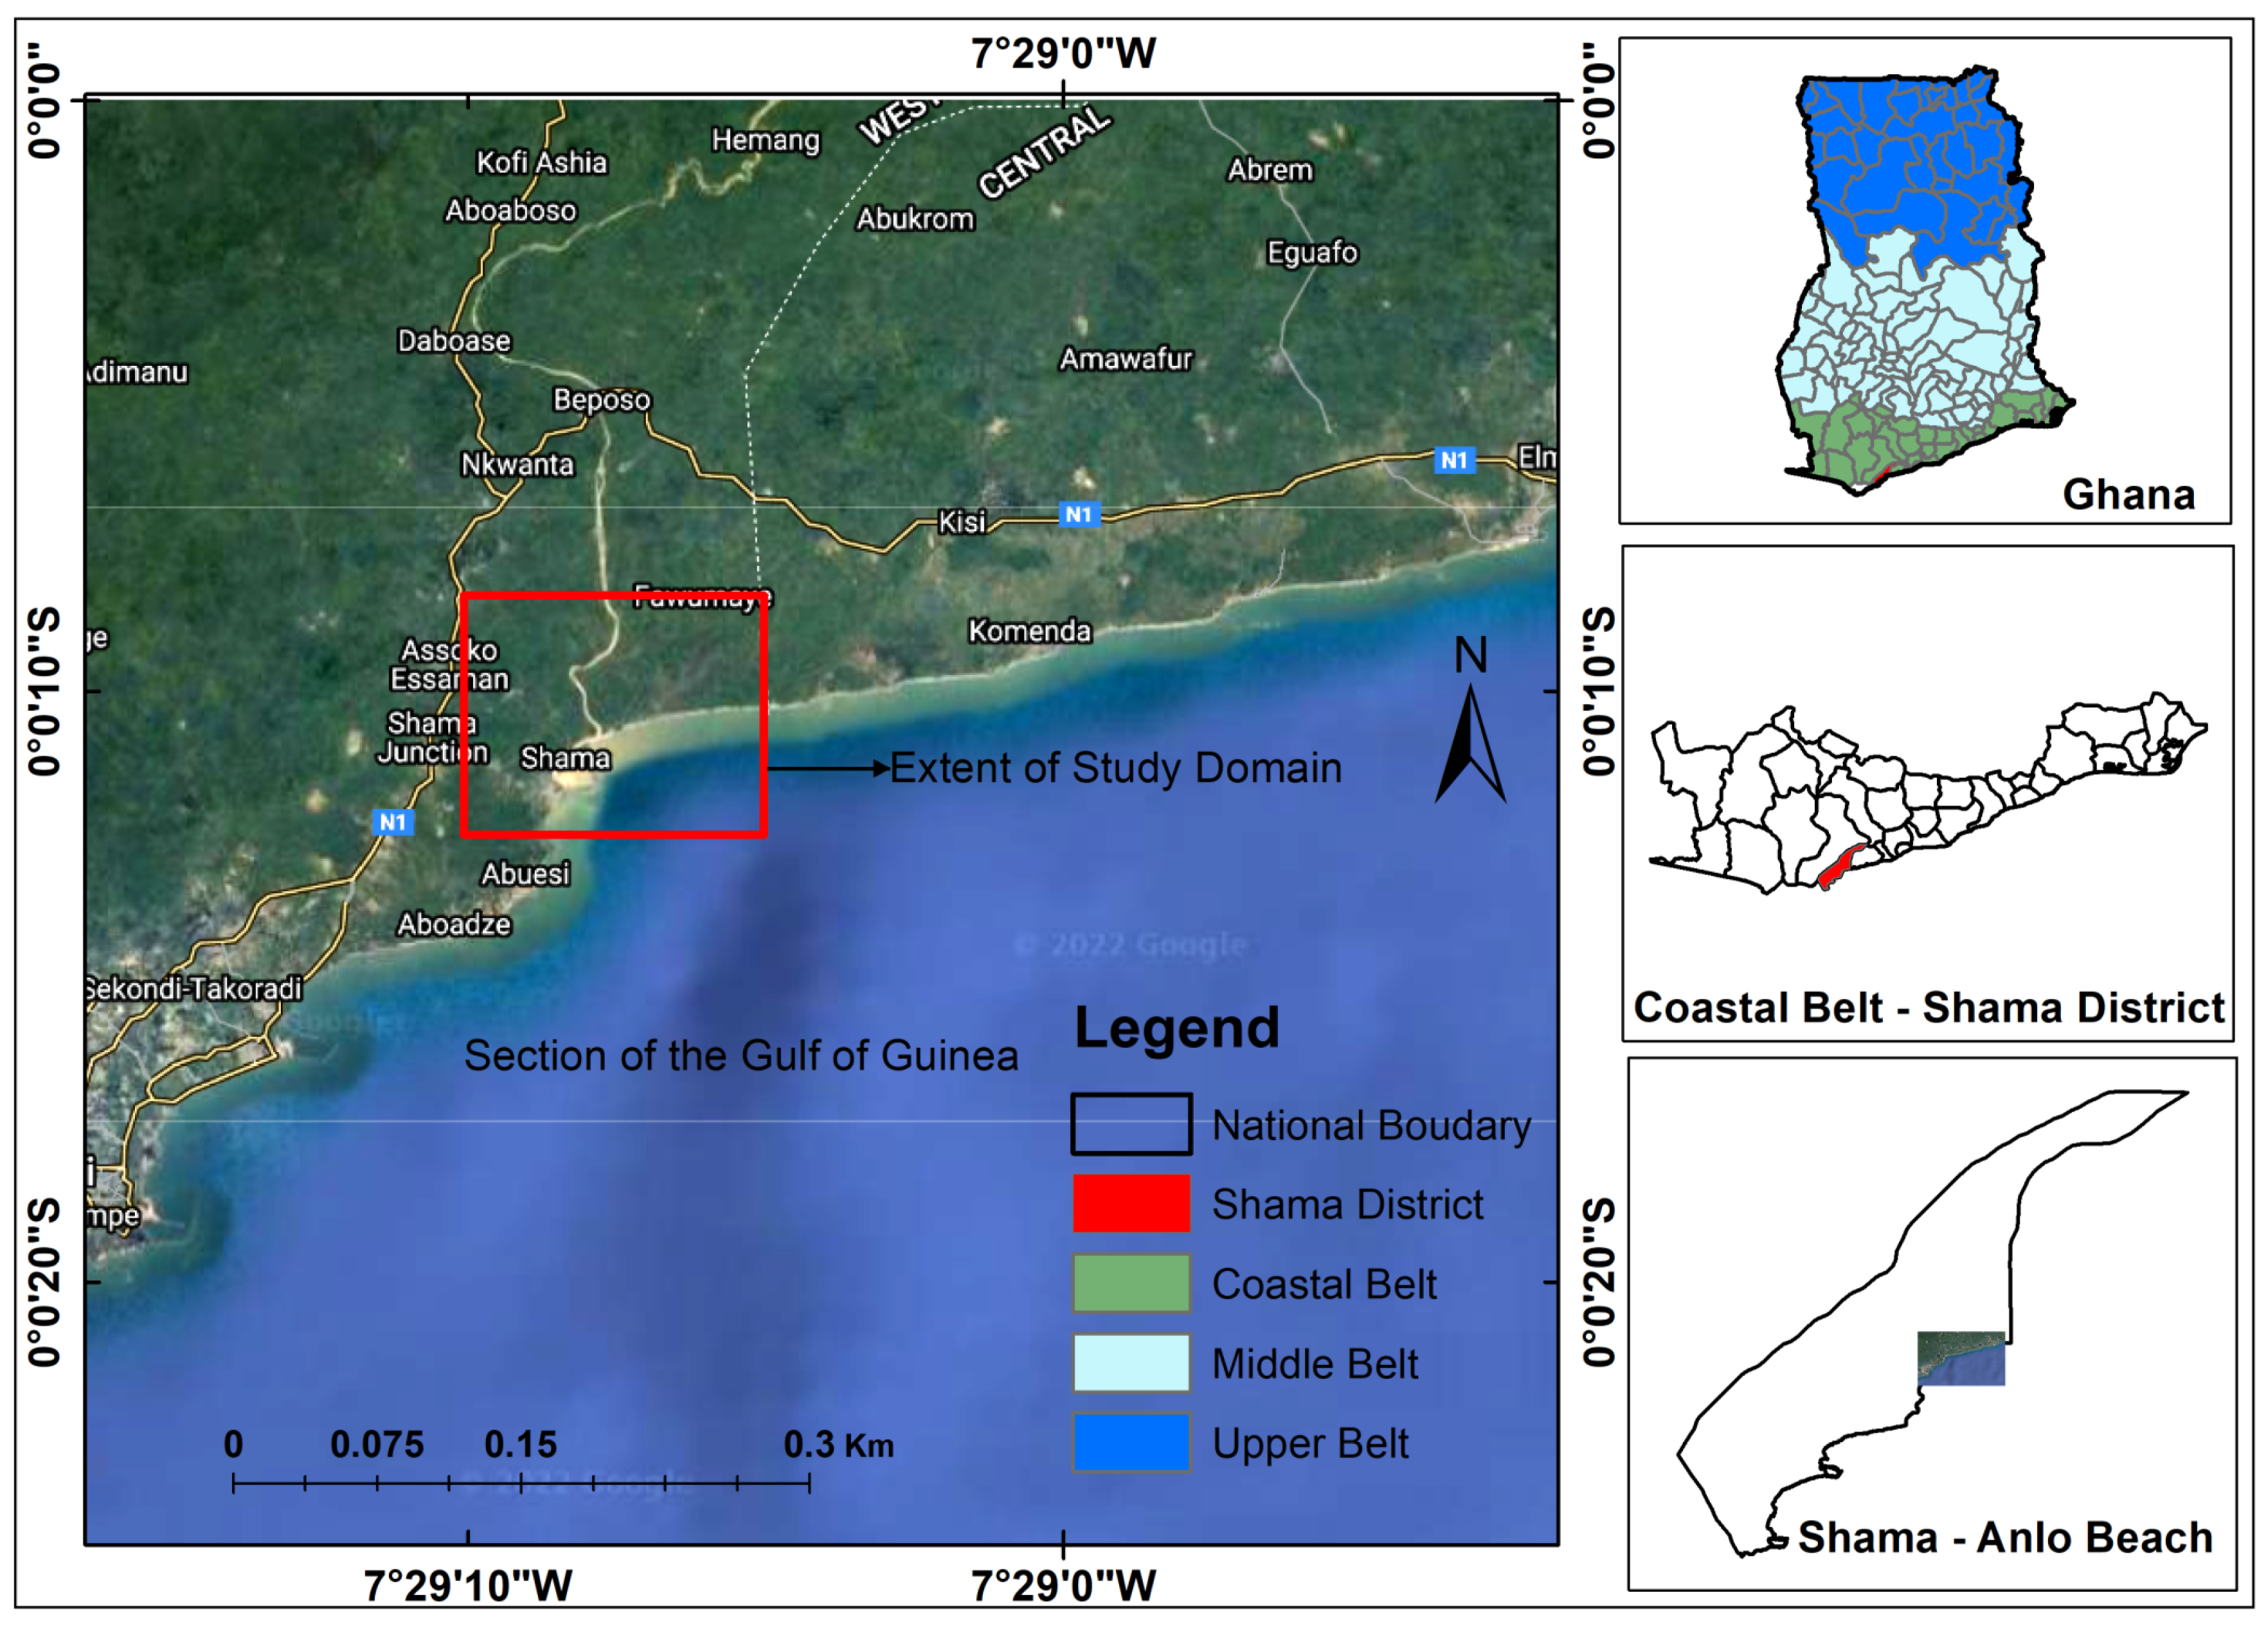
2.1. Study Location

This study was conducted at the Anlo Beach Wetland complex which is situated along the coastal belt in the Shama District, Western Region of Ghana as shown in Figure 1. The area covers about 50.42 km2, lying approximately within latitudes 5°1′30″ N and 5°3′5″ N, and longitudes 1°34′30″ W and 1°37′30″ W, and it is covered by mangroves which have been comparatively disturbed [39]. Hydrologically, the area lies within the plains of the Pra River, which opens directly into the ocean.
Anlo Beach is located at the lower part of the Pra River Basin which is characterized by a high surface temperature of about 21.74 °C to 31.6 °C, for minimum and maximum, respectively [40]. The climate of this area is classified as tropical monsoon (Am) [41], with a mean monthly relative humidity greater than 70%, all year round [42]. The mean annual value of rainfall from 1981–2010 was 1446 mm [43] and the upper part of the basin is characterized by soil with moderately high runoff potential [44], making the low areas of the basin vulnerable to water disasters during extreme rainfall events [45].
According to a study conducted in the location by Friends of the Nation [39], the topography is largely flat, the shoreline has an irregular sandy beach, and the ocean areas are generally open and characterized by pounding surf with medium to high energy. The coastline has eroded by an average of 100 m in the last 50 years [46]. The wetland is largely shallow (0.25–1.5 m) with fluctuating hydrology and chemical parameters. The dominant mangrove species include: Avicennia, Rhizophora, and Laguncularia genera, and the adjoining marshland has saltwater grass Paspalum vaginatum (Poaceae) as the main vegetation [47].
The inhabitants of the Anlo Beach community are predominantly fishermen with an estimated population of about 2231, consisting of 1028 males and 1203 females [46]. This population also relies on the mangrove ecosystem for various activities thereby, creating some intense land use change dynamics.

2.2. Datasets and Sources

For this study, the Google Earth Engine (GEE) cloud-based platform and random forest classification algorithm were used. Mangrove extent maps were generated by classifying both optical and radar images separately and in combination. The maps were created for two time periods, namely 2009 and 2019, to examine changes in mangrove extent and other LULC over time. The Google Earth Engine database was filtered for Sentinel-1 imagery that is in wide swath (IW) interferometric mode, descending pass, 25 m resolution, VH and VV polarization, and falls within the region of interest. The Sentinel-1 dataset was filtered by date to retrieve images from 2019. The 2009 ALOS PALSAR-2 image was acquired from the JAXA website (Table 1). The corresponding Landsat 8 and Landsat 7 images were also extracted from the Google Earth Engine database. The images: Landsat 8 surface reflection Tier 1, Landsat 7 surface reflection Tier 1, Sentinel-1 image (COPERNICUS), ALOS PALSAR-2 image, and global mangrove distribution vector file were loaded into the Google Earth Engine code editor. Then, the images were added to the layer bar for visualization. A speckle filter was applied to the synthetic aperture radar (SAR) images to minimize speckle noise (Ayman et al., 2017) and the speckle-filtered images were also added to the layer bar (Figure 2).

2.3. Comparison of Mangrove Extents

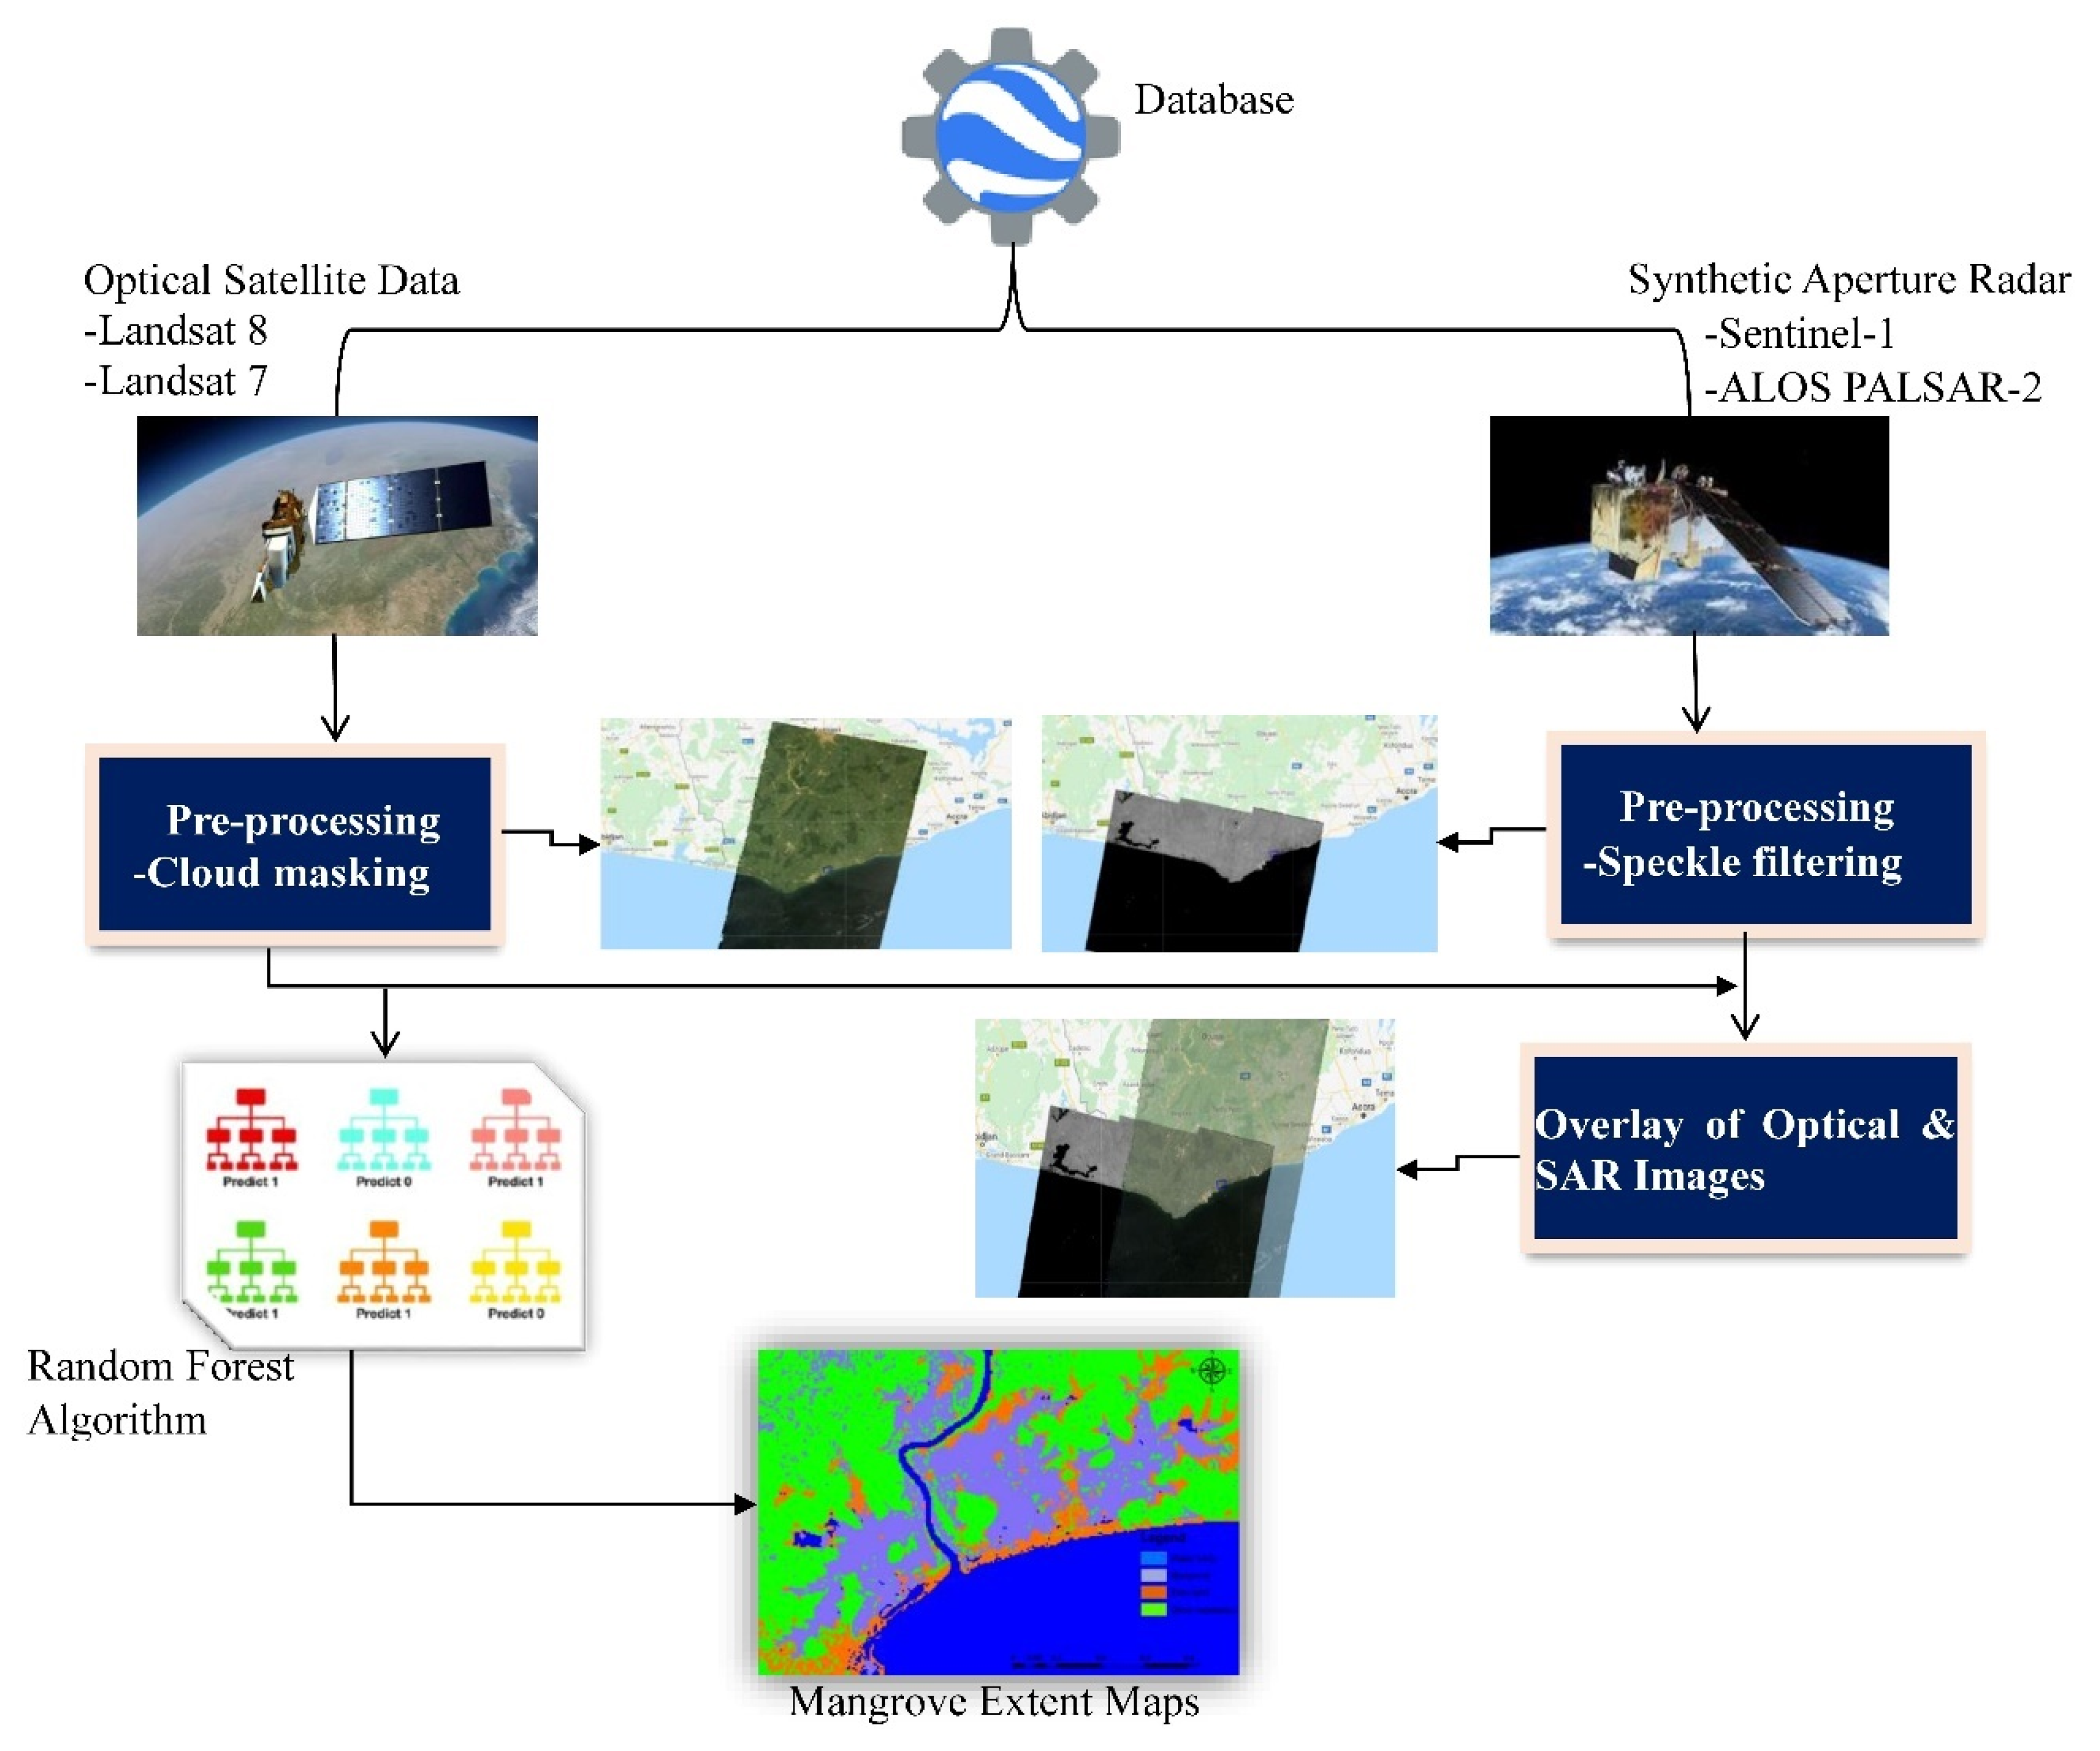
2.3.1. Mangrove Extent Mapping

It is important to note that the Sentinel-1 dataset is ready for image analysis in Google Earth Engine as it has already been processed by implementing formal denoising, radiometric, terrain correction, and the backscatter coefficient is in decibels (dB). The ALOS PALSAR-2 data was converted from log10 to decibels (dB) [48,49] using the formula below.
γ 0 = 10 log 10 D N 2 + C F
where γ 0 = Sigma naught (dB), DN = pixel value (digital number), CF (calibration factor) = −83.0 for the PALSAR images.
The optical images were improved by creating a function that masks cloud shadows and clouds [50,51]. The normalized difference vegetation index (NDVI) was calculated from the optical image to obtain a composite image, which was used as an information layer to inform the classifier [52,53]. This procedure was performed for Landsat 8 (2019) imagery and Landsat 7 (2009) imagery.

2.3.2. Construction of Random Forest Model

Supervised classification (random forest classification) involves creating training samples (Figure 2) to ‘train’ the classifier [54,55]. The approach used in the current study follows the method described by Erika et al. [3]; Barenblitt and Fatoyinbo, [56], which involves collecting representative samples of backscatter values for each landcover class of interest. The random forest algorithm (RF) was run using a hundred trees and five randomly selected predictors per split [24]. Training and validation data for this work is based on field campaigns conducted between December 2020 and April 2021. The global mangrove distribution vector (Table 1) was also needed as a reference data to guide the creation of training samples.

2.3.3. Synthetic Aperture Radar (SAR) Classification

The speckle-filtered Sentinel-1 (VH) image was displayed in the map section of GEE and a polygon symbol was selected from the geometry imports box next to the geometry drawing tool to add training data. Each new layer created, for example ‘open water’ represents one class within the training data, and it was saved as FeatureCollection called landcover. Training samples were selected for four different land cover classes: open water, mangroves, bare land/built-up, and other vegetation/wetlands. The defined classes were then merged into a single collection called ‘new FeatureCollection’.
The ‘new FeatureCollection’ created was used to extract backscatter values for each landcover identified for the Sentinel-1 image. The Sentinel-1 (SAR) image was defined with the code in bracket (var final = ee.Image.cat(SARVV_filtered,SARVH_filtered)) and the training data was created by overlaying the training points (new FeatureCollection) on the image. This created a ‘training point’ statistics based on the classes (new FeatureCollection) and was used to ‘train’ the random forest classifier. The classification was ‘run’ and results were displayed on the ‘layers’ bar.

2.3.4. Landsat Image Classification

Again, the ‘new FeatureCollection’ created was used to extract reflectance values for each landcover class from the Landsat 8 image which was also defined (var trainingl8 = composite.select(bandsl8).sampleRegions({). The ‘training’ data was created by overlaying the training points (new FeatureCollection) on the image and used ‘B1’, ‘B2’, ‘B3’, ‘B4’, ‘B5’, ‘B6’, ‘B7’, ‘NDVI’ to generate the statistics. This was used to ‘train’ the random forest classifier. The classification was ‘run’ and results were displayed on the ‘layers’ bar.

2.3.5. Both Landsat and SAR Classification

Now, the ‘new FeatureCollection’ created was used to extract reflectance and backscatter values for each landcover class from the Landsat 8 and Sentinel-1 images to be used in the classification. Both the Landsat 8 and Sentinel-1 images were defined (var opt_sar = ee.Image.cat(composite, SARVV_filtered,SARVH_filtered)) and the ‘training’ data was created by overlaying the ‘training’ points on the defined image (Figure 2). This was used to ‘train’ the random forest classifier. The classification was ‘run’ and the results were displayed on the ‘layers’ bar.

2.3.6. Time Series Comparison

The above process was repeated using the ALOS PALSAR-2 image (2009 SAR image) and Landsat 7 image (2009 optical satellite image). Mangrove extent and other LULC for the two different time periods were calculated for each scenario using a ‘reduce region’ function in the GEE code editor and the values were converted to hectares [56].

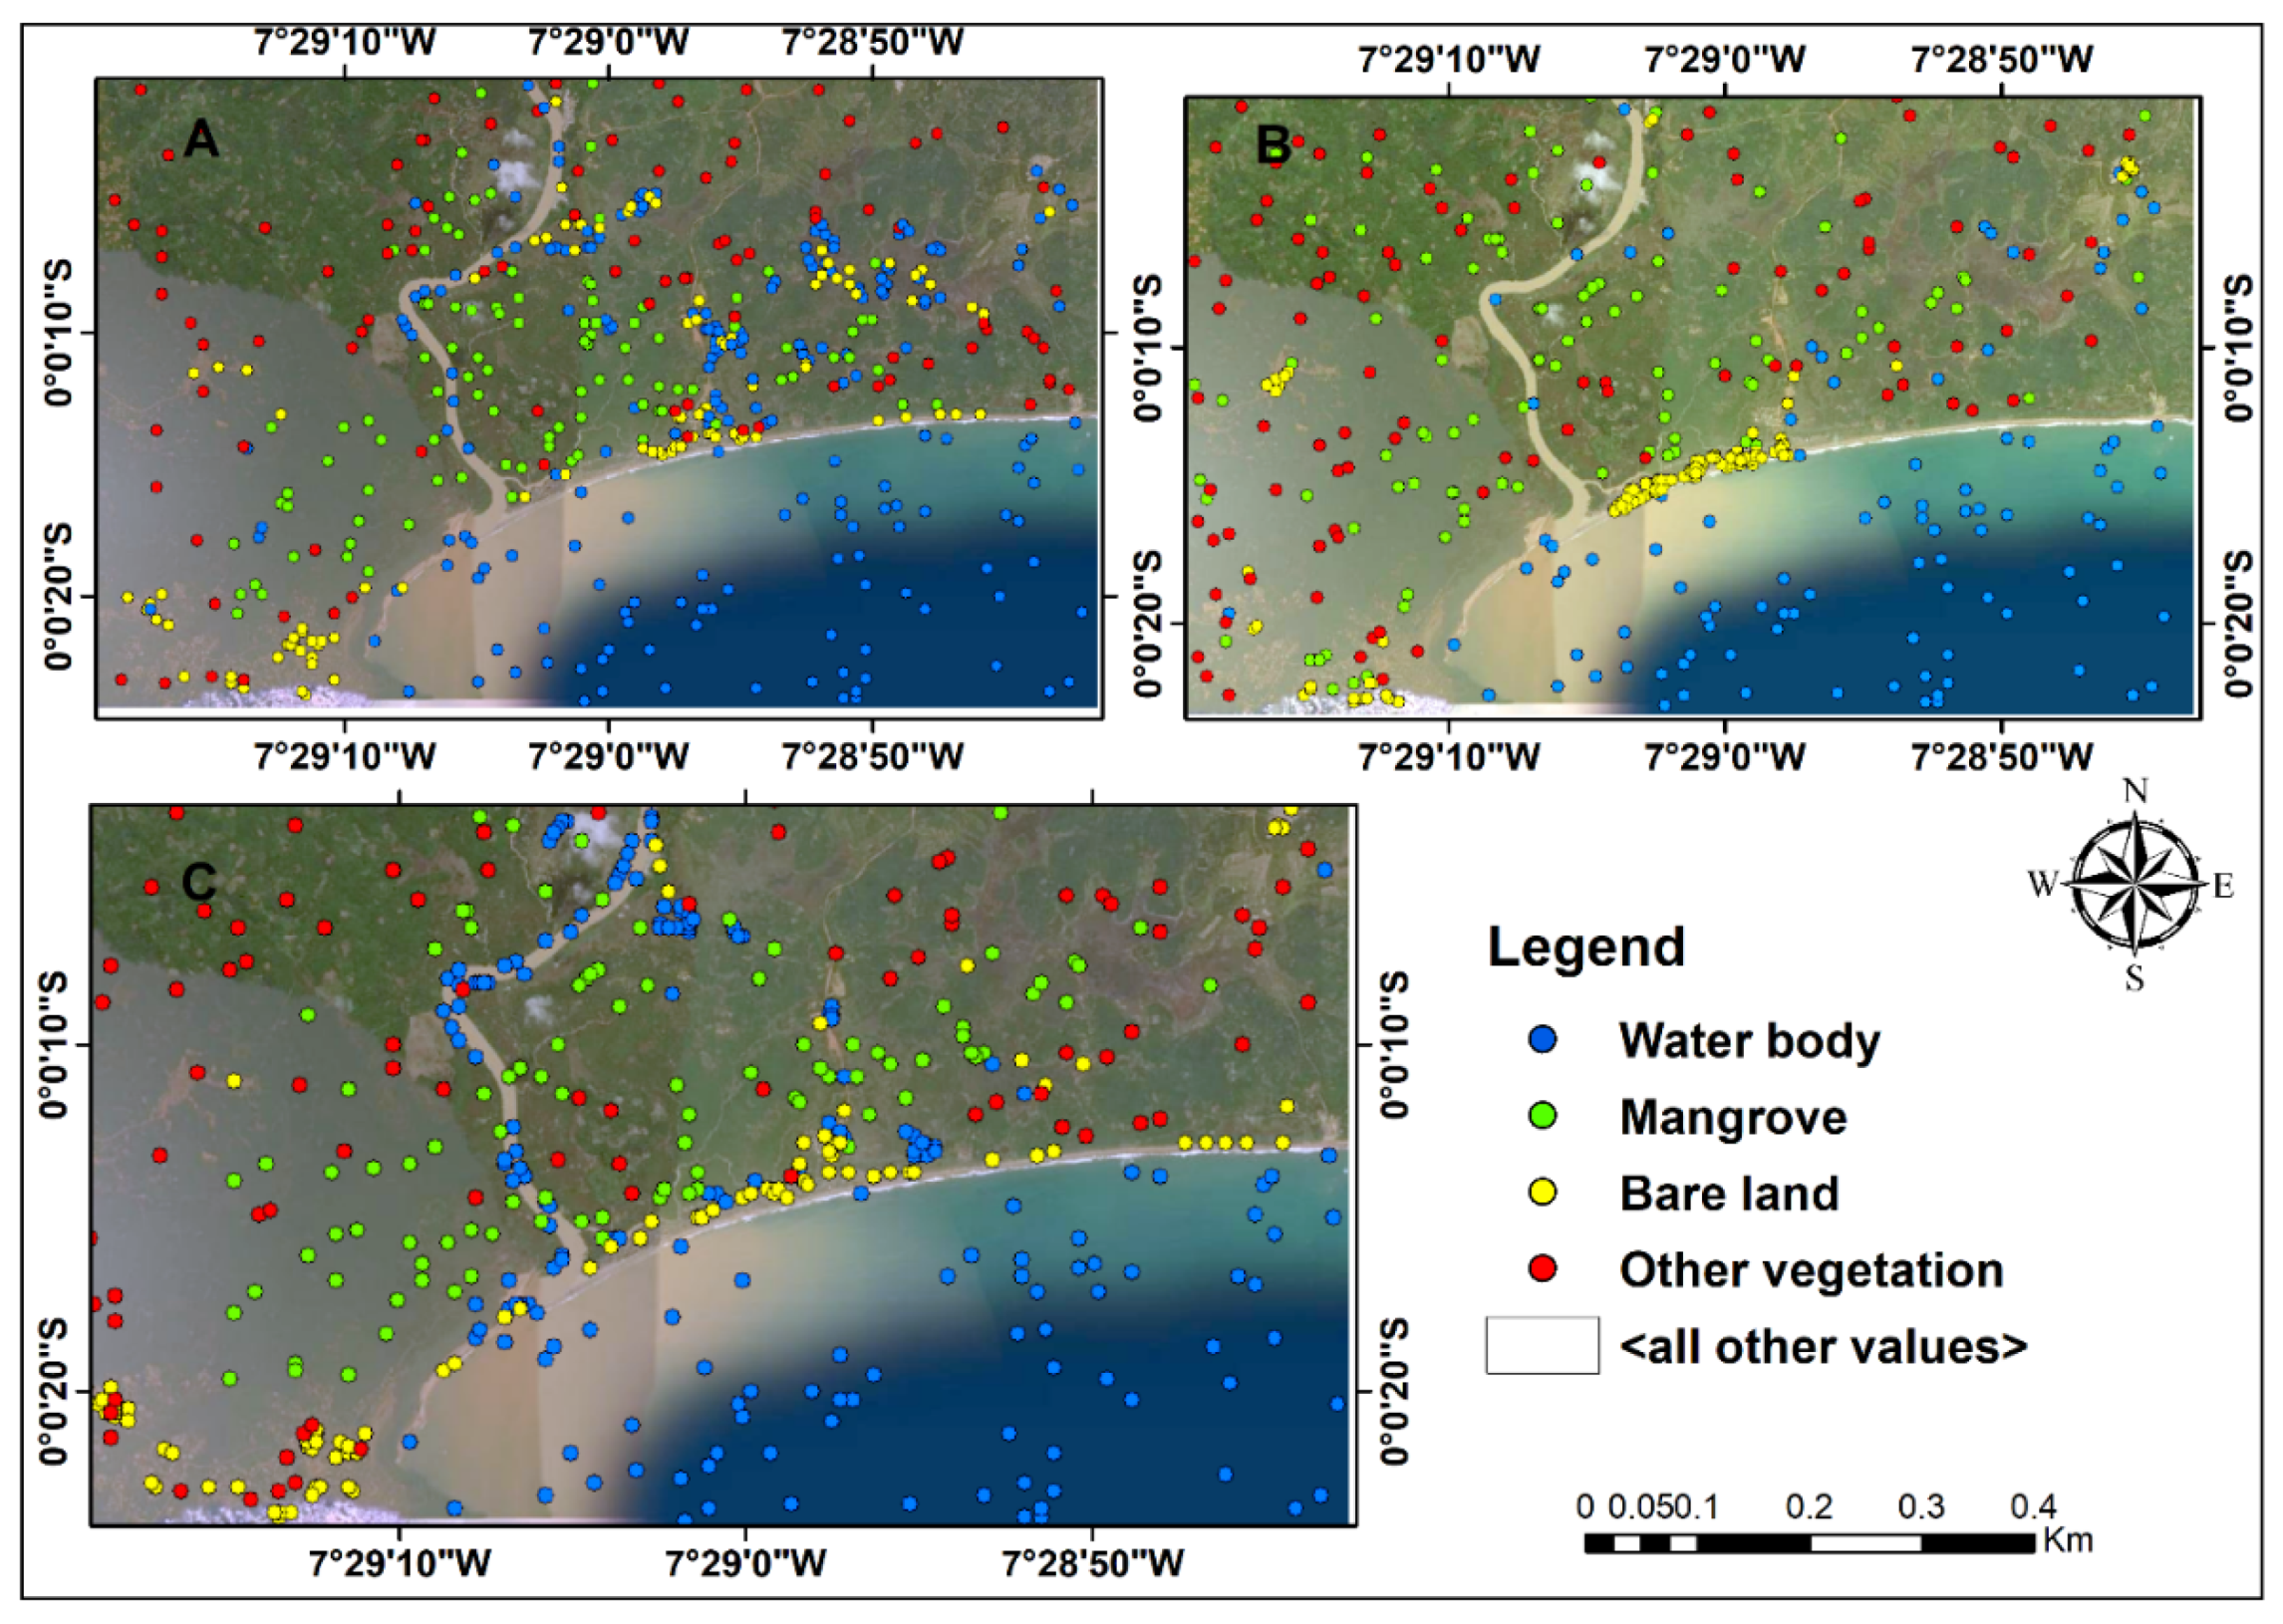
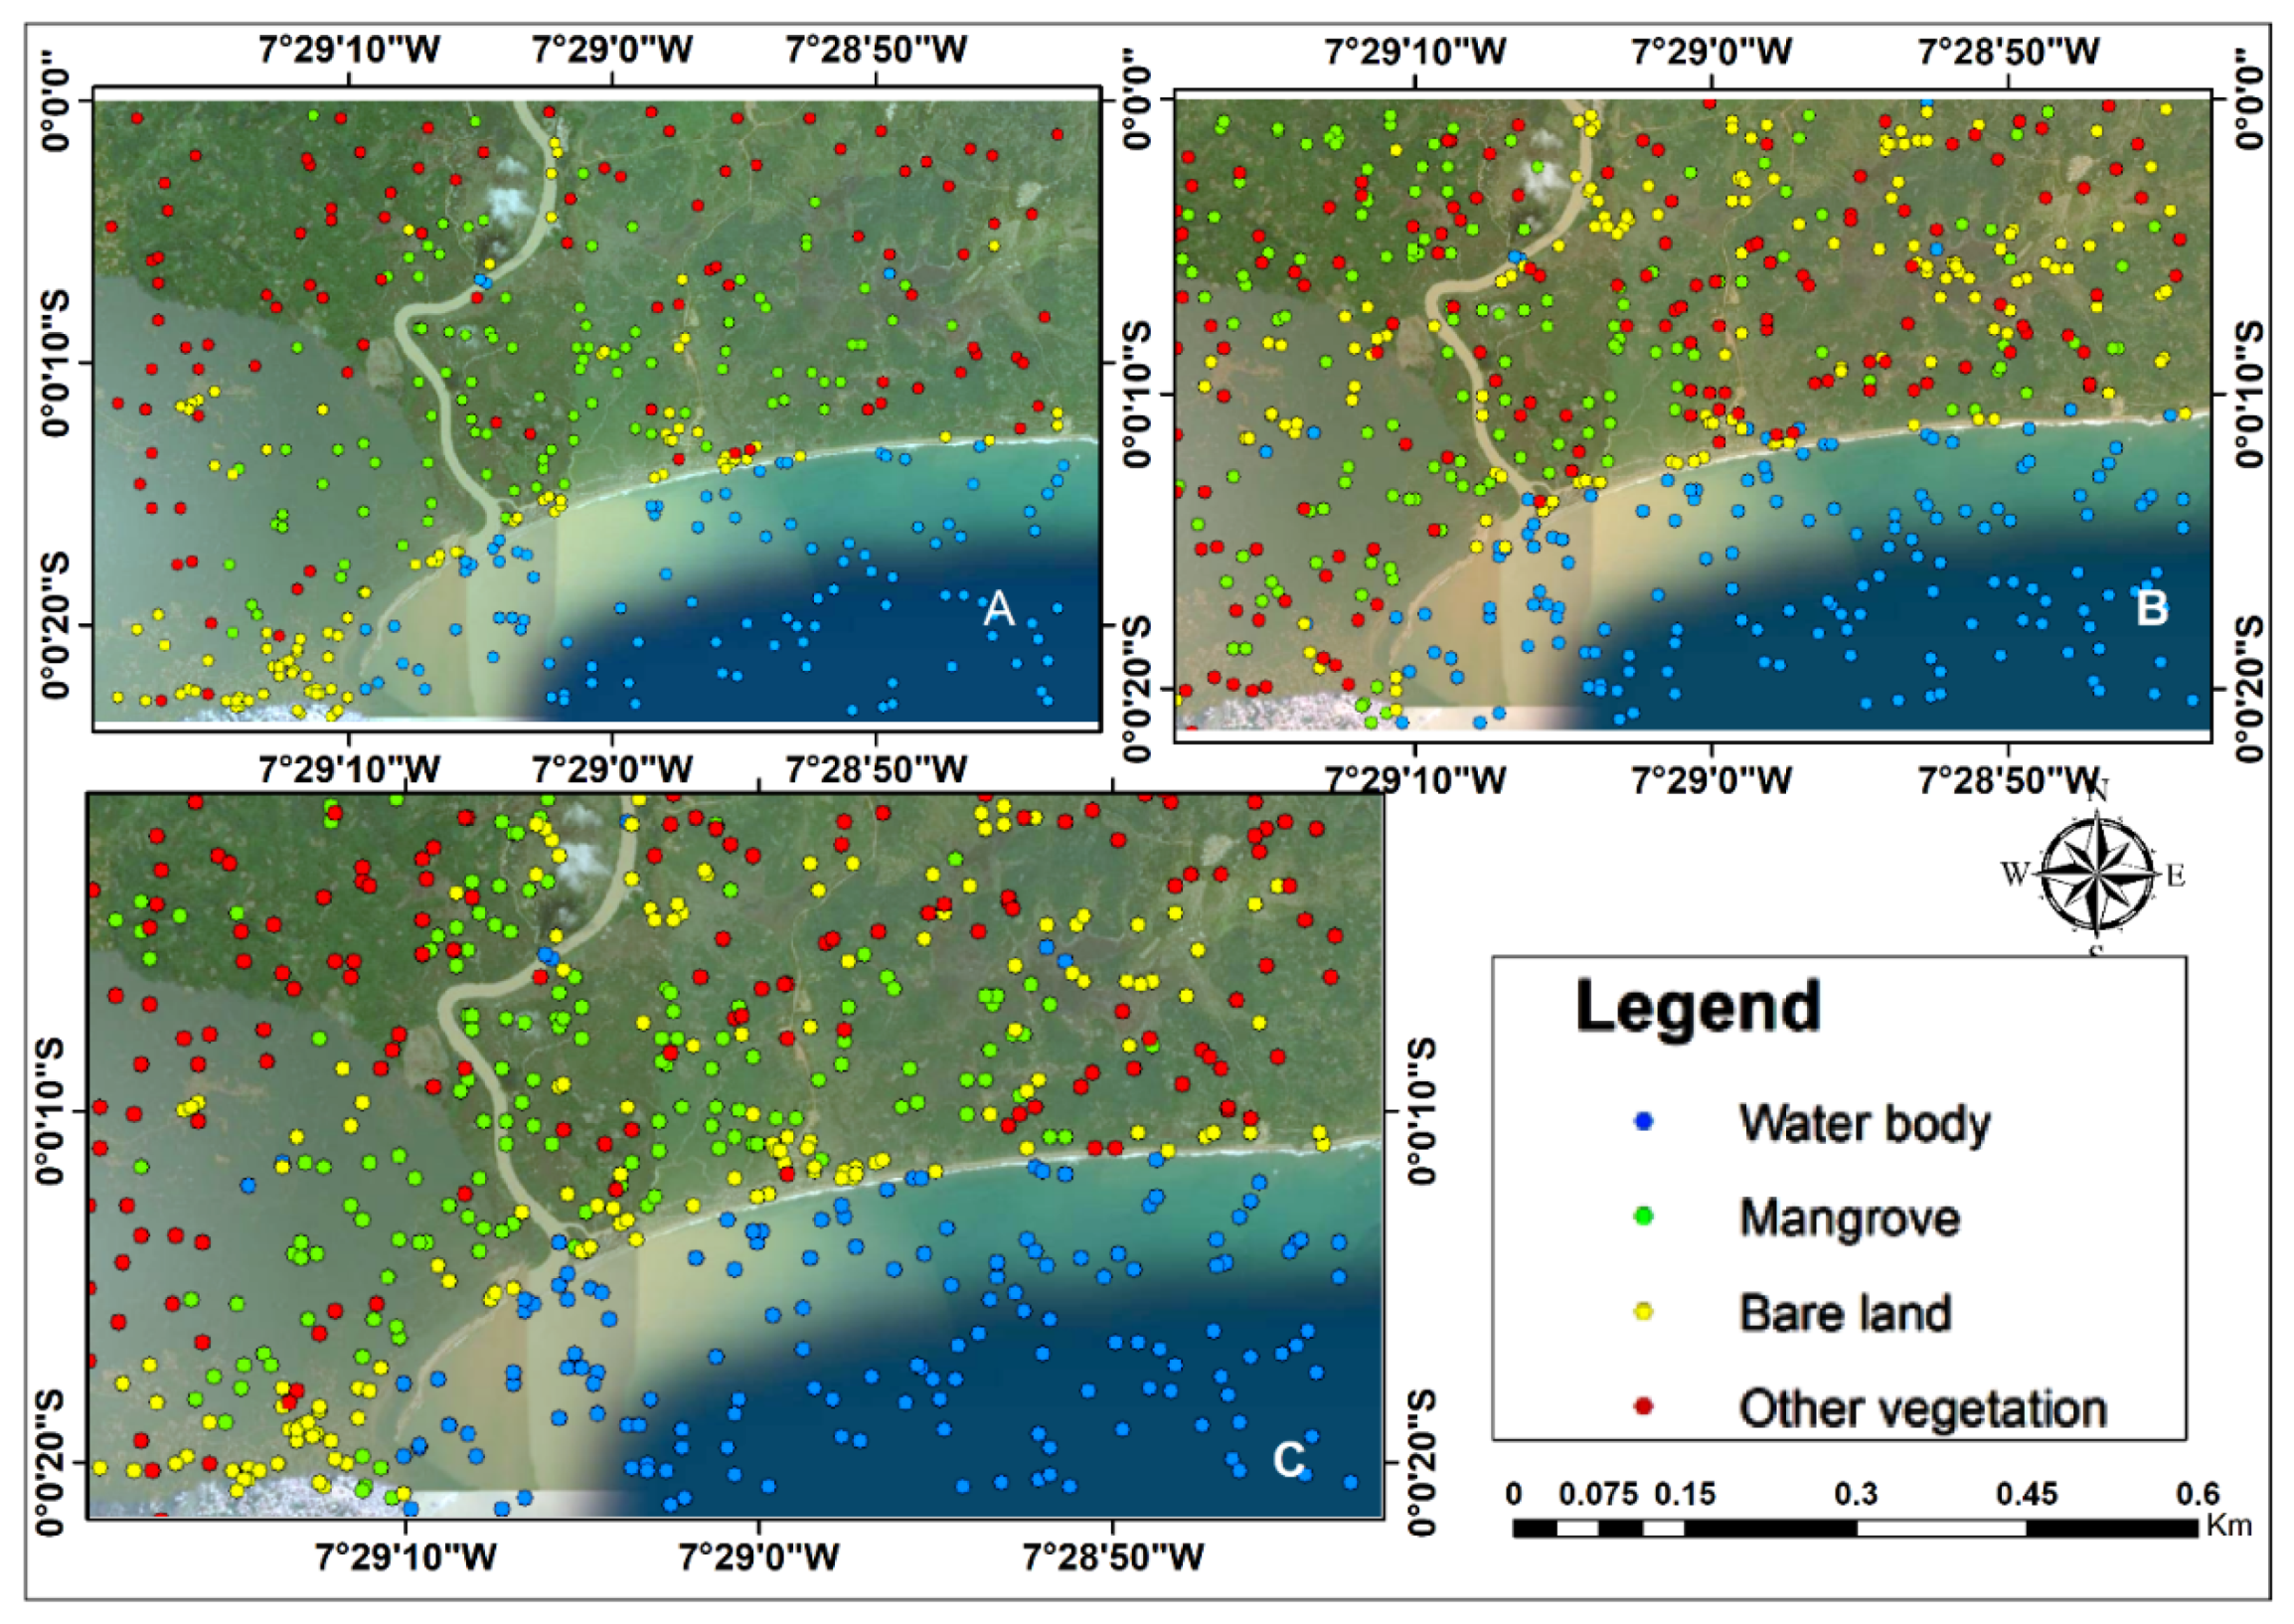
2.3.7. Independent Accuracy Assessment
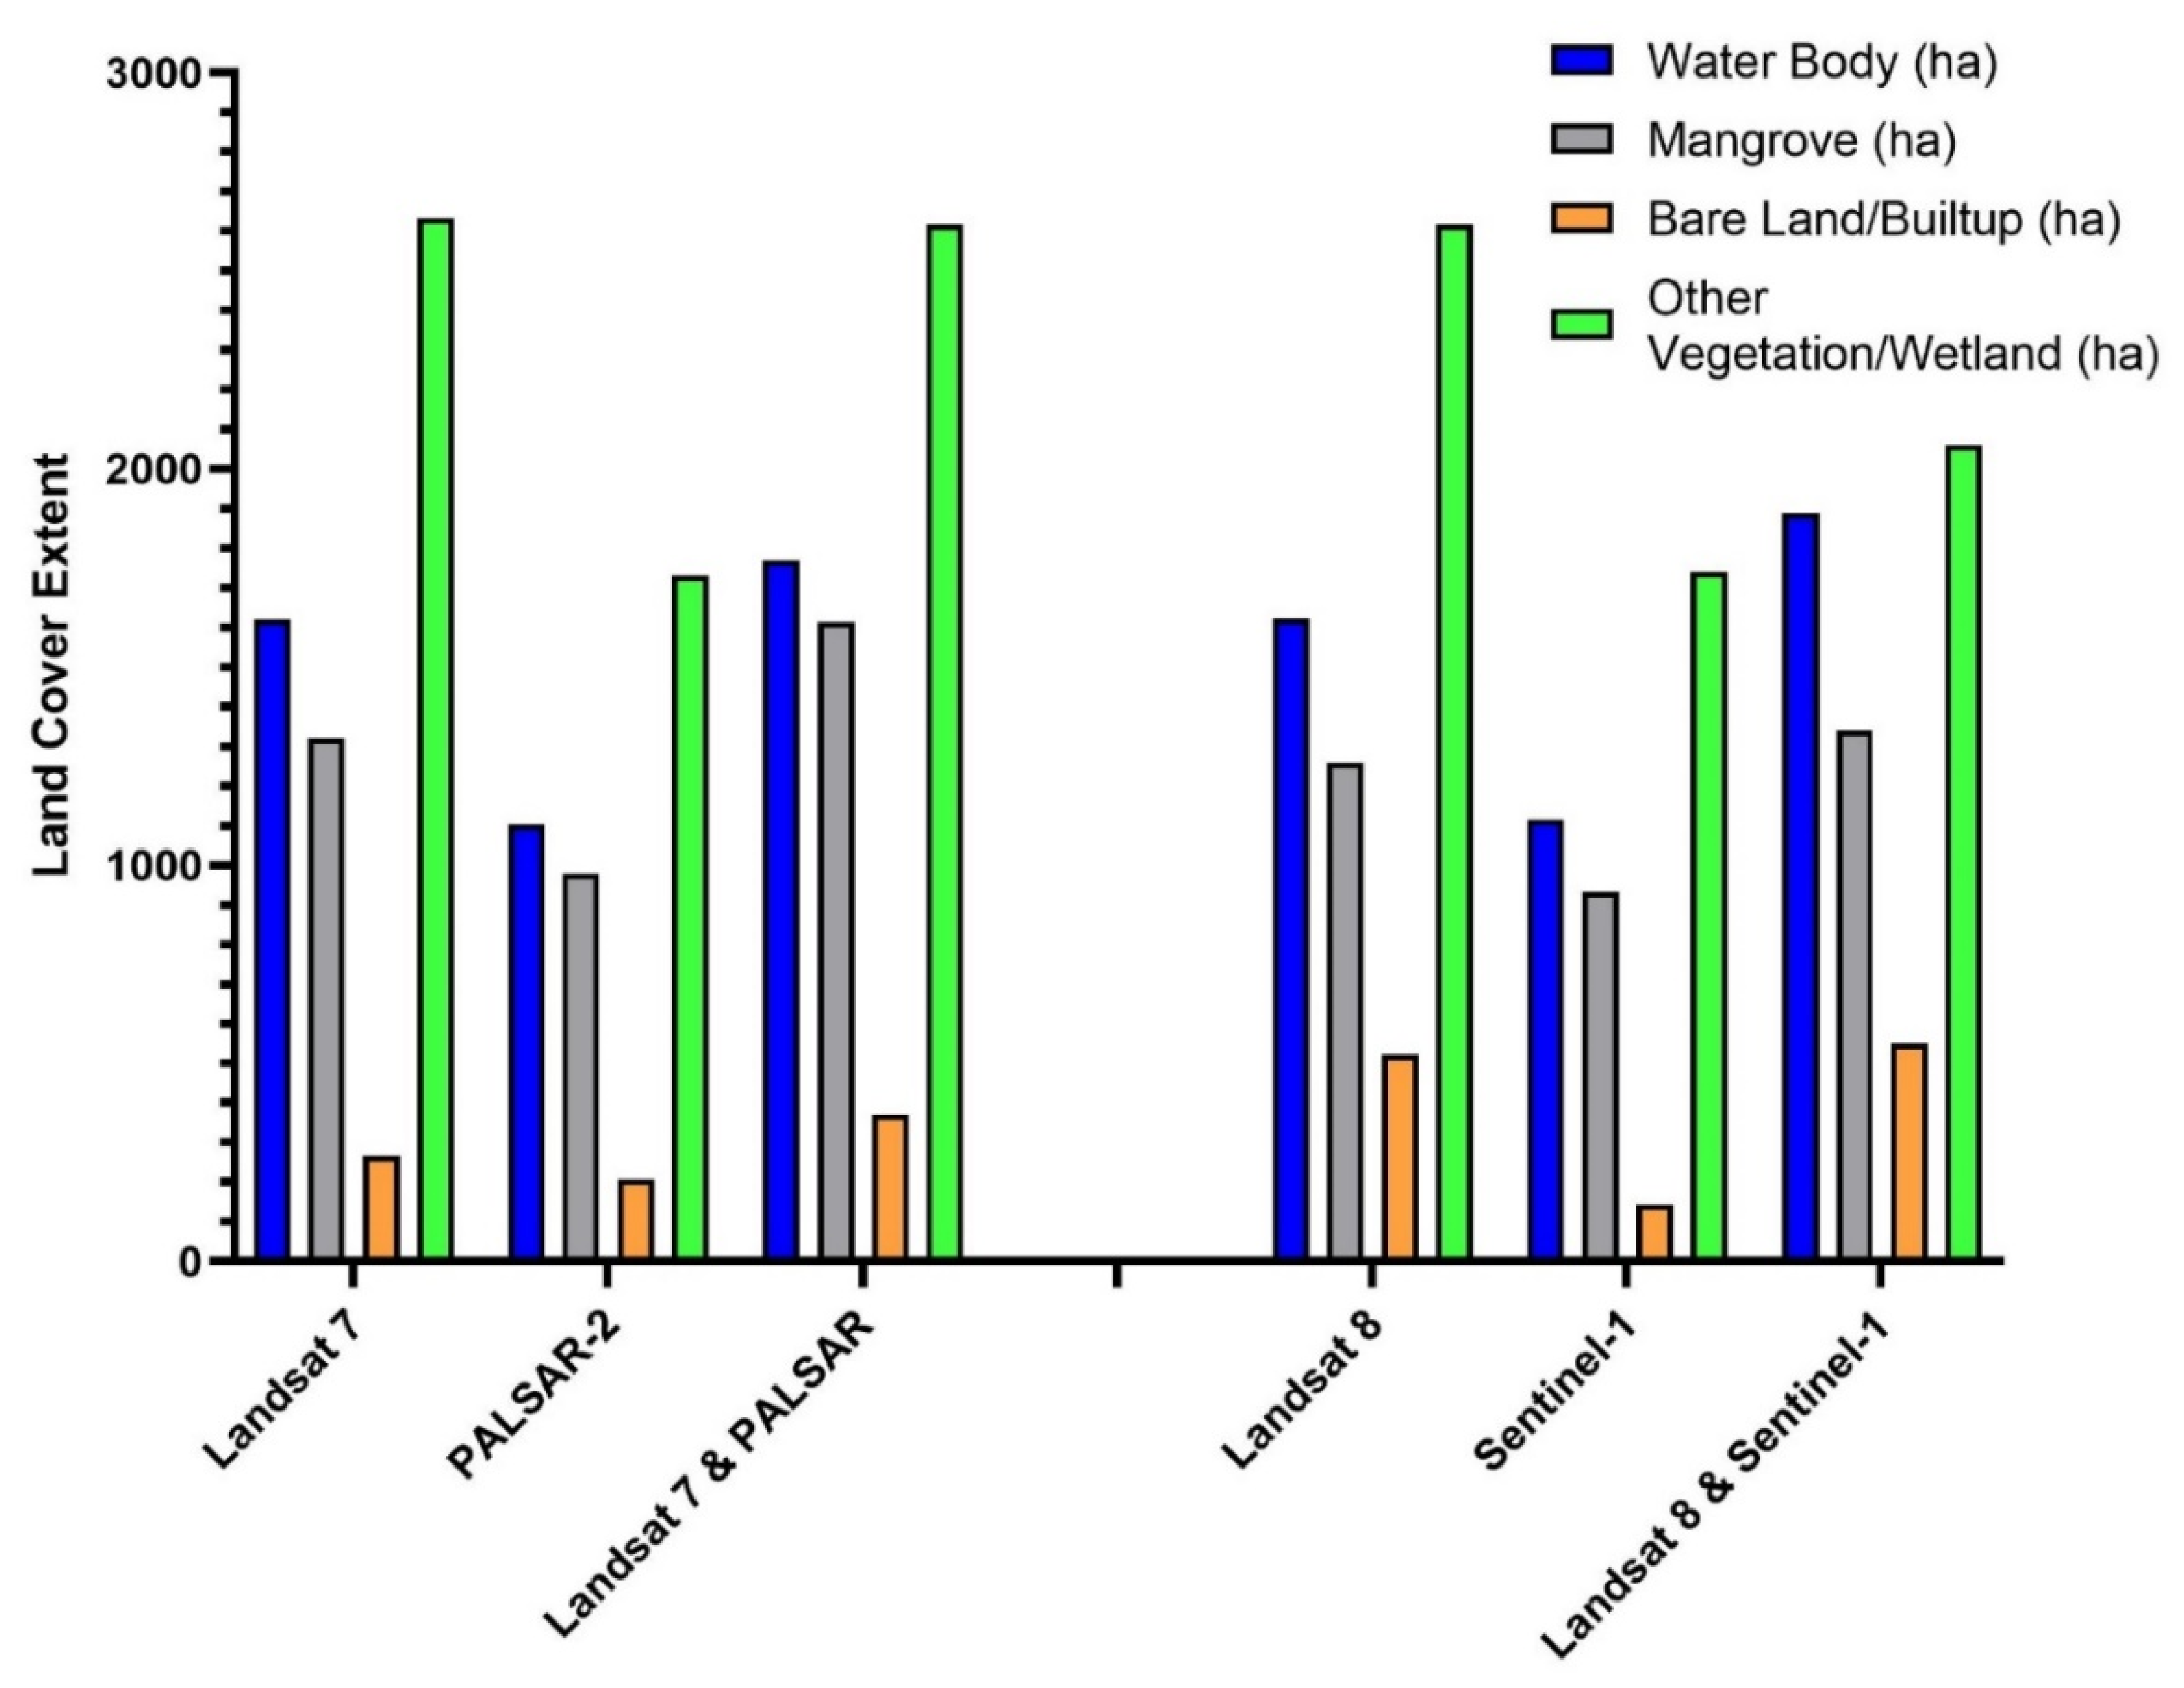
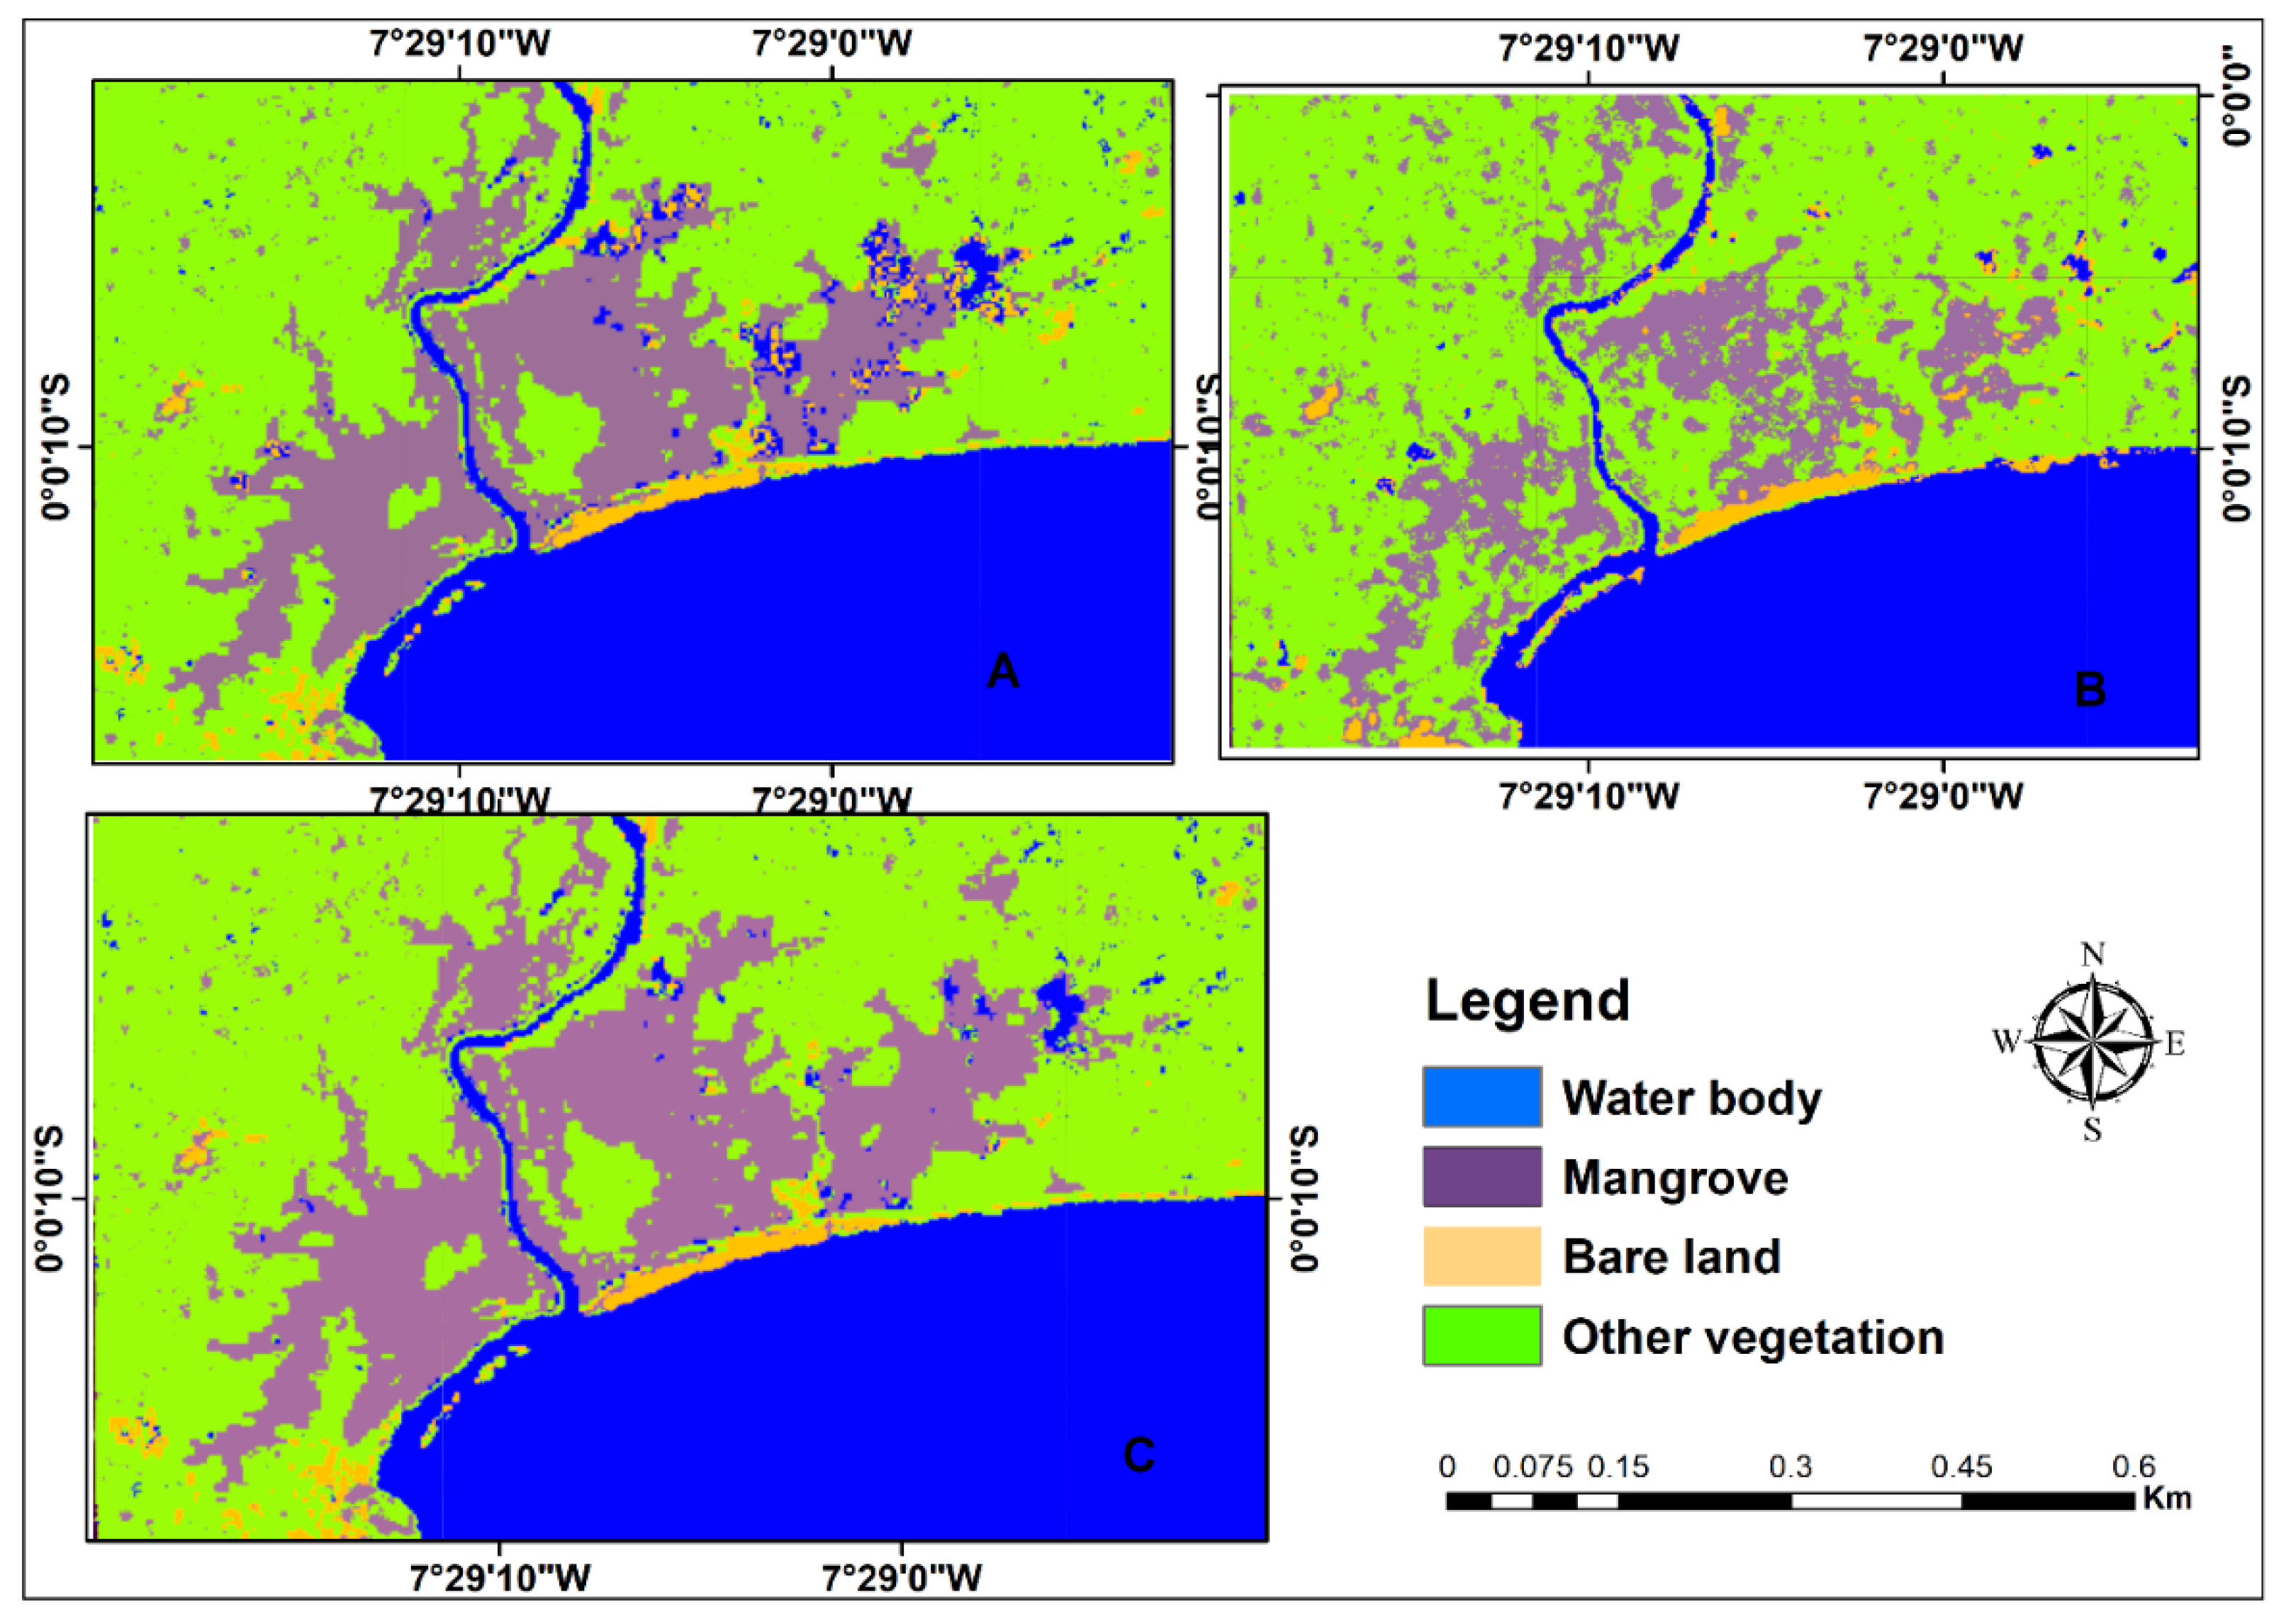
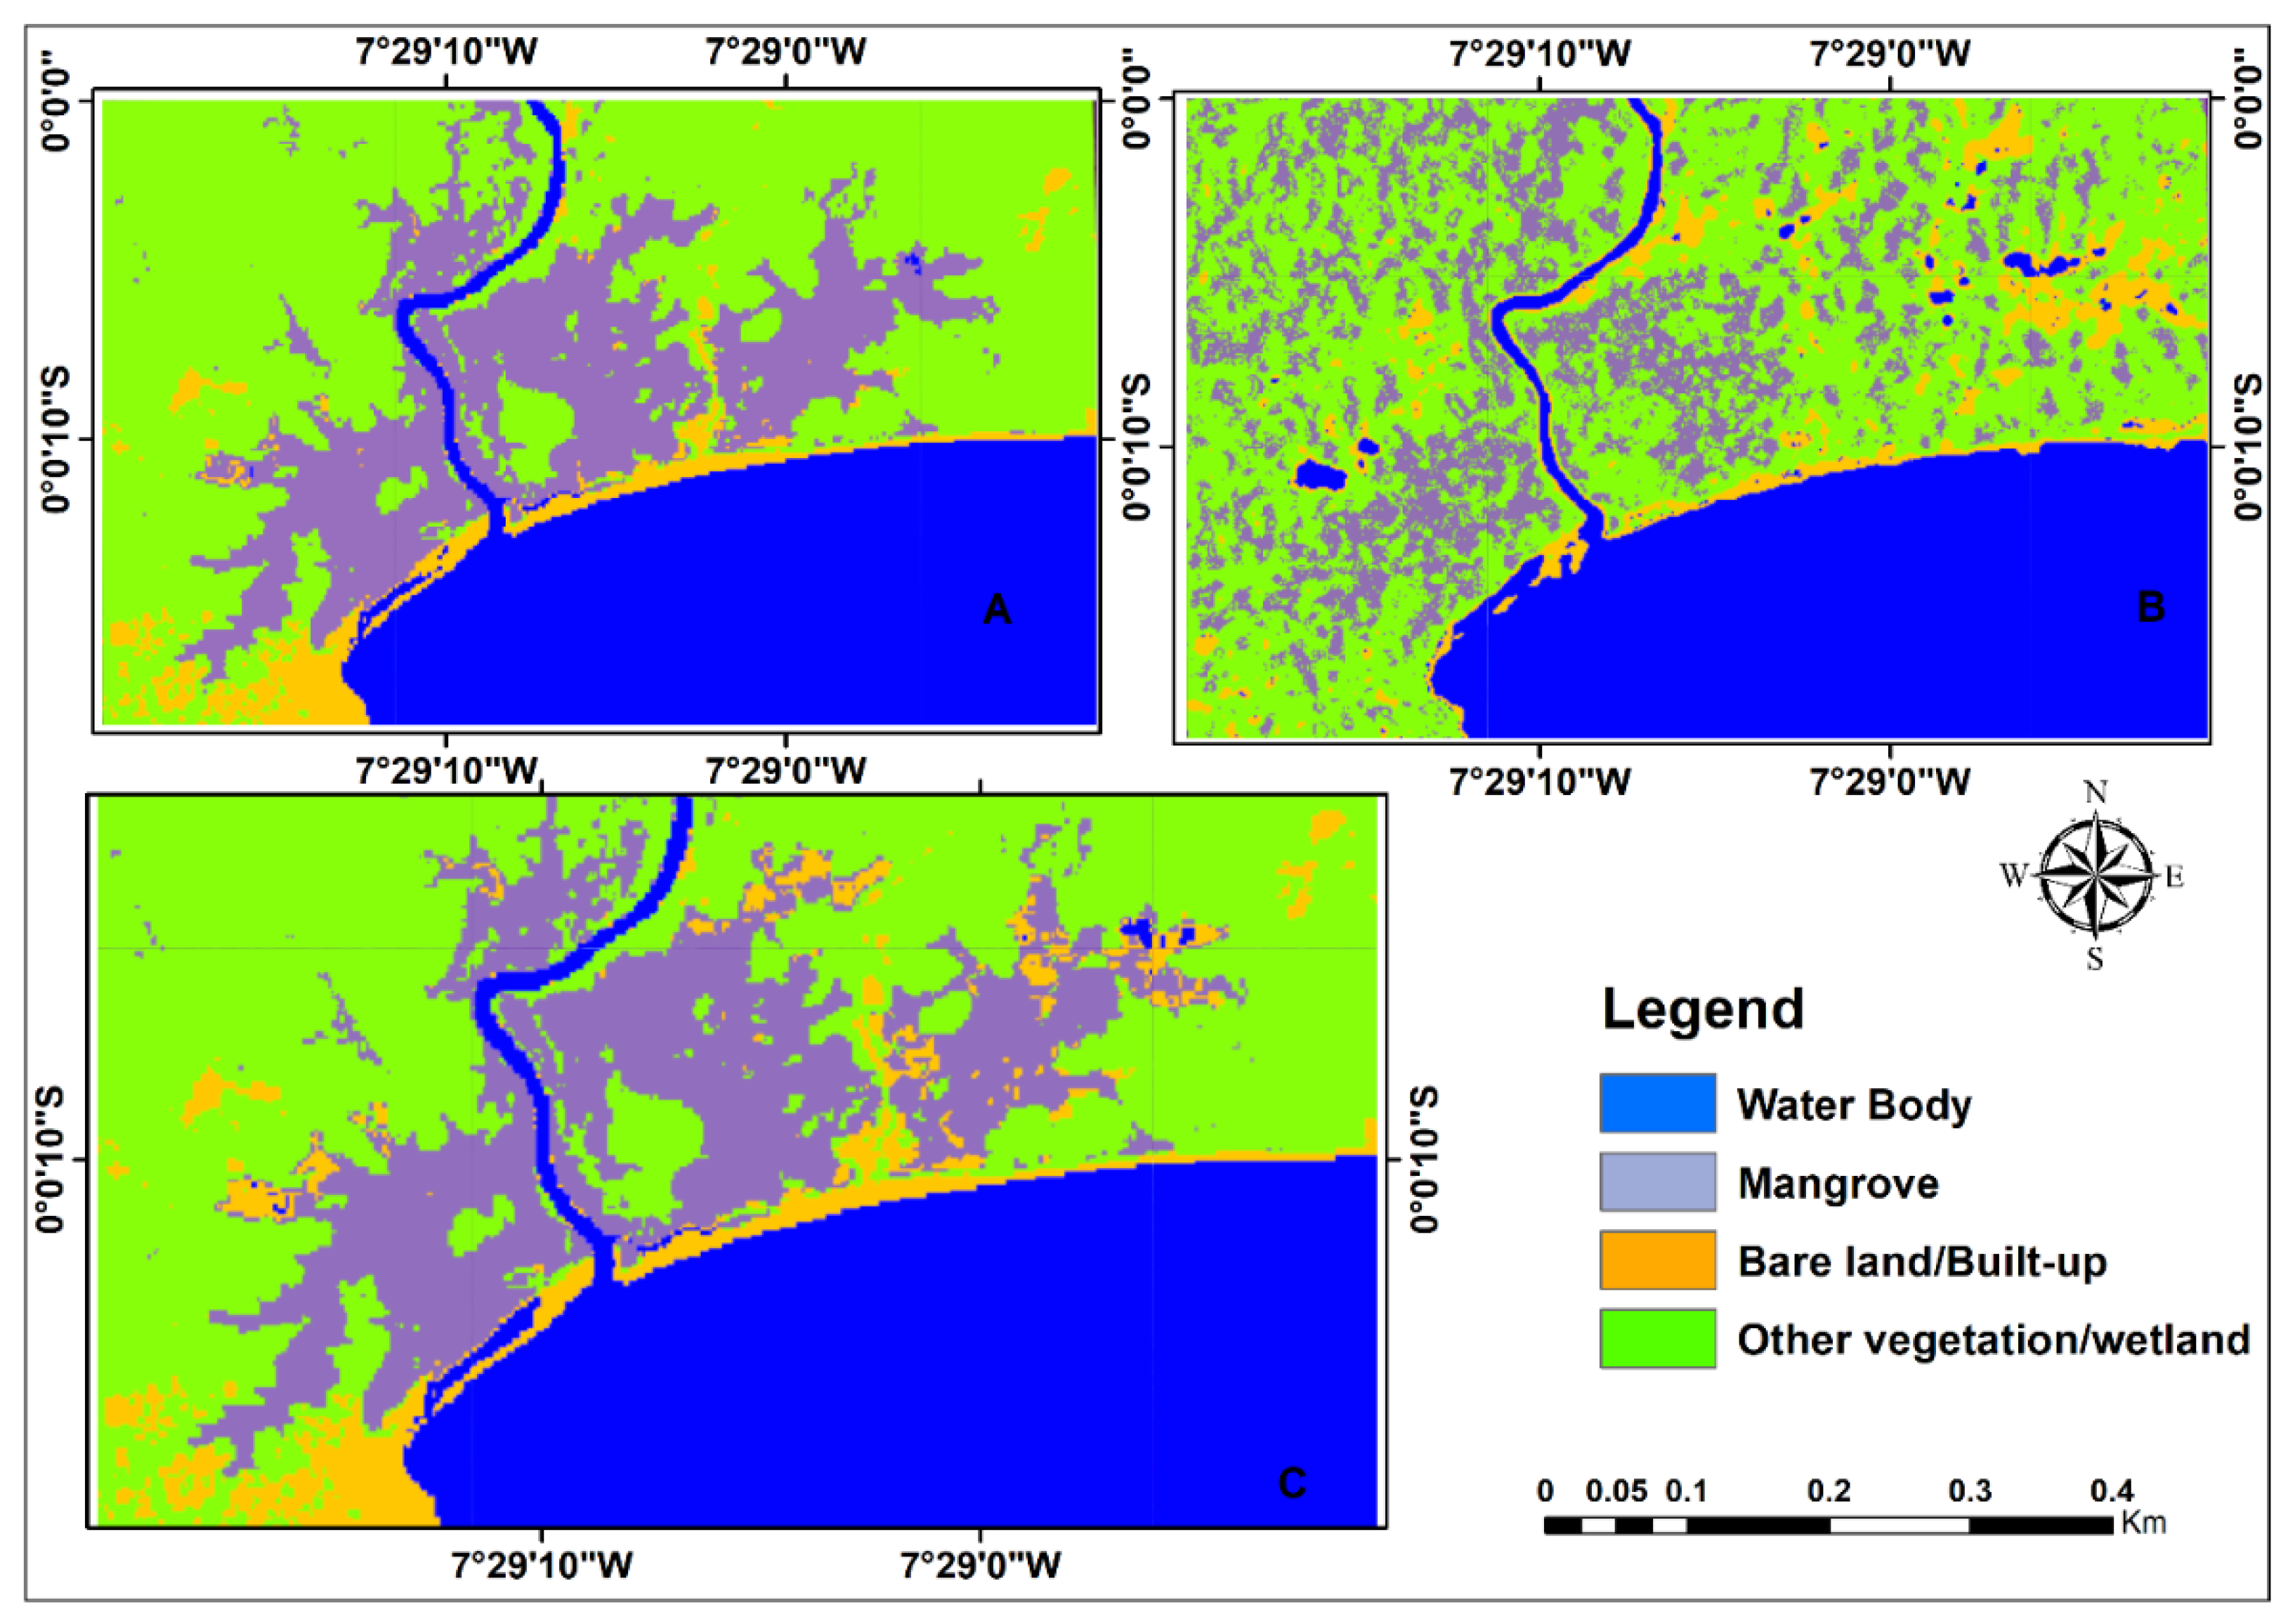
A total of 2131 training sample points were created. The sample points were randomly split for ‘training’ and validation: 80% (1705 points) of the sampling points were used to ‘train’ the model while 20% (426 points) were used for validation.
This was done to remove any systematic error as a result of using the same pixels to train and validate classifiers [53,57]. The accuracy of the classification in GEE was assessed using confusion matrix based on the classifier. The overall accuracy and the kappa coefficient were calculated using the following formula:
O v e r a l l   A c c u r a c y = N u m b e r   o f   c o r r e c t l y   c l a s s i f i e d   p i x e l s   ( s u m   o f   d i a g o n a l ) N u m b e r   o f   t o t a l   s a m p l e d   p i x e l s 100
K a p p a = P 0 P C 1 P C
where, P 0 = observed accuracy and P C = chance agreement.
For independent accuracy assessment, stratified random samples were created using 20% of the training sample, comprising of at least 100 points per class with a 15 m radius buffer around each point. The output of the stratified random sampling points was exported to Google Drive and used to perform independent accuracy assessment following the method described by Barenblitt and Fatoyinbo [56]. This method involves the use of high-resolution satellite imagery available in QGIS to validate each point (Figure 3 and Figure 4).

3. Results

Several iterations were run using different datasets of Sentinel-1, Landsat 8 separately, and a combination of both (i.e., Sentinel-1 + Landsat 8) which represents the three scenarios for 2019. This process was repeated using ALOS PALSAR-2 and Landsat 7 to obtain the corresponding scenarios for 2009. The results of mangrove extent and other land cover changes for the two time periods are presented in Figure 5.
Three main classification scenarios were established to quantify the extent of mangroves and other land cover classes for two time periods: classification of optical data only, classification of SAR data only, and the third scenario combined both optical and SAR data (Figure 6 and Figure 7). The result of Landsat 8 data only (2019) showed a mangrove extent of 1259 ha, water body extent of ‘1622 ha’, bare land extent of 524 ha, and other vegetation extent of 2617 ha, while the Landsat 7 (2009) data showed a mangrove extent of 1321 ha, water body extent of ‘1620 ha’, bare land extent of 266 ha, and other vegetation extent of 2634 ha (Figure 5). The overall classification accuracy for Landsat 8 was 98.9% with a kappa coefficient of 0.979, while the overall accuracy for Landsat 7 was 96.8% with a kappa coefficient of 0.94. The second classification scenario showed a mangrove extent of 933 ha, water body extent of ‘1115 ha’, bare land extent of 144 ha, and other vegetation extent of 1741 ha for Sentinel-1 (2019), while ALOS PALSAR-2 (2009) data showed a mangrove extent of 979 ha, water body extent of ‘1104 ha’, bare land extent of 208 ha, and other vegetation extent of 1731 ha (Figure 5). The overall classification accuracy for Sentinel-1 classification was 84.6% with a kappa coefficient of 0.718, while the overall accuracy for ALOS PALSAR-2 was 96.6% with a kappa coefficient of 0.938. The third classification scenario showed a mangrove extent of 1340 ha, water body extent of ‘1891 ha’, bare land extent of 549 ha, and other vegetation extent of 2062 ha for Sentinel-1 and Landsat 8 combined (2019), while the ALOS PALSAR-2 and Landsat 7 (2009) combination showed a mangrove extent of 1613 ha, water body extent of ‘1770 ha’, bare land extent of 370 ha, and other vegetation extent of 2617 ha. The overall classification accuracy for both Sentinel-1 and Landsat 8 when combined together was 99.1% with a kappa coefficient of 0.984, while the overall accuracy for both ALOS PALSAR-2 and Landsat 7 was 99.6% with a kappa coefficient of 0.992 (Table 2, Table 3, Table 4, Table 5, Table 6 and Table 7).

4. Discussion

Mwita et al. [58] and Wijedasa et al. [59] highlighted several limitations of using only optical satellite images for long-term mapping and monitoring of costal ecosystems. In recent years, advances in machine learning classifiers and a proliferation of high-performance cloud computing platforms such as Google Earth Engine (GEE) offer the possibility to combine optical and radar imagery for efficient land-use and land-cover mapping [3,60,61].
The results show that there are differences in all three classification scenarios for each period (2009–2019). For example, classification using synthetic aperture radar data showed that most structural aspects were captured but it underestimated the vegetation cover and this is consistent with observations in other studies [4,52,62]. In contrast, optical satellite image classification captured the tree canopy more [3] but seemed to overestimate [38] the extent. The ALOS PALSAR-2 data was more effective in characterizing mangroves than the Sentinel-1 data, likely due to the high penetrability of the L-band into the mangrove tree canopy as compared to the C-band.
The LULC changes for the study area between 2009 and 2019 are as presented in Figure 5. The results of the scenario that combined both optical and radar images showed that there have been changes in the various LULC (water body, mangrove, bare lands/built-up, and other vegetation/wetland) over the two time periods. In 2009, mangroves covered 1613 ha, bare land/built-up areas accounted for 370 ha, other vegetation/wetland accounted for 2617 ha, while water body covered about ‘1770 ha’ equivalent. In 2019, mangroves decreased to 1340 ha, bare lands/built-up increased to 549 ha, other vegetation/wetland decreased to 2062 ha, while water body increased to 1891 ha. There was observed a significant change in mangrove cover (16.9% loss), bare land/built-up areas (45% gain), other vegetation/wetland (21% loss), and water body (7% gain). This indicates that mangroves and other vegetation have been converted to either bare land (which could be agricultural land) or built-up areas. Water body has also taken up part of the areas which were previously covered by either mangroves or other vegetation.
We used confusion matrices and an independent accuracy assessment to provide detailed statistical information for each classification scenario. The confusion matrix for Sentinel-1 image classification alone showed that out of 647 pixels which were identified as mangrove, 521 pixels were correctly classified, while the confusion matrix for the corresponding optical image alone showed that out of 647 pixels which were identified as mangroves, 635 pixels were correctly classified (Table 2, Table 3, Table 4, Table 5, Table 6 and Table 7). However, relatively high confusion was found between mangrove and other vegetation for Sentinel-1 and ALOS PALSAR-2 classification as revealed by the independent accuracy assessment (Figure 3 and Figure 4). It was also revealed that the Sentinel-1 and ALOS PALSAR-2 images alone tended to underestimate the mangrove vegetation canopy; however, ALOS PALSAR-2 performed better than Sentinel-1 (Figure 6 and Figure 7). On the other hand, Landsat 7 and Landsat 8 alone tended to overestimate the vegetation cover. The overall classification accuracy for the Sentinel-1 image was 84.6%, while the overall accuracy for the Landsat 8 alone was 98.9%. The overall accuracy when both images were combined was 99.1% with a kappa coefficient of 0.984, showing that the classification using a combination of optical and radar data has a better agreement in the observations (Table 2, Table 3, Table 4, Table 5, Table 6 and Table 7). It was observed that the combination of Landsat 7 and ALOS PALSAR-2 produced better accuracy indicating that L-band performs better than C-band (Table 4 and Table 7).
The third classification scenario that combines optical and radar data yielded the best classification results for 2009 and 2019 as the classes were relatively well distributed, capturing both clustered mangroves and mangrove patches near the water body (Figure 6 and Figure 7). The visual interpretation showed that the third classification scenario achieved a better result, indicating the high potential of this mangrove assessment and monitoring method, as well as agreeing with the findings of Attarchi and Gloaguen, [21] and Ghorbanian et al. [24]. The independent accuracy assessment underscores the robustness of this approach, as shown in Figure 3 and Figure 4. Despite the fact that the same ‘training sample’ was used to train the classifier, the accuracies differ depending on the scenario. The scenario combining both optical and radar data showed better agreement and less confusion compared to when either optical or radar data was used.
This study confirms that combining synthetic aperture radar data with optical satellite data is the way forward in mangrove assessment and mapping, as recommended by several authors [21,22,23,24,26]. The random forest algorithm performed well to clearly classify the different land cover classes within the study area. The resulting classification is consistent with other studies that used random forest algorithms for land cover classification [24,26,63,64].

5. Conclusions

The destruction of tropical and subtropical mangrove forests worldwide is one of the most urgent environmental catastrophes of our time. The world may not achieve the sustainable development goals without addressing deforestation and increasing restoration of mangroves and other forests. In this paper, we elaborated an approach to synthesizing the relevant database in a spatial framework using the Google Earth Engine platform and a random forest algorithm to generate more accurate mangrove extent maps. Cloud computing techniques and machine learning algorithms, such as Google Earth Engine as used in this study, have demonstrated the potential for accurate quantification of mangrove stands as well as various other land uses, particularly in cloud-prone areas. This could allow for a more accurate estimation of mangrove changes at local, regional, or global scales and to track progress in the sustainable development goals (SDGs).
The combination of optical satellite data alongside synthetic aperture radar and random forest algorithm could be valuable for quantifying changes in mangrove ecosystems and their surroundings to fill knowledge gaps essential for mangrove management and conservation. Overall, there is a significant (16.9%) decadal decline in mangrove extent at the study site which could be attributed to land conversion, reflecting the need for conservation, appropriate monitoring, and management. This would require a conscious management plan that includes current and alternative livelihood strategies, sustainable resource management systems, and a sustained awareness of people about mangrove services and their value under climate change, beyond providing for the immediate needs of the community. Continuous replanting of mangrove propagules is encouraged in areas where degradation has occurred.
This type of study can help coastal managers to understand where mangroves are currently found and how they have changed over time. The maps produced in this study are suitable to inform coastal management in the region and the methodology can be reproduced for the entire coastal zone of Ghana and beyond. Although our model estimates mangrove extent fairly well, the main limitation to this study is the lack of up-to-date data for the study area, e.g., 2020 data and high-resolution images (e.g., 10 m) as at the time of these analyses. While the results for the combined application of optical and radar data for mangrove classification are promising for this case study, further research and testing is needed, particularly for larger areas of interest (e.g., the entire coastal zone of West Africa) to fill a critical gap in the accuracy of mangrove mapping and natural capital accounting.

Author Contributions

All authors contributed to the study conception and design. Material preparation, data collection, and analysis were performed by D.A., M.K.M. and D.B.A. The first draft of the manuscript was written by D.A. and all authors contributed to subsequent versions of the manuscript. All authors have read and agreed to the published version of the manuscript.

Funding

This work was funded by the World Bank in collaboration with the government of Ghana through the Africa Center of Excellence in Coastal Resilience (ACECoR).

Institutional Review Board Statement

Not applicable.

Informed Consent Statement

Not applicable.

Data Availability Statement

The datasets generated and/or analyzed during the current study are available in Google Earth Engine database. The Java codes used for this study are available upon request from the first author.

Acknowledgments

We thank Erika Podest, Amber McCullum, Juan Luis Torres Perez, Sean McCartney, Abigail Barenblitt, and Temilola Fatoyinbo for providing the necessary training through the NASA Applied Remote Sensing Training Program (ARSET). We also acknowledge Daniel Doku Nii Nortey’s role during reconnaissance investigation and field support. We thank the five anonymous reviewers for their comments which helped to improve the quality of this work.

Conflicts of Interest

The authors declare no competing interests.

Abbreviations

ALOSAdvanced land observation satellite
ETM+Enhanced thematic mapper
GEEGoogle Earth Engine
HHSingle co-polarization, horizontal transmit/horizontal receive
NDVINormalized difference vegetation index
PALSARPhase array L-band synthetic aperture radar
SARSynthetic aperture radar
SDGsSustainable development goals
VVSingle co-polarization, vertical transmit/vertical receive

References

  1. Blasco, F.; Aizpuru, M.; Besnehard, J. Mangroves, Ecology. Encyclopedia of Coastal Science; Finkl, W.C., Makowski, C., Eds.; Springer Nature Switzerland AG: Cham, Switzerland, 2019. [Google Scholar] [CrossRef]
  2. Maurya, K.; Mahajan, S.; Chaube, N. Remote sensing techniques: Mapping and monitoring of mangrove ecosystem—A review. Complex Intell. Syst. 2021, 7, 2797–2818. [Google Scholar] [CrossRef]
  3. Erika, P.; Amber, M.; Juan, L.; Torres, P.; Sean, M. Forest Mapping and Monitoring with SAR Data: Time Series Analysis; NASA’s Applied Remote Sensing Training Program: Baltimore, MD, USA, 2020. Available online: https://arset.gsfc.nasa.gov/land/webinars/forest-mapping-sar (accessed on 14 May 2020).
  4. Lucas, R.; Rebelo, L.; Fatoyinbo, L.; Rosenqvist, A.; Itoh, T.; Shimada, M.; Simard, M.; Pedro, W.S.; Nathan, T.; Carl, T.; et al. Contribution of L-Band SAR to systematic global mangrove monitoring. Mar. Freshw. Res. 2014, 65, 589–603. [Google Scholar] [CrossRef]
  5. Bunting, P.; Rosenqvist, A.; Lucas, R.M.; Rebelo, L.M.; Hilarides, L.; Thomas, N.; Hardy, A.; Itoh, T.; Shimada, M.; Finlayson, C.M. The global mangrove watch—A new 2010 global baseline of mangrove extent. Remote Sens. 2018, 10, 1669. [Google Scholar] [CrossRef] [Green Version]
  6. Gedan, K.B.; Kirwan, M.L.; Wolanski, E.; Barbier, E.B.; Silliman, B.R. The present and future role of coastal wetland vegetation in protecting shorelines: Answering recent challenges to the paradigm. Clim. Chang. 2011, 106, 7–29. [Google Scholar] [CrossRef]
  7. Kuenzer, C.; Tuan, V.Q. Assessing the ecosystem services value of Can Gio mangrove biosphere reserve: Combining earth-observation- and household-survey-based analyses. Appl. Geogr. 2013, 45, 167–184. [Google Scholar] [CrossRef]
  8. Lee, S.Y.; Primavera, J.H.; Dahdouh-Guebas, F.; McKee, K.; Bosire, J.O.; Cannicci, S.; Diele, K.; Fromard, F.; Koedam, N.; Marchand, C. Ecological role and services of tropical mangrove ecosystems: A reassessment: Reassessment of mangrove ecosystem services. Glob. Ecol. Biogeogr. 2014, 23, 726–743. [Google Scholar] [CrossRef]
  9. Mondal, P.; Trzaska, S.; de Sherbinin, A. Landsat-derived estimates of mangrove extents in the Sierra Leone coastal landscape complex during 1990. Sensors 2018, 18, 12. [Google Scholar] [CrossRef] [Green Version]
  10. Fatoyinbo, T.E.; Simard, M. Height and biomass of mangroves in Africa from ICESat/GLAS and SRTM. Int. J. Remote Sens. 2012, 34, 668–681. [Google Scholar] [CrossRef]
  11. Ellison, A.; Farnsworth, E.; Moore, G. Rhizophora Mangle. The IUCN Red List of Threatened Species. 2015. Available online: http://www.iucnredlist.org/details/178851/0 (accessed on 1 December 2020).
  12. Nortey, D.D.N.; Aheto, D.W.; John, B.; Fredrick, E.J.; Asare, N.K. Comparative assessment of mangrove biomass and fish assemblages in an urban and rural mangrove wetlands in Ghana. Wetlands 2016, 36, 717–730. [Google Scholar] [CrossRef]
  13. Alongi, D.M. Carbon sequestration in mangrove forests. Carbon Manag. 2012, 3, 313–322. [Google Scholar] [CrossRef]
  14. Breithaupt, J.; Smoak, J.M.; Smith, T.J.; Sanders, C.; Hoare, A. Organic carbon burial rates in mangrove sediments: Strengthening the global budget. Glob. Biogeochem. Cycles 2012, 26, GB3011. [Google Scholar] [CrossRef]
  15. Mayaux, P.; Holmgren, P.; Achard, F.; Eva, H.; Stibig, H.J.; Branthomme, A. Tropical forest cover change in the 1990s and options for future monitoring. Philos. Trans. R. Soc. Lond. B Biol. Sci. 2005, 360, 373–384. [Google Scholar] [CrossRef] [PubMed] [Green Version]
  16. FAO. The World’s Mangroves 1980—FAO Forestry Paper; Forest Resources Division: Rome, Italy, 2007; p. 77. [Google Scholar]
  17. Miththapala, S. Mangroves. Coastal Ecosystems Series Volume 2 pp 1–28 + iii, Colombo, Sri Lanka: Ecosystems and Livelihoods Group Asia, IUCN. 2008. Available online: https://portals.iucn.org/library/node/9146 (accessed on 5 November 2020).
  18. World Mangrove Network. Western Indian Ocean Mangrove Network/United States Forest Service Workshop Report, Maputo, Mozambique. 2012. Available online: https://www.un.org/Depts/los/global_reporting/assessments_Workshops_2013/Assessment_Workshop_Mozambique.pdf (accessed on 12 December 2020).
  19. Zhang, C.; Kovacs, J.M.; Liu, Y.; Flores-Verdugo, F.; Flores-De-Santiago, F. Separating mangrove species and conditions using laboratory hyperspectral data: A case study of a degraded mangrove Forest of the Mexican Pacific. Remote Sens. 2014, 6, 11673–11688. [Google Scholar] [CrossRef] [Green Version]
  20. Son, N.T.; Chen, C.F.; Chang, N.B.; Chen, C.R.; Chang, L.Y.; Thanh, B.X. Mangrove mapping and change detection in Ca Mau Peninsula, Vietnam, using landsat data and object-based image analysis. IEEE J. Sel. Top. Appl. Earth Obs. Remote Sens. 2015, 8, 503–510. [Google Scholar] [CrossRef]
  21. Attarchi, S.; Gloaguen, R. Classifying complex mountainous forests with L-Band SAR and landsat data integration: A comparison among different machine learning methods in the Hyrcanian Forest. Remote Sens. 2014, 6, 3624–3647. [Google Scholar] [CrossRef] [Green Version]
  22. Ayman, A.H.; Olena, D.; Islam, A.E.; Gunter, M. Integration of SAR and optical remote sensing data for mapping of mangroves extents. In From Science to Society: The Bridge Provided by Environmental Informatics; Otjacques, B., Hitzelberger, P., Naumann, S., Wohlgemuth, V., Eds.; Shaker Verlag GmbH: Düren, Germany, 2017; pp. 1–8. [Google Scholar]
  23. Hu, T.; Ying, Y.Z.; Yanjun, S.; Yi, Z.; Guanghui, L.; Qinghua, G. Mapping the global mangrove forest aboveground biomass using multisource remote sensing data. Remote Sens. 2020, 12, 1690. [Google Scholar] [CrossRef]
  24. Ghorbanian, A.; Zaghian, S.; Asiyabi, R.; Amani, M.; Mohammadzadeh, A.; Jamali, S. Mangrove ecosystem mapping using Sentinel-1 and Sentinel-2 satellite images and random forest algorithm in Google Earth engine. Remote Sens. 2021, 13, 2565. [Google Scholar] [CrossRef]
  25. Yancho, J.; Jones, T.; Gandhi, S.; Ferster, C.; Lin, A.; Glass, L. The Google Earth Engine Mangrove Mapping Methodology (GEEMMM). Remote Sens. 2020, 12, 3758. [Google Scholar] [CrossRef]
  26. Beselly, S.; van der Wegen, M.; Grueters, U.; Reyns, J.; Dijkstra, J.; Roelvink, D. Eleven years of mangrove–Mudflat dynamics on the mud volcano-induced prograding delta in East Java, Indonesia: Integrating UAV and satellite imagery. Remote Sens. 2021, 13, 1084. [Google Scholar] [CrossRef]
  27. Gislason, P.O.; Benediktsson, J.A.; Sveinsson, J.R. Random forest classification of multisource remote sensing and geographic data. In Proceedings of the 2004 IEEE International Geoscience and Remote Sensing Symposium, IGARSS’04, Anchorage, AK, USA, 20–24 September 2004; pp. 20–24. [Google Scholar]
  28. Ghorbanian, A.; Kakooei, M.; Amani, M.; Mahdavi, S.; Mohammadzadeh, A.; Hasanlou, M. Improved land cover map of Iran using sentinel imagery within Google Earth engine and a novel automatic workflow for land cover classification using migrated training samples. ISPRS J. Photogramm. Remote Sens. 2020, 167, 276–288. [Google Scholar] [CrossRef]
  29. De Santiago, F.F.; Kovacs, J.M.; Lafrance, P. An object-oriented classification method for mapping mangroves in Guinea, West Africa, using multipolarized ALOS PALSAR L-Band data. Int. J. Remote Sens. 2012, 34, 563–586. [Google Scholar] [CrossRef]
  30. Farr, T.G.; Rosen, P.A.; Caro, E.; Crippen, R.; Duren, R.; Hensley, S.; Kobrick, M.; Paller, M.; Rodriguez, E.; Roth, L.; et al. The Shuttle Radar Topography Mission. Rev. Geophys. 2007, 45, RG2004. [Google Scholar] [CrossRef] [Green Version]
  31. Kovacs, J.M.; de Santiago, F.F.; Bastien, J.; Lafrance, P. An assessment of mangroves in Guinea, West Africa, using a field and remote sensing based approach. Wetlands 2010, 30, 773–782. [Google Scholar] [CrossRef]
  32. Omo-Irabor, O.O.; Olobaniyi, S.B.; Akunna, J.; Venus, V.; Maina, J.M.; Paradzayi, C. Mangrove vulnerability modelling in parts of Western Niger Delta, Nigeria using satellite images, GIS techniques and Spatial Multi-Criteria Analysis (SMCA). Environ. Monit. Assess. 2011, 178, 39–51. [Google Scholar] [CrossRef]
  33. Otero, V.; Quisthoudt, K.; Koedam, N.; Dahdouh-Guebas, F. Mangroves at their limits: Detection and area estimation of mangroves along the Sahara Desert Coast. Remote Sens. 2016, 8, 512. [Google Scholar] [CrossRef] [Green Version]
  34. Salami, A.T.; Akinyede, J.; de Gier, A. A preliminary assessment of NigeriaSat-1 for sustainable mangrove forest monitoring. Int. J. Appl. Earth Obs. Geoinf. 2010, 12, S18–S22. [Google Scholar] [CrossRef]
  35. Hoppe-Speer, S.C.; Adams, J.B.; Rajkaran, A. Mangrove expansion and population structure at a planted site, East London, South Africa. South. For. J. For. Sci. 2015, 77, 131–139. [Google Scholar] [CrossRef]
  36. Lagomasino, D.; Fatoyinbo, T.; Lee, S.K.; Feliciano, E.A.; Trettin, C.; Shapiro, A.C.; Mangora, M.M. Measuring mangrove carbon loss and gain in deltas. Environ. Res. Lett. 2019, 14, 025002. [Google Scholar] [CrossRef]
  37. Barenblitt, A.; Fatoyinbo, L. Intro to SDG 6.6 and Remote Sensing Techniques for Mangroves. NASA’s Applied Remote Sensing Training Program. 2020. Available online: https://www.google.com.hk/url?sa=t&rct=j&q=&esrc=s&source=web&cd=&cad=rja&uact=8&ved=2ahUKEwjV56yDv7T7AhVqmWoFHYjED5sQFnoECAoQAQ&url=http%3A%2F%2Fappliedsciences.nasa.gov%2Fsites%2Fdefault%2Ffiles%2F2020-10%2FPart1SDG6_Final.pdf&usg=AOvVaw0tzTfA_Z_yaPzqMnUyDaRe (accessed on 5 November 2020).
  38. Mondal, P.; Liu, X.; Fatoyinbo, T.E.; Lagomasino, D. Evaluating Combinations of Sentinel-2 Data and Machine-Learning Algorithms for mangrove mapping in West Africa. Remote Sens. 2019, 11, 2928. [Google Scholar] [CrossRef]
  39. Friends of the Nation. Assessment of Flora and Fauna of Ecological and Socioeconomic Significance within the Anlo Beach Wetland Complex for Improved Management and Livelihood Outcomes, Parks and Gardens, Adiembra; Friends of the Nation: Takoradi, Ghana, 2014; 60p. [Google Scholar]
  40. Bessah, E.; Raji, A.O.; Taiwo, O.J.; Agodzo, S.K.; Ololade, O.O. Variable resolution modeling of near future mean temperature changes in the dry sub-humid region of Ghana. Model. Earth Syst. Environ. 2018, 4, 919–933. [Google Scholar] [CrossRef]
  41. Kottek, M.; Grieser, J.; Beck, C.; Rudolf, B.; Rubel, F. World map of the Kppen-Geiger climate classification updated. Meteorol. Z. 2006, 15, 259–263. [Google Scholar]
  42. Kwabena, K.Y.; Obuobie, E.; Amisigo, B.; Opoku-Ankomah, Y. Impact of climate change on streamflow in selected river basins in Ghana. Hydrol. Sci. J. 2013, 58, 773–788. [Google Scholar] [CrossRef] [Green Version]
  43. Bessah, E.; Raji, A.O.; Taiwo, O.J.; Agodzo, S.K.; Ololade, O.O. The impact of varying spatial resolution of climate models on future rainfall simulations in the Pra River Basin (Ghana). J. Water Clim. Chang. 2019, 11, 1263–1283. [Google Scholar] [CrossRef]
  44. Ross, C.W.; Prihodko, L.; Anchang, J.; Kumar, S.; Ji, W.; Hanan, N.P. Global Hydrologic Soil Groups (HYSOGs250m) for Curve Number-Based Runoff Modeling; ORNL DAAC: Oak Ridge, TN, USA, 2018. [Google Scholar] [CrossRef]
  45. Bessah, E.; Raji, A.O.; Taiwo, O.J.; Agodzo, S.K.; Ololade, O.O.; Strapasson, A. Hydrological responses to climate and land use changes: The paradox of regional and local climate effect in the Pra River Basin of Ghana. J. Hydrol. Reg. Stud. 2019, 27, 100654. [Google Scholar] [CrossRef]
  46. Coastal Resources Center/Friends of the Nation. Report on Characterization of Coastal Communities and Shoreline Environments in the Western Region of Ghana. Integrated Coastal and Fisheries Governance Initiative for the Western Region of Ghana; Coastal Resources Center, University of Rhode Island: Kingston, RI, USA, 2010; 425p. [Google Scholar]
  47. Okyere, I. Influence of diurnal tides and other physico-chemical factors on the assemblage and diversity of fish species in River Pra Estuary, Ghana. Trop. Ecol. 2018, 59, 83–90. [Google Scholar]
  48. JAXA. ALOS-2/Calibration Result of JAXA Standard Products (ver. 2014.11.20, Initial Calibration Results). 2006. Available online: https://www.eorc.jaxa.jp/ALOS-2/en/calval/calval_index_20141120.htm (accessed on 9 October 2021).
  49. Lavalle, M.; Wright, T. Absolute Radiometric and Polarimetric Calibration of ALOS PALSAR Products. Available online: https://earth.esa.int/eogateway/documents/20142/37627/ALOS-PALSAR-calibration-products-ADEN.pdf?category=Document+library (accessed on 10 December 2020).
  50. Giri, C.; Ochieng, E.; Tieszen, L.L.; Zhu, Z.; Singh, A.; Loveland, T.; Masek, J.; Duke, N. Status and distribution of mangrove forests of the world using earth observation satellite data. Glob. Ecol. Biogeogr. 2011, 20, 154–159. [Google Scholar] [CrossRef]
  51. Hansen, M.C.; Potapov, P.V.; Moore, R.; Hancher, M.; Turubanova, S.A.; Tyukavina, A.; Thau, D.; Stehman, S.V.; Goetz, S.J.; Loveland, T.R. High-resolution global maps of 21st century forest cover change. Science 2013, 342, 850–853. [Google Scholar] [CrossRef] [Green Version]
  52. Nathan, T.; Peter, B.; Richard, L.; Andy, H.; Ake, R.; Fatoyinbo, T.E. Mapping mangrove extent and change: A globally applicable approach. Remote Sens. 2018, 10, 1466. [Google Scholar] [CrossRef] [Green Version]
  53. Shi, T.; Jue, L.; Zhongwen, H.; Huizeng, L.; Junjie, W.; Guofeng, W. New spectral metrics for mangrove forest identification. Remote Sens. Lett. 2016, 7, 885. [Google Scholar] [CrossRef]
  54. Pelletier, C.; Valero, S.; Inglada, J.; Champion, N.; Dedieu, G. Assessing the robustness of random forests to map land cover with high resolution satellite image time series over large areas. Remote Sens. Environ. 2016, 187, 156–168. [Google Scholar] [CrossRef]
  55. Shelestov, A.; Lavreniuk, M.; Kussul, N.; Novikov, A.; Skakun, S. Exploring Google Earth engine platform for big data processing: Classification of multi-temporal satellite imagery for crop mapping. Front. Earth Sci. 2017, 5, 17. [Google Scholar] [CrossRef] [Green Version]
  56. Barenblitt, A.; Fatoyinbo, L. Mangrove Extent Mapping and Time Series; NASA’s Applied Remote Sensing Training Program: Baltimore, MD, USA, 2020. Available online: https://www.google.com.hk/url?sa=t&rct=j&q=&esrc=s&source=web&cd=&cad=rja&uact=8&ved=2ahUKEwiFl9eWv7T7AhXtlWoFHel4ATMQFnoECA0QAQ&url=https%3A%2F%2Fappliedsciences.nasa.gov%2Fsites%2Fdefault%2Ffiles%2F2020-10%2FPart2Extent_Final.pdf&usg=AOvVaw2mHlG5BrJiWmpJ4N7MHyBG (accessed on 5 November 2020).
  57. Pimple, U.; Simonetti, D.; Sitthi, A.; Pungkul, S.; Leadprathom, K.; Skupek, H.; Som-ard, J.; Gond, V.; Towprayoon, S. Google Earth engine based three decadal landsat imagery analysis for mapping of mangrove forests and its surroundings in the Trat Province of Thailand. J. Comput. Commun. 2018, 6, 247–264. [Google Scholar] [CrossRef] [Green Version]
  58. Mwita, E.; Menz, G.; Misana, S.; Nienkemper, P. Detection of small wetlands with multi sensor data in East Africa. Adv. Remote Sens. 2012, 1, 64–73. [Google Scholar] [CrossRef] [Green Version]
  59. Wijedasa, L.S.; Sloan, S.; Michelakis, D.G.; Clements, G.R. Overcoming limitations with landsat imagery for mapping of Peat Swamp Forests in Sundaland. Remote Sens. 2012, 4, 2595–2618. [Google Scholar] [CrossRef] [Green Version]
  60. Jhonnerie, R.; Siregar, V.P.; Nababan, B.; Prasetyo, L.B.; Wouthuyzen, S. Random forest classification for mangrove land cover mapping using landsat 5 TM and Alos Palsar imageries. Procedia Environ. Sci. 2015, 24, 215–221. [Google Scholar] [CrossRef] [Green Version]
  61. Midekisa, A.; Holl, F.; Savory, D.J.; Andrade-Pacheco, R.; Gething, P.; Bennett, A.; Sturrock, H. Mapping land cover change over continental Africa using Landsat and Google Earth Engine cloud computing. PLoS ONE 2017, 12, e0184926. [Google Scholar] [CrossRef]
  62. Carreiras, J.M.B.; Melo, J.M.; Vasconcelos, M.J. Estimating the above-ground biomass in Miombo Savanna woodlands (Mozambique, East Africa) using L-Band synthetic aperture radar data. Remote Sens. 2013, 5, 1524–1548. [Google Scholar] [CrossRef] [Green Version]
  63. Ming, D.; Zhou, T.; Wang, M.; Tian, T. Land cover classification using random forest with genetic algorithm-based parameter optimization. J. Appl. Remote Sens. 2016, 10, 035021. [Google Scholar] [CrossRef]
  64. Phan, T.N.; Kuch, V.; Lehnert, L.W. Land cover classification using Google Earth engine and random forest classifier—The role of image composition. Remote Sens. 2020, 12, 2411. [Google Scholar] [CrossRef]
Figure 1. Map of Study Location.
Sustainability 14 16687 g001
Figure 2. Flowchart of Data Extraction and Iteration Process for Random Forest Model.
Sustainability 14 16687 g002
Figure 3. Independent Accuracy Assessment for the year 2009, (A) Independent Accuracy Assessment for Landsat 7 Image, (B) Independent Accuracy Assessment for ALOS PALSAR-2 Image, (C) Independent Accuracy Assessment for both ALOS PALSAR-2 and Landsat 7.
Sustainability 14 16687 g003
Figure 4. Independent Accuracy Assessment for the year 2019, (A) Independent Accuracy Assessment for Landsat 8 Image, (B) Independent Accuracy Assessment for Sentinel-1 Image, (C) Independent Accuracy Assessment for both Sentinel-1 and Landsat 8.
Sustainability 14 16687 g004
Figure 5. LULC Change Detection for the Time Period using Different Classification Scenarios.
Sustainability 14 16687 g005
Figure 6. Different Scenarios of Mangrove Extent Maps for the year 2009. (A) Classification Scenario using Optical Image only (Landsat 7); (B) Classification Scenario using PALSAR Image; (C) Classification Scenario using both Optical (Landsat 7) and PALSAR Data.
Sustainability 14 16687 g006
Figure 7. Different Scenarios of Mangrove Extent Maps for the year 2019. (A) Classification Scenario using Optical Image only (Landsat 8); (B) Classification Scenario using Sentinel-1 Image only; (C) Classification Scenario using both Optical (Landsat 8) and Sentinel-1.
Sustainability 14 16687 g007
Table 1. Description of Datasets used for Mangrove Extent Mapping and Quantification.
S/NData Type & DateDescriptionSource
1Sentinel-1
(2019)
A synthetic aperture radar (C-Band) with interferometric wide swath mode (IW), having a descending pass, a resolution of 25 m, dual polarization of VV and VH. Image Collection ID: ee.ImageCollection(“COPERNICUS/S1_GRD”), more details can be found at https://developers.google.com/earth-engine/guides/sentinel1 (accessed on 30 November 2020)Google Earth Engine platform database
2ALOS PALSAR-2
(2009)
A synthetic aperture radar at L-Band, having a 100 × 100 in longitude and latitude, a resolution of 25 m, dual polarization of HH and HV. Image Collection ID: N06W002_09_sl_HH, N06W002_09_sl_HV available at https://www.eorc.jaxa.jp/ALOS-2/en/about/palsar2.htm (accessed on 30 November 2020)Japan Aerospace Exploration Agency (JAXA) EORC
3Landsat 8 Surface Reflectance Tier 1
(2019)
Has been atmospherically corrected and contains five visible and near-infrared bands, two short wave infrared bands, and two thermal infrared bands. Image Collection ID: ee.ImageCollection(‘LANDSAT/LC08/C01/T1_SR’). More details at
https://www.usgs.gov/landsat-missions/landsat-surface-reflectance (accessed on 30 November 2020)
Google Earth Engine platform database
4Landsat 7 Surface Reflectance Tier 1 (2009)Has been atmospherically corrected and contains four visible and near-infrared bands, two short wave infrared bands, and one thermal infrared band. Image Collection ID:
ee.ImageCollection(“LANDSAT/LE07/C01/T1_SR”) More details at https://www.usgs.gov/landsat-missions/landsat-surface-reflectance (accessed on 30 November 2020)
Google Earth Engine platform database
5Global mangrove distribution vector (GMW)
(2010)
A baseline global distribution map of mangroves for year 2010. GMW was produced by Aberystwyth University in collaboration with solo earth observation (soloEO). It provides geospatial information about mangrove extent and changes.https://data.unep-wcmc.org/datasets/45 (accessed on 30 November 2020)
Table 2. Confusion/Error Matrix of Land Cover Classification using Landsat 7 Image.
ClassesOpen WaterMangrovesBare LandVegetation/
Wetland
Row TotalUser’s Accuracy
(%)
Open Water760238193.8
Mangroves461512764795.1
Bare Land142613281.3
Vegetation/Wetland012093394598.7
Column Total81631299641705
Producer’s Accuracy
(%)
93.897.589.796.8
Overall accuracy = 96.8%; kappa coefficient = 0.936.
Table 3. Confusion/Error Matrix of Land Cover Classification using ALOS PALSAR-2 Image.
ClassesOpen WaterMangrovesBare LandVegetation/
Wetland
Row TotalUser’s Accuracy
(%)
Open Water760058193.8
Mangroves061503264795.1
Bare Land142343271.9
Vegetation/Wetland012093394598.7
Column Total77631239741705
Producer’s Accuracy
(%)
98.797.510095.8
Overall Accuracy = 96.6%; Kappa Coefficient = 0.938.
Table 4. Confusion/Error Matrix of Land Cover Classification using a combination of Landsat 7 Image and ALOS PALSAR-2.
ClassesOpen WaterMangrovesBare LandVegetation/
Wetland
Row TotalUser’s Accuracy
(%)
Open Water810008193.8
Mangroves06470064795.1
Bare Land012653281.3
Vegetation/Wetland01094494598.7
Column Total81649269641705
Producer’s Accuracy
(%)
93.897.596.999.5
Overall accuracy = 99.6%; kappa coefficient = 0.992.
Table 5. Confusion/Error Matrix of Land Cover Classification using Landsat 8 Image.
ClassesOpen WaterMangrovesBare LandVegetation/
Wetland
Row TotalUser’s Accuracy
(%)
Open Water8100081100
Mangroves063501264798.1
Bare Land402803287.5
Vegetation/Wetland03094294599.7
Column Total85638289541705
Producer’s Accuracy
(%)
95.399.510098.7
Overall accuracy = 98.9%; kappa coefficient = 0.979.
Table 6. Confusion/Error Matrix of Land Cover Classification using Sentinel-1 Data.
ClassesOpen WaterMangrovesBare LandVegetation/
Wetland
Row TotalUser’s Accuracy
(%)
Open Water790208197.5
Mangroves0521012664780.5
Bare Land202373271.9
Vegetation/Wetland0119682094586.8
Column Total81640319531705
Producer’s Accuracy
(%)
97.581.474.286
Overall accuracy = 84.6%; kappa coefficient = 0.718.
Table 7. Confusion/Error Matrix of Land Cover Classification using a combination of Landsat 8 and Sentinel-1 Images.
ClassesOpen WaterMangrovesBare LandVegetation/
Wetland
Row TotalUser’s Accuracy
(%)
Open Water8100081100
Mangroves06421464799.2
Bare Land0032032100
Vegetation/Wetland09093694599
Column Total85651339401705
Producer’s Accuracy
(%)
10098.696.999.6
Overall accuracy = 99.1%; kappa coefficient = 0.984.
Publisher’s Note: MDPI stays neutral with regard to jurisdictional claims in published maps and institutional affiliations.

