Article

Ultrasonic Extraction and Separation of Taxanes from Taxus cuspidata Optimized by Response Surface Methodology

College of Biology and Agricultural Engineering, Jilin University, Changchun 130022, China
*
Author to whom correspondence should be addressed.
Separations 2022, 9(8), 193; https://doi.org/10.3390/separations9080193
Submission received: 4 July 2022 / Revised: 19 July 2022 / Accepted: 23 July 2022 / Published: 26 July 2022
(This article belongs to the Special Issue Separation and Quantitative Analysis of Natural Product Extracts)

Abstract

:
Taxanes are natural compounds with strong antitumor activity. In this study, we first extracted taxanes from the needles of Taxus cuspidata using ultrasonic (US) extraction, and then assessed the effects of different extraction conditions on the yields of eight target compounds. Response surface methodology (RSM) was further used to optimize the extraction conditions: when the liquid-to-solid ratio was 20.88 times, ultrasonic power was 140.00 W, ultrasonic time was 47.63 min, and ethanol content in solvent was 83.50%, taxane yields reached the maximum value of 354.28 μg/g. Under these conditions, the actual extraction rate of taxanes from the needles was 342.27 μg/g. The scanning electron microscopy (SEM) results indicated that the morphology of the needles, suspension cells, and callus of Taxus cuspidata extracted by ultrasonic wave had changed, the pores of the sections of the needles extracted by ultrasonic wave had become relatively loose, and the pore diameter had obviously increased. The callus and overall structure of the suspension cells extracted by ultrasonic wave were destroyed, forming cell fragments. The components of Taxus cuspidata are complex; the high-performance liquid chromatography (HPLC) method established in this paper is suitable for the rapid and effective separation of taxanes in Taxus cuspidata. We systematically and comprehensively compared the yields of taxanes in needles, callus, and suspension cells of Taxus cuspidata, and the taxane yields were increased by the suspension cell culture.

1. Introduction

Taxus is an ancient plant group, with 11 species worldwide, distributed in temperate to tropical regions of the northern hemisphere [1,2,3]. Taxus cuspidata is a kind of Taxus plant, which is mainly distributed in the Changbai Mountains (China), Japan, and North Korea. Its stems and leaves contain paclitaxel, which is a valuable secondary metabolite with medical importance [4,5,6,7]. In addition to paclitaxel, Taxus cuspidata contains other taxane diterpenoids [8,9,10], which usually exist in very small quantities in the needles of Taxus species. Moreover, it is difficult to extract and determine taxanes in Taxus cuspidata because of their similar structures, and the efficient detection of taxanes in Taxus cuspidata is therefore of great research significance [11].
Taxus cuspidata is rich in taxane diterpenoids, which have shown strong antitumor activity [12,13]. Among these diterpinoids, paclitaxel is a clinically important antitumor drug, which can be used to treat ovarian cancer, breast cancer, lung cancer, gastrointestinal cancer, bladder cancer, etc. Its unique mechanism of action has attracted the attention of scholars from all over the world, who have conduct extensive and in-depth research on the genus [14,15,16,17,18]. At present, the raw materials for paclitaxel production are mainly derived from the needles of Taxus cuspidata, which is a non-renewable resource with limited supply, resulting in a shortage of raw materials for paclitaxel extraction.
At present, the extraction and separation methods for paclitaxel include solvent extraction, chromatography, chemical synthesis, membrane separation, fermentation and ultrasonic extraction [19,20,21,22,23]. Using ultrasonic technology to strengthen the extraction and separation process can effectively improve the extraction rate, shorten the extraction time, save costs, and improve product quality and yield [24,25,26,27].
Ultrasonic (US) extraction is an important way to influence the structure of suspension cells and promote the synthesis of secondary metabolites through chemical reactions [28,29,30]. Wang et al. used the leaves of a Douglas fir as raw materials and applied an organic solvent ultrasonic extraction method, with high-performance liquid chromatography (HPLC) and standard curve methods for detection and quantitative analysis, respectively. The rapid extraction method and test method for paclitaxel were determined [31]. Using plant cell culture is an important way of determining the source of paclitaxel [32,33]. An increasing number of researchers have studied this and made some progress. Yao et al. established an HPLC method to detect paclitaxel in Taxus cuspidata callus. The results showed that the concentration of paclitaxel in needles was very low, but the concentration in callus was very high [9]. Therefore, plant tissue culture technology is an effective way to obtain paclitaxel. Using Taxus cells cultured in vitro to produce paclitaxel and its synthetic precursors is an important way to expand the source of paclitaxel. This production mode has low production costs, will not damage wild Taxus cuspidata resources, is not limited by external conditions, and can be cultured artificially. Theoretically, it can fundamentally solve the problem of the shortage in Taxus resources.
In the present study, we aimed to establish an efficient method for extracting and detecting taxanes, to determine the best conditions to maximize the extraction efficiency, and to determine and compare the differences in taxane yields from the needles, callus, and suspension cells of Taxus cuspidata. Our data showed that ultrasonic (US) treatment effectively extracted the taxanes from Taxus cuspidata. Process optimization investigations using the Box–Behnken design (BBD), RSM model, and scanning electron microscopy (SEM) analysis were further performed to visually verify the reliability of the US treatment. It was found that taxane yields can be increased by using suspension cell culture.

2. Materials and Methods

2.1. Materials and Reagents

Taxus cuspidata needles (Figure 1a) was plucked from a ten-year-old Taxus cuspidata specimen planted in the experimental field of the College of Biology and Agricultural Engineering, Jilin University (Jilin, China). The needles of Taxus cuspidata were washed and dried at 40 °C to a constant weight. Then, the sample was crushed and sealed, and stored in a dry environment.
Chromatographic-grade acetonitrile and chromatographic-grade methanol were purchased from American Tedia Company (Cincinnati, OH, USA). Ethanol reagents were of analytical grade (Shanghai, China). Zinc sulfate, magnesium sulfate, manganese sulfate, ferrous sulfate, copper sulfate, potassium nitrate, sodium molybdate, sodium dihydrogen phosphate, disodium EDTA, potassium iodide, cobalt chloride, calcium chloride, boric acid, niacin, inositol, glycine, citric acid, α-naphthalene acetic acid, sucrose, vitamin B6, vitamin B1, agar, hydrolyzed milk protein, and mercury chloride, with purity > 98%, were purchased from Sinopharm Group Chemical Reagent Co., Ltd. (Shanghai, China). Paclitaxel, 10-deacetylbaccatin III (10-DAB III), baccatine III, 7-xylogan-10-deacetyltaxol (DXT), docetaxel, 7-epitaxol, cephalomannine, and 10-deacetyltaxol (10-DAT), with purity > 98%, were bought from Shanghai Yuanye Bio-Technology Co., Ltd. (Shanghai, China). The 2.5% glutaraldehyde solution and PBS buffer were bought from Beijing Leigen Biology Co., Ltd. (Beijing, China).

2.2. Preparation of B5 Culture Medium

The culture medium used in this experiment was B5 culture medium, which was improved by the research group. The mother liquor was prepared with trace elements, organic substances and ferric salts, then stored in a refrigerator at 4 °C. The culture medium can be diluted to a certain proportion during preparation. The components of the improved B5 medium are shown in Table 1.

2.3. Establishment and Culture of Taxus cuspidata Callus

2.3.1. Collection and Pretreatment of Explants

On the morning of the experiment, fresh and well-growing semi-lignified stem tips and stem segments were collected from the Taxus cuspidata experimental field, and soaked in water containing detergent for cleaning. The explants were taken out and washed under running tap water for about 3–4 h to fully wash away the soil, bacteria and detergent. The water on the surface of young stems was absorbed by filter paper and transferred to beakers for later use.

2.3.2. Disinfection of Explants

Young stems of Taxus cuspidata were placed on an ultra-clean workbench. They were soaked 75% alcohol for about 30 s, then taken out and put into sterile water. After removing the residual alcohol from the surface, they were soaked in 0.1% mercuric chloride solution for about 7 min, and then rinsed with sterile water five or six times. The surface moisture was absorbed with sterile filter paper and transferred to beakers for later use.

2.3.3. Inoculation of Explants

The sterilized young stems of Taxus cuspidata were clamped with sterile tweezers, then the leaves on both sides of the stems were cut off with a scalpel. The stems were cut into small segments with a length of about 1–1.5 cm using a scalpel and inserted into the solid culture medium. After inoculation, the culture flask was placed in an artificial climate incubator, and the callus was induced in a dark environment with a humidity of 70 ± 5% and a temperature of 25 ± 1 °C.

2.3.4. Subculture of Callus

After inoculation for 25–30 days, the callus (Figure 1b), which was free from bacterial and fungal infection and in a good growth state, was taken out and directly transplanted into a new B5 solid culture medium. Then, it was placed in an artificial climate incubator and cultured for 23–30 days. After completing the subculture cycle, callus which was in good growth state was selected for subculture. Regular observations were made during this period, with intervention to remove the infection, browning and growth that occurred over time.

2.4. Cell Suspension Culture and Subculture of Taxus cuspidata

The callus of Taxus cuspidata was subcultured eight times to obtain callus with good growth and high taxane yields, and was used as the material of the cell suspension culture. The suspension culture solution was the same as the solid medium, but no agar was added.
The callus was peeled from the explant, placed in a sterile Petri dish, and mashed with sterile tweezers. A total of 0.3 g of callus was weighed, then added to a 100 mL conical flask containing 30 mL of culture solution. This was placed in a constant-temperature shaking incubator for culturing. The culture conditions were as follows: temperature 25 ± 1 °C, rotation speed 120 rpm, in darkness.
Cell growth (Figure 1c) was observed every three days, and cell fluid was added every seven days. For the next generation, it was necessary to let the triangular flask stand for a period of time, then to suck the cell fluid with a pipette and transfer it to a new triangular flask. Then, a new culture medium was added (the ratio of new and old culture medium was about 1:1); each bottle was 30 mL/100 mL. When the cell growth state under the microscope was observed to be poor, it was necessary to centrifuge the cell fluid, remove the old cell fluid and add new cell fluid. When the cell proliferation met the requirements of the experiment, the experiment was started.

2.5. Ultrasonic Extraction Experiment

The needles of Taxus cuspidata were dried in an oven at 40 °C to constant weight, and then fully ground. The callus was scraped from the explant and dried to a constant weight. After drying and fully grinding the suspension cells of Taxus cuspidata, the dried needles, callus and suspension cells powder of Taxus cuspidata were mixed with the ethanol solution extractant. Then, the parameters including the ultrasonic power and ultrasonic time of the ultrasonic crusher were set according to the experimental scheme. Using this process, taxanes were extracted from Taxus cuspidata powder into an extractant. Finally, the product was collected for centrifugal separation, and the supernatant in the centrifuge tube was poured into a rotary evaporator to be evaporated to dryness. The volume was fixed with methanol, and then filtered with 0.22 μm organic microporous membrane as sample pretreatment solution.

2.6. HPLC Detection of Taxane Yields

According to Loganathan D et al. [34], the yields of each taxane in the extract were quantified by high-performance liquid chromatography (HPLC, UltiMate 3000 Separations Module). The gradient elution procedure was set as follows: Inertsil ODS-3 C18 column (250 mm × 4.6 mm, 5 μm), column temperature 30 °C. The detection wavelength was 227 nm; the flow rate was 0.8 mL/min; the injection volume was 10 μL; the mobile phase A was water and B was acetonitrile. The gradient elution procedure was as follows: at 0–10 min, B increased from 40% to 50%, and at 10–13 min, B increased from 50% to 53%. At 13–25 min, B increased from 53% to 73%, and at 25–30 min, B decreased from 73% to 40% for 10 min.
To generate the mixed standard curve, a total of 10 mg of paclitaxel, 10-DAT, baccatin III, 10-DAB III, DXT, cephalomannine, docetaxel and 7-epitaxol standard were accurately weighed and dissolved in methanol to a constant volume of 10 mL. Then, they were diluted with methanol to prepare solutions with concentrations of 1.25, 6.25, 12.5, 22.5 and 125 μg/mL, respectively. The peak areas of standard solutions with different concentrations were measured by high-performance liquid chromatography at 227 nm, and the high-performance liquid standard curves of eight standards were drawn with the standard concentration as abscissa and the peak area as ordinate.

2.7. Single-Factor Experiment

Because the taxane yields of Taxus cuspidata may be influenced by various factors, single-factor experiments were designed and performed. The experimental ranges of different factors used in this study were as follows: liquid-to-solid ratio = 5–30 times; ultrasonic power = 20–200 W; ultrasonic time = 5–90 min; ethanol content in solvent = 50–100%.

2.8. RSM Experiment

Four factors, liquid-to-solid ratio (X1), ultrasonic power (X2), ultrasonic time (X3) and ethanol content in solvent (X4), were selected as dependent variables in the single-factor experiment, and the taxane yields were used as response values. The Box–Behnken design (BBD) assay was adopted to optimize the four dependent variables on the basis of four factors and three levels. There were 29 sets of experiments, and each set of experiments was repeated three times.
The data-processing system of Design Expert12 was used for data statistics, and curve-fitting was performed using Origin Pro2021 software.
After the extraction conditions of taxanes were optimized, three independent experiments were conducted to compare the difference between the experimental values and the predicted values, to determine the superiority of the prediction model.

2.9. SEM

The microstructure of the residue of Taxus cuspidata needles, callus, and suspension cells before and after ultrasonic treatment was observed by Sigma300 ultra-low-temperature scanning electron microscope (Oberkochen, Germany). For the needles, a small amount of Taxus cuspidata powder was taken before and after ultrasonic extraction, applied to conductive adhesive, and sprayed using gold ion sputtering, before being observed and photographed with the scanning electron microscope. The callus and suspension cells were selected before and after ultrasonic extraction, respectively, and fixed with 2.5% glutaraldehyde at room temperature for 2–4 h. Then, 0.1 mol, pH 7.2 was used, rinsed 3–4 times with PBS buffer and then with deionized water for 30 min. Ethanol concentrations of 30%, 50%, 70%, 80%, 90%, 95% and 100% were used for step-by-step dehydration; each step was 15–20 min. The product was dried with a CO2 critical point dryer, sprayed with gold ion sputtering, and then observed and photographed with a scanning electron microscope.

3. Results

3.1. Drawing of Standard Curve

Figure 2a shows the HPLC diagram for eight taxane standards, and Figure 2b shows the HPLC diagram of the actual extracted samples. Compound 1 was 10-deacetylbaccatin III (10-DAB III), compound 2 was baccatin III, compound 3 was 7-xylogan-10-deacetyltaxol (DXT), compound 4 was 10-deacetyltaxol (10-DAT), compound 5 was docetaxel, compound 6 was cephalomannine, compound 7 was paclitaxel, and compound 8 was 7-epitaxol. We calculated the regression equation of the standard curve for eight taxanes (Table 2), to calculate the taxane yields in needles, callus, and suspension cells. The molecular weight of paclitaxel and 7-epitaxol was the same, at 854.906. Only one carbon bond differed in the structure, but the polarities of the two were quite different. Liquid chromatography was able to separate the two very well. The molecular weights of Baccatin III and 10-DAB III were similar. Among the eight substances, 10-DAB III had the largest polarity, and its peak appeared first using liquid chromatography. DXT has higher molecular weight and polarity than 10-DAT, and the peak in liquid chromatography occurred earlier than 10-DAT. Although the molecular weights of cephalomannine and docetaxel differed by 24.022, the polarities of the two were very similar. It was not easy to separate the two using liquid chromatography, and it is necessary to explore the conditions. The HPLC experimental method used in this paper can separate them well.
In this study, eight taxanes in Taxus cuspidata were separated by high-performance liquid chromatography (HPLC). Taxus cuspidata extract samples were pretreated before injection and filtered through a 0.22 μm microporous membrane to prevent particles in the samples from blocking the pipeline. The solvent used had good solubility; taxanes are easily soluble in organic solvents. The extract selected in this paper was mainly ethanol solution, and the mobile phase was acetonitrile, each of which have good solubility for taxanes. When the sample solution was injected into the injection valve, the sample solution in the injector entered the chromatographic column with the mobile phase. The mobile phase and the stationary phase were both liquid, and the mobile phase and the stationary phase should be mutually immiscible (with different polarities to avoid the loss of stationary liquid). When the sample entered the chromatographic column, solute was distributed between the two phases. The taxanes in the mobile phase passed through the stationary phase, then flowed out of the stationary phase individually, due to the different sizes and strengths of their interactions (adsorption, distribution, exclusion, and affinity) with the stationary phase. As their retention times in the stationary phase were different, the taxanes were well separated. Figure 3 indicates the chemical structures of the eight taxanes.

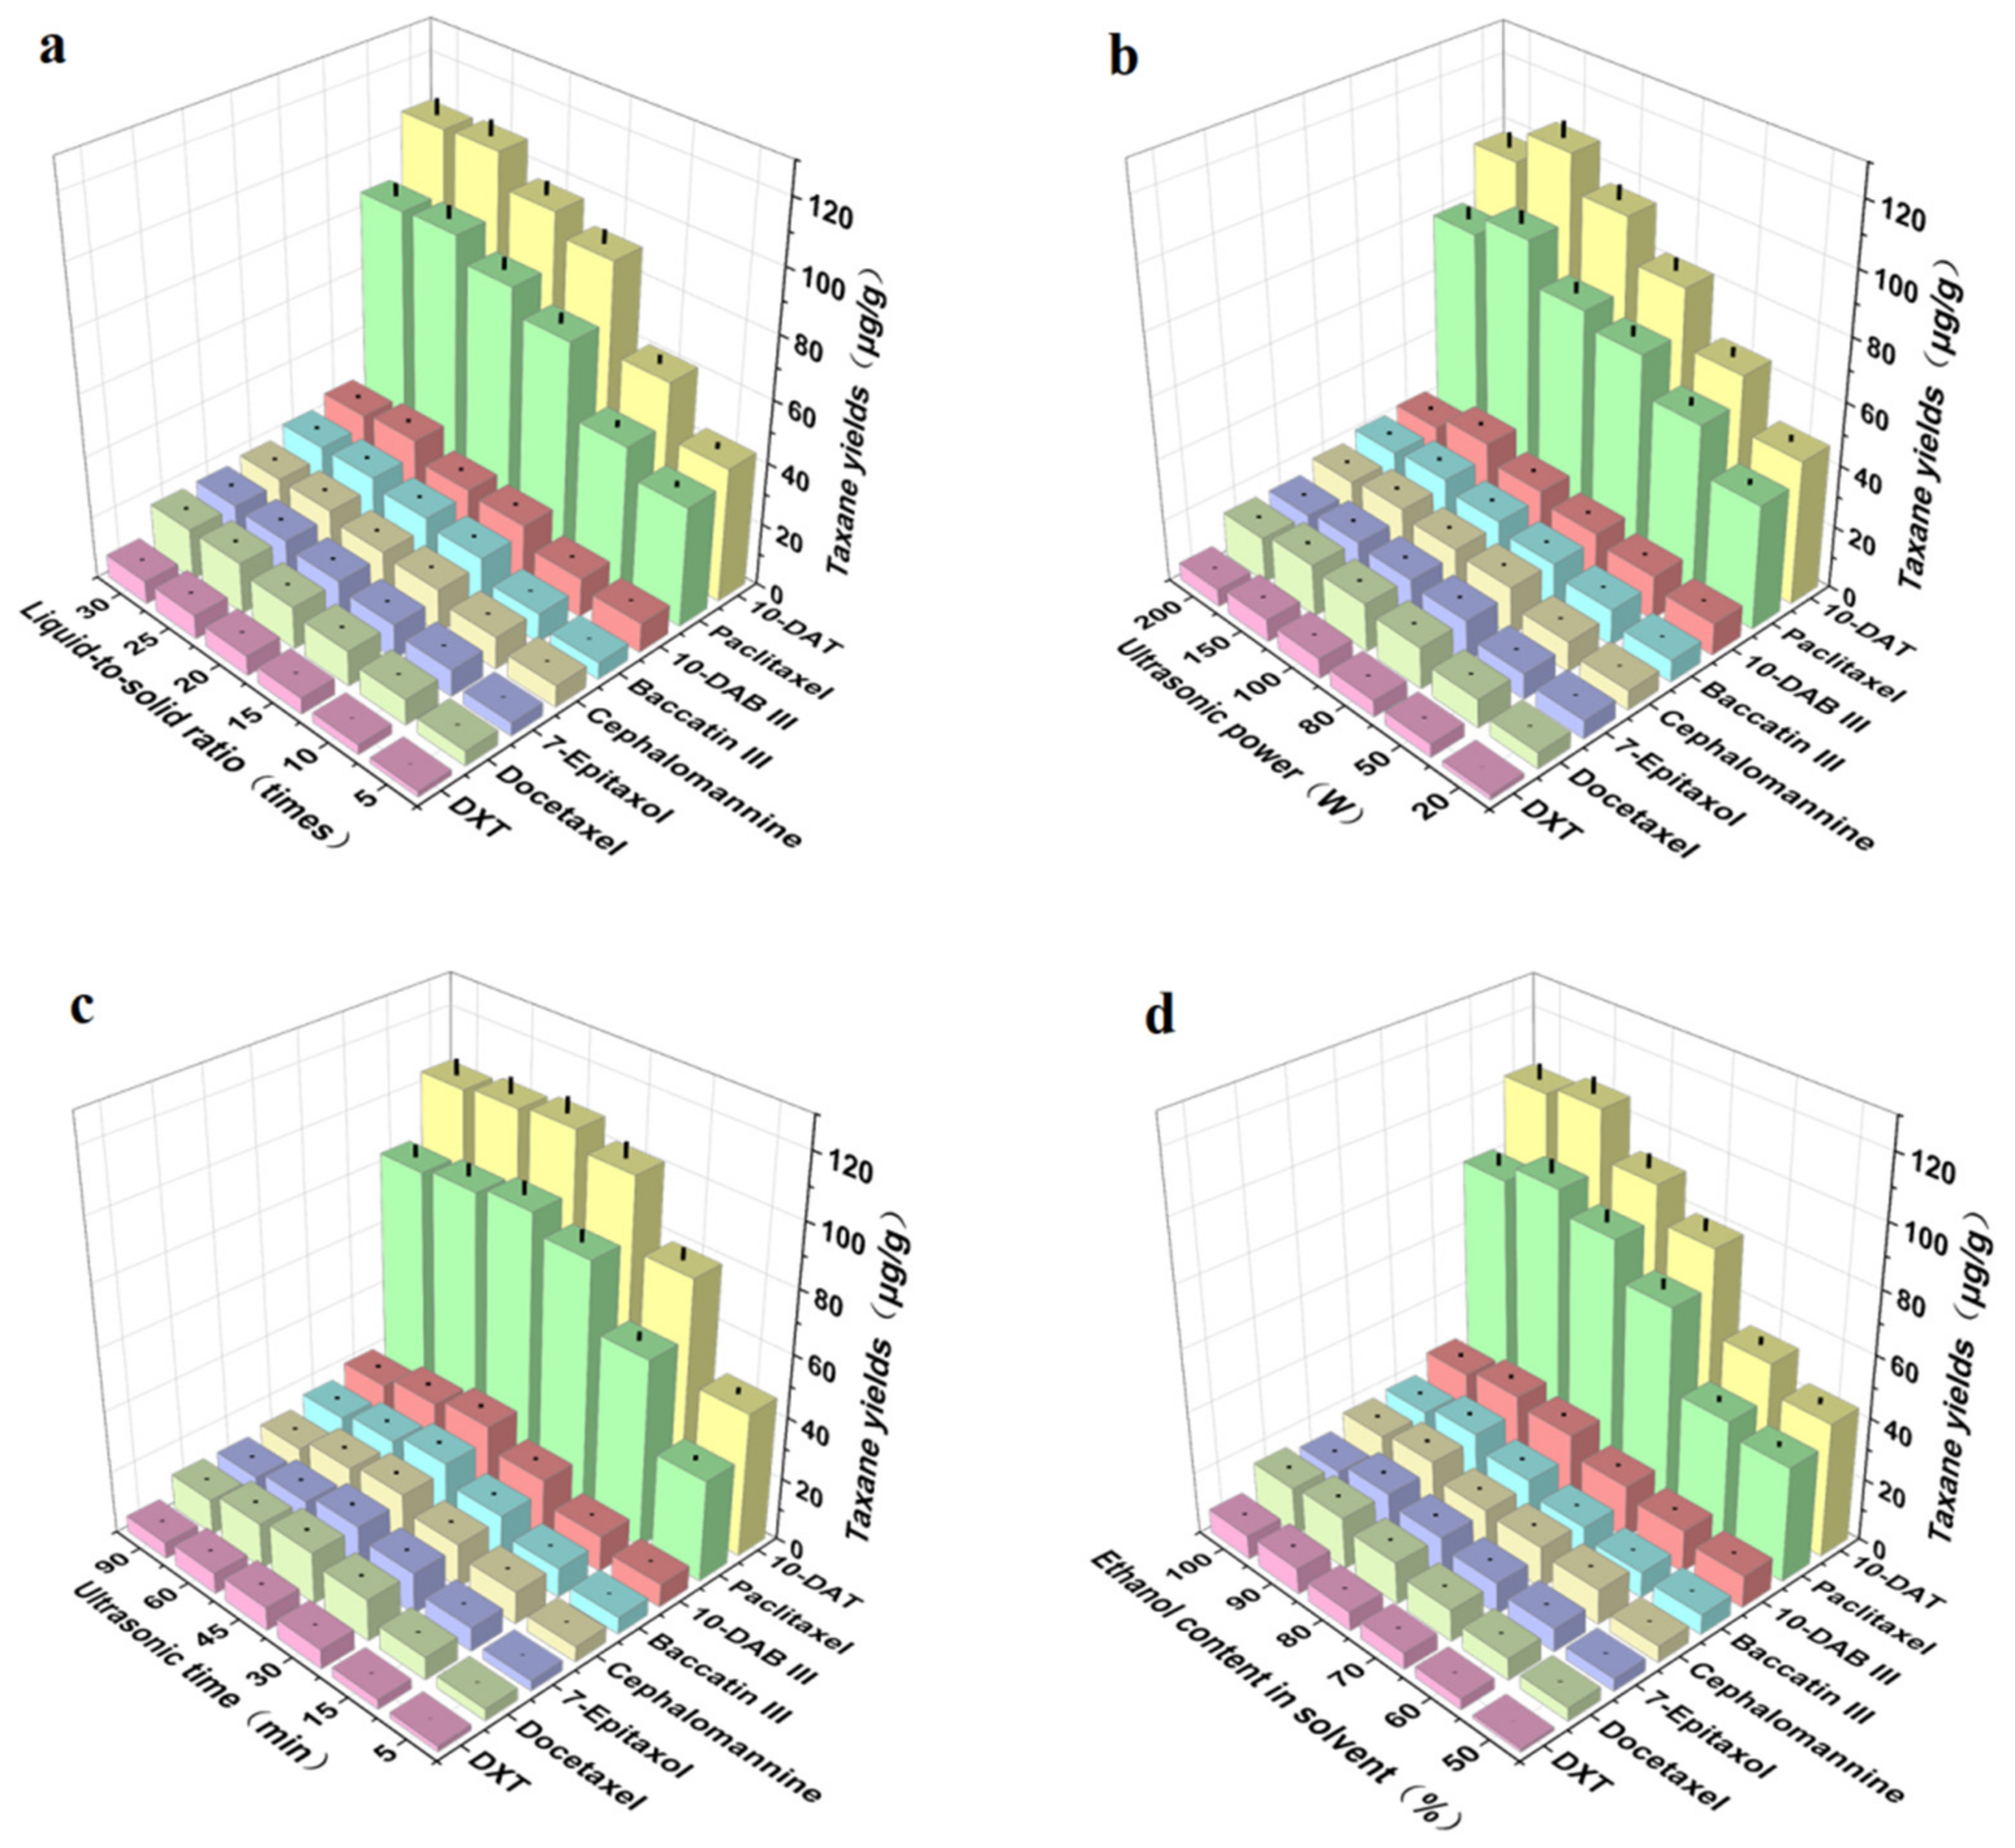
3.2. Single-Factor Experiments

3.2.1. Liquid-to-Solid Ratio

The liquid-to-solid ratio was one of the main factors affecting the taxane yields obtained by ultrasonic extraction. We evaluated the effect of the liquid-to-solid ratio on the taxane yields. As shown in Figure 4a, the taxane yields first increased and then tended to flatten with an increase in the liquid-to-solid ratio, before reaching their maximum when the liquid-to-solid ratio was 25 times. This may be because, with the increase in liquid-to-solid ratio, the contact between Taxus cuspidata and the ethanol solvent increased, which was beneficial to the dissolution of taxanes [35]. However, when the liquid-to-solid ration increased to 20 times, and then the concentration of extraction solvent increased, the taxane yields were basically stable. Therefore, in this study, the further optimization liquid-to-solid ratio range was 15–25 times. These results are consistent with other reports [36].

3.2.2. Ultrasonic Power

Ultrasonic power was one of the main factors affecting the taxane yields obtained by ultrasonic extraction technology. We evaluated the effect of ultrasonic power on taxane yields; Figure 4b shows that the taxane yields first increased and then decreased with the increase in ultrasonic power, and reached the maximum when the extraction power was 150 W. This is because the extraction included diffusion, infiltration, dissolution, and other processes. The higher the extraction power, the more complete the extraction. However, when the diffusion reached equilibrium, even if the ultrasonic power was increased, the extraction rate no longer increased, and sometimes even decreased. In addition, excessive ultrasonic power may even destroy active ingredients [37]. Therefore, the optimization range of ultrasonic power was 100 W–200 W.

3.2.3. Ultrasonic Time

Ultrasonic time was one of the main factors affecting taxane yields obtained by ultrasonic extraction technology. We evaluated the effect of ultrasonic time on the yields of taxanes; Figure 4c shows that the taxane yields first increased and then decreased with the increase in ultrasonic time. When the ultrasonic time increased from 5 min to 45 min, the taxane yields increased slowly, and reached the maximum at 45 min, due to the cavitation and oscillation of the ultrasonic wave, which was beneficial to the dissolution of intracellular substances [38]. However, when the ultrasonic time continued to increase to 90 min, the taxane yields slowly decreased, which may be due to the long time required for ultrasonic shearing, which destroyed the structure of taxanes. Therefore, in this study, the ultrasonic time was further optimized to 30–60 min.

3.2.4. Ethanol Content in Solvent

The ethanol content in solvent was one of the main factors affecting taxane yields obtained by ultrasonic extraction. We evaluated the effect of ultrasonic time on the taxane yields; Figure 4d shows that when ethanol was used as the main extraction solvent, the taxane yields first increased and then decreased with the increase in ethanol content. When the ethanol content in solvent increased from 50% to 90%, the taxane yields clearly increased, and when the content of ethanol in solvent increased from 90% to 100%, the yields gradually decreased. This may be due to the fact that in the plant tissues of Taxus cuspidata, the vacuoles contain comparatively more free taxanes, while in the cell wall, most lignin, taxanes, flavonoids, insoluble polyphenols, and organic acids are combined with protein and polysaccharides. The increase in taxane yields in ethanol solutions with appropriate concentrations was due to the strong destruction of the surface of Taxus cuspidata, making taxanes more soluble and easier to dissolve in solvent after being released from the plant matrix. An appropriate concentration of ethanol was able to enter the cells, whereas high concentrations led to protein denaturation, thus preventing the dissolution of taxanes, resulting in a reduction in extraction rate [39]. To obtain accurate process parameters, the ethanol content in solvent ranged from 60% to 100%, after further optimization by response surface methodology.

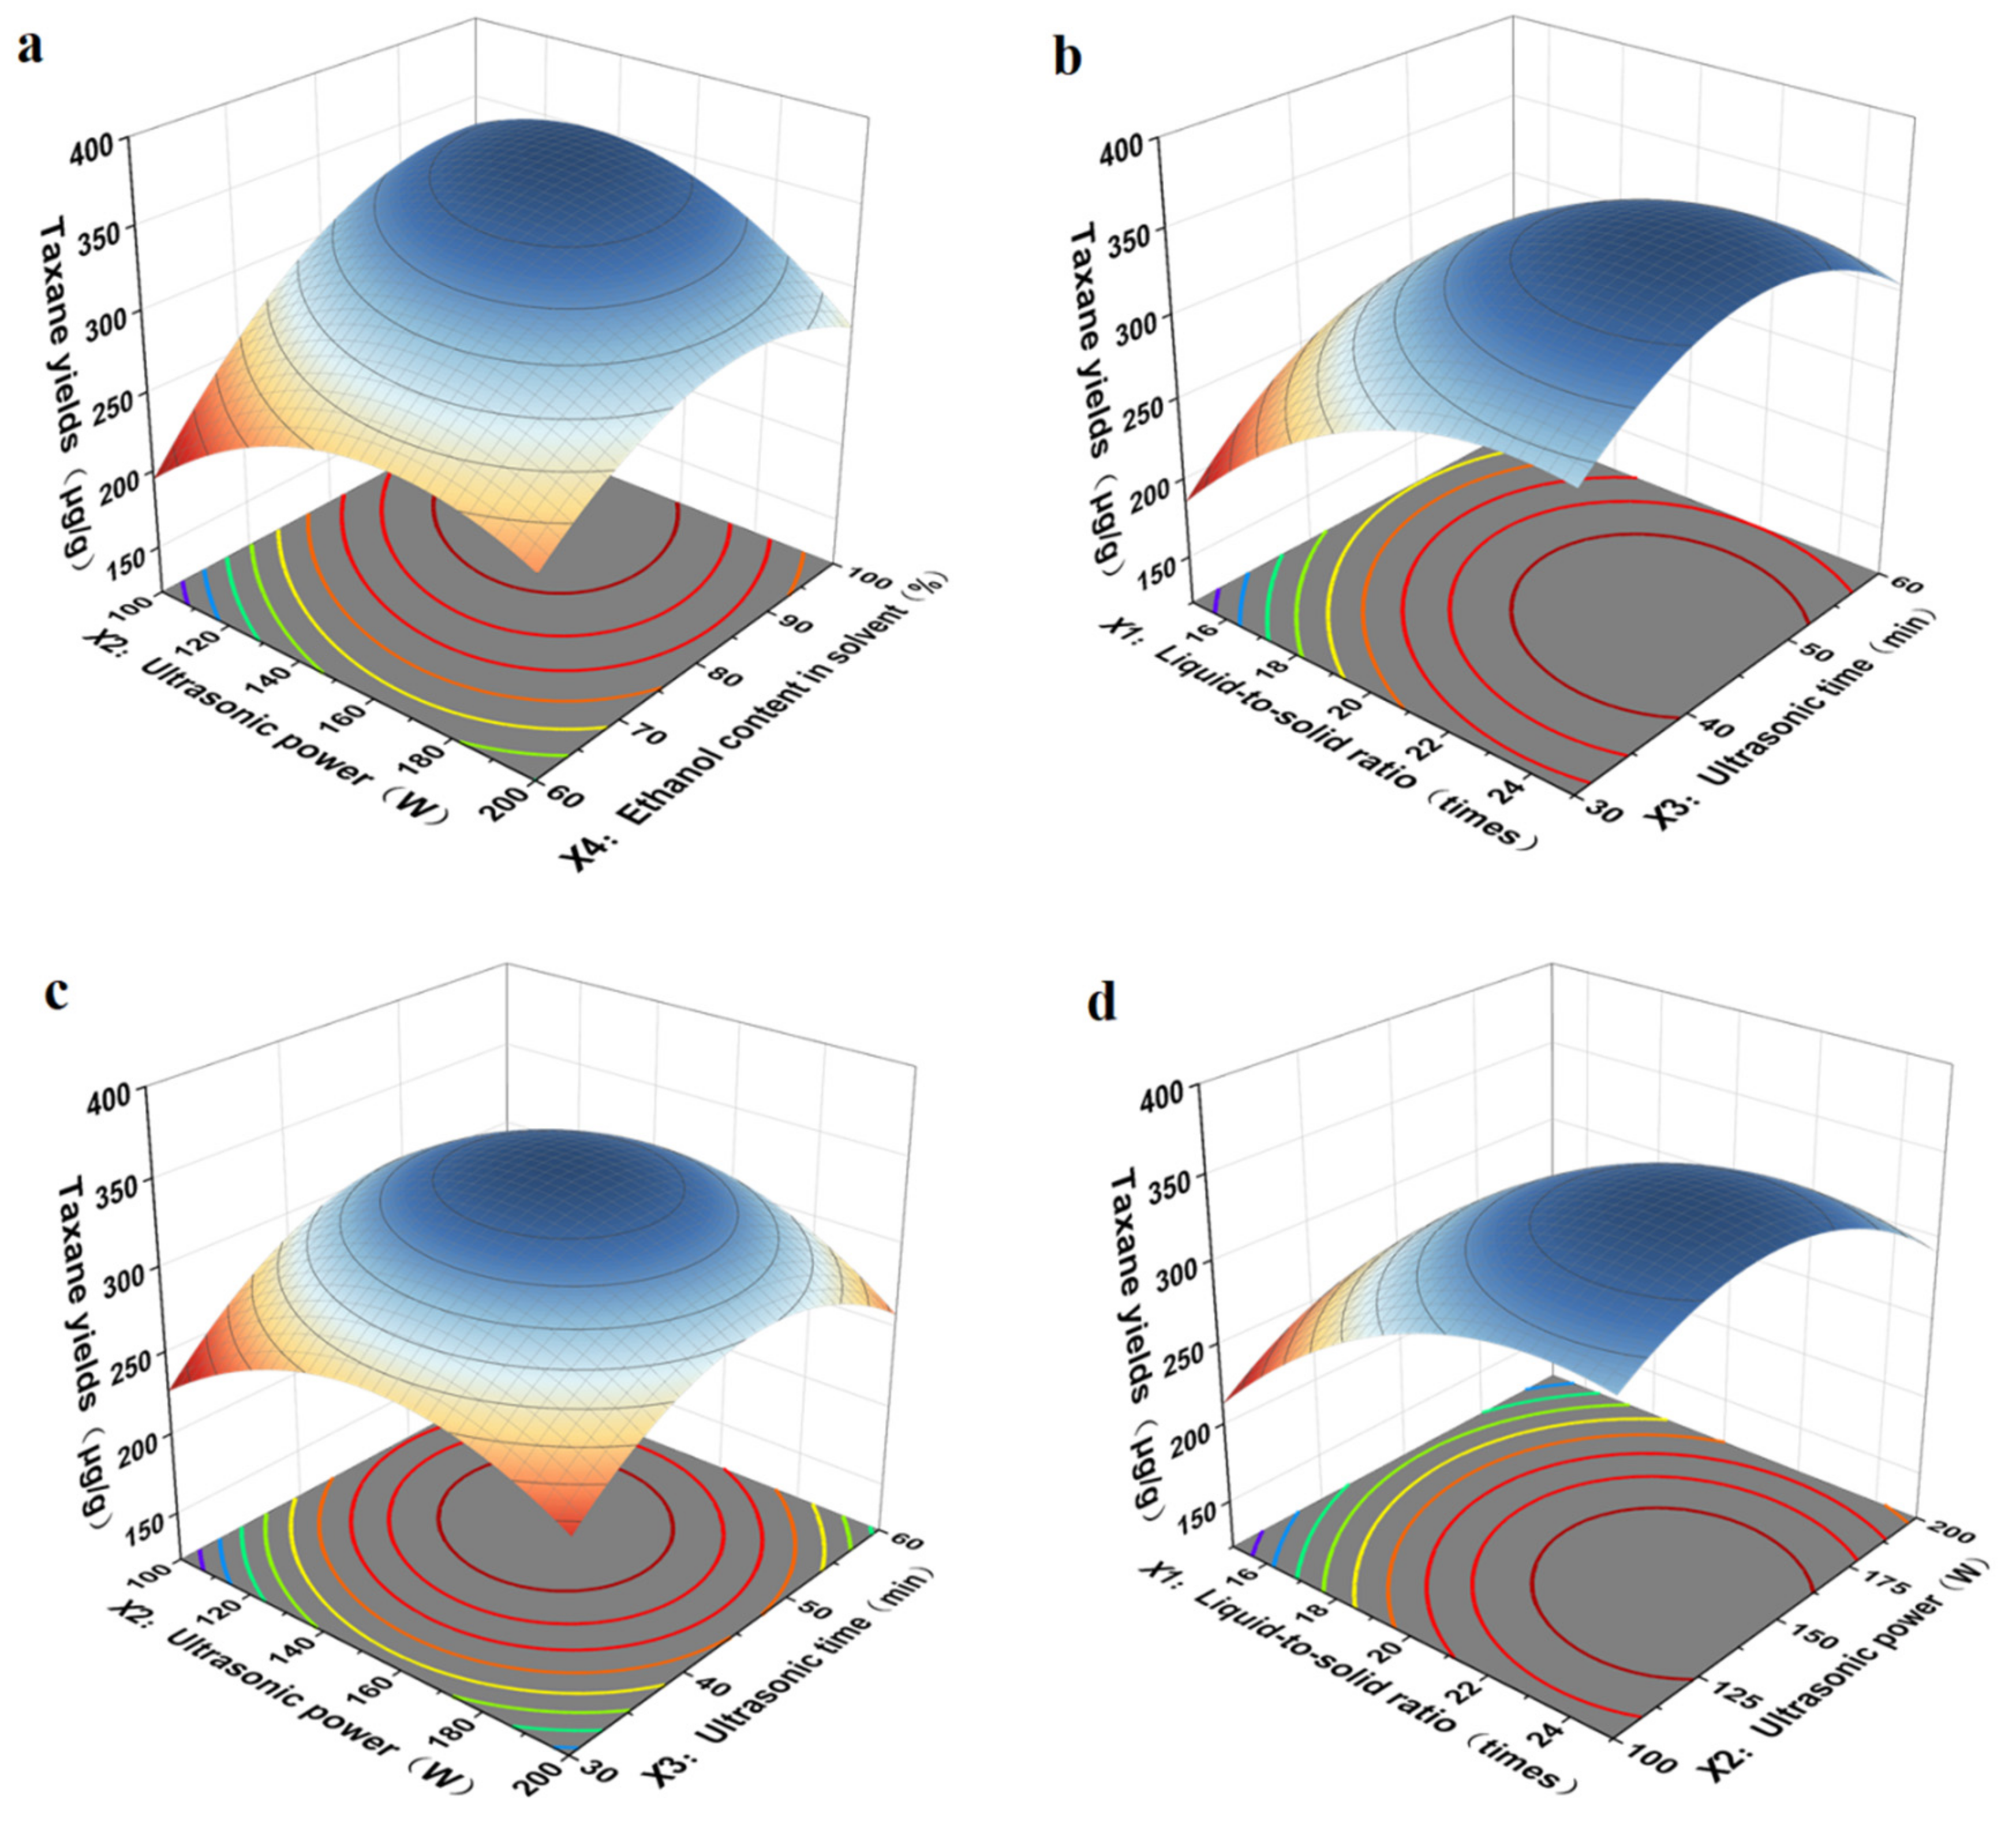
3.3. Construction of RSM Model and Conditions Optimization

The response surface data analysis software Design Expert 12 was used to analyze the test data shown in Table 3, and the quadratic polynomial regression equation of the relationship between the taxane yields (Y), liquid-to-solid ratio (X1), ultrasonic power (X2), ultrasonic time (X3), and ethanol content in solvent (X4) was obtained:
Y = 340.38 + 41.34X1 − 2.28X2 + 17.71X3 + 42.35X4 − 9.46X1X2 − 13.13X1X3 − 2.15X1X4
− 11.46X2X3 − 26.03X2X4 − 3.18X3X4 − 37.68X12 − 41.94X22 − 45.55X32 − 37.61X42
The analysis of variance is shown in Table 4. It can be seen from Table 4 that the F-value of the model = 108.61, p < 0.0001, indicating that the model is highly significant. The lack of fit term p = 0.2772 > 0.05. The lack of fit term is not significant, indicating that the regression equation does not demonstrate lack of fit, i.e., there was no significant influence factors other factors except those factors considered in this experiment, and the regression model can fit the true response value. The model-adjusted R2 = 0.9818, while the predicted R2 = 0.9541. The adjusted R2 value and predicted R2 value were high and close, indicating that the regression equation can fully explain this process. The model can be applied to analyze and predict the optimal conditions for the interactions between four single-factor conditions during ultrasonic extraction of the taxane yields in Taxus cuspidata.
The liquid-to-solid ratio, ultrasonic time, and ethanol content in solvent had extremely significant effects on the taxane yields in Taxus cuspidata, while ultrasonic power had no significant effect on the taxane yields in Taxus cuspidata. The influence of factors on the purity of taxanes had a more significant effect. The contribution rate was different, and the order from large to small was X4 > X1 > X3 > X2; the interaction between ultrasonic power and ethanol content in solvent was extremely significant, and the liquid-to-solid ratio and ultrasonic time were more significant. Ultrasonic power and ultrasonic time had more significant interaction, liquid-to-solid ratio and ultrasonic power had a significant interaction, and liquid-to-solid ratio had no significant interaction with ethanol content in solvent, ultrasonic time or ethanol content in solvent. The square term of liquid-to-solid ratio, ultrasonic power, ultrasonic time, and ethanol content in solvent was extremely significant.
As shown in Figure 5, the results showed that the interaction between ultrasonic power (X2) and ethanol content in solvent (X4) was the strongest, the interaction between liquid-to-solid ratio (X1) and ultrasonic time (X3) was more significant, that between ultrasonic power (X2) and ultrasonic time (X3) was more significant, and the interaction between liquid-to-solid ratio (X1) and ultrasonic power (X2) was the weakest. With an increase in the ultrasonic power (X2) and ethanol content in the solvent (X4), the extraction yield first increased and then reduced, in accordance with the single-factor results. Based on the multiple quadratic regression equation, we calculated the optimum experimental conditions of liquid-to-solid ratio, ultrasonic power, ultrasonic time, and ethanol content in solvent, which were as follows: the liquid-to-solid ratio was 20.88 times, ultrasonic power was 140.00 W, ultrasonic time was 47.63 min, and ethanol content in solvent was 83.50%. The taxane yields reached the maximum value of 354.28 μg/g. Under these conditions, the actual extraction rate of taxanes was 342.27 μg/g, which was very close to the predicted extraction rate of 354.28 μg/g. All the data demonstrated that the model is feasible for parameter optimization in the process of taxanes extraction.

3.4. SEM Analysis of Needles, Callus and Suspension Cells of Taxus cuspidata

Figure 6 shows the SEM images of the needles, callus, and suspension cells of Taxus cuspidata before and after ultrasonic extraction. It can be seen from Figure 6 that the pores of the needles of Taxus cuspidata that were not subject to ultrasonic extraction were densely arranged, and the structure was intact (Figure 6a). The pores in the cross-sections of the needles of Taxus cuspidata extracted ultrasonically became relatively loose, and the diameter of the pores became significantly larger (Figure 6b). Taxus cuspidata suspension cells that were not extracted by the ultrasonic method showed various shapes under the scanning electron microscope, including clustered and single cells, and cells that were round, oval, cylindrical, tubular and irregular (Figure 6c). The cell structures of Taxus cuspidata suspension cells extracted ultrasonically were damaged, and cell debris was formed (Figure 6d). Similar sized cell structures could be observed on the surface of Taxus cuspidata callus without ultrasonic extraction, where they mainly existed in the form of cell clusters, predominantly in a columnar structure, making it easier to form embryoid bodies (Figure 6e). The cell structure of Taxus cuspidata callus extracted using an ultrasonic wave was destroyed, forming scattered cell fragments (Figure 6f).

3.5. Determination of Taxane Yields in Needles, Callus and Suspension Cells of Taxus cuspidata

We calculated the taxane yields according to the regression equation of the standard curve (Table 2). Figure 7a is a comparative taxanes diagram describing the callus of Taxus cuspidata from the first generation to the ninth generation. With the increase in passage times, the taxane yields from the callus gradually increased, reaching their maximum value in the 8th passage, and then the taxane yields gradually stabilized. Figure 7b shows a comparative diagram of taxanes in the suspension cells of Taxus cuspidata from the first generation to the sixth generation. With the increase in passage times, taxanes in the suspension cells of Taxus cuspidata gradually increased. When the subculture reached the fifth generation, the taxane yields reached their maximum, and then the taxane yields gradually stabilized or stopped increasing. Therefore, the taxane yields were found to increase after several subcultures, due to the fact that multiple subcultures can increase the yields of the taxanes’ secondary metabolites, which is consistent with the research results obtained by Wang [40].
We selected the highest yield period for taxanes in callus and suspension cells, to compare with the taxane yields from needles. As Figure 7c shows, for the ultrasonic extracts of Taxus cuspidata needles, callus and suspension cells, the highest taxane yields was 660.49 ± 31.91 μg/g in suspension cells. The taxane yields from callus was 451.43 ± 18.53 μg/g. The taxane yields from the needles was only 342.27 ± 15.34 μg/g. Among the three, the yield of 10-DAT in suspension cells was the highest, reaching 194.65 ± 9.57 μg/g, which was 1.08–1.10 times that of callus and 1.70–1.71 times that of needles. The yield of paclitaxel from the suspension cell extract was 154.93 ± 7.53 μg/g, which was 1.15–1.17 times that of callus and 1.59–1.61 times that of needles. The highest yield of Baccatin III from suspension cells was 118.02 ± 5.52 μg/g, which was 2.20–2.22 times that of callus and 4.25–4.27 times that of needles. The highest yield of cephalomannine was 104.54 ± 5.11 μg/g, from suspension cells. This was 3.74–3.75 times that of callus and 4.48–4.51 times that of needles. The yields of 7-epitaxel, docetaxel, 10-DAB III and DXT from suspension cells were relatively small. The results demonstrated that the taxane yields were increased by the Taxus cuspidata cell suspension culture. Previous scholars have confirmed that the suspension cell culture of Taxus cuspidata can produce high levels of paclitaxel [41]. Our research has further improved and supplemented these results: Taxus cuspidata can produce high levels of paclitaxel, as well as other taxanes. Next, we will separate and purify taxanes from these cell extracts, to treat human tumor diseases, which will constitute very meaningful work.

4. Conclusions

A high-performance liquid chromatography (HPLC) method was established for the determination of taxanes in Taxus cuspidata, and the ultrasonic extraction process for taxanes was optimized by response surface methodology (RSM). The highest taxane yields could be obtained when the liquid-to-solid ratio was 20.88 times, the ultrasonic power was 140.00 W, the ultrasonic time was 47.63 min, and the ethanol content in solvent was 83.50%. We systematically compared the yields of eight taxanes from the needles, callus and suspension cells. The total amount of taxanes in suspension cells was 1.92–1.94 times that of the yield in needles and 1.45–1.47 times that of the yield in callus. Our data showed that ultrasonic (US) treatment can efficiently extract taxanes from Taxus cuspidata, and that the taxane yields were enhanced by suspension cell culture. This suspension cell culture method will not cause the destruction of wild Taxus cuspidata resources, and is economical and sustainable, offering benefits for environmental protection.

Author Contributions

Conceptualization, Y.Z., H.M. and W.L.; methodology, Y.Z. and Z.Z.; software, Y.Z.; validation, Y.Z., Z.Z. and H.M; formal analysis, Y.Z.; investigation, Y.Z., Z.Z., H.M. and W.L.; resources, Z.Z.; data curation, Y.Z.; writing—original draft preparation, Y.Z.; writing—review and editing, S.W.; visualization, S.W.; supervision, S.W.; funding acquisition, S.W. All authors have read and agreed to the published version of the manuscript.

Funding

This research was funded by “The 13th Five Year Plan” for Nation Science and Technology in Rural Area (No. 3G016W112418), Jilin Province Science and Technology Development Key Program (No. 20180201009NY), Changchun City Science and Technology Development Program (No. NK15SS22) and Key Laboratory of Ministry of Education (No. K201101).

Institutional Review Board Statement

Not applicable.

Informed Consent Statement

Not applicable.

Data Availability Statement

The data shown in this study are contained within the article.

Acknowledgments

The authors would like to extend their appreciation to the development plan project during “The 13th Five Year Plan” for Nation Science and Technology in Rural Area (No. 3G016W112418), Jilin Province Science and Technology Development Key Program (No. 20180201009NY), Changchun City Science and Technology Development Program (No. NK15SS22) and Key Laboratory of Ministry of Education (No. K201101).

Conflicts of Interest

The authors declare no conflict of interest.

References

  1. Long, T.; Wu, X.; Wang, Y.; Chen, J.; Zang, R. The population status and threats of Taxus cuspidata, a plant species with extremely small populations in China. Glob. Ecol. Conserv. 2021, 26, e01495. [Google Scholar] [CrossRef]
  2. Kochkin, D.V.; Globa, E.B.; Demidova, E.V.; Gaisinsky, V.V.; Galishev, B.A.; Kolotyrkina, N.G. Occurrence of 14-hydroxylated taxoids in the plant in vitro cell cultures of different yew species (Taxus spp.). Dokl. Biochem. Biophys. 2017, 476, 337–339. [Google Scholar] [CrossRef] [PubMed]
  3. Huang, Y.; Wang, J.; Li, G.; Zheng, Z.; Su, W. Antitumor and antifungal activities in endophytic fungi isolated from pharmaceutical plants Taxus mairei, Cephalataxus fortunei and Torreya grandis. Fems. Immunol. Med. Microbiol. 2001, 31, 163–167. [Google Scholar] [CrossRef] [PubMed] [Green Version]
  4. Li, X.L.; Yu, X.M.; Guo, W.L.; Li, Y.D.; Liu, X.D.; Wang, N.N.; Liu, B. Genomic diversity within Taxus cuspidata var. nana revealed by random amplified polymorphic DNA markers. Russ. J. Plant Physiol. 2006, 53, 684–688. [Google Scholar] [CrossRef]
  5. Lenka, S.K.; Nims, N.E.; Vongpaseuth, K.; Boshar, R.A.; Roberts, S.C.; Walker, E.L. Jasmonate-responsive expression of paclitaxel biosynthesis genes in Taxus cuspidata cultured cells is negatively regulated by the bHLH transcription factors TcJAMYC1, TcJAMYC2, and TcJAMYC4. Front. Plant Sci. 2015, 6, 115–128. [Google Scholar] [CrossRef] [Green Version]
  6. Kishiko, O.; Sanro, T.; Masaya, S. Electron Microscopic Observation of Plastid Containing Taxol-like Substances in Callus Cells of Taxus cuspidata var. Nana. Pak. J. Biol. Sci. 2004, 7, 1028–1034. [Google Scholar] [CrossRef]
  7. Tong, L.; Zhi, Q.Z. Characteristics of natural Japanese yew population in Muling Nature Reserve of Heilongjiang Province, China. J. For. Res. 2006, 17, 132–134. [Google Scholar] [CrossRef]
  8. Shi, Q.W.; Oritani, T.; Sugiyama, T. Three novel bicyclic taxane diterpenoids with verticillene skeleton from the needles of Chinese yew, Taxus chinensis var. mairei. Planta Med. 1999, 62, 1114–1118. [Google Scholar] [CrossRef]
  9. Yao, X.; Da, B.U.; Chen, J.W.; Xiang, L.I.; Tang, B. Tissue culture and analysis on taxane diterpenoids in callus of Taxus chinensis var. mairei. Chin. Tradit. Herb. Drugs 2014, 45, 2696–2702. [Google Scholar] [CrossRef]
  10. Fan, X.H.; Wang, L.T.; Chang, Y.H.; An, J.Y.; Fu, Y.J. Application of green and recyclable menthol-based hydrophobic deep eutectic solvents aqueous for the extraction of main taxanes from Taxus chinensis needles. J. Mol. Liq. 2020, 326, 114–122. [Google Scholar] [CrossRef]
  11. Fang, W.; Wu, Y.; Zhou, J.; Chen, W.; Fang, Q. Qualitative and quantitative determination of taxol and related compounds in Taxus cuspidata Sieb et Zucc. Phytochem. Anal. 2010, 4, 115–119. [Google Scholar] [CrossRef]
  12. Muth, M.; Ojara, F.W.; Kloft, C.; Joerger, M. Role of TDM-based dose adjustments for taxane anticancer drugs. Br. J. Clin. Pharmacol. 2021, 87, 306–316. [Google Scholar] [CrossRef]
  13. Falah, M.; Rayan, M.; Rayan, A. A Novel Paclitaxel Conjugate with Higher Efficiency and Lower Toxicity: A New Drug Candidate for Cancer Treatment. Int. J. Mol. Sci. 2019, 20, 4965. [Google Scholar] [CrossRef] [Green Version]
  14. Szenajch, J.; Szabelska, B.A.; Wiercz, A.; Zyprych, W.J.; Handschuh, L. Transcriptome Remodeling in Gradual Development of Inverse Resistance between Paclitaxel and Cisplatin in Ovarian Cancer Cells. Int. J. Mol. Sci. 2020, 21, 9218. [Google Scholar] [CrossRef]
  15. Yang, X.Y.; Li, Y.X.; Li, M.; Zhang, L.; Feng, L.X.; Zhang, N. Hyaluronic acid-coated nanostructured lipid carriers for targeting paclitaxel to cancer. Cancer Lett. 2013, 334, 338–345. [Google Scholar] [CrossRef]
  16. Levit, S.L.; Gade, N.R.; Roper, T.D.; Yang, H.; Tang, C. Self-Assembly of pH-Labile Polymer Nanoparticles for Paclitaxel Prodrug Delivery: Formulation, Characterization, and Evaluation. Int. J. Mol. Sci. 2020, 21, 9292. [Google Scholar] [CrossRef]
  17. Thalkari, A.B.; Karwa, P.N.; Zambare, K.K.; Tour, N.S.; Chopane, P.S. Paclitaxel Against Cancer: A new trademarked drug. Res. J. Pharmacogn. Phytochem. 2019, 11, 123. [Google Scholar] [CrossRef]
  18. Azerbaijan, M.H.; Bahmani, E.; Jouybari, M.H.; Hassaniazardaryani, A.; Irani, M. Electrospun gold nanorods/graphene oxide loaded-core-shell nanofibers for local delivery of paclitaxel against lung cancer during photo-chemotherapy method. Eur. J. Pharm. Sci. 2021, 164, 105914. [Google Scholar] [CrossRef]
  19. Ngo, T.V.; Scarlett, C.J.; Bowyer, M.C.; Quan, V.V. Isolation and Maximisation of Extraction of Mangiferin from the Root of Salacia chinensis L. Separations 2019, 6, 44. [Google Scholar] [CrossRef] [Green Version]
  20. Ali, S.; Albekairi, N.; Wang, X.M.; Patrikeeva, S.; Nanovskaya, T.N.; Ahmed, M.S.; Rytting, E. Determination of the Transplacental Transfer of Paclitaxel and Antipyrine by High Performance Liquid Chromatography Coupled with Photodiode Array Detector. J. Liq. Chromatogr. Relat. Technol. 2018, 41, 232–238. [Google Scholar] [CrossRef]
  21. Wang, D.; Chen, X.; Ming, Z.; Jiang, L.; Zhou, Y. Simultaneous Determination of 16 Kinds of Synthetic Cathinones in Human Urine Using a Magnetic Nanoparticle Solid-Phase Extraction Combined with Gas Chromatography–Mass Spectrometry. Separations. 2021, 9, 2297–2310. [Google Scholar] [CrossRef]
  22. Zheng, N.; Lian, B.; Du, W.; Xu, G.; Ji, J. Extraction protocol and liquid chromatography/tandem mass spectrometry method for determining micelle-entrapped paclitaxel at the cellular and subcellular levels: Application to a cellular uptake and distribution study. J. Chromatogr. B Anal. Technol. Biomed. Life Sci. 2017, 10, 347–354. [Google Scholar] [CrossRef]
  23. Tong, X.; Zhou, J.; Tan, Y. Determination of Paclitaxel in Rat Plasma by LC--MS--MS. J. Chromatogr. Sci. 2006, 44, 266–271. [Google Scholar] [CrossRef] [Green Version]
  24. Wang, C.C.; Sheu, S.R.; Yau, H.T.; Jang, M.J. Effect of coffee reduction on constituent concentration in an energy-efficient process of ultrasonic extraction. Therm. Sci. 2015, 19, 1373–1377. [Google Scholar] [CrossRef]
  25. Grigorakis, S.; Halahlah, A.; Makris, D.P. Hydroglycerolic Solvent and Ultrasonication Pretreatment: A Green Blend for High-Efficiency Extraction of Salvia fruticosa Polyphenols. Sustainability 2020, 12, 4048. [Google Scholar] [CrossRef]
  26. Zhang, R.; Grimi, N.; Marchal, L.; Lebovka, N.; Vorobiev, E. Effect of ultrasonication, high pressure homogenization and their combination on efficiency of extraction of bio-molecules from microalgae Parachlorella kessleri. Algal Res. 2019, 40, 101–114. [Google Scholar] [CrossRef]
  27. Xiao, H.F.; Chen, D.; Xu, J.; Guo, S.F. Defects identification using the improved ultrasonic measurement model and support vector machines. NDT. E Int. 2020, 111, 102223. [Google Scholar] [CrossRef]
  28. Feliu, J.X.; Cubarsi, R.; Villaverde, A. Optimized release of recombinant proteins by ultrasonication of E. coli cells. Biotechnol. Bioeng. 1998, 58, 536–540. [Google Scholar] [CrossRef]
  29. Zhang, Q.X.; Shi, J.T. Preparation of Sub-Micron Bi Alloy Powers with the Ultrasonic Mixed Crushing. Mater. Sci. Forum. 2021, 10, 217–226. [Google Scholar] [CrossRef]
  30. Boni, M.R.; Amato, E.D.; Polettini, A.; Pomi, R.; Rossi, A. Effect of ultrasonication on anaerobic degradability of solid waste digestate. Waste Manag. 2016, 48, 209–217. [Google Scholar] [CrossRef]
  31. Wang, X.J.; Zhang, W. The Establishment of Extraction Method of Taxol from Taxus brevifolia. Lett. Biotechnol. 2007, 53, 482–483. [Google Scholar] [CrossRef]
  32. Hasan, M.M.; Bashir, T.; Bae, H. Use of Ultrasonication Technology for the Increased Production of Plant Secondary Metabolites. Molecules 2017, 22, 1420. [Google Scholar] [CrossRef] [PubMed] [Green Version]
  33. Escrich, A.; Almagro, L.; Moyano, E.; Cusido, R.M.; Palazon, J. Improved biotechnological production of paclitaxel in Taxus media cell cultures by the combined action of coronatine and calix [8]arenes. Plant Physiol. Biochem. 2021, 163, 68–75. [Google Scholar] [CrossRef] [PubMed]
  34. Loganathan, D.; Yi, R.; Patel, B.; Zhang, J.; Kong, N. A sensitive HPLC-MS/MS method for the detection, resolution and quantitation of cathinone enantiomers in horse blood plasma and urine. Anal. Bioanal. Chem. 2021, 413, 1618–1632. [Google Scholar] [CrossRef]
  35. Sun, Q.; Du, B.; Wang, C.; Xu, W.; Zhang, H. Ultrasound-Assisted Ionic Liquid Solid–Liquid Extraction Coupled with Aqueous Two-Phase Extraction of Naphthoquinone Pigments in Arnebia euchroma (Royle) Johnst. Chromatographia 2019, 82, 1777–1789. [Google Scholar] [CrossRef]
  36. Cai, Z.; Han, M.; Zhang, X.; Gao, X.; Wang, F.; Pang, M. Extraction of Anthraquinone Compounds from Chinese Chestnut by Using Ultrasonic-assisted Technology. Sci. Publ. Group 2019, 7, 43–47. [Google Scholar] [CrossRef]
  37. Xi, H.; Liu, Y.; Guo, L.; Hu, R. Effect of ultrasonic power on drying process and quality properties of far-infrared radiation drying on potato slices. Food Sci. Biotechnol. 2019, 29, 93–101. [Google Scholar] [CrossRef]
  38. Usui, H.; Ishibashi, T.; Matsuo, H.; Watanabe, K.; Ando, K. Visualization of Acoustic Waves and Cavitation in Ultrasonic Water Flow. Solid State Phenom. 2021, 314, 186–191. [Google Scholar] [CrossRef]
  39. Jing, C.L.; Dong, X.F.; Tong, J.M. Optimization of Ultrasonic-Assisted Extraction of Flavonoid Compounds and Antioxidants from Alfalfa Using Response Surface Method. Molecules 2015, 20, 15550–15571. [Google Scholar] [CrossRef] [Green Version]
  40. Wang, S.; Wang, H.; Tong, L.; Li, C.; Zhong, X. The selection and stability analysis of stable and high Taxol-producing cell lines from Taxus cuspidata. J. For. Res. 2018, 29, 65–71. [Google Scholar] [CrossRef]
  41. Cheng, J.S.; Lei, C.; Wu, J.C.; Yuan, Y.J. Expression of arabinogalactan proteins involved in Taxol production by immobilized Taxus cuspidata cells. J. Biotechnol. 2008, 133, 96–102. [Google Scholar] [CrossRef]
Figure 1. Growth state diagram of (a) needles, (b) callus, and (c) suspension cells of Taxus cuspidata.
Separations 09 00193 g001
Figure 2. High-performance liquid chromatogram (HPLC) of the eight taxanes: (a) standard substance, (b) real sample of extract.
Separations 09 00193 g002
Figure 3. Chemical structures of the eight taxanes.
Separations 09 00193 g003
Figure 4. Effects of (a) liquid-to-solid ratio, (b) ultrasonic power, (c) ultrasonic time, (d) ethanol content in solvent on extraction yields of the eight main taxanes in Taxus cuspidata (p < 0.05).
Separations 09 00193 g004
Figure 5. Interaction diagrams of various factors: (a) ultrasonic power and ethanol content in solvent, (b) liquid-to-solid ratio and ultrasonic time, (c) ultrasonic power and ultrasonic time, (d) liquid-to-solid ratio and ultrasonic power.
Separations 09 00193 g005
Figure 6. SEM images of Taxus cuspidata needles, callus and suspension cells: (a) Taxus cuspidata needles, (b) the needles of Taxus cuspidata after ultrasonic extraction, (c) suspending cells, (d) suspension cells after ultrasonic extraction, (e) callus, (f) callus after ultrasonic extraction.
Separations 09 00193 g006
Figure 7. Comparison of taxane yields in the needles, callus, and suspension cell extracts of Taxus cuspidata: (a) the effect of different subculture cycles of callus on taxane yields, (b) the effect of different subculture cycles of suspension cells on taxane yields, (c) comparative graph of taxane yields in needles, callus, and suspension cells (p < 0.05).
Separations 09 00193 g007
Table 1. B5 solid medium composition.
Medium CompositionDosage (mg/L)Medium CompositionDosage (mg/L)
Vitamin B120NaH2PO4·H2O150
Vitamin B63(NH4)2SO4134
Inositol200MgSO4·7H2O500
Niacin2ZnSO4·7H2O2
Glycine2MnSO4·H2O10
Hydrolyzed milk protein500FeSO4·7H2O27.8
Agar7000Na2EDTA37.3
Sucrose20,000H3PO33
α-Naphthalene Acetic Acid2KI0.75
KNO33000CuSO4·5H2O0.025
CaCl2·2H2O150CoCl2·6H2O0.025
Na2MoO4·2H2O0.25
Table 2. Regression equation, linear range, structural formula, and molecular weight of measured compounds.
OrderCompoundsRegression EquationR2Linear Range (μg/mL)Molecular FormulaMolecular Weight
110-DAB IIIY = 0.1805X − 0.10850.99991.25–125C29H36O10544.590
2Baccatin IIIY = 0.1607X − 0.09910.99981.25–125C31H38O11586.627
3DXTY = 0.1218X − 0.07930.99991.25–125C50H57NO17943.984
410-DATY = 0.2195X − 0.14410.99991.25–125C45H49NO13811.870
5DocetaxelY = 0.124X + 0.04860.99991.25–125C43H53NO14807.879
6CephalomannineY = 0.2259X − 0.12660.99991.25–125C45H53NO14831.901
7PaclitaxelY = 0.27X − 0.16520.99991.25–125C47H51NO14853.906
87-EpitaxolY = 0.2141X − 0.10530.99991.25–125C47H51NO14853.906
Table 3. Experimental design and results of Box–Behnken design (BBD).
RunX1X2X3X4Taxane Yields (μg/g)
120.00150.0045.0080.00343.537
220.00100.0045.0060.00193.494
320.00200.0060.0080.00249.139
425.00150.0045.00100.00349.785
520.00150.0030.00100.00284.831
620.00200.0045.00100.00269.831
725.00150.0060.0080.00303.128
820.00150.0060.0060.00239.811
915.00150.0045.0060.00178.533
1020.00150.0045.0080.00339.437
1120.00150.0060.00100.00314.728
1220.00150.0045.0080.00346.372
1315.00200.0045.0080.00235.761
1420.00100.0045.00100.00327.823
1520.00200.0030.0080.00241.681
1615.00150.0045.00100.00273.363
1720.00100.0060.0080.00289.482
1815.00150.0030.0080.00178.617
1920.00150.0045.0080.00340.933
2020.00150.0030.0060.00197.179
2125.00200.0045.0080.00299.256
2220.00150.0045.0080.00331.621
2315.00100.0045.0080.00207.189
2415.00150.0060.0080.00244.472
2520.00200.0045.0060.00239.605
2625.00100.0045.0080.00308.517
2725.00150.0030.0080.00289.781
2820.00100.0030.0080.00236.182
2925.00150.0045.0060.00263.575
Table 4. ANOVA of regression model.
Source of VariationSum of SquaresDegree of FreedomMean SquareF-Valuep-ValueSignificance
Model77,956.23145568.30108.61<0.0001***
X120,510.18120,510.18400.06<0.0001***
X262.63162.631.220.2877
X33762.6313762.6373.39<0.0001***
X421,519.22121,519.22419.74<0.0001***
X1X2357.831357.836.980.0193*
X1X3689.271689.2713.440.0025**
X1X418.58118.580.360.5568
X2X3525.371525.3710.250.0064**
X2X42709.3612709.3652.85<0.0001***
X3X440.55140.550.790.3889
X129210.8719210.87179.66<0.0001***
X2211,406.84111,406.84222.49<0.0001***
X3213,458.92113,458.92262.52<0.0001***
X429175.4019175.40178.97<0.0001***
Residual717.751451.27
Lack of fit593.971059.401.920.2772
Pure error123.79430.95
Total78,673.9828
Note: p ≤ 0.0001 is extremely significant, as indicated by ***; p ≤ 0.01 is more significant, indicated by **; p ≤ 0.05 is significant, as indicated by *.
Publisher’s Note: MDPI stays neutral with regard to jurisdictional claims in published maps and institutional affiliations.

