Article

Analyses of a Lake Dust Source in the Middle East through Models Performance

by
Nasim Hossein Hamzeh
1,
Abbas Ranjbar Saadat Abadi
2,
Maggie Chel Gee Ooi
3,
Maral Habibi
4,* and
Wolfgang Schöner
4
1
Department of Desert and Arid Zones Management, Ferdowsi University of Mashhad, Mashhad 91779-48974, Iran
2
Department of Meteorology, Atmospheric Science & Meteorological Research Center (ASMERC), Tehran 14118-13389, Iran
3
Institute of Climate Change, University Kembangan Malaysia, Bangi 43600, Malaysia
4
Department of Geography and Regional Science, University of Graz, 8010 Graz, Austria
*
Author to whom correspondence should be addressed.
Remote Sens. 2022, 14(9), 2145; https://doi.org/10.3390/rs14092145
Submission received: 9 March 2022 / Revised: 10 April 2022 / Accepted: 26 April 2022 / Published: 29 April 2022

Abstract

:
Drying lakes have become a new source of dust, causing severe problems in surrounding areas. From 2000 to 2017, a statistical study was conducted on Lake Urmia in Iran in the Middle East. The results indicated a significant increase in the annual number of dusty days in stations around the lake and the mean annual aerosol optical depth (AOD) at 550 nm. The sharp decrease in annual snowfall rate over the Lake Urmia area since 2007 has been linked to the lake’s decreasing water level and drying. During a dust storm event from 27 October to 31 October 2017, a local dust storm originated from Lake Urmia before another large-scale dust storm originated from the An-Nafud desert. According to MODIS true-color images, dust particles were lifted from Lake Urmia and transported eastward to the Caspian Sea and the HYSPLIT model. The comparison of the four models under the Sand and Dust Storm Warning Advisory and Assessment System (SDS-WAS) revealed that the models overestimated surface dust concentrations compared to ground-based PM10 measurements. Nevertheless, the NOAA/WRF-Chem and DREAMABOL models simulated higher dust concentrations during the dust period. More emphasis should be placed on the development of dust models for SDS-WAS models in Lake Urmia.

1. Introduction

Similar to floods, earthquakes, volcanoes, and droughts, dust storms are natural disasters that affect the lives of millions of people worldwide each year [1]. Dust storms harm human health and the respiratory system [2], infrastructure [3], road and air transportation [4], agricultural productivity [5], and so forth. The Sahara Desert in Africa is the world’s most significant dust source region, with a large amount of dust particles entering the earth’s atmosphere every year [6,7]. The Sahara Desert is the world’s largest desert, covering the territory of ten North African countries, equivalent to an area of 9 million km3 [8]. According to Kok et al. [9], North African source regions emitted roughly half of global dust emissions. The Middle Eastern and Central Asian source regions rank second, accounting for ~30% of global dust loading. As a result, the Middle East region emerges as one of the most critical dust emission regions, with numerous dust sources.
Dust sources include deserts, playa, agricultural lands, rangelands, dry lakes, rivers and floodplains, stony deserts, dunes, paleolakes, paleorivers, floodplains, inland deltas, and oases [10]. The desert is the primary source of dust particles entering the earth’s atmosphere [9], and dried lakes are another significant dust source worldwide. Climate change has recently caused many lakes to dry up and new dust sources to emerge, such as the Aral Sea [11,12,13,14] and Lake Urmia [15,16,17]. Lake Urmia is the largest hypersaline lake in the Middle East and Iran and one of the largest in the world. However, the water level and size have decreased dramatically over the last few decades [17,18,19], due to decreased precipitation, rising mean air temperature, and agricultural water use [20]. From 2009 to 2010, dust particles originating from the lake increased from 30% to 60% in all surrounding cities [21].
One method for studying dust generation, transportation, and dispersion is to use a numerical prediction model. Many dust models were developed to investigate dust formation and propagation in different parts of the world, and before 1990, dust storm generation, transportation, and dispersion were mostly investigated dynamically and synoptically [22,23,24]. However, after the 1990s, surface dust concentration simulation was introduced through the works of [25,26]. In the last 20 years, there has been marked development in dust properties simulations [27,28,29]. Furthermore, in many studies, the performance of the dust modeling was investigated in dust storm generation [30,31,32]. Additionally, dust propagation and transportation were investigated in different parts of the world in some studies [33,34,35,36]. Furthermore, dust models can be categorized as global models [27,37,38] and regional dust models [39,40,41].
The massive number of particles in the atmosphere [42] and the interactions of dust particles with different meteorological parameters has highlighted the need to establish new organizations for dust modeling, especially over the dust belt area. For this purpose, in 2004, the World Meteorological Organization (WMO) launched the Sand and Dust Storm Warning Advisory and Assessment System (SDS-WAS) prediction models to monitor dust storms in three regional centers in Northern Africa, the Middle East, and Europe [43]. The center frequently uses nine global dust models and 14 regional dust models.
This study investigates the emerging dust storms over Lake Urmia by conducting a statistical analysis of meteorological stations located around the lake over 18 years (2000–2017). Near Lake Urmia, two major dust storm events have been identified, including existing dust sources and emerging dust sources. The ability of four SDS-WAS dust prediction models to simulate these dust storm events will be then evaluated by comparing surface dust concentrations measured at three air quality monitoring stations.

2. Materials and Methods

This study analyzed the satellite data and images, Lake Urmia stations’ data, and the outputs of some models.

2.1. Study Area

The main research area, the Lake Urmia basin, is located in Northwest Iran at a latitude of 37° to 38.5°N and a longitude of 45° to 46°E (Figure 1). The lake is the Middle East’s largest saline lake and one of the largest ones in the world. It is not only the most prominent Iranian lake, but it is also one of Iran’s most important and valuable ecosystems [44]. It is situated between the West Azerbaijan (46%) and East Azarbaijan (44%) provinces of Iran. The lake’s surface has shrunk dramatically in recent decades due to the construction of more than fifty dams [45,46] and favorable conditions for dust and sandstorm formation lifting [17].
The six stations of Lake Urmia are located in Urmia, Bonab, Salmas, Tabriz, Bokan, and Sardasht. The annual number of dusty days (days with at least one reported weather code related to dust) is calculated using meteorological stations in Urmia, Bonab, and the Sal-mas stations surrounding Lake Urmia. All six weather stations provide the 2-m wind profile in this study, while Urmia, Bokan, and Sardasht provide the daily surface PM10 measurements for model comparison. These national weather stations report the 2 m wind speed and direction, weather code, visibility, and relative humidity (without gap) every three hours. Another type of station is an air monitoring station that measures PM10, NO2, O3, CO2, and PM2.5 pollution hourly (local time).
Table 1 displays the longitude, latitude, elevation, and annual mean the number of dusty days in the six weather stations used in this study (2000–2017). The frequency of dust was higher at the Tabriz station, which is located to the northeast of Lake Urmia.

2.2. In-Situ Data

In this study, three-hour recordings of the synoptic codes (06, 07, and 30–35) related to dust events were used at some meteorological stations around Lake Urmia over 18 years (2000–2017). In addition, at least one daily observation should include a dust code to represent a dust day.
Table 2 shows the definitions for the corresponding dust codes 06, 07, and 30–35, which were derived from meteorological reports.
Because dust codes 08, 09, and 98 are uncommon in this area, they are not used in this study.
Furthermore, PM10 concentrations (in µg m−3) in dust storm events were obtained at the air pollution monitoring stations in Northwest Iran, Urmia, Bukan, and Sardasht. The data were extracted from Iran’s Department of Environment’s air pollution monitoring network. The PM10 concentrations were used to compare the qualitative predictions to the four model predictions. In this study, the first statistical investigation is conducted in Lake Urmia from 2000 to 2017. Then a severe dust storm is investigated in the Lake Urmia area, consisting of local and large-scale dust storms.

2.3. Satellite Products

Several datasets were used in this study. The MODIS Aqua true color and Terra mean NDVI images were used to investigate the changes in land cover and minimal changes in vegetation cover [47] for the region over 18 years by comparing conditions in 2000 and 2017 for the identification and investigation of the emerging dust source. It was also used to retrieve variations in the Lake Urmia area with high spatial and temporal resolution [48]. In addition, the dust storm was represented by a case study from 27–30 October 2017, as identified by the MODIS true color image. The columnar aerosol thickness was measured using a Level 3 MODIS Terra aerosol product, AOD550, with a spatial resolution of 1° × 1°, derived from the collection of C6.1 over the northern half of Iran. The MODIS Merged DT/DB Aerosol Optical Depth (Land and Ocean) layer from the Terra (MOD04_L2) satellite for daytime overpasses with a spatial resolution of 10 km and a temporal resolution is used daily for the focused case study of Lake Urmia. At the nadir, the Level 2 (MOD 04) data have a spatial resolution of a 10 × 10 km pixel array. The NDVI, snowfall rate, and AOD data were downloaded from the Giovanni visualization tool [49].

2.4. Models

In this study, a matrix of trajectory points over Lake Urmia was employed to compute the two-day forward air mass trajectories from the Hybrid Single-Particle Lagrangian Integrated Trajectory (HYSPLIT) model. The model was run by GDAS data with a 0.5° horizontal resolution for 48 h. Furthermore, the FLDAS model’s monthly snowfall rate, with a 0.1-degree resolution, was used to confirm the snowfall rate change in Lake Urmia over 18 years. Habibi et al. also reported that the snow drought events have become more pronounced in the basin as temperatures have risen [50]. The FLDAS Global model [51] is a NASA-developed model adapted to work with data streams, domains, and monitoring and forecast requirements associated with food security assessment in developing country settings. The model simulated snow over Central Asia, and these data are provided to USGS EROS.
In the study area, the performance of the four models in simulating dust storm characteristics during one case study is also investigated. The case study was a combination of a local dust storm on 27 October 2017, followed by a large-scale dust storm in this area that originated in Saudi Arabia’s An-Nafud desert. As a result, the model outputs and investigations into synoptic patterns are linked to two types of dust storms over Lake Urmia. Four models were used for this purpose: DREAM-NMME-MACC, DREAMABOL, NCEP-NGAC, and NOAA/WRF-Chem. The model simulations were obtained from the WMO SDS-WAS website [52]. This system aims to improve forecasts for sand and dust storms. Since 2012, fourteen regional models have been used to estimate the region’s surface dust concentration and aerosol optical depth [53]. The applicability of the models’ outputs, which were used by various regional weather prediction centers in various regions of the Middle East and North Africa, was investigated [54,55,56,57]. However, it is not clearly known whether these SDS-WAS models have kept up with new and emerging local dust emission sources. Therefore, there is a need for further studies to assess their ability to forecast new local dust storms.
Four models from the SDS-WAS system were evaluated in this study, as shown in Table 2: DREAMABOL, DREAM8-NMME-MACC, NOAA/WRF-Chem, and NCEP-NGAC. These models were chosen from 14 operational models, because their outputs covered a more comprehensive range of latitudes. The DREAMABOL model is an online regional dust model developed by the Institute of Atmospheric Sciences and Climate, in Bologna, Italy [58,59]. The meteorological component is based on the BOLAM equation hydrostatic model [60], whereas the dust model is based on DREAM [61]. Since June 2014, DREAMABOL has provided near-real-time and historical data to the SDS-WAS. The initial meteorological data used were GFS data with a resolution of 0.5° and model-generated output data with a resolution of 0.4° in the rotated pole Lon-Lat grid. The Global Forecast System (GFS) is given from the National Centers for Environmental Prediction (NCEP) weather forecast model. The model generates data from atmospheric and land/soil variables, such as temperature, wind, soil moisture, and atmospheric ozone concentration. The system couples four sorts of models (atmosphere, land/soil, ocean, and sea ice) that work together to accurately depict weather conditions.
The model’s dust emission scheme is dust uplift derived from [62]. The Southeast European Virtual Climate Change Center in Serbia developed DREAM8-NMME-MACC. The DREAM8 weather model was designed based on the NCEP Non-Hydrostatic Mesoscale Model [63], and its initial and boundary conditions were derived from ECMWF data. Ginoux et al. [64] defined the dust sources in the initial dust field using DREAM8 assimilates ECMWF dust analysis [44]. The SEEVCCC website contains daily dust forecasts generated by the DREAM8-NMME-MACC model. The dust particle size distributions were divided into eight size bins with radii ranging from 0.1 to 10 µm by the Dream model. A constant distribution is also considered in the model for silt particles (1 µm < r < 10 µm),
The NOAA National Centers for Environmental Prediction (NCEP), in collaboration with the NASA Goddard Space Flight Center (GSFC), used Global Forecast System (GFS) Aerosol Component (NGAC) for global dust forecasting. NGAC has been providing 5-day dust forecasts with a 1° by 1° resolution since 2012, based on the global domain simulation and initial meteorological data from NCEP GDAS. The dust emission scheme used in the model is the dust uplift derived from [33]. The seven size ranges in the model are as follows: 0.1 to 0.18 µm, 0.18 to 0.3 µm, 0.3 to 0.6 µm, 0.6 to1 µm, 1 to 1.8 µm, 1.8 to 3 µm, and 3 to 6 µm. Furthermore, the corresponding effective radii are 0.15, 0.25, 0.4, 0.8, 1.5, 2.5, and 4 µm, respectively [64].
Moreover, NOAA/WRF-Chem is a non-hydrostatic model that runs once per day at the National Observatory of Athens. Its domain covered a large portion of the Sahara (the primary source of mineral dust), the Mediterranean, and Europe, with a horizontal resolution of about 20 km. The GFS global model is used to calculate the initial and boundary conditions. It has a domain simulation range of 2°N to 70°N and 28°W to 66°E. The initial meteorological data is GFS data with a resolution of 0.5 degrees, and the resolution of the output data is also 0.19 by 0.22 degrees. The GOCART scheme derived from [33] is used in the model’s dust emission scheme. The dust scheme considers five dust size bins: 0–1 µm, 1–1.8 µm, 1.8–3 µm, 3–6 µm, and 6–10 µm. Table 3 shows the specifications of selected numerical prediction models.

3. Results

3.1. Emerging Dust Source Investigation

Figure 2 shows Lake Urmia in December 2000 and 18 years later in December 2017. The water body shrank dramatically, resembling a dried lake [69]. The lake became an active dust source due to the changing conditions [17]. These are mean monthly true-color images of the research area. Therefore, one month was chosen to compare of conditions in Lake Urmia over 18 years.
Figure 3 shows the annual number of dusty days and wind rose (wind speed and direction from thrice-hourly wind data with a mean of 2 m) in the Urmia (west of the lake), Bonab (southeast of the lake), and Salmas (northwest of the lake) weather stations from 2000 to 2017. Between 2001 and 2007, the number of dusty days was low. The number of annual dusty days increased in the Urmia station beginning in 2008, peaking in 2012 with 41 dusty days, followed by 2010 and 2009 with 37 and 33 days, respectively. Then it fell again from 2013 to 2017. The station’s predominant wind directions were westerly, northerly, and southwesterly. This is consistent with the findings of the authors of [70], who showed that the wind rose in Urmia station over 30 years, with the wind direction primarily southwesterly and northeasterly. There was no wind blowing from Lake Urmia to the Urmia station. The number of annual dusty days at the Bonab weather station increased beginning in 2008, peaking in 2012 with 41 dusty days. Following that, in second and third grades, 2009 had 39 dusty days, and 2011 had 31 days. Similarly, to Urmia station, after a period of low dust days from 2001 to 2007, the number of dusty days increased sharply from 2008 to 2013, then decreased from 2013 to 2017.
In contrast to the Urmia station, the wind primarily blows from Lake Urmia to the Tabriz station, with the prevailing wind being easterly and northeasterly. Another study [71] found that the wind rose in Bonab station (northeast of the lake) was eastly and northeasterly from 2012 to 2013. The data relating to the Salmas weather station from 2000 to 2017 show that the number of dusty days reached a peak in 2012, 2003, and 2009, with 41, 17, and 13 dusty days, respectively. The station’s prevailing winds were westerly, southwesterly, and north-westerly, and it was rarely affected by Lake Urmia’s saline dust storms, so the annual number of dusty days was much lower than that of the Urmia and Bonab stations.
Figure 4 shows the dominant wind direction on dusty days at four weather stations around Lake Urmia from 2000 to 2017. The wind direction was primarily northerly and southerly in the Urmia and Salmas weather stations on the western side of the lake, but southwesterly in the Tabriz and Bonab stations on the eastern side. Furthermore, the mean wind speed on dusty days over 18 years was 6.2 m/s in the Salmas station, which was higher than the other three stations. The mean wind speed in Tabriz, Urmia, and Bonab weather stations were 5.6 m/s, 4.9 m/s, and 3.4 m/s, respectively.
Salmas is located in the west of the Azerbaijani plateau, which is formed by the triangle of the Mesopotamian plain, the Caspian Sea, and the North Caucasus Mountains. The Azerbaijan mountain range, a long and high wall similar to the natural border of Turkey, prevents rain from penetrating this area and provides abundant precipitation sources in the form of snow. The Salmas plain is sandwiched between three mountains. In addition, Tabriz is a mountainous city sandwiched between two mountains, so wind speed is higher in the two stations in these two areas.
Figure 5a shows the mean AOD 550 of MODIS/Terra from 2000 to 2017. The mean AOD over Lake Urmia (highlighted by the red box) was greater than 0.4, indicating that dust was causing significant aerosol loading over the lake.
Figure 5b shows the annual average MODIS/Terra NDVI from 2000 to 2017. Vegetation cover is an important factor that is inversely correlated with dust rising [72,73,74]. Because of the salinity of the soil in this area, the mean NDVI over Lake Urmia is close to zero, and the NDVI index is high on the Caspian Sea’s southern coasts. According to Alizade Govarchin Ghale et al. [20], salt and salty soil areas near Lake Urmia increased dramatically between 1995 and 2014. Furthermore, their investigation revealed that irrigated lands increased twice as much as in the previous 20 years (study period) around the lake.
Figure 5c presents the annual average MODIS/Terra NDVI and AOD between longitudes 46° E and 48° E and latitudes 36° N to 38° N from 2000 to 2017. One of the causes of rising dust is the reduction in vegetation cover in the dust source area. This graph shows that when NDVI increased in Lake Urmia, AOD decreased that year. In 2010, for example, NDVI increased dramatically, while aerosol optical depth decreased over Lake Urmia. The correlation coefficient between the two indexes was 0.54 over 18 years, indicating a close relationship. Mardi et al. [75] investigated AOD over Lake Urmia from 2001 to 2015. According to their findings, mean AOD increased from 2009 to 2015 compared to 2001 to 2009. In addition, Delfi et al. [76] studied AOD over Lake Urmia from 2001 to 2016. Similarly to Mardi et al. [75], they concluded that AOD was higher from 2009 to 2016 than in previous years, and dust particles were raised from the deserts of Iraq and Syria in the weather stations around Lake Urmia. Moghim and Ramezanpoor [77] investigated the classification of aerosol over Lake Urmia and discovered that there are primarily two types of aerosols over the lake: desert dust and marine aerosol. According to other studies, dust storms have increased rapidly since 2010, and the amount of dust in the atmosphere has increased over the last decade [78,79,80].
Figure 6 shows the MODIS/Terra mean AOD 550 and snowfall rate of the FLDAS model time series from 2000 to 2017 between the longitudes of 46°E and 48°E and the latitudes of 36°N to 38°N. The mean annual AOD increased dramatically over the study period, whereas the snowfall rate decreased from 2000 to 2017. The maximum snowfall rate was observed in 2003 and 2002, and the minimum happened in 2010 and 2014. Boueshagh and Hasanlou [81] reported that the snowfall rate decreased from 2000 to 2006 in Lake Urmia, and, consequently, the lake’s water level decreased in this period. Since snowfall is an important indicator of the water volume in Lake Urmia, the decrease in snowfall rate caused more drought, which increased saline dust emission and resulted in the further drying of Lake Urmia [15]. As a result, AOD has increased significantly since 2008, reaching a peak of 0.56 in 2017. This diagram is consistent with the findings of [75], who found that AOD in Lake Urmia gradually increased from 2009 to 2015 compared to the period from 2001 to 2008.

3.2. Case Study (26–29 October 2017)

The following investigates a severe dust storm in Lake Urmia and the surrounding area. This dust case was chosen because it was a combination of a saline dust storm originating from the lake and a large-scale dust storm originating from the An-Nafud desert. First, a dust storm rose from Lake Urmia, and then another dust storm arrived from Saudi Arabia’s desert and affected this area (Appendix A shows synoptic investigation of the dust storms).

3.2.1. Reported Station Data

The weather stations that reported dust-related codes data (codes 06, 07, and 30 to 35; see [82]) around Lake Urmia during the examined dust event are shown in Figure 7. On 27 October 2017, only two stations in SE and NE Lake Urmia reported dust codes, and on 28 October, dust codes were reported in three meteorological stations in SE, E, and NE of Lake Urmia. The dominant wind direction in the Lake Urmia area is southwesterly (Figure 4), so the reported dust on 27 and 28 October 2017 was related to Lake Urmia. When dust storms originate from Syria and Iraq, they first affect the weather stations in the lake’s west. Nevertheless, the dust storms that originate from the lake primarily affect the eastern parts of the lake. On 29 and 30 October 2017, the weather station west of Lake Urmia reported dust related to the dust particles originating from the deserts in Iraq and Saudi Arabia.

3.2.2. Satellite Products

On 27 October 2017, a dust storm was visible over significant parts of Northwest Iran in a MODIS/Aqua true-color image (Figure 8). In addition, scattered dust masses were prevalent over Eastern Iraq and Western Iran. On 28 October, some clouds were visible in the northwest of Iran, so a dust mass could not be detected in this area. On 29 October, a dense dust cloud formed over northern Saudi Arabia and southern Iraq, spreading from the western half of Iraq to the northwest of Iran and the Caspian Sea. This was the typical transport path of dust storms that originated in Saudi Arabia’s An-Nafud desert and spread to Saudi Arabia, Iraq, Syria, and Europe [83].
Figure 9 presents the HYSPLIT Model’s forward trajectory on 27 October 2017 at 12 UTC at the height of 200 m above sea level. The wind was blowing from the southwest, and the dust particles were transported over the Caspian Sea and separated into two main flows to the west and north of the Caspian Sea. This dust particle trajectory is consistent with the MODIS/Aqua true-color image (Figure 8b), which shows the dust storm moving northeast. The HYSPLIT model output also shows that the air mass has moved northeasterly and that the dominant wind is southwesterly, passing over the Bonab and Tabriz stations (Figure 5).

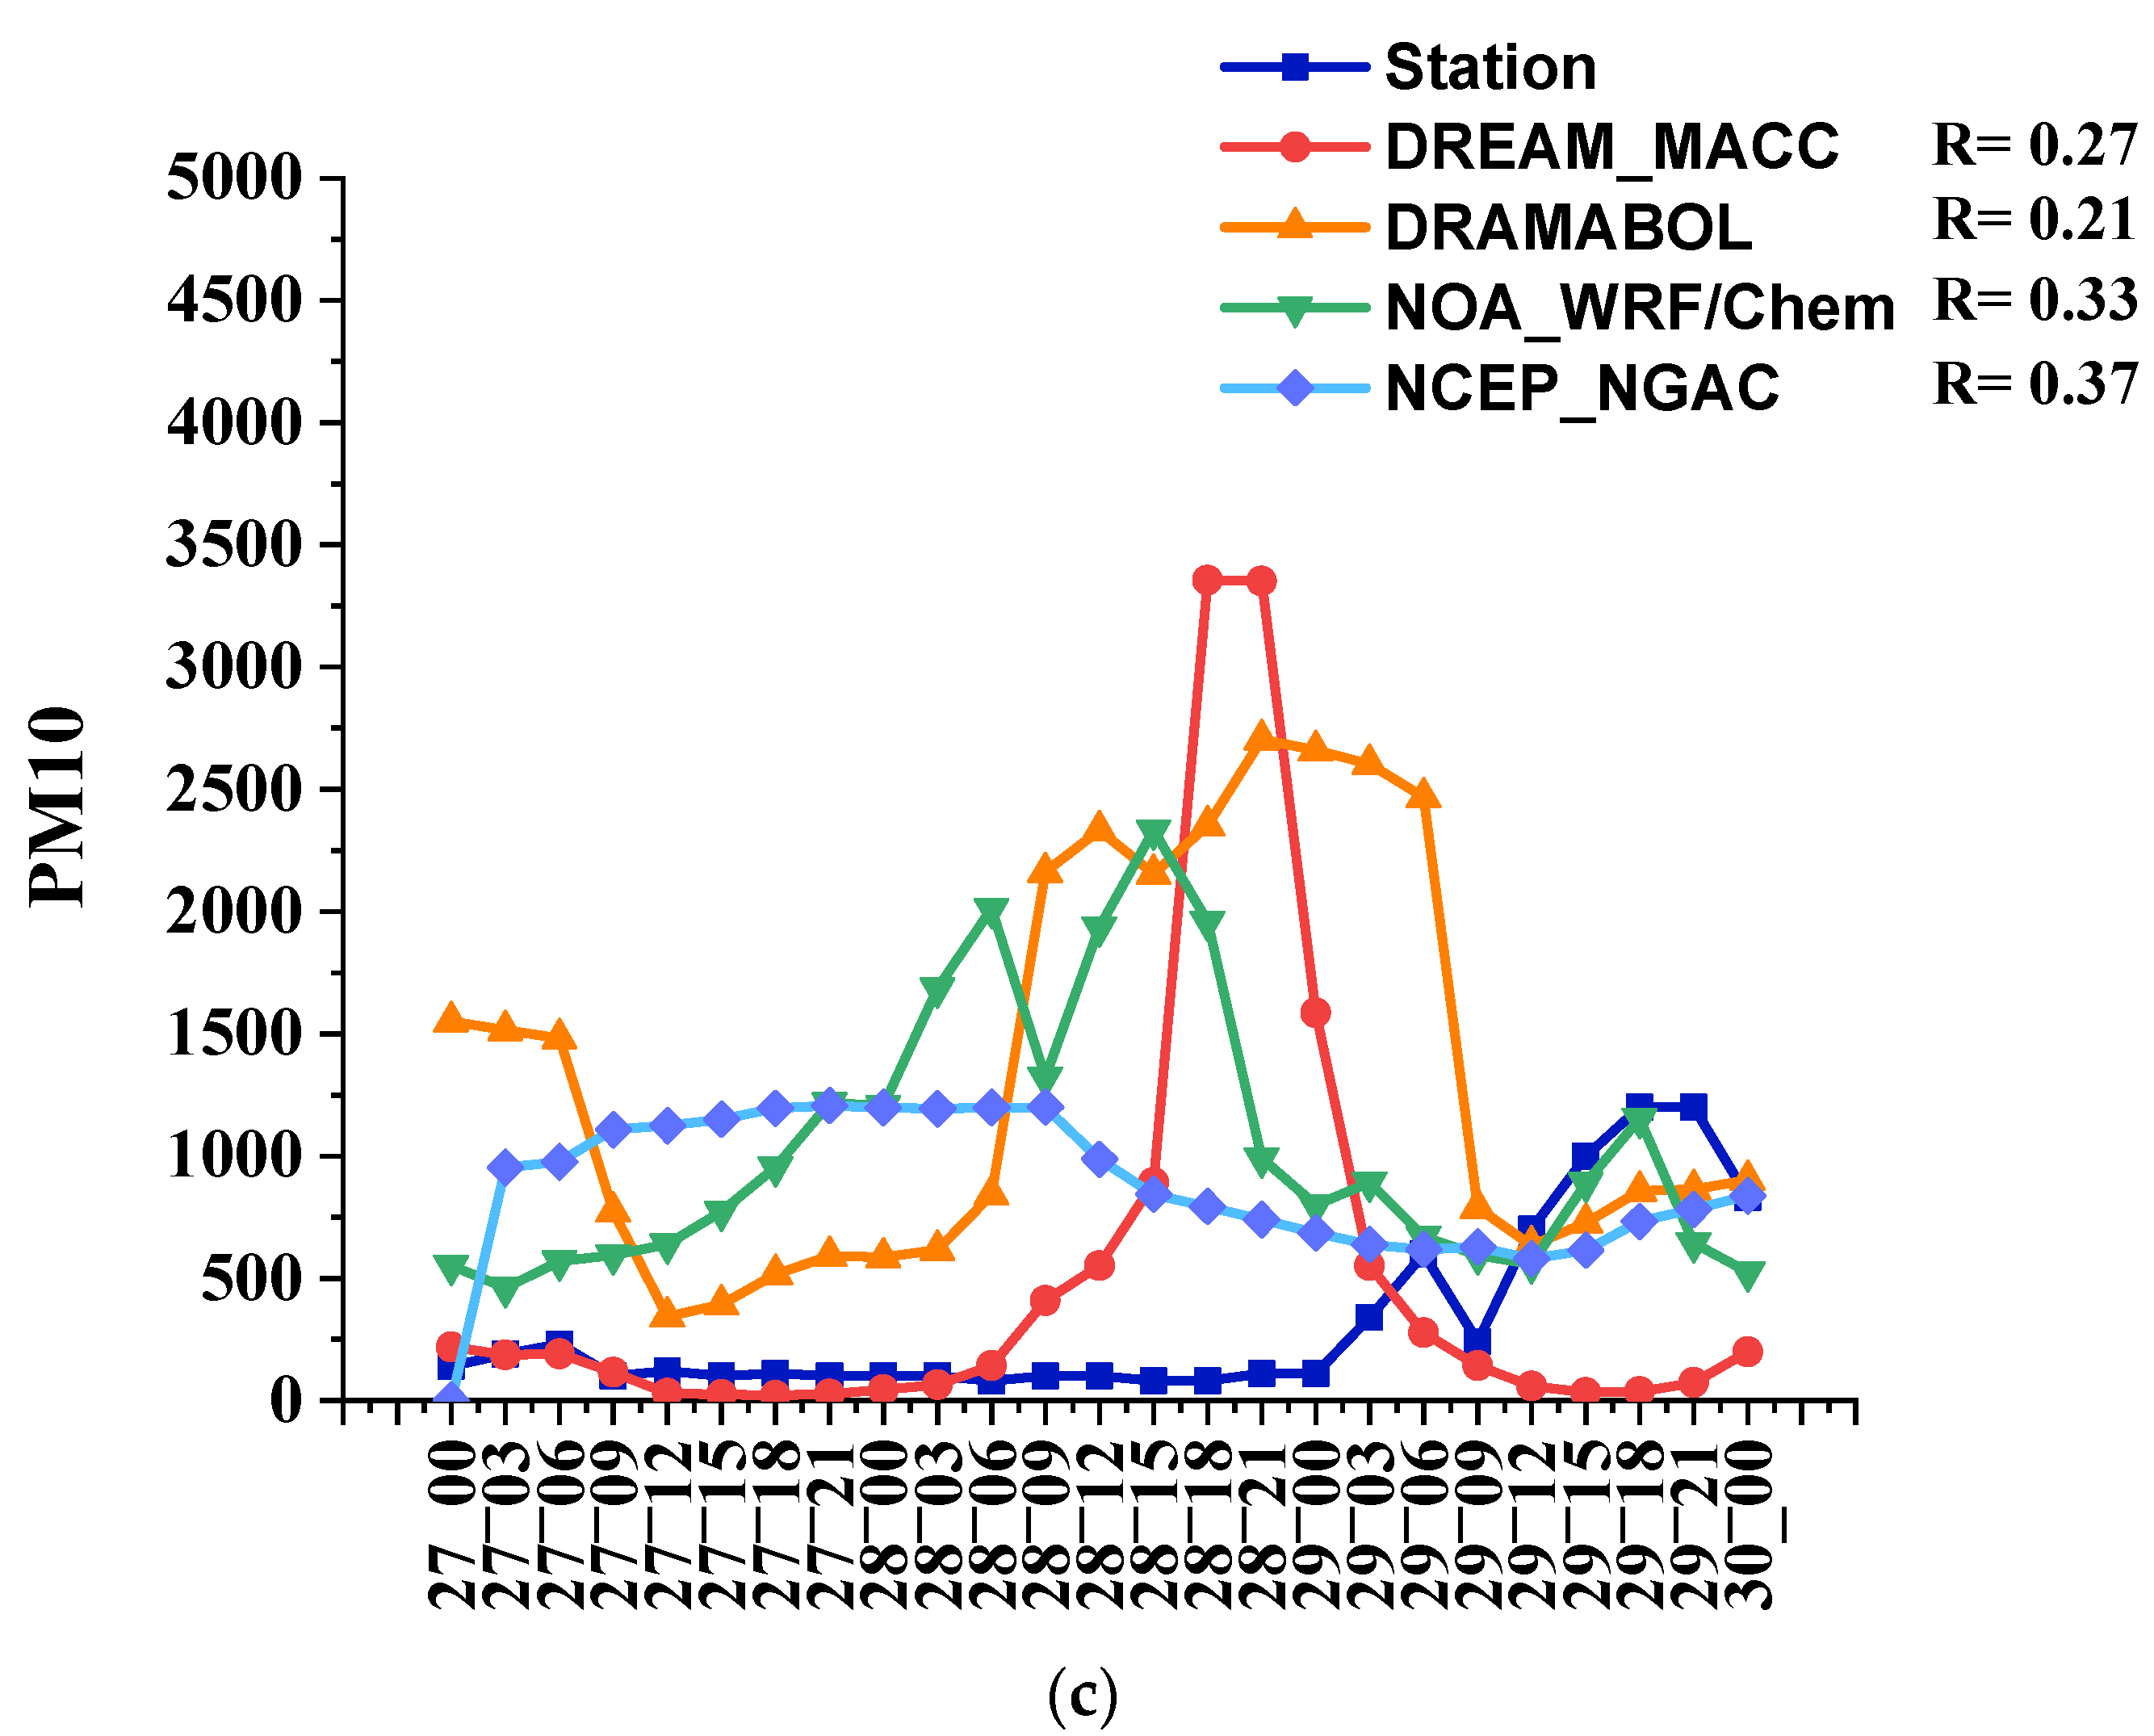
3.2.3. Model Outputs

Figure 10 shows the simulated surface dust concentrations (in µg m−3) from the DREAM-NMME-MACC, DREAMABOL, NCEP NGAC, and NOAA/WRF-Chem models, as an Aqua/MODIS true-color image with AOD at 09 UTC on 27 October 2017. Around 09 UTC, the Aqua satellite passes over the study area. AOD 550 nm from MODIS was also used to show high AOD over Lake Urmia on 27 October 2017. Although AOD was high (around 5) over Lake Urmia and the eastern Caspian Sea, only DREAMABOL and NOAA/WRF-Chem showed high surface dust concentrations in this area. The DREAM MACC and NCEP NGAC models simulated lower dust concentrations in this area, and neither shows Lake Urmia generating dust storms. Three models, DREAM-NMME-MACC, DREAMABOL, and NCEP-NGAC, show large dust concentrations over Iraq, but it is not apparent in the Aqua true-color image. DREAMABOL, NCEP NGAC, and NOAA/WRF-Chem, on the other hand, show well-defined dust masses over Lake Urmia.
For the October 2017 dust episode, Figure 11 depicts the temporal variation of the model’s simulated and measured PM10 concentrations in Urmia, Bokan, and Sardasht (27–30 October). The measured data are the lowest at all stations, and all models overestimate the amount of PM10. The PM10 was measured hourly in local time. To compare it to the outputs of the models, the time was converted to UTC. Furthermore, because the models’ outputs are every three hours, only one data point is considered among the three. All the model outputs at the Urmia station have a low correlation with the measured station data. The maximum correlation is between NCEP_NGAC and station data (0.38). At 18 UTC on 28 October, the maximum measured surface dust concentration was 499 µg/m3. On the other hand, the two models with the highest amounts were before that time (NCEP NGAC modal at 09 UTC on 28 October with 1200 µg/m3 and NOAA/WRF-Chem model at 12 UTC with 3067 µg/m3), and the two models with the highest amounts were after that time (DREAMABOL model at 21 UTC 28 October with 2689 µg/m3 and DREAM NMME MAC model at 00 UTC on 29 October). NOAA/WRF-Chem (0.73) and DREAM MACC (0.73) had the highest correlation between model outputs and measured data at the Bokan station (0.5). In addition, three data points are missing from the Bokan station. The maximum of measured data is 571 μg/m3 at 09 UTC on 29 October. Moreover, the maximum amount of DREAM MACC occurs at the same time, but its amount is 1669 μg/m3. However, the three models estimated the dust maximum earlier that time (NCEP NGAC model at 06 UTC 28 October with 1643 µg/m3, DREAMABOL model at 21 UTC 28 October with 3092 µg/m3, and NOAA/WRF-Chem model at 03 UTC 29 October with 5175 µg/m3). The correlation between simulated and measured data at the Sardasht station is low for all models, with the highest being 0.37. All of the models overestimated dust surface PM10 until 09 UTC on 29 October, but then they underestimated surface dust concentration. At 18 and 21 UTC on 29 October, the maximum measured dust concentration was 1200 µg/m3. The NOAA/WRF-Chem model produces higher surface dust concentrations than the other three models, which is consistent with [84].
Table 4 presents the correlation coefficients of the four models with measured PM10 data from four Department of Environment stations (Urmia, Sardasht, Salmas, and Bokan) from 27 to 29 October 2017. The highest correlation was observed for measured surface PM10 and the DREAMABOL model, while the lowest correlation was related to the NOAA/WRF-Chem model. The DREAMABOL model output and the DREAM-MACC model exhibited the highest and lowest mean absolute error (MAE), respectively.

4. Conclusions

Dried lakes have gradually become one of the most significant dust sources [85]. Furthermore, climate change and long-term droughts have directly impacted lake drying. The majority of Lake Urmia has gradually dried up, particularly the southern end. In recent decades, the number of dust storms originating in this area has increased dramatically [17].
This study included a long-term investigation of the Lake Urmia area. In three nearby stations east and west of the lake, the annual number of dusty days increased from 2008 to 2017 (except in 2014). From 2000 to 2017, the mean MODIS aerosol optical depth at 550 nm shows a high AOD over Lake Urmia. AOD time series over the lake revealed a sharp increase in AOD beginning in 2008 and continuing for the next 18 years. The AOD trend is completely consistent with the annual total number of dusty days in most stations near to Lake Urmia. From 2000 to 2017, the NDVI pattern revealed that the index was low in Lake Urmia and its surrounding area. It was predictable because Lake Urmia is the world’s second saltiest lake, and its salinity and salty storms impact the vegetation cover and crops produced in the area around it. The FLDAS model’s mean snowfall rate output showed that the snowfall rate decreased from 2007 to 2017 (except in 2012) over Lake Urmia, which is one reason for the lake’s decreasing water level. Another reason is that the lake became drier as the vegetation cover declined and the temperature rose, raising the dust bed.
Finally, an extreme dust event that happened in October 2017 was investigated over the study area. On 28 October 2017, a dust storm erupted from Lake Urmia, and stations to the east of the lake reported dust code 06, so this case was chosen. Nonetheless, another intense dust storm erupted from the An-Nafud desert-affected area surrounding Lake Urmia two days later. According to the HYSPLIT model, dust particles originated in the lake and were transported east over the Caspian Sea. Additionally, the meteorological stations around the lake reported weather dust codes from 26 to 29 October 2017. On 27 and 28 October 2017, only weather stations in the southeast, east, and northeast of the lake reported weather dust codes that show the dust storm originated from the lake; the wind direction is westernly and southwesterly over Lake Urmia and saline dust particles mainly affect the eastern area.
Furthermore, the dust storms originating from the deserts in Syria, Iraq, and Saudi Arabia affect the western stations of the lake. In the following days, the western stations of the lake reported dust as well. Additionally, AOD 550 nm with 10 km resolution clearly showed high AOD over the lake on 27 October 2017, indicating dust particles raised from the lake on 27 October.
DREAM-NMME-MACC, NCEP-NGAC DREAMABOL, and NOAA/WRF-Chem were used to investigate the dust storm event that originated from Lake Urmia in the vicinity of these lakes. The dust storms studied in September 2017 (Lake Urmia dust storm) first affected the eastern parts of Lake Urmia, and then another dust storm blew in from Saudi Arabia’s An-Nafud desert in the north. The DREAMABOL and NOAA/WRF-Chem models simulated surface dust patterns better at 09 UTC on 27 October 2017, but the DREAM-NMME-MACC and NCEP-NGAC models did not. The DREAMABOL model has a horizontal resolution of 0.4 degrees, the NOAA/WRF-Chem model has a horizontal resolution of 0.19 degrees, the DREAM-NMME-MACC model has a horizontal resolution of 1.3 degrees, and the NCEP-NGAC model has a horizontal resolution of 1 degree. The coarser resolution of the DREAM-NMME-MACC and NCEP-NGAC models is probably one of the factors that caused them to miss the dust signal from the lake.
The measured and simulated dust concentrations in Urmia, Sardasht, and Bokan revealed that all four models overestimated the dust concentration in this case. The majority of model outputs that were correlated with measured data were acceptable in some stations, but not in others. More research is needed to investigate the performance of SDS-WAS models in the dust source of Lake Urmia.

Author Contributions

Conceptualization, N.H.H. and A.R.S.A.; methodology, N.H.H. and M.C.G.O.; software, N.H.H. and A.R.S.A.; validation, N.H.H., M.C.G.O. and M.H.; formal analysis, N.H.H., A.R.S.A., M.H. and W.S.; resources, N.H.H., A.R.S.A. and M.C.G.O.; data curation, N.H.H.; writing—original draft preparation, N.H.H.; writing—review and editing, M.C.G.O., A.R.S.A. and M.H.; visualization, N.H.H., M.C.G.O. and A.R.S.A.; supervision, W.S. All authors have read and agreed to the published version of the manuscript.

Funding

Open Access Funding by the University of Graz.

Data Availability Statement

Data sets supporting reported results are: MODIS and MERRA-2 via Giovanni (https://giovanni.sci.gsfc.nasa.gov/giovanni/, accessed on 20 October 2021). ERA-5 via https://www.ecmwf.int/en/forecasts/datasets/reanalysis-datasets/era5 (accessed on 10 October 2021).

Acknowledgments

The synoptic maps were provided by the ECMWF reanalysis teams. We are also grateful to NASA for providing MODIS AOD retrievals, NDVI, and actual color images. The authors would also like to thank the members of SDS-WAS (https://sds-was.aemet.es) for the four model dust concentration outputs (accessed on 12 October 2021). We appreciate the Iran Meteorological Organization for reporting the wind direction and dust-related codes. In addition, the Iranian Department of Environment is recognized for the PM10 monitoring system.

Conflicts of Interest

The authors declare that they have no conflict of interest.

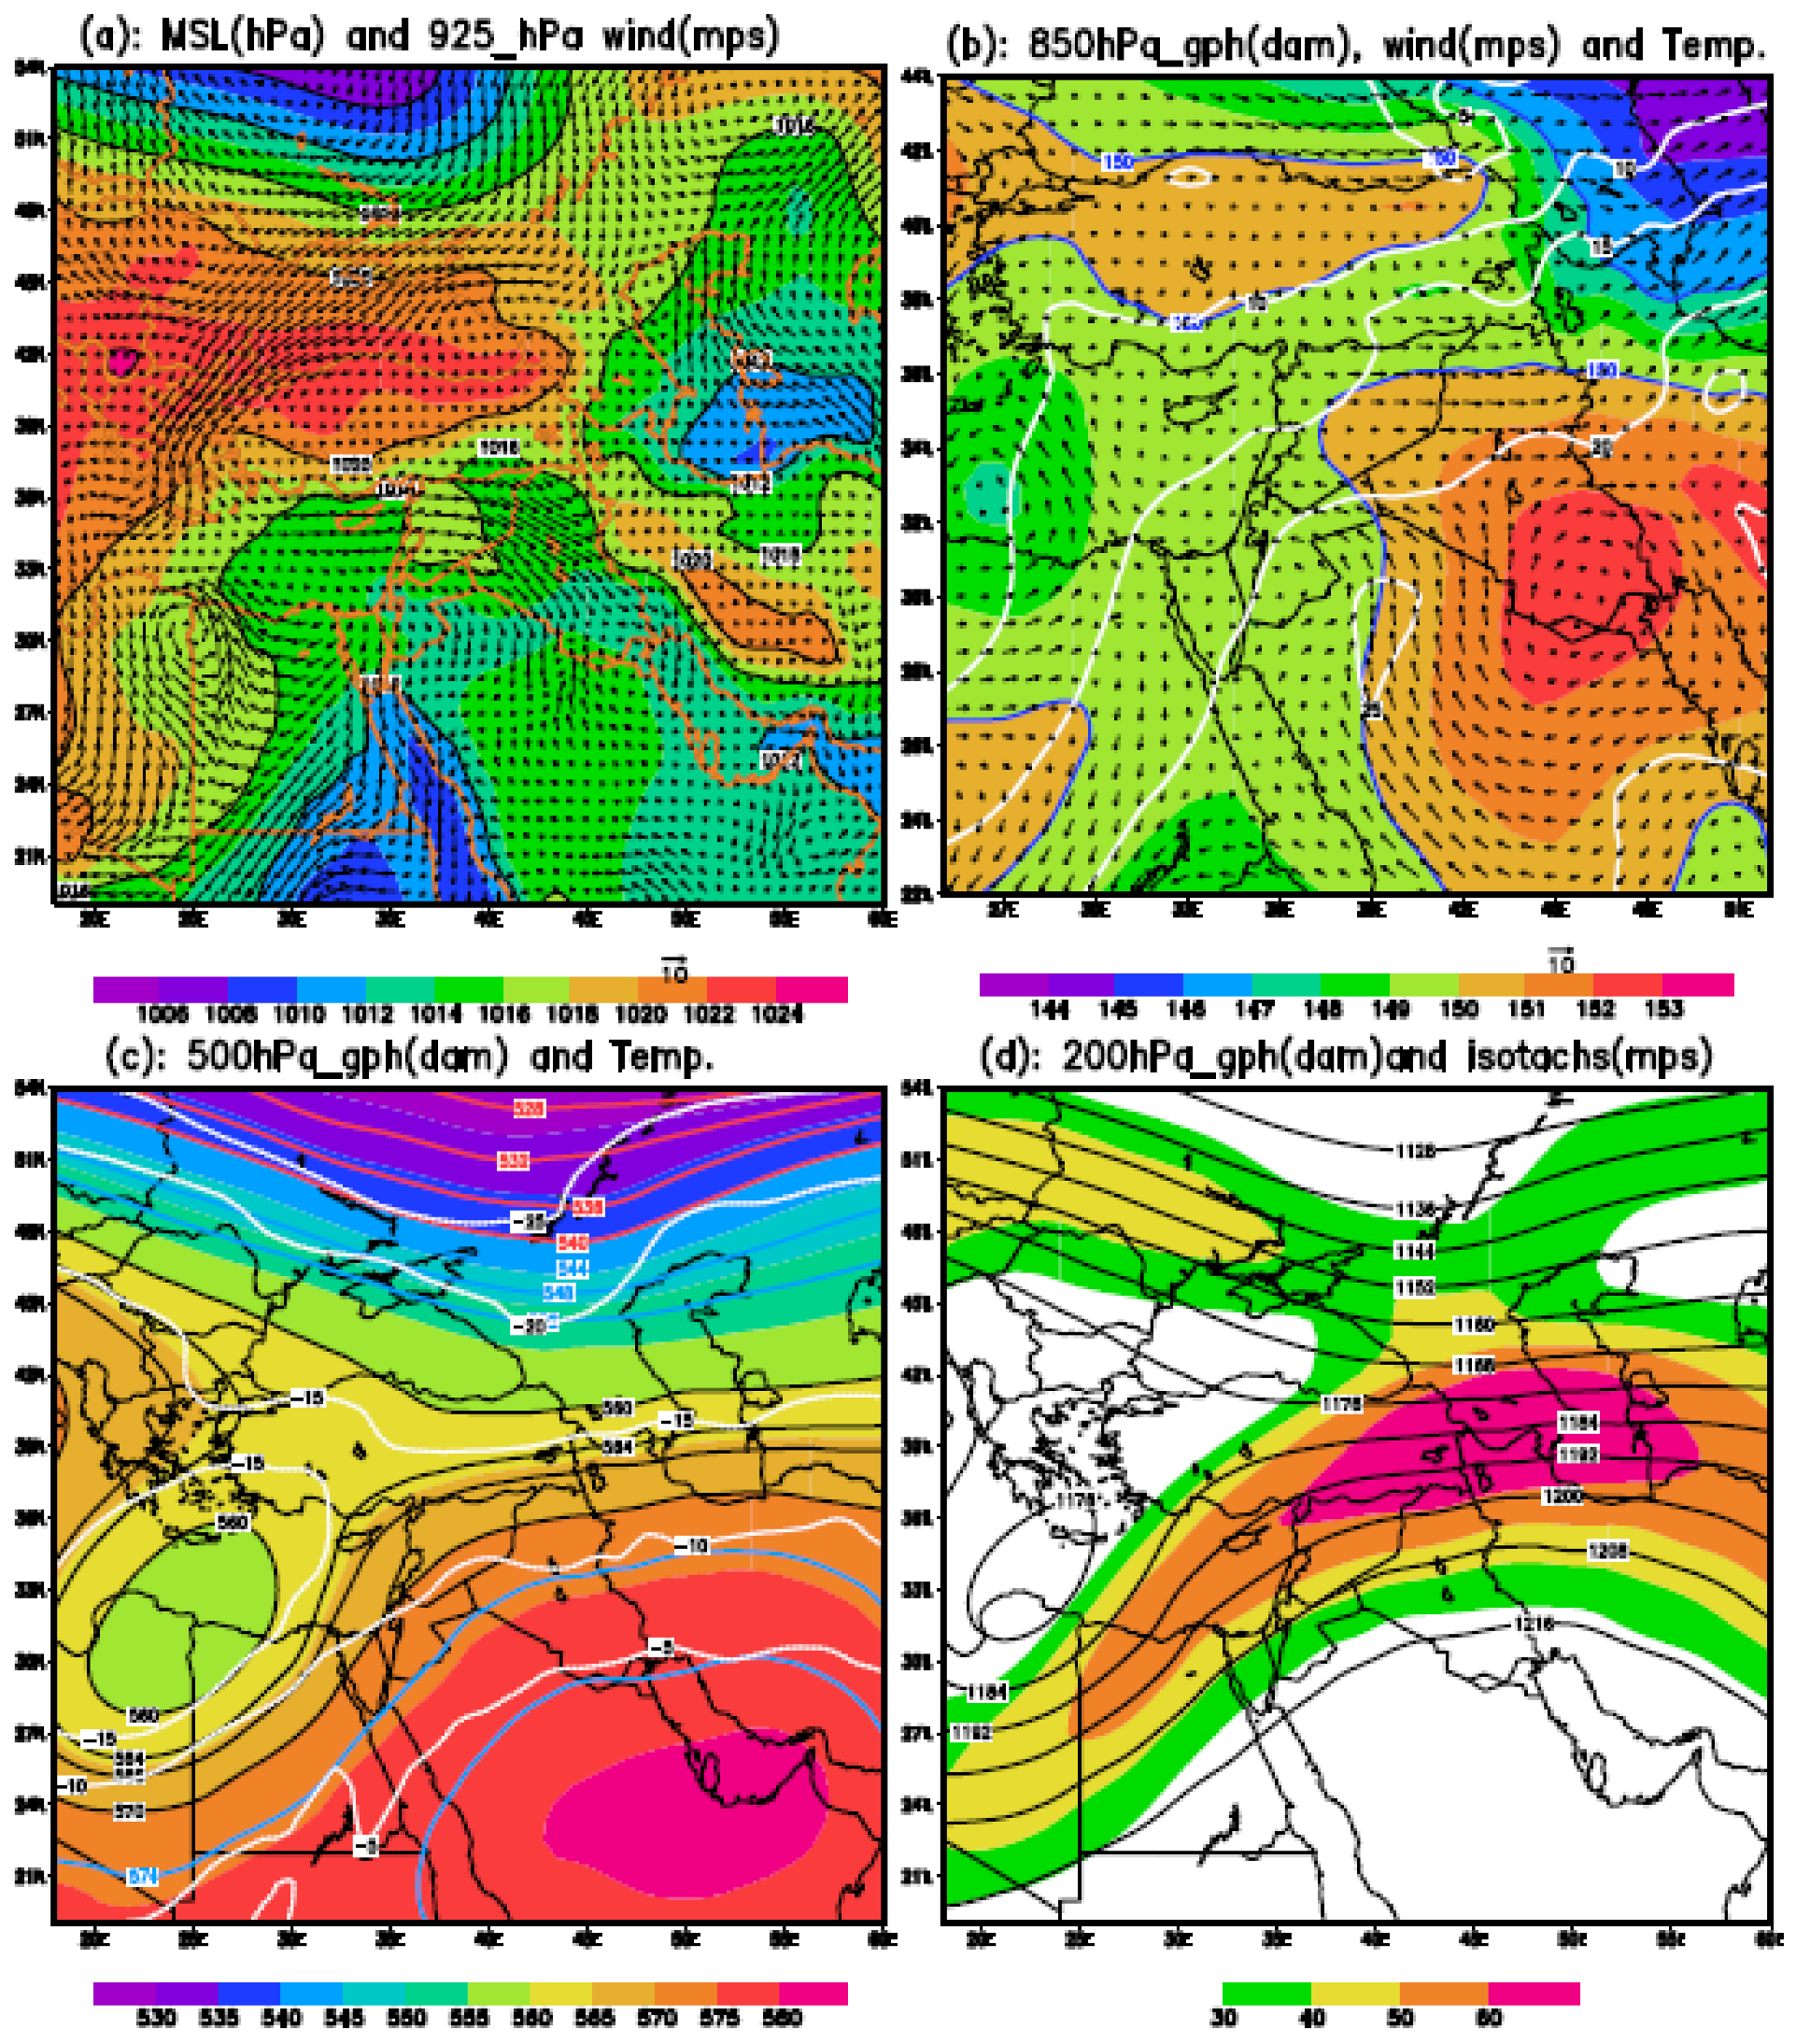
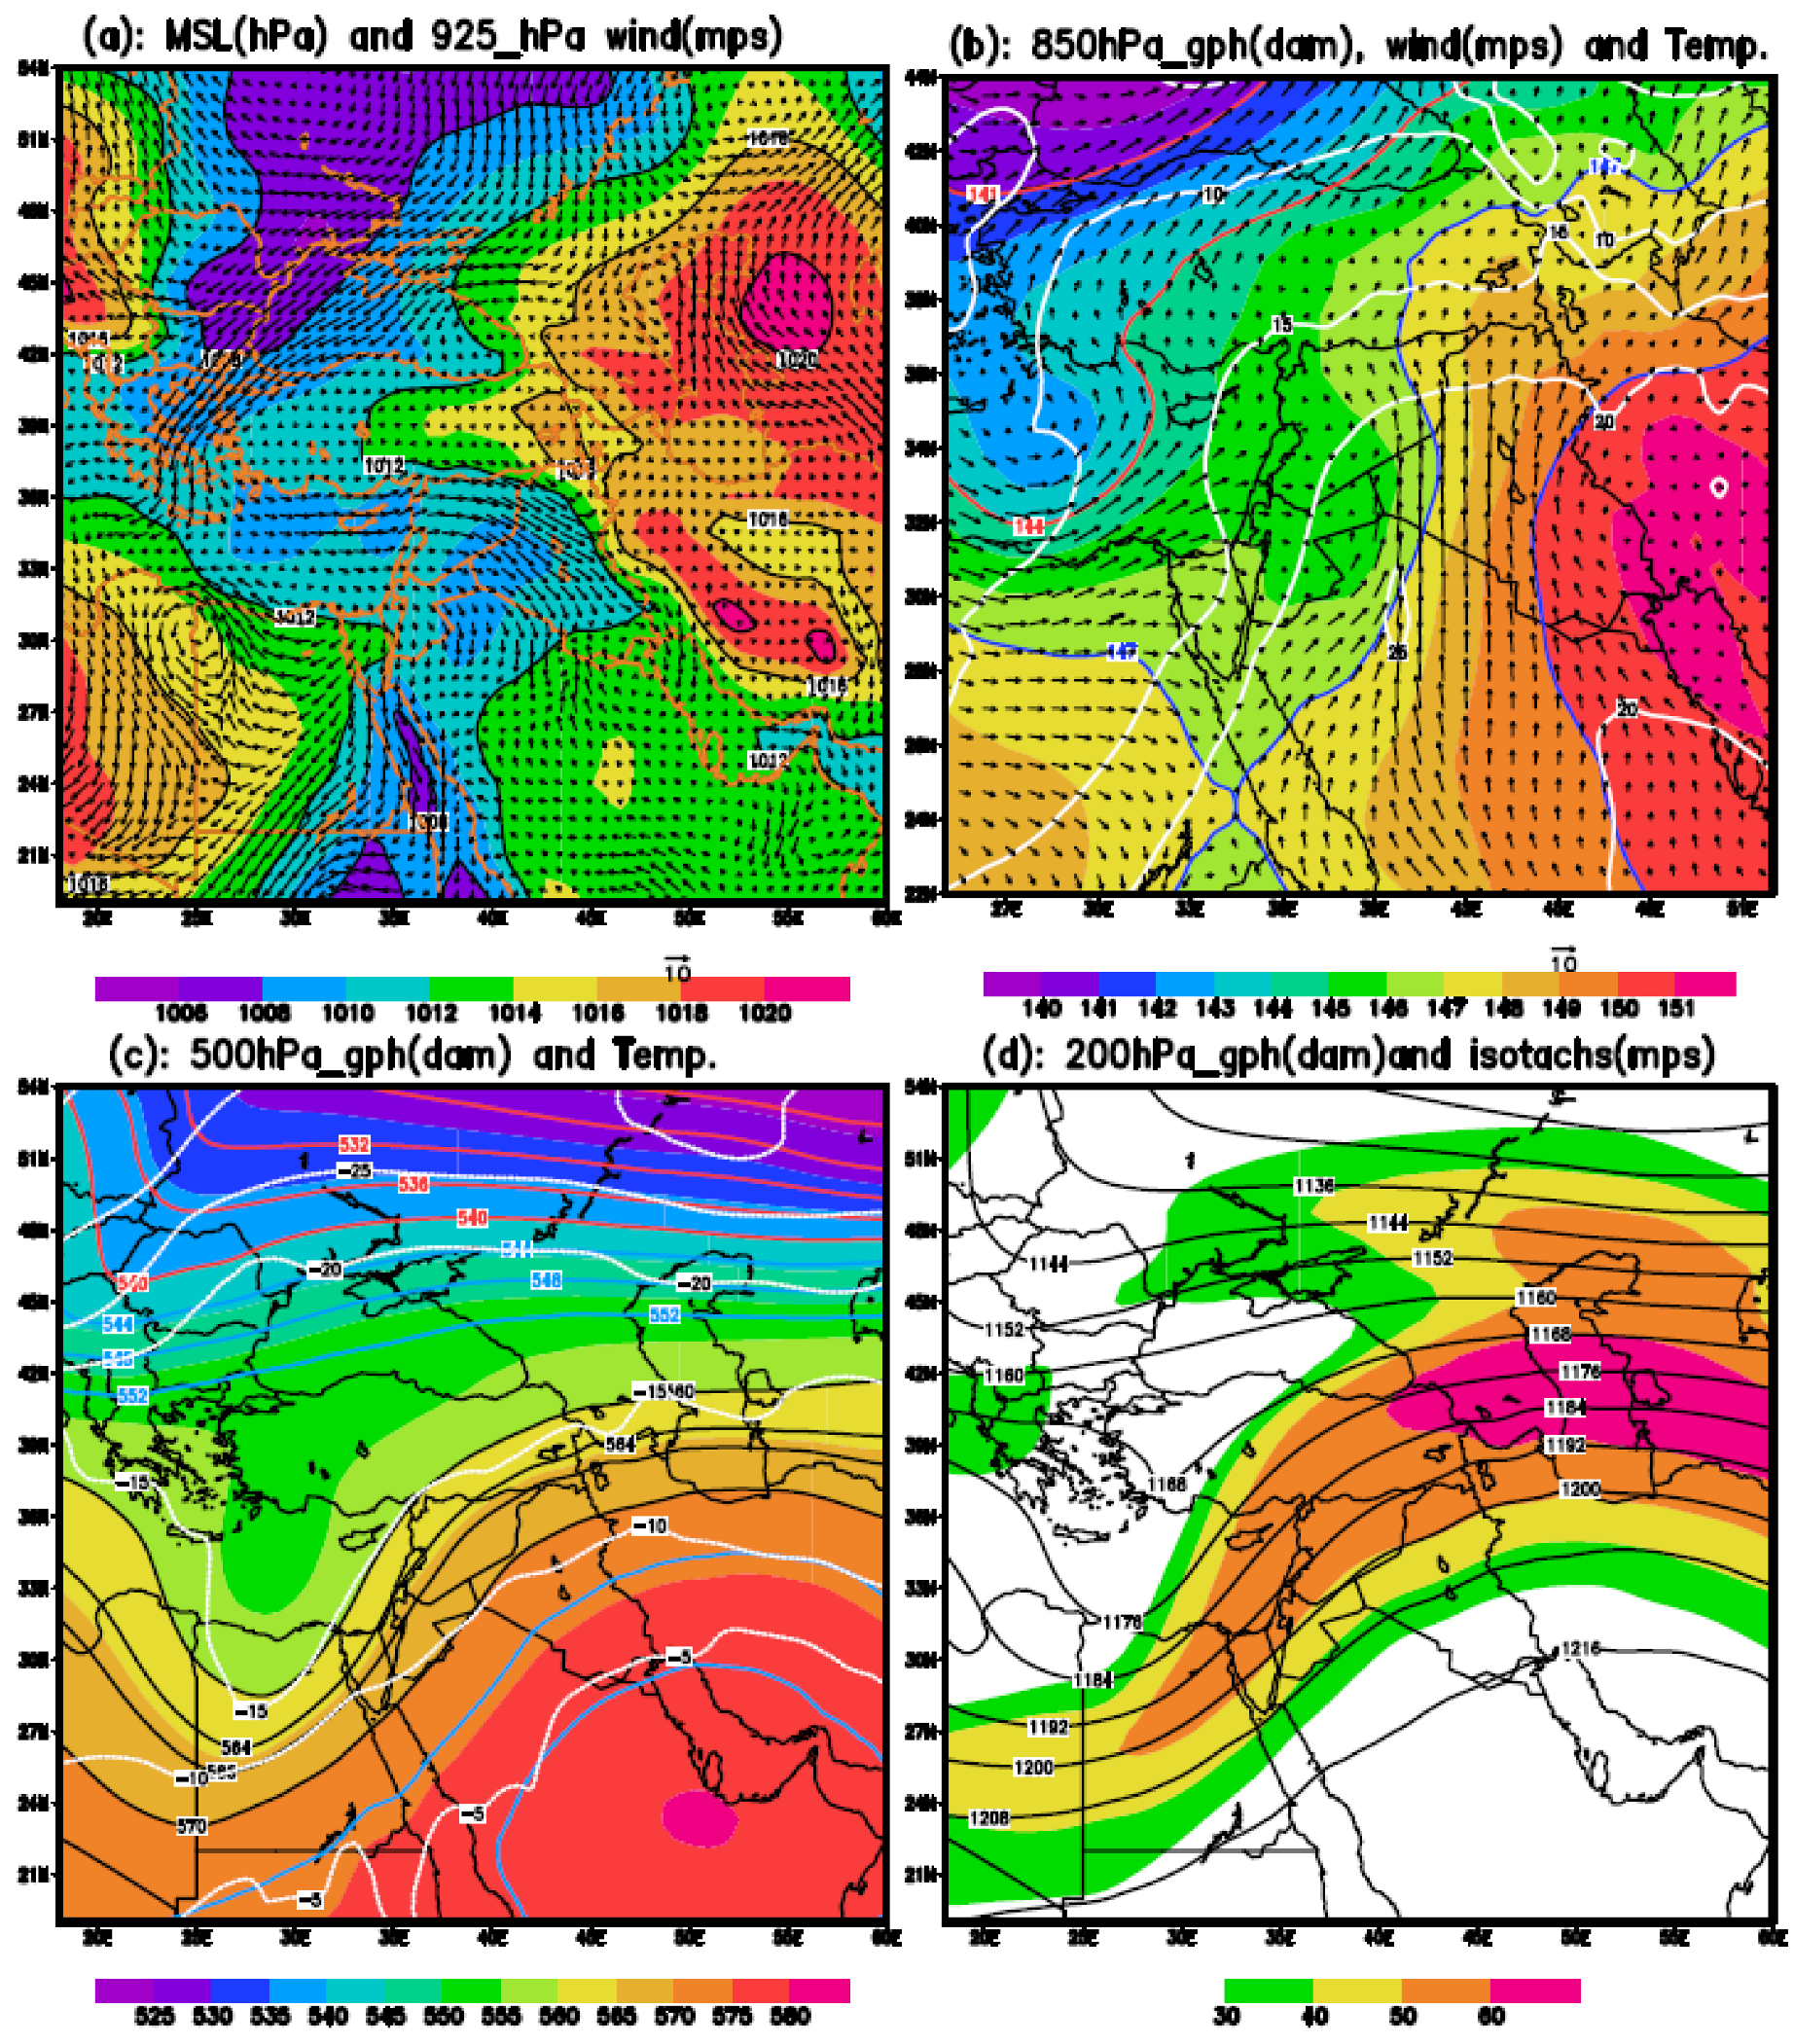
Appendix A. Synoptic Investigation of the Dust Storms

The synoptic-scale meteorological conditions leading to the development of severe local and large-scale dust storm events were examined for the period from 27 to 30 October 2017. The following atmospheric parameters were examined on composite sea level pressure and geopotential height charts (Figure A1, Figure A2, Figure A3, Figure A4 and Figure A5): MSLP (Mean Sea Level Pressure), GH (Geopotential Height), Temp (Air Temperature), wind speed, and direction. Within the MSLP, 850, 500, and 200 hPa geopotential heights are shaded in color and solid line contours, respectively.
Figure A1 shows the synoptic weather conditions for 26 October. Figure 10a depicts a high-pressure system centered over Iran, with a ridge extending northeast and over the Lake Urmia region, and a low-pressure system centered over Saudi Arabia, with a trough extending to northern Iraq. As a result, it created a gradient pressure over the boundaries of the two pressure systems, and strong northwesterly winds over northern Iraq. At 850 hPa, a ridge extended from the center of Iran to the southwest and southern Iraq, with a southerly wind and a temperature gradient over southeastern Iraq and northeastern Saudi Arabia (Figure A1b). A longwave trough (solid black contour) with a strong contour gradient still dominates the southeastern Mediterranean Sea (MS) at 500 hPa (Figure A1c). An upper high also extended over western Iran at 200 hPa and 500 hPa, with a strong jet stream located over the southeastern Mediterranean Sea (Figure A1d).
Figure A2 presents the synoptic weather conditions for 27 October. A low-pressure system centered over the southern Caspian Sea, with two troughs extending west (over northern Lake Urmia) and south, and strong low-level winds over Iraq and northeast Syria, created a favorable environment for rising dust (Figure A2a). A cold core high stretched from the Zagros Mountains to the Black Sea, while a core of low pressure stretched from Northwest Iran to Iraq. A weak trough was located over the southwest of the Caspian Sea at 850 hPa, and a temperature gradient was located across the northwest of Iran and southeast of Turkey (Figure A2b). The 500-hPa geopotential heights (Figure A2c) revealed a cutoff low over the Mediterranean Sea (MS), with a strong gradient contour over the southeast of the Mediterranean Sea and Northern Iran (the solid black contours) in a 200-hPa geopotential height pattern (Figure A2d), which was the same as the 500-hPa level. It was associated with an upper-level anticyclone jet flow over Syria, and an upper-level trough jet flow over the southeast of the Black Sea, both of which created strong westerly winds over Iran’s northwest.
Figure A1. MSLP, 850, 500, and 200 hPa GHs analyses for 00 UTC 26 October 2017: (a) MSLP (the interval is 3 Mb) and 925 hPa wind vector. (b) 850 hPa GH (the interval is 3 dam) and temperature (the interval is 5 °C). (c) 500 hPa GH (the interval is 3 dam) and temperature (dotted white lines, the interval is 5 °C). (d) 200 hPa GH (the interval is 8 dam) and isotachs (m/s, for more than 30 m/s).
Remotesensing 14 02145 g0a1
Figure A2. Same as Figure 10 but for 00 UTC 27 October 2017.
Remotesensing 14 02145 g0a2
At 00 UTC on 28 October 2017 (Figure A3), two large low-pressure systems (pink and blue shaded colors) were located north of the Black Sea (BS) and the Northern Red Sea (RS), resulting in a large trough stretching from the MS through Iraq (Figure A3a). Furthermore, two large high-pressure systems were located over two sides of the low pressures, and the northwesterly winds over Iraq were strengthened. A longwave trough was located over the northwest of the BS, as was a weak trough over the eastern MS. An upper high extended from Iran to the west of the CS, with southerly winds extending from Saudi Arabia to Northern Iraq at 850 hPa (Figure A3b). A temperature gradient was observed across Southeastern Mississippi and Northern Iran. A deep trough located northwest of the RS at 500 hPa elongated a ridge over Iran and Iraq (Figure A3c). The geopotential height at 200 hPa (Figure A3d) was identical to that at the 500 hPa level and associated with an upper-level anticyclone jet over Iraq and Iran. In addition, two jet streams were merged across Iran’s northeast.
Figure A3. Same as Figure 10 but for 00 UTC 28 October 2017.
Remotesensing 14 02145 g0a3
At 00 UTC on 29 October 2017, a massive low-pressure system was located over Europe, with two troughs extending over the Mediterranean Sea and the Caspian Sea (CS). Furthermore, a weak cyclone centered over Iraq (Figure A4a) with a cold front (extending southward from Iraq and southeast to the northern part of the RS) producing extreme north-northwesterly winds over Iraq and the northwest of Saudi Arabia. Moreover, there were two small warm and cold fronts over Eastern Iraq, and a warm front extending northeastward from Northwest Iraq to Northwest Iran (the fronts are not drawn on the Figure A4a). The formation of strong winds in this area can result in severe dust storms that move with the upper winds and affect the wind’s downstream areas after rising to the upper level. A long-wave trough extended from Western Turkey and the MS to Northwestern Iraq at 850 hPa. The temperature gradients were more pronounced along the westerly portions of the cold front (over the southeast of the MS), and the southerly winds that stretch from Saudi Arabia to Iraq converged with the westerly winds in Northwestern Iran (Figure A4b). The contour field revealed an enhanced gradient zone to the east of the trough axis, which corresponded to a frontal zone. An upper trough was found southeast of the MS (Figure A4c), with a very long wave and geopotential height gradient (black contours) from the MS to the Caspian Sea’s south. These favorable conditions point to a short-wave trough with increased instabilities spreading over parts of Jordan, Syria, Iraq, and northwest Iran. Figure A4d depicted a 200 hPa chart at 00 UTC on 29 October 2017, during the dust storm episode’s development. The two jet streams were merged across Iran’s northwest on this map. Some parts of Iran’s west and northwest are in the right entrance, characterized by upper-tropospheric divergence associated with vertical motions.
Figure A4. Same as Figure 10 but for 00 UTC 29 October 2017.
Remotesensing 14 02145 g0a4
At 00 UTC on 30 October 2017, a low solid pressure system was located over the northern BS region, with a trough over the Caspian Sea and a weak trough over the northwest MS, as well as a high-pressure system centered over the Zagros Mountain range (Figure A5a). A weak longwave trough was located over the Eastern Mediterranean Sea at 850 hPa level, and a ridge with a temperature trough was superimposed over the Zagros Mountains range (Figure A5b). A strong gradient longwave trough (black contours) was located over the north of the RS, with Jourdan, Iraq, and Northwest Iran located downstream of the trough (Figure A5c).
Figure A5. Same as Figure 10 but for 00 UTC 30 October 2017.
Remotesensing 14 02145 g0a5

References

  1. Middleton, N. Variability, and trends in dust storm frequency on decadal timescales: Climatic drivers and human impacts. Geosciences 2019, 9, 261. [Google Scholar] [CrossRef] [Green Version]
  2. Goudie, A.S. Dust storms and human health. In Extreme Weather Events and Human Health; Springer: Cham, Switzerland, 2020; pp. 13–24. [Google Scholar]
  3. Middleton, N.J. Desert dust hazards: A global review. Aeolian Res. 2017, 24, 53–63. [Google Scholar] [CrossRef]
  4. Baddock, M.C.; Strong, C.L.; Murray, P.S.; McTainsh, G.H. Aeolian dust as a transport hazard. Atmos. Environ. 2013, 71, 7–14. [Google Scholar] [CrossRef] [Green Version]
  5. Stefanski, R.; Sivakumar, M.V.K. Impacts of sand and dust storms on agriculture and potential agricultural applications of an SDSWS. In Proceedings of the IOP Conference Series: Earth and Environmental Science, Barcelona, Spain, 7–9 November 2007; IOP Publishing: Bristol, UK, 2009; Volume 7, p. 012016. [Google Scholar]
  6. Schutz, L. Saharan dust transport over the North Atlantic Ocean. Geol. Soc. Am. Spec. Paper 1981, 186, 87–100. [Google Scholar]
  7. Schlesinger, P.; Mamane, Y.; Grishkan, I. Transport of microorganisms to Israel during Saharan dust events. Aerobiologia 2006, 22, 259. [Google Scholar] [CrossRef]
  8. Middleton, N. Deserts: A Very Short Introduction; Oxford University Press: Oxford, UK, 2009; Volume 215. [Google Scholar]
  9. Kok, J.F.; Adebiyi, A.A.; Albani, S.; Balkanski, Y.; Checa-Garcia, R.; Chin, M.; Colarco, P.R.; Hamilton, D.S.; Huang, Y.; Ito, A.; et al. Contribution of the world’s main dust source regions to the global cycle of desert dust. Atmos. Chem. Phys. Discuss. 2021, 21, 8169–8193. [Google Scholar] [CrossRef]
  10. Bullard, J.E.; Harrison, S.P.; Baddock, M.C.; Drake, N.; Gill, T.E.; McTainsh, G.; Sun, Y. Preferential dust sources: A geomorphological classification designed for use in global dust-cycle models. J. Geophys. Res. 2011, 116, F04034. [Google Scholar] [CrossRef] [Green Version]
  11. Micklin, P. The Aral Sea disaster. Annu. Rev. Earth Planet. Sci. 2007, 35, 47–72. [Google Scholar] [CrossRef] [Green Version]
  12. Indoitu, R.; Kozhoridze, G.; Batyrbaeva, M.; Vitkovskaya, I.; Orlovsky, N.; Blumberg, D.; Orlovsky, L. Dust emission and environmental changes in the dried bottom of the Aral Sea. Aeolian Res. 2015, 17, 101–115. [Google Scholar] [CrossRef]
  13. Opp, C.; Groll, M.; Aslanov, I.; Lotz, T.; Vereshagina, N. Aeolian Dust Deposition in the Southern Aral Sea Region (Uzbekistan): Ground-based monitoring results from the LUCA project. Quat. Int. 2017, 429, 86–99. [Google Scholar] [CrossRef]
  14. Hamzeh, N.H.; Karami, S. Investigation of a Severe Dust Storm over the Aral Sea Area; MegaPrint Inc.: Holderness, NH, USA, 2017. [Google Scholar]
  15. Gholampour, A.; Nabizadeh, R.; Hassanvand, M.S.; Taghipour, H.; Nazmara, S.; Mahvi, A.H. Characterization of saline dust emission resulted from Lake Urmia drying. J. Environ. Health Sci. Eng. 2015, 13, 82. [Google Scholar] [CrossRef] [PubMed] [Green Version]
  16. Goudie, A. Dust storms and ephemeral lakes. Desert 2018, 23, 153–164. [Google Scholar]
  17. Boroughani, M.; Hashemi, H.; Hosseini, S.H.; Pourhashemi, S.; Berndtsson, R. Desiccating Lake Urmia: A new dust source of regional importance. IEEE Geosci. Remote Sens. Lett. 2019, 17, 1483–1487. [Google Scholar] [CrossRef]
  18. Alizade Govarchin Ghale, Y.; Baykara, M.; Unal, A. Analysis of decadal land cover changes and salinization in Lake Urmia Basin using remote sensing techniques. Nat. Hazards Earth Syst. Sci. Discuss. 2017, 1–15. [Google Scholar] [CrossRef]
  19. Zoljoodi, M.; Didevarasl, A. Water-level fluctuations of Urmia Lake: Relationship with the long-term changes of meteorological variables (solutions for water-crisis management in Lake Urmia Basin). Atmos. Clim. Sci. 2014, 4, 47665. [Google Scholar] [CrossRef] [Green Version]
  20. Sattari, M.T.; Mirabbasi, R.; Jarhan, S.; Shaker Sureh, F.; Ahmad, S. Trend and abrupt change analysis in water quality of Urmia Lake in comparison with changes in lake water level. Environ. Monitor. Assess. 2020, 192, 623. [Google Scholar] [CrossRef]
  21. Sotoudeheian, S.; Salim, R.; Arhami, M. Impact of Middle Eastern dust sources on PM10 in Iran: Highlighting the impact of Tigris-Euphrates basin sources and desiccation. J. Geophys. Res. Atmos. 2016, 121, 14–18. [Google Scholar] [CrossRef]
  22. Brazel, A.J.; Nickling, W.G. The relationship of weather types to dust storm generation in Arizona (1965–1980). J. Climatol. 1986, 6, 255–275. [Google Scholar] [CrossRef]
  23. Carlson, T.N.; Benjamin, S.G. Radiative heating rates for Saharan dust. J. Atmos. Sci. 1980, 37, 193–213. [Google Scholar] [CrossRef] [Green Version]
  24. Offer, Z.I.; Goossens, D. Airborne dust in the Northern Negev Desert (January–December 1987): General occurrence and dust concentration measurements. J. Arid Environ. 1990, 18, 1–19. [Google Scholar] [CrossRef]
  25. Nickovic, S. Modeling of dust process for the Saharan and Mediterranean area. In The Impact of Desert Dust across the Mediterranean; Springer: Dordrecht, The Netherlands, 1996; pp. 15–23. [Google Scholar]
  26. Nickovic, S.; Dobricic, S. A model for long-range transport of desert dust. Mon. Weather Rev. 1996, 124, 2537. [Google Scholar] [CrossRef] [Green Version]
  27. Huneeus, N.; Schulz, M.; Balkanski, Y.; Griesfeller, J.; Prospero, J.; Kinne, S.; Bauer, S.; Boucher, O.; Chin, M.; Dentener, F.; et al. Global dust model intercomparison in AeroCom phase I. Atmos. Chem. Phys. 2011, 11, 7781–7816. [Google Scholar] [CrossRef] [Green Version]
  28. Pérez, C.; Haustein, K.; Janjic, Z.; Jorba, O.; Huneeus, N.; Baldasano, J.M.; Black, T.; Basart, S.; Nickovic, S.; Miller, R.L.; et al. Atmospheric dust modeling from meso to global scales with the online NMMB/BSC-Dust model–Part 1: Model description, annual simulations and evaluation. Atmos. Chem. Phys. 2011, 11, 13001–13027. [Google Scholar] [CrossRef] [Green Version]
  29. Shao, Y. A model for mineral dust emission. J. Geophys. Res. Atmos. 2001, 106, 20239–20254. [Google Scholar] [CrossRef]
  30. Tegen, I.; Harrison, S.P.; Kohfeld, K.; Prentice, I.C.; Coe, M.; Heimann, M. Impact of vegetation and preferential source areas on global dust aerosol: Results from a model study. J. Geophys. Res. Atmos. 2002, 107, AAC-14. [Google Scholar] [CrossRef] [Green Version]
  31. Kim, D.; Chin, M.; Kemp, E.M.; Tao, Z.; Peters-Lidard, C.D.; Ginoux, P. Development of high-resolution dynamic dust source function-A case study with a strong dust storm in a regional model. Atmos. Environ. 2017, 159, 11–25. [Google Scholar] [CrossRef]
  32. Tanaka, T.Y.; Chiba, M. A numerical study of the contributions of dust source regions to the global dust budget. Glob. Planet. Change 2006, 52, 88–104. [Google Scholar] [CrossRef]
  33. Hamzeh, N.H.; Karami, S.; Opp, C.; Fattahi, E.; Jean-François, V. Spatial and temporal variability in dust storms in the Middle East, 2002–2018: Three case studies in July 2009. Arab. J. Geosci. 2021, 14, 538. [Google Scholar] [CrossRef]
  34. Karami, S.; Hamzeh, N.H.; Abadi, A.R.S.; Madhavan, B.L. Investigation of a severe frontal dust storm over the Persian Gulf in February 2020 by CAMS model. Arab. J. Geosci. 2021, 14, 2041. [Google Scholar] [CrossRef]
  35. Kallos, G.; Papadopoulos, A.; Katsafados, P.; Nickovic, S. Transatlantic Saharan dust transport: Model simulation and results. J. Geophys. Res. Atmos. 2006, 111, D09204. [Google Scholar] [CrossRef] [Green Version]
  36. Gong, S.L.; Zhang, X.Y.; Zhao, T.L.; McKendry, I.G.; Jaffe, D.A.; Lu, N.M. Characterization of soil dust aerosol in China and its transport and distribution during 2001 ACE-Asia: 2. Model simulation and validation. J. Geophys. Res. Atmos. 2003, 108. [Google Scholar] [CrossRef]
  37. Ginoux, P.; Prospero, J.M.; Torres, O.; Chin, M. Long-term simulation of global dust distribution with the GOCART model: Correlation with North Atlantic Oscillation. Environ. Model. Softw. 2004, 19, 113–128. [Google Scholar] [CrossRef]
  38. Yue, X.; Wang, H.; Wang, Z.; Fan, K. Simulation of dust aerosol radiative feedback using the Global Transport Model of Dust: 1. Dust cycle and validation. J. Geophys. Res. Atmos. 2009, 114. [Google Scholar] [CrossRef]
  39. Konsta, D.; Binietoglou, I.; Gkikas, A.; Solomos, S.; Marinou, E.; Proestakis, E.; Basart, S.; García-Pando, C.P.; El-Askary, H.; Amiridis, V. Evaluation of the BSC-DREAM8b regional dust model using the 3D LIVAS-CALIPSO product. Atmos. Environ. 2018, 195, 46–62. [Google Scholar] [CrossRef]
  40. Sugimoto, N.; Hara, Y.; Shimizu, A.; Yumimoto, K.; Uno, I.; Nishikawa, M. Comparison of surface observations and a regional dust transport model assimilated with lidar network data in Asian dust event of March 29 to April 2, 2007. Sola 2011, 7, 13–16. [Google Scholar] [CrossRef] [Green Version]
  41. Haustein, K.; Pérez, C.; Baldasano, J.M.; Jorba, O.; Basart, S.; Miller, R.L.; Janjic, Z.; Black, T.; Nickovic, S.; Todd, M.C.; et al. Atmospheric dust modeling from meso to global scales with the online NMMB/BSC-Dust model–Part 2: Experimental campaigns in Northern Africa. Atmos. Chem. Phys. 2012, 12, 2933–2958. [Google Scholar] [CrossRef] [Green Version]
  42. Mahowald, N.; Albani, S.; Kok, J.F.; Engelstaeder, S.; Scanza, R.; Ward, D.S.; Flanner, M.G. The size distribution of desert dust aerosols and its impact on the Earth system. Aeolian Res. 2014, 15, 53–71. [Google Scholar] [CrossRef] [Green Version]
  43. Terradellas, E.; Basart, S.; Schulz, M.; Baldasano, J.M.; Morcrette, J.J.; Pejanovic, G.; Menut, L.; Benedetti, A.; Jorba, O.; Nickovic, S.; et al. Intercomparison of dust prediction models in the framework of the WMO SDS-WAS programme. Geophys. Res 2012, 114, D06206. [Google Scholar]
  44. Balkanlou, K.R.; Müller, B.; Cord, A.F.; Panahi, F.; Malekian, A.; Jafari, M.; Egli, L. Spatiotemporal dynamics of ecosystem services provision in a degraded ecosystem: A systematic assessment in the Urmia Lake basin, Iran. Sci. Total Environ. 2020, 716, 137100. [Google Scholar] [CrossRef]
  45. Soudi, M.; Ahmadi, H.; Yasi, M.; Hamidi, S.A. Sustainable restoration of Lake Urmia: History, threats, opportunities, and challenges. Eur. Water 2017, 60, 341–347. [Google Scholar]
  46. Vaheddoost, B.; Aksoy, H. Interaction of groundwater within Lake Urmia Iran. Hydrol. Processes 2018, 32, 3283–3295. [Google Scholar]
  47. Martha, T.R.; Kerle, N.; Jetten, V.; van Westen, C.J.; Kumar, K.V. Characterizing spectral, spatial, and morphometric properties of landslides for semi-automatic detection using object-oriented methods. Geomorphology 2010, 116, 24–36. [Google Scholar] [CrossRef]
  48. Sima, S.; Ahmadalipour, A.; Shafiee Jood, M.; Tajrishy, M.; Abrishamchi, A. Monitoring Lake Urmia Area Variations Using MODIS Satellite Data. In Proceedings of the World Environmental and Water Resources Congress 2012: Crossing Boundaries, Albuquerque, NM, USA, 20–24 May 2012; ASCE: Reston, VA, USA, 2012; pp. 1917–1926. [Google Scholar]
  49. Available online: https://giovanni.gsfc.nasa.gov (accessed on 10 November 2021).
  50. Habibi, M.; Babaeian, I.; Schöner, W. Changing Causes of Drought in Lake Urmia Basin—Increasing Influence of Evaporation and Disappearing Snow Cover. Water 2021, 13, 3273. [Google Scholar] [CrossRef]
  51. McNally, A.; Arsenault, K.; Kumar, S.; Shukla, S.; Peterson, P.; Wang, S.; Funk, C.; Peters-Lidard, C.D.; Verdin, J.P. A land data assimilation system for sub-Saharan Africa food and water security applications. Sci. Data 2017, 4, 170012. [Google Scholar] [CrossRef] [PubMed] [Green Version]
  52. Available online: https://sds-was.aemet.es/forecast-products/dust-forecasts (accessed on 12 October 2021).
  53. Basart, S.; Terradellas, E.; Cuevas, E.; Jorba, O.; Benincasa, F.; Baldasano, J.M. The Barcelona Dust Forecast Center: The first WMO regional meteorological center specialized in atmospheric sand and dust forecast. In Proceedings of the EGU General Assembly Conference Abstracts, Vienna, Austria, 2–17 April 2015; p. 13309. [Google Scholar]
  54. Nikfal, A.; Saadatabadi, A.R.; Rahnama, M.; Tajbakhsh, S.; Moradi, M. Intercomparisons of some dust models over West Asia. In E3S Web of Conferences; EDP Sciences: Paris, France, 2019; Volume 99, p. 01012. [Google Scholar]
  55. Karami, S.; Hamzeh, N.H.; Noori, F.; Abadi, A.R.S. Investigation of dust storms in Ilam and the performance analysis of simulation of 6 numerical prediction models at a severe dust storm in the west of Iran. J. Air Pollut. Health 2019, 4, 133–146. [Google Scholar] [CrossRef]
  56. Karami, S.; Hamzeh, N.H.; Kaskaoutis, D.G.; Rashki, A.; Alam, K.; Ranjbar, A. Numerical simulations of dust storms originated from dried lakes in central and southwest Asia: The case of the Aral Sea and Sistan Basin. Aeolian Res. 2021, 50, 100679. [Google Scholar] [CrossRef]
  57. Hamzeh, N.H.; Karami, S.; Kaskaoutis, D.G.; Tegen, I.; Moradi, M.; Opp, C. Atmospheric dynamics and numerical simulations of six frontal dust storms in the Middle East region. Atmosphere 2021, 12, 125. [Google Scholar] [CrossRef]
  58. Mircea, M.; D’Isidoro, M.; Maurizi, A.; Vitali, L.; Monforti, F.; Zanini, G.; Tampieri, F. A comprehensive performance evaluation of the air quality model BOLCHEM to reproduce the ozone concentrations over Italy. Atmos. Environ. 2008, 42, 1169–1185. [Google Scholar] [CrossRef]
  59. Maurizi, A.; D’Isidoro, M.; Mircea, M. BOLCHEM: An integrated system for atmospheric dynamics and composition. In Integrated Systems of Meso-Meteorological and Chemical Transport Models; Springer: Berlin/Heidelberg, Germany, 2010; pp. 89–94. [Google Scholar]
  60. Buzzi, A.; D’isidoro, M.; Davolio, S. A case study of an orographic cyclone south of the Alps during the MAP SOP. Q. J. R. Meteorol. Soc. 2003, 129, 1795–1818. [Google Scholar] [CrossRef]
  61. Nickovic, S.; Kallos, G.; Papadopoulos, A.; Kakaliagou, O. A model for prediction of desert dust cycle in the atmosphere. J. Geophys. Res. Atmos. 2001, 106, 18113–18129. [Google Scholar] [CrossRef] [Green Version]
  62. Tegen, I.; Fung, I. Modeling of mineral dust in the atmosphere: Sources, transport, and optical thickness. J. Geophys. Res. Atmos. 1994, 99, 22897–22914. [Google Scholar] [CrossRef]
  63. Janjic, Z.I.; Gerrity, J.P.; Nickovic, S. An alternative approach to non-hydrostatic modeling. Mon. Weather Rev. 2001, 129, 1164–1178. [Google Scholar] [CrossRef]
  64. Ginoux, P.; Chin, M.; Tegen, I.; Prospero, J.M.; Holben, B. Sources and distributions of dust aerosols simulated with the GOCART model. J. Geophys. Res. 2001, 106, 20255–20273. [Google Scholar] [CrossRef]
  65. Shao, Y.; Raupach, M.R.; Findlater, P.A. Effect of saltation bombardment on the entrainment of dust by wind. J. Geophys. Res. Atmos. 1993, 98, 12719–12726. [Google Scholar] [CrossRef] [Green Version]
  66. Janjić, Z.I. The step-mountain eta coordinate model: Further developments of the convection, viscous sublayer, and turbulence closure schemes. Mon. Weather Rev. 1994, 122, 927–945. [Google Scholar] [CrossRef] [Green Version]
  67. Marticorena, B.; Bergametti, G. Modeling the atmospheric dust cycle: 1. Design of a soil-derived dust emission scheme. J. Geophys. Res. Atmos. 1995, 100, 16415–16430. [Google Scholar] [CrossRef] [Green Version]
  68. Grell, G.A.; Peckham, S.E.; Schmitz, R.; McKeen, S.A.; Frost, G.; Skamarock, W.C.; Eder, B. Fully coupled “online” chemistry within the WRF model. Atmos. Environ. 2005, 39, 6957–6975. [Google Scholar] [CrossRef]
  69. Abbasian, M.S.; Najafi, M.R.; Abrishamchi, A. Increasing risk of meteorological drought in the Urmia Lake basin under climate change: Introducing the precipitation–temperature deciles index. J. Hydrol. 2021, 592, 125586. [Google Scholar] [CrossRef]
  70. Ravan, P.; Ahmady-Birgani, H.; Sorooshian, A. Spatial Mapping of Elemental Variabilities of Atmospheric Particulates throughout the Basin. J. Earth Space Phys. 2019, 45, 667–686. [Google Scholar]
  71. Gholampour, A.; Nabizadeh, R.; Naseri, S.; Yunesian, M.; Taghipour, H.; Rastkari, N.; Nazmara, S.; Faridi, S.; Mahvi, A.H. Exposure and health impacts of outdoor particulate matter in two urban and industrialized areas of Tabriz, Iran. J. Environ. Health Sci. Eng. 2014, 12, 127. [Google Scholar] [CrossRef] [Green Version]
  72. Xu, X.; Levy, J.K.; Zhaohui, L.; Hong, C. An investigation of sand–dust storm events and land surface characteristics in China using NOAA NDVI data. Glob. Planet. Chang. 2006, 52, 182–196. [Google Scholar] [CrossRef]
  73. Lee, J.J.; Kim, C.H. Roles of surface wind, NDVI, and snow cover in the recent changes in Asian dust storm occurrence frequency. Atmos. Environ. 2012, 59, 366–375. [Google Scholar] [CrossRef]
  74. Hamzeh, N.H.; Kaskaoutis, D.G.; Rashki, A.; Mohammadpour, K.B. Long-Term Variability of Dust Events in Southwestern Iran and Its Relationship with the Drought. Atmosphere 2021, 12, 1350. [Google Scholar] [CrossRef]
  75. Mardi, A.H.; Khaghani, A.; MacDonald, A.B.; Nguyen, P.; Karimi, N.; Heidary, P.; Karimi, N.; Saemian, P.; Sehatkashani, S.; Tajrishy, M.; et al. The Lake Urmia environmental disaster in Iran: A look at aerosol pollution. Sci. Total Environ. 2018, 633, 42–49. [Google Scholar] [CrossRef] [PubMed]
  76. Delfi, S.; Mosaferi, M.; Hassanvand, M.S.; Maleki, S. Investigation of aerosol pollution across the eastern basin of Lake Urmia using satellite remote sensing data and HYSPLIT model. J. Environ. Health Sci. Eng. 2019, 17, 1107–1120. [Google Scholar] [CrossRef] [PubMed]
  77. Moghim, S.; Ramezanpoor, R. Characterization of aerosol types over the lake Urmia Basin. In E3S Web of Conferences; EDP Sciences: Paris, France, 2019; Volume 99, p. 01006. [Google Scholar]
  78. Ahmady-Birgani, H.; Ravan, P.; Schlosser, J.S.; Cuevas-Robles, A.; AzadiAghdam, M.; Sorooshian, A. On the chemical nature of wet deposition over a major desiccated lake: A case study for the Lake Urmia basin. Atmos. Res. 2020, 234, 104762. [Google Scholar] [CrossRef]
  79. Dehghani, M.H.; Hopke, P.K.; Asghari, F.B.; Mohammadi, A.A.; Yousefi, M. The effect of the decreasing level of Lake Urmia on particulate matter trends and attributed health effects in Tabriz, Iran. Microchem. J. 2020, 153, 104434. [Google Scholar] [CrossRef]
  80. Rashki, A.; Middleton, N.J.; Goudie, A.S. Dust storms in Iran–Distribution, causes, frequencies, and impacts. Aeolian Res. 2021, 48, 100655. [Google Scholar] [CrossRef]
  81. Boueshagh, M.; Hasanlou, M. Estimating Water Level in Lake Urmia Using Satellite Data: A Machine Learning Approach. Int. Arch. Photogramm. Remote Sens. Spat. Inf. Sci. 2019, 42, 219–226. [Google Scholar] [CrossRef] [Green Version]
  82. Rashki, A.; Kaskaoutis, D.G.; Sepehr, A. Statistical evaluation of the dust events at selected stations in Southwest Asia: From the Caspian Sea to the Arabian Sea. Catena 2018, 165, 590–603. [Google Scholar] [CrossRef]
  83. Notaro, M.; Alkolibi, F.; Fadda, E.; Bakhrjy, F. Trajectory analysis of Saudi Arabian dust storms. J. Geophys. Res. Atmos. 2013, 118, 6028–6043. [Google Scholar] [CrossRef]
  84. Nabavi, S.O.; Haimberger, L.; Samimi, C. Sensitivity of WRF-chem predictions to dust source function specification in West Asia. Aeolian Res. 2017, 24, 115–131. [Google Scholar] [CrossRef]
  85. Abuduwaili, J.; Liu, D.; Wu, G. Saline dust storms and their ecological impacts in arid regions. J. Arid Land 2010, 2, 144–150. [Google Scholar] [CrossRef] [Green Version]
Figure 1. Study area with the six synoptic weather stations and Lake Urmia in NW Iran.
Remotesensing 14 02145 g001
Figure 2. MODIS True-color satellite images of different water coverage in Lake Urmia in the December of 2000 (a) and 2017 (b).
Remotesensing 14 02145 g002
Figure 3. The number of dusty days and wind rose in dusty days in weather stations of Urmia (a,b), Bonab (c,d), and Salmas (e,f) in 18 years from 2000 to 2017.
Remotesensing 14 02145 g003aRemotesensing 14 02145 g003b
Figure 4. The dominant wind direction in the six nearest weather stations around Lake Urmia from 2000 to 2017.
Remotesensing 14 02145 g004
Figure 5. Spatial distribution of MODIS/Terra (a) mean AOD 550, (b) mean NDVI, and (c) Temporal distribution of AOD 550 nm (red bars) and NDVI (black lines) from 2000 to 2017.
Remotesensing 14 02145 g005
Figure 6. Time series of MODIS/Terra mean aerosol optical depth (red bars) at 550 nm (AOD 550) and mean annual snowfall rate (blue bars) in kg m−2s−1 from 2000 to 2017.
Remotesensing 14 02145 g006
Figure 7. The weather stations that reported dust related codes data around Lake Urmia on (a) 27 October (b) 28 October (c) 29 October (d) 30 October 2017.
Remotesensing 14 02145 g007
Figure 8. MODIS true-color image of Aqua on (a) 26 October, (b) 27 October, (c) 28 October, and (d) 29 October 2017. Orange arrows show dust transportation.
Remotesensing 14 02145 g008
Figure 9. The output of HYSPLIT Model in forwarding trajectory method, at 12 UTC on the 27 October 2017.
Remotesensing 14 02145 g009
Figure 10. The surface dust concentration (μg/m3) of the four models’ output at 09 UTC on 27 October 2017 and Aqua satellite (overpasses 09 UTC) with AOD (0 to 5). (a) DREAM_MACC; (b) DREAMABOL; (c) NCEP_NGAC; (d) NOAA/WRF-Chem; (e) MODIS AOD.
Remotesensing 14 02145 g010aRemotesensing 14 02145 g010b
Figure 11. The PM10 concentration (μg/m3) of the four models output and the dust monitoring stations in (a) Urmia (b) Bokan (c) Sardasht stations around Lake Urmia from 27 to 30 October.
Remotesensing 14 02145 g011aRemotesensing 14 02145 g011b
Table 1. The six synoptic weather stations around Lake Urmia and the mean annual number of dust days during 2000–2017.
Synoptic StationLongitudeLatitudeElevationMean Number of Dust Days
Urmia45.0837.55132815.5
Tabriz46.2735.7136133.11
Salmas44.7738.021339.38.7
Bonab46.0537.34128116
Bokan46.236.511386.128.07
Sardasht45.4736.161556.827.55
Table 2. The dust-related present weather codes.
06Widespread dust in suspension, not raised by wind at or near the station at the time of observation
07Dust or sand raised by wind at or near the station at the time of observation
30–32Slight or moderate sand storms or dust storms
33–35Severe sand storms or dust storms
Table 3. Specifications of selected numerical prediction models.
ModelOperatorMeteorological ModelDust Model, Dust SchemeInitial Weather Condition (Resolution)Resolution (Grid Type)
DREAMABOLthe Institute of Atmospheric Sciences and Climate of Bologna in Italy [58,59]BOLAM equation hydrostation model [60]DREAM [61,62]GFS output (0.5°)0.4° (rotated pole lon-lat)
DREAM8-NMME-MACCSoutheast European Virtual Climat Change Center, SerbiaDREAM8 model by the NCEP Non-Hydrostatic
Mesoscale Model [63],
[65,66]ECMWF (1.5°)1.3°
NCEP-NGACNOAA National Centers for Environmental Prediction (NCEP), in collaboration with NASA Goddard Space Flight Center (GSFC)Global Forecast System (GFS)[66,67]NCEP GDAS (1°)
NOAA/WRF-ChemNational Observatory of AthensWRF [68]GOCART scheme derived from [64]GFS output (0.5°)0.19°
Table 4. Correlation, MAE, and RMSE errors of the output of the four models and measured PM10 in four stations around Lake Urmia.
ModelDREAM-MACCDRAMABOLNOAA/WRF-ChemNCEP-NGAC
Correlation0.360.620.330.32
MAE344.421336.771037.10728.03
Publisher’s Note: MDPI stays neutral with regard to jurisdictional claims in published maps and institutional affiliations.

