1. Introduction
The intensive use of fossil fuels around the world and in Poland is associated not only with the substantial depletion of our resources but also with many other negative consequences. Hard coal and lignite are major contributors to climate change due to the vast amounts of CO
2 released when they are burned. In Poland, the need for coal extraction from deeper seams causes an increase in the total mining cost. This leads to more expensive power generation, which then leads to higher heat and electricity bills. Climate change affects human health negatively through extreme weather events, namely through exposure to extreme temperatures, the transmission of infectious diseases, and exposure to polluted air [
1,
2,
3,
4].
Coal is the primary power source in the energy industry. In 2020, 70% of Poland’s electricity was coal-based [
5]. The demand for electricity in Poland has been steadily growing from 124,000 GWh in 2001 to 170,000 GWh in 2021 [
6]. There are many factors involved; one of them is undoubtedly the increasing number of electric cars, which require charging. Although the forecasts contained in the government’s Electromobility Development Plan (forecasting 1 million vehicles by 2025) will most likely not come true, the number of sales of electric cars is growing [
7], and so the required energy to charge them is expected to increase as well [
7,
8].
Under Polish conditions, it is highly recommended to use new coal combustion technologies, such as modern fluidized bed boilers with CO
2 capture [
9]. However, these innovative solutions are not met with social approval [
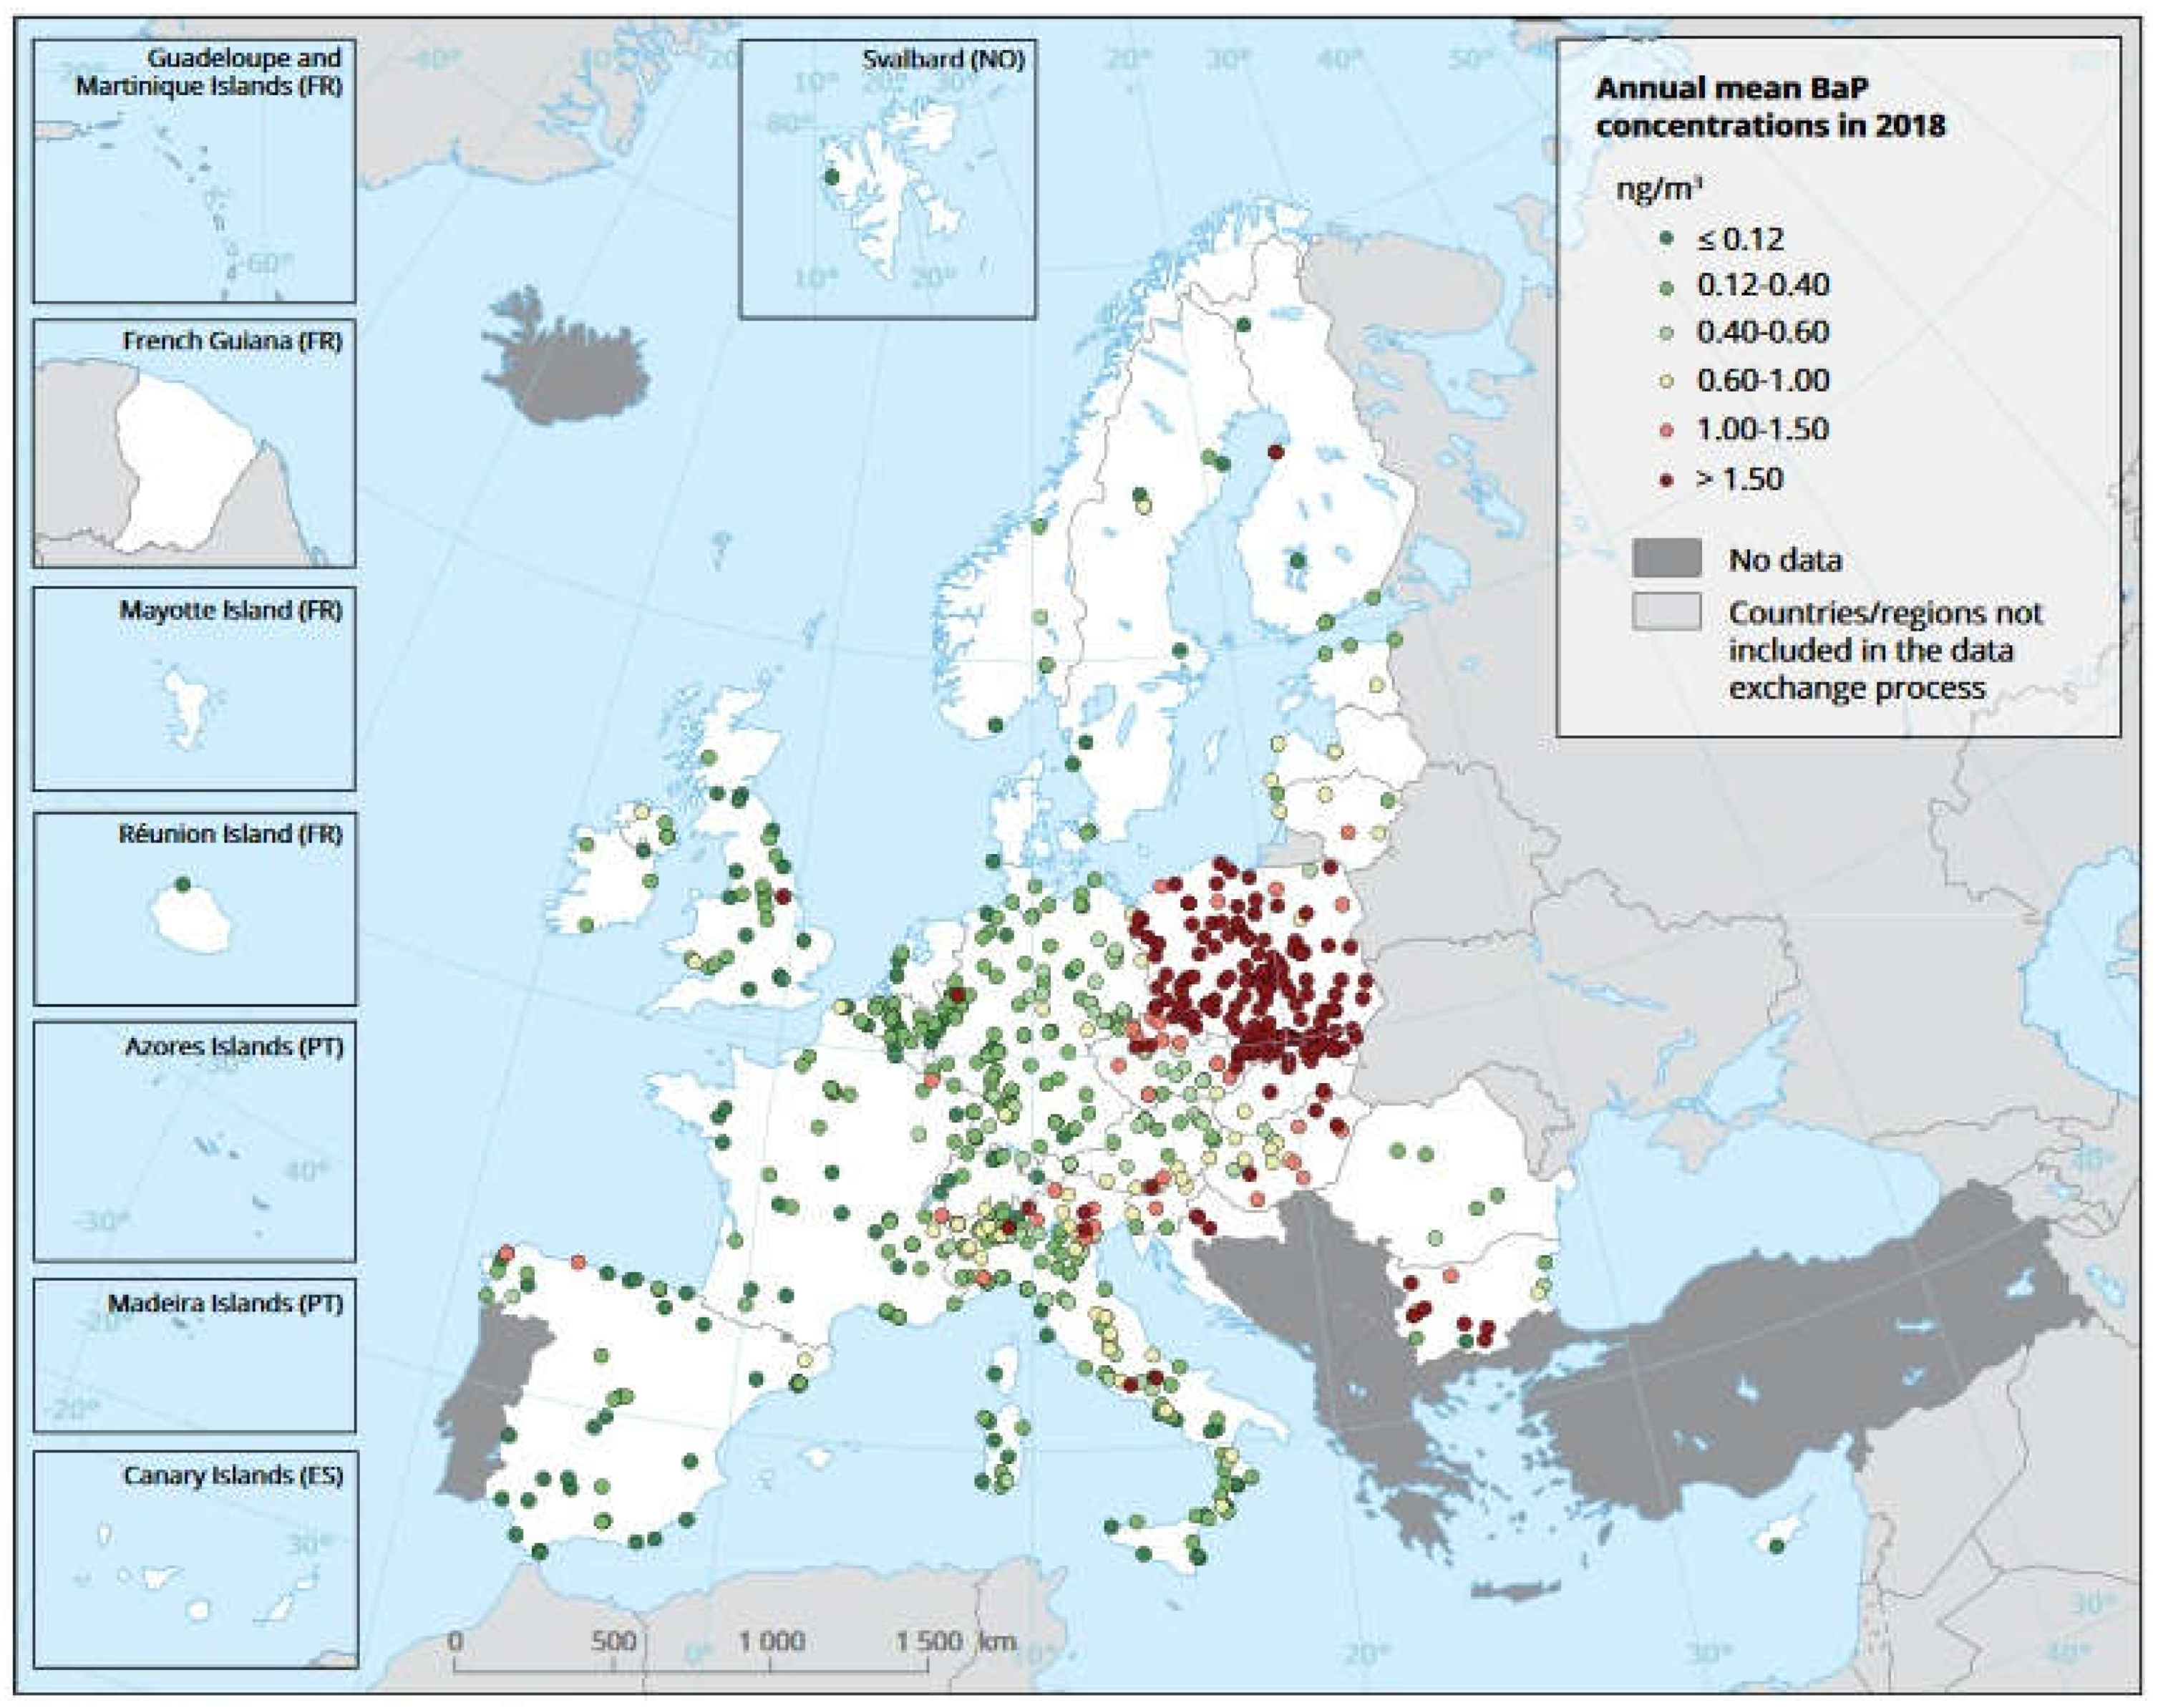
10]. Coal and wood are widely used in Poland for direct heating of private households. As such, PM
10 and PM
2,5 dust, numerous aromatic hydrocarbons (VOC), including carcinogenic benzene(a)pyrene, and NOx are emitted into the atmosphere from these households as part of the so-called ‘low emission’ [
11]. As a result, concertation standards have been exceeded numerous times, especially for dust and BAP (
Figure 1) in the air. These substances are the cause of many diseases, such as allergies and cancer [
2,
3,
12,
13].
Renewable energy sources (RES) are an alternative to conventional fuels. At present, this is the only possible way to prevent the harmful effects of smog and climate change in Poland, as the country does not possess nuclear power plants. In addition, the use of renewable energy is also perceived by the public as a step towards environmental protection and sustainable development.
The basic sources are as follows:
Solar energy;
Wind energy;
Biomass;
Water energy;
Geothermal energy.
However, RES are burdened by natural and legal constraints. Classical geothermal plants and windmills depend strongly on the occurrence of the resource in question. Additionally, Poland has a so-called ‘Distance Act’; this prohibits the construction of windmills closer than ten times their height to existing buildings [
15]. Hence, the use of wind energy is significantly inhibited in Poland.
The use of hydro energy is also limited by the location, as it requires vicinity to a watercourse. Thus, it is not applicable in the case of single-family buildings. Another possible energy source is biomass. It is bio-waste from forest production (such as pieces of wood), suitable for energy production via combustion processes. Thus, a simple stove/boiler is enough to utilize it, which makes it the cheapest RES in terms of installation costs. However, wet biomass burned in domestic conditions is undoubtedly a source of harmful compounds released into the atmosphere. Opposing the idea of RES, this contributes to smog production and also to the related adverse health effects [
16].
Currently, the most common solar energy sources are based on the photovoltaic effect; electricity is directly generated. A less popular approach is based on solar panels, which heat utility water. Heat pumps extract heat from the ground or air and are increasingly used in combination with photovoltaics. Recuperation is a technology that does not use renewable energy directly but does contribute to energy savings.
The efficiency of photovoltaic modules is almost unrelated to location, so they have become the most common distributed energy source (compared to biogas and wind energy) [
17,
18].
Heat pumps that recover thermal energy from the air or ground are gaining more and more popularity. The possibility of installing photovoltaics and heat pumps in virtually any location and meeting one’s energy needs makes them the most attractive among the various renewables.
Single-family housing is suitable for the installation of such systems. There is considerable potential in buildings not used for photovoltaic power generation [
19]. Using photovoltaics in conjunction with heat pumps allows private households to reduce energy consumption, which reduces their electricity bills significantly. Therefore, this solution is most prevalent in countries that want to increase their energy independence and improve their air quality. Surpluses of generated energy can be resold to the power grid according to the so-called net-billing system (a net metering system is in place in Poland for contracts signed until March 2022).
The use of photovoltaics also presents new issues that should be taken into account when promoting these technologies. Particular attention is paid to the so-called chimeric nature [
20] of this energy source and to the constraints imposed by the quality of transmission networks (especially in Poland). According to reference [
21,
22], a large concentration of photovoltaic micro-installations often harms the quality of electricity, which causes inverters to be switched off and makes it difficult for energy services to carry out maintenance work.
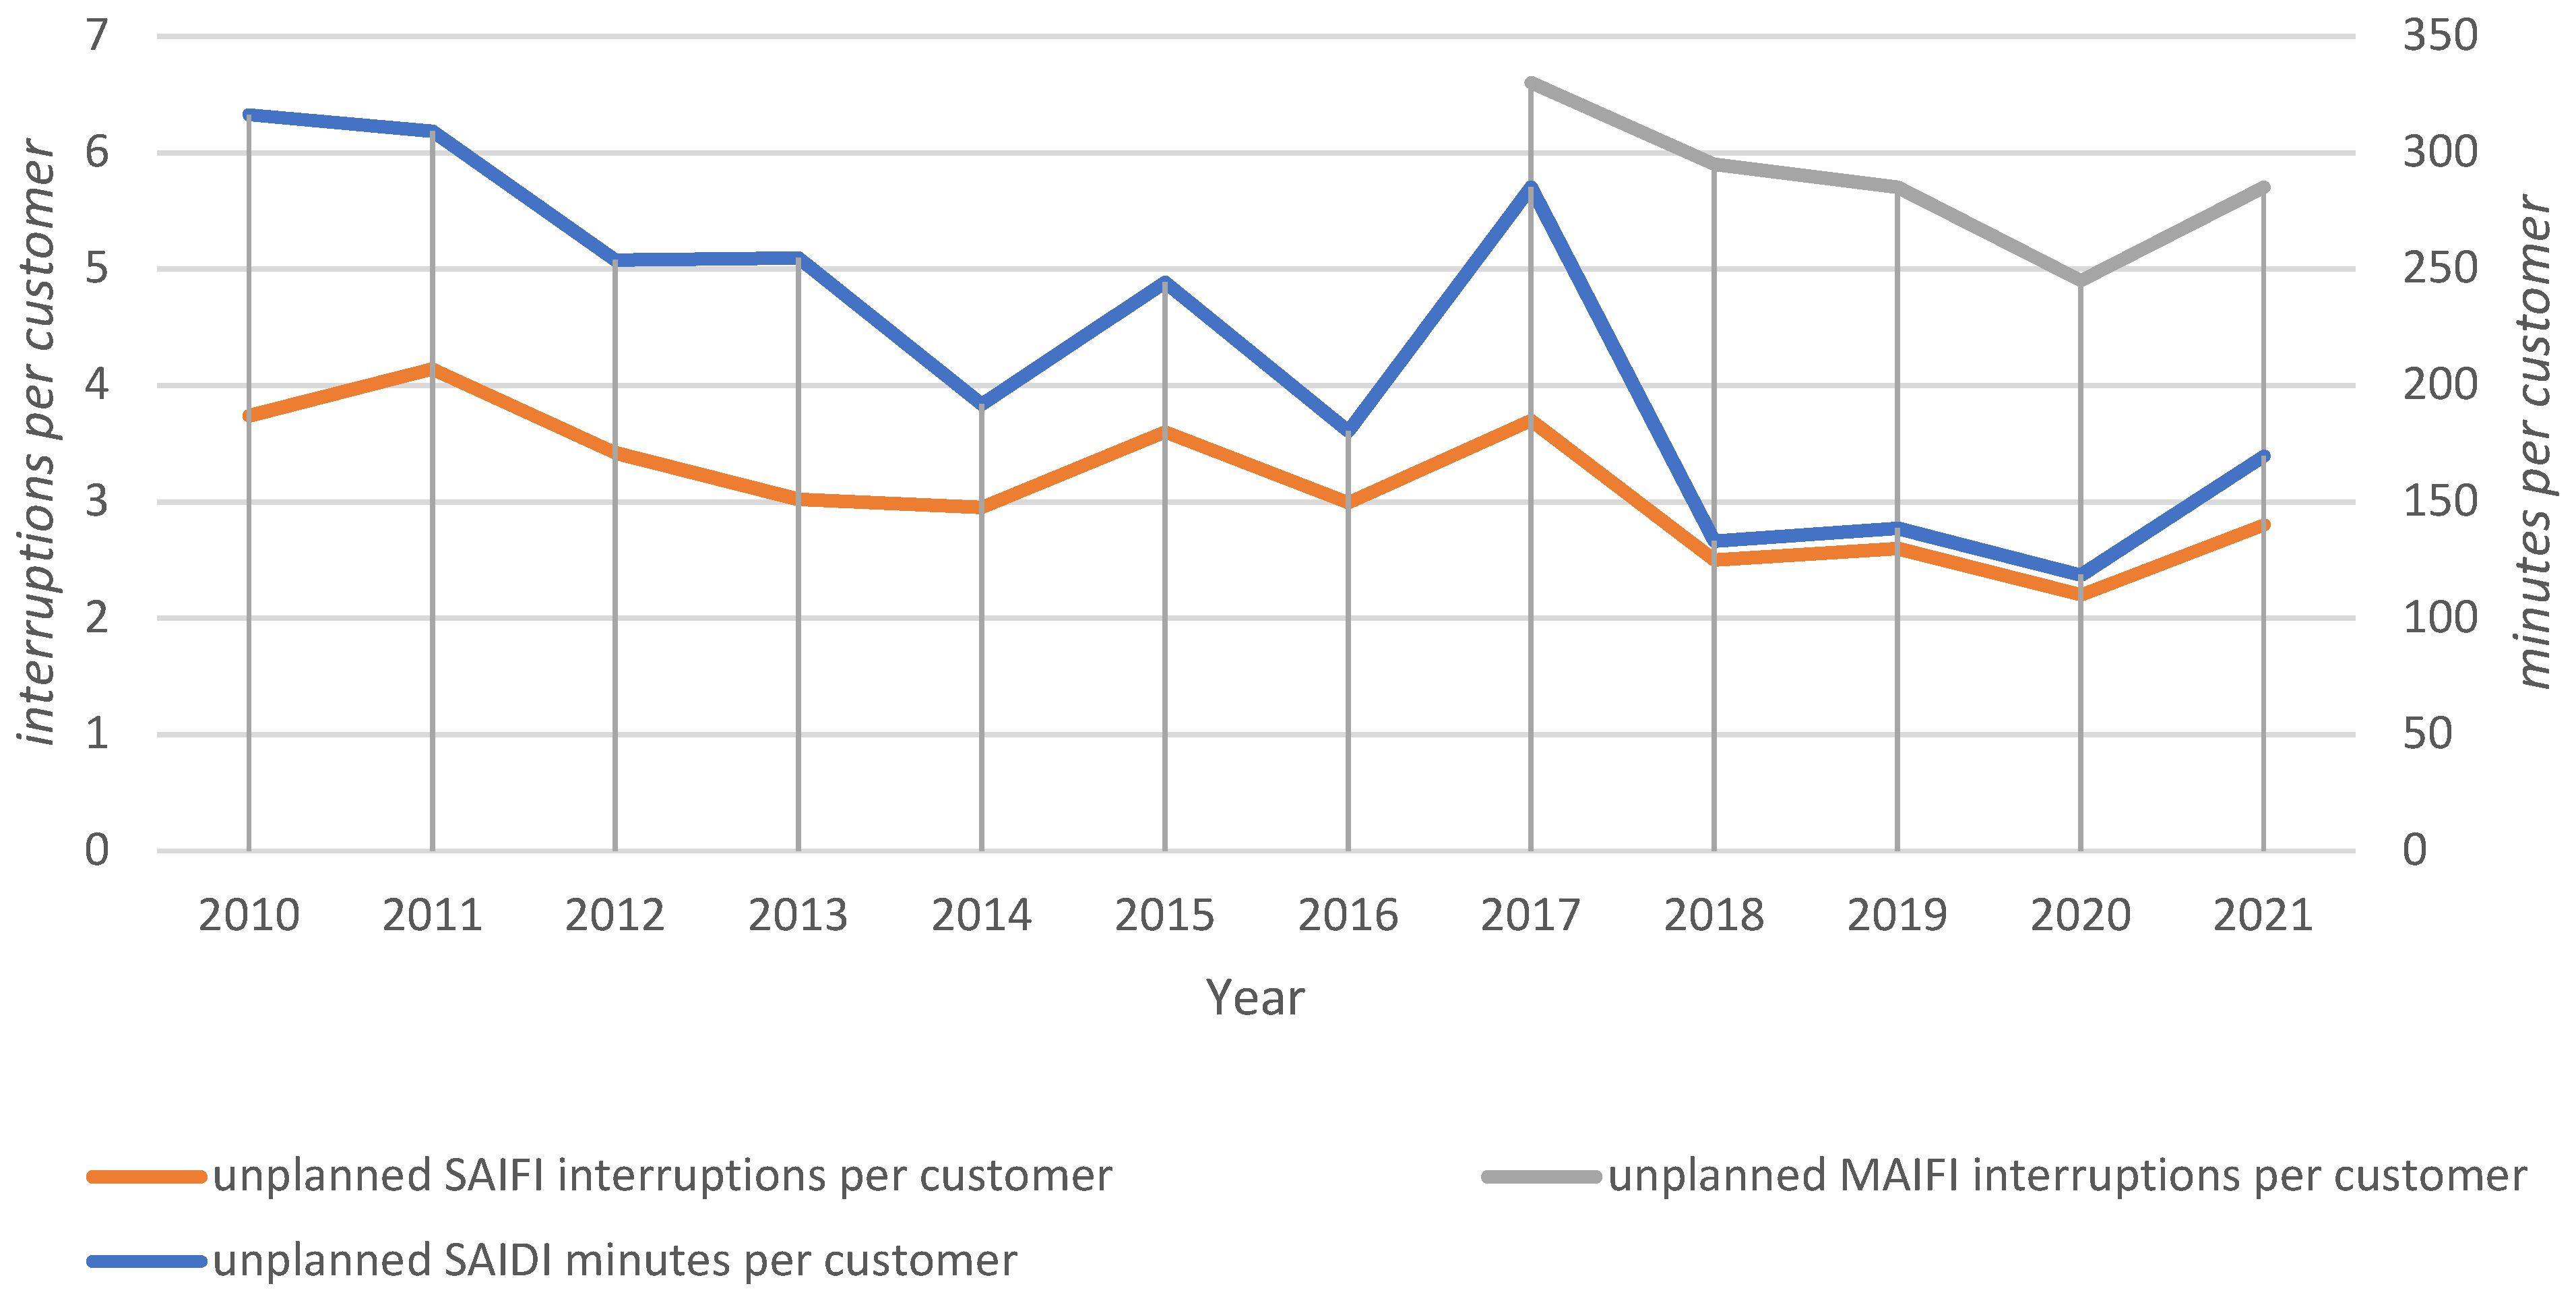
Figure 2 shows the number of failures according to transmission network quality indicators such as SAIDI (System Average Interruption Duration Index), SAIFI (System Average Interruption Frequency Index), and MAIFI (Momentary Average Interruption Frequency Index). The values of these indicators are influenced by climatic conditions, neglected investments in transmission grids [
23,
24], and also an increase in the number of photovoltaic installations [
18,
19].
One way of dealing with these negative consequences is the use of electricity at the place of its production, i.e., in households, for example, using electric water heaters and local energy storage.
In 2024, new regulations in Poland are going to introduce a virtual prosumer [
29]. This is a final consumer who generates electricity solely from RES for their own needs and who is connected to the power distribution network at a different location than their power sources. This may contribute to an even greater load on the transmission network and lead to an increased number of failures. These issues can be prevented by upgrading the transmission network and transitioning to modern solutions, such as the so-called smart grids [
30]. The need for such innovative networks in Poland was already highlighted in 2017 [
31], especially when the increasing use of RES is considered. The most technologically advanced solutions operating within smart grids are “learning” systems of two-way exchange demand-side management (DSM) [
32]. However, in Polish conditions, only a smart meter is most often used, without the possibility of real-time communication [author’s experience].
Technologies using renewables are relatively expensive compared to conventional ones, so investments in renewables are fueled by a diverse set of incentives. The ambitious climate policy of the European Union, together with Poland’s pursuit of energy independence, requires an increase in the share of production from renewable energy sources. Supporting investments in renewables and other pro-ecological technologies seems to be the key to achieving climate and environmental goals and energy independence. In Poland, there are various RES support mechanisms, as follows:
National programs, such as “My Electricity”;
Thermomodernization relief;
Local subsidy programs most often under EU programs.
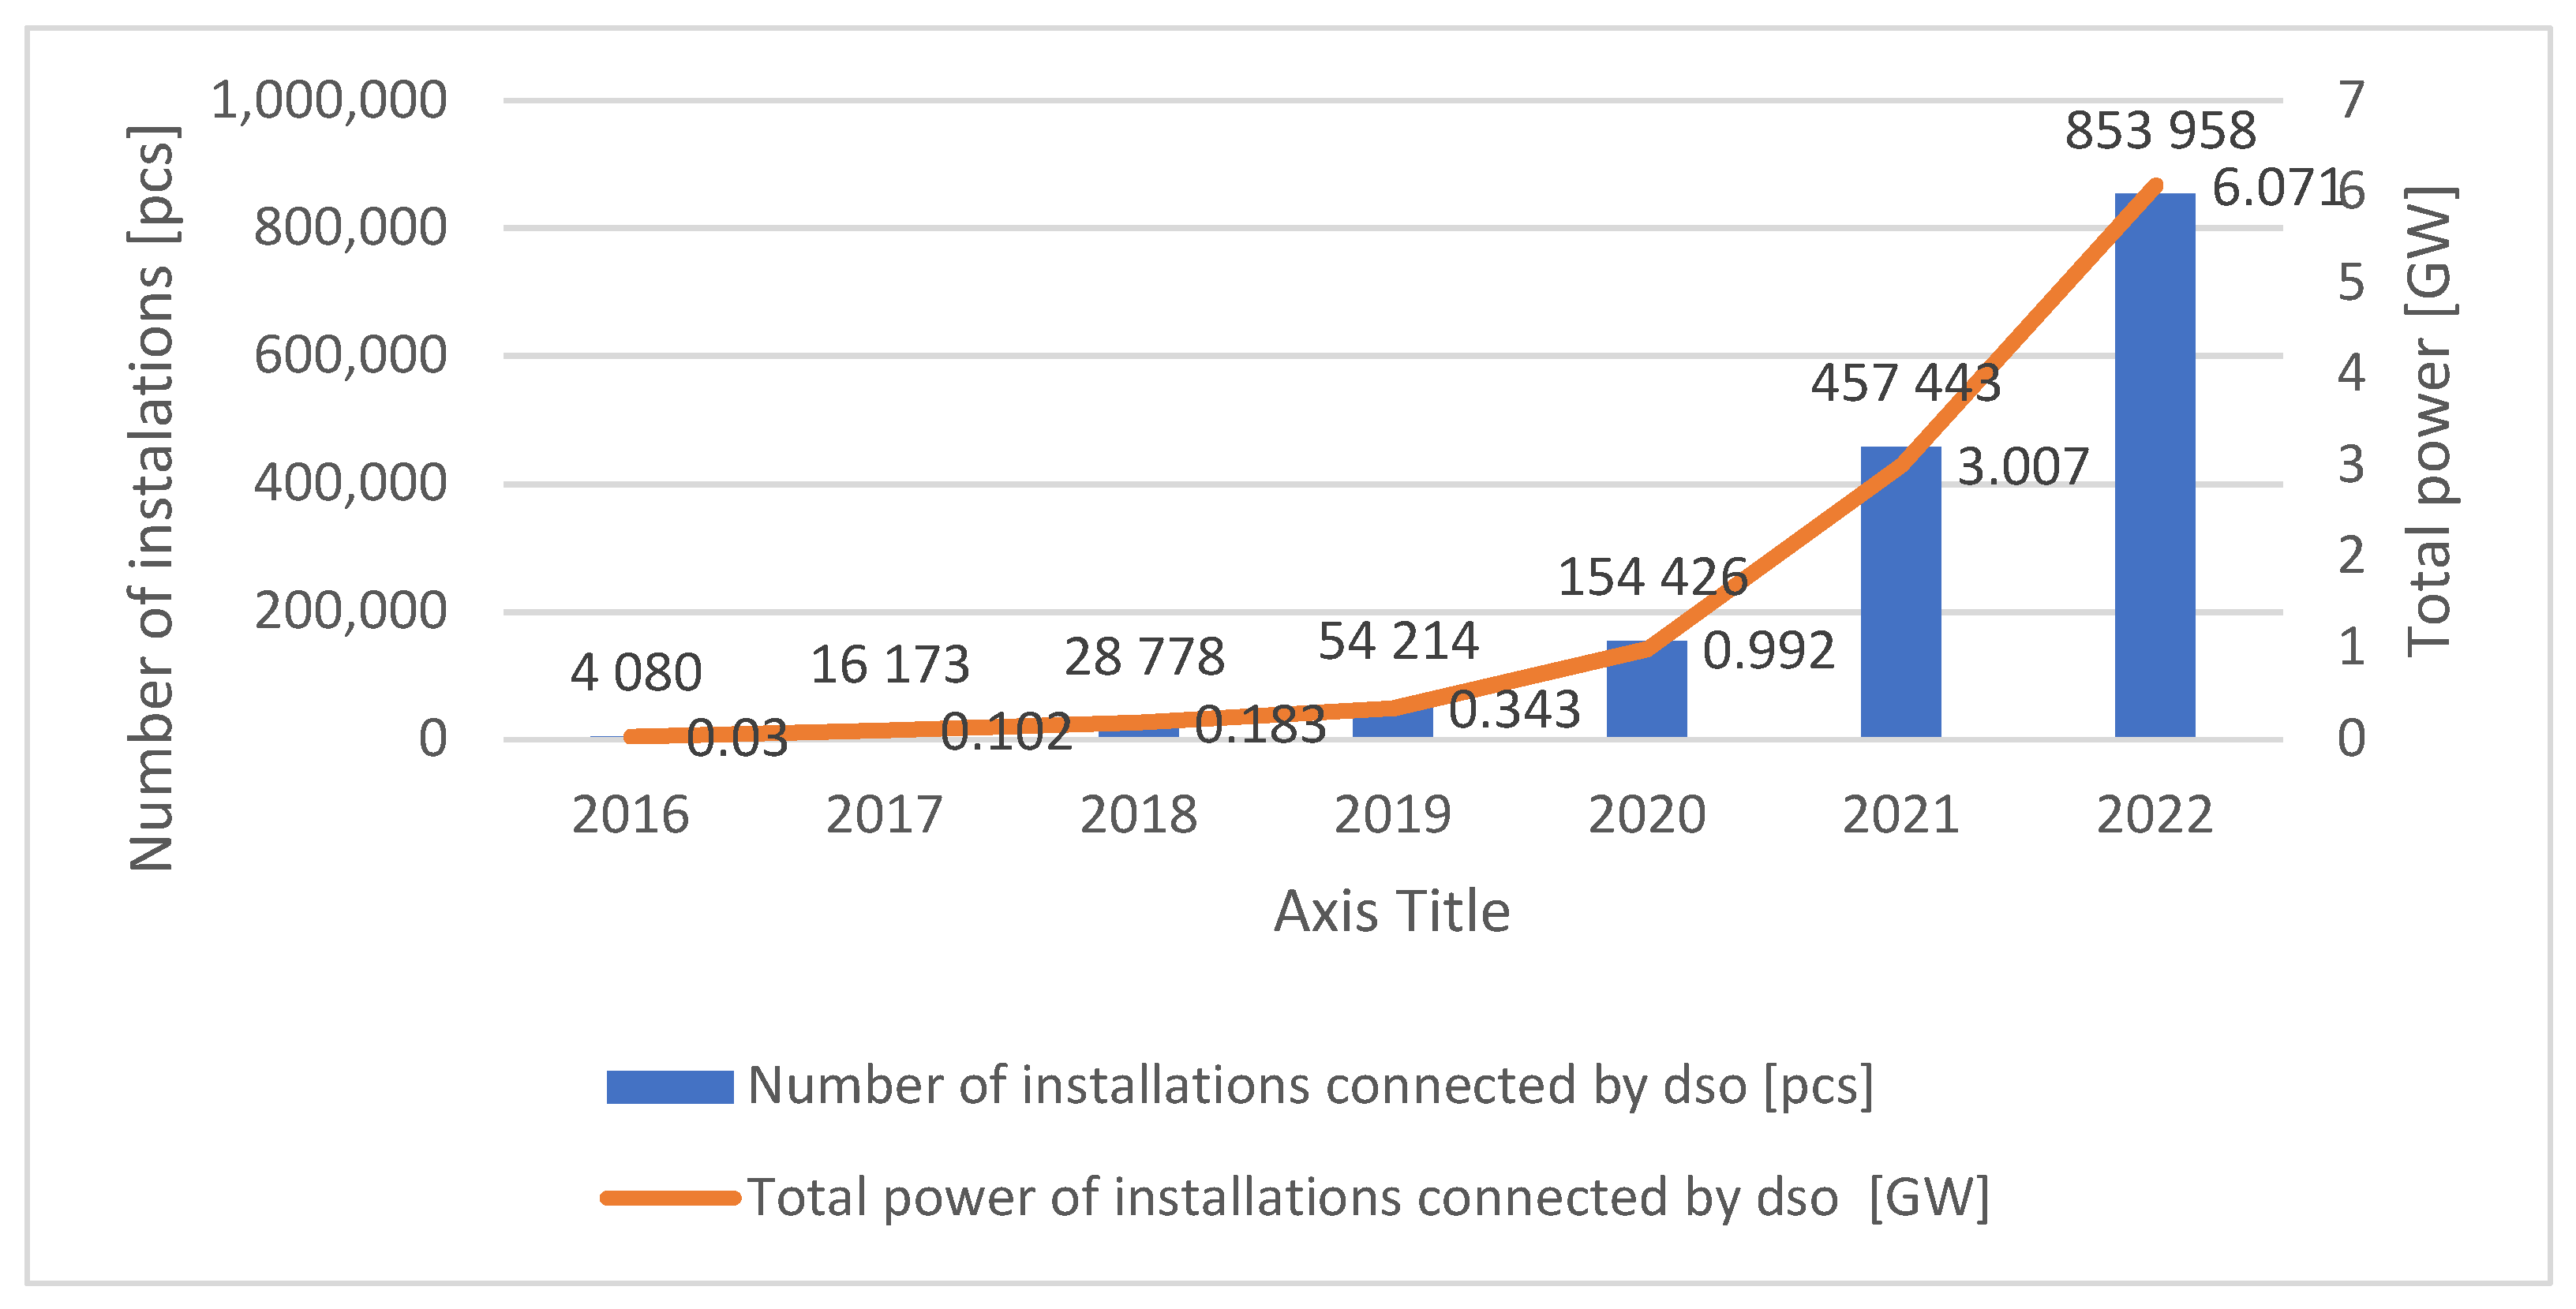
Thanks to these programs, the development of renewable energy in Poland was extremely dynamic. The number and power of installations doubled between 2020 and 2021 (
Figure 3). However, it decreased slightly in 2022 due to the modifications to the ‘My Electricity’ program and to the settlement method. Other factors that may have an impact on the use (number) of RES should also be taken into account. One of them is the COVID-19 pandemic; lockdown and remote work (especially in 2020–2021) have contributed to the increase in residents’ electricity demand. Additionally, in the case of houses heated with electricity, this increase could be significant.
The percentage increase in capacity and number of installations (year on year) is presented in
Table 1.
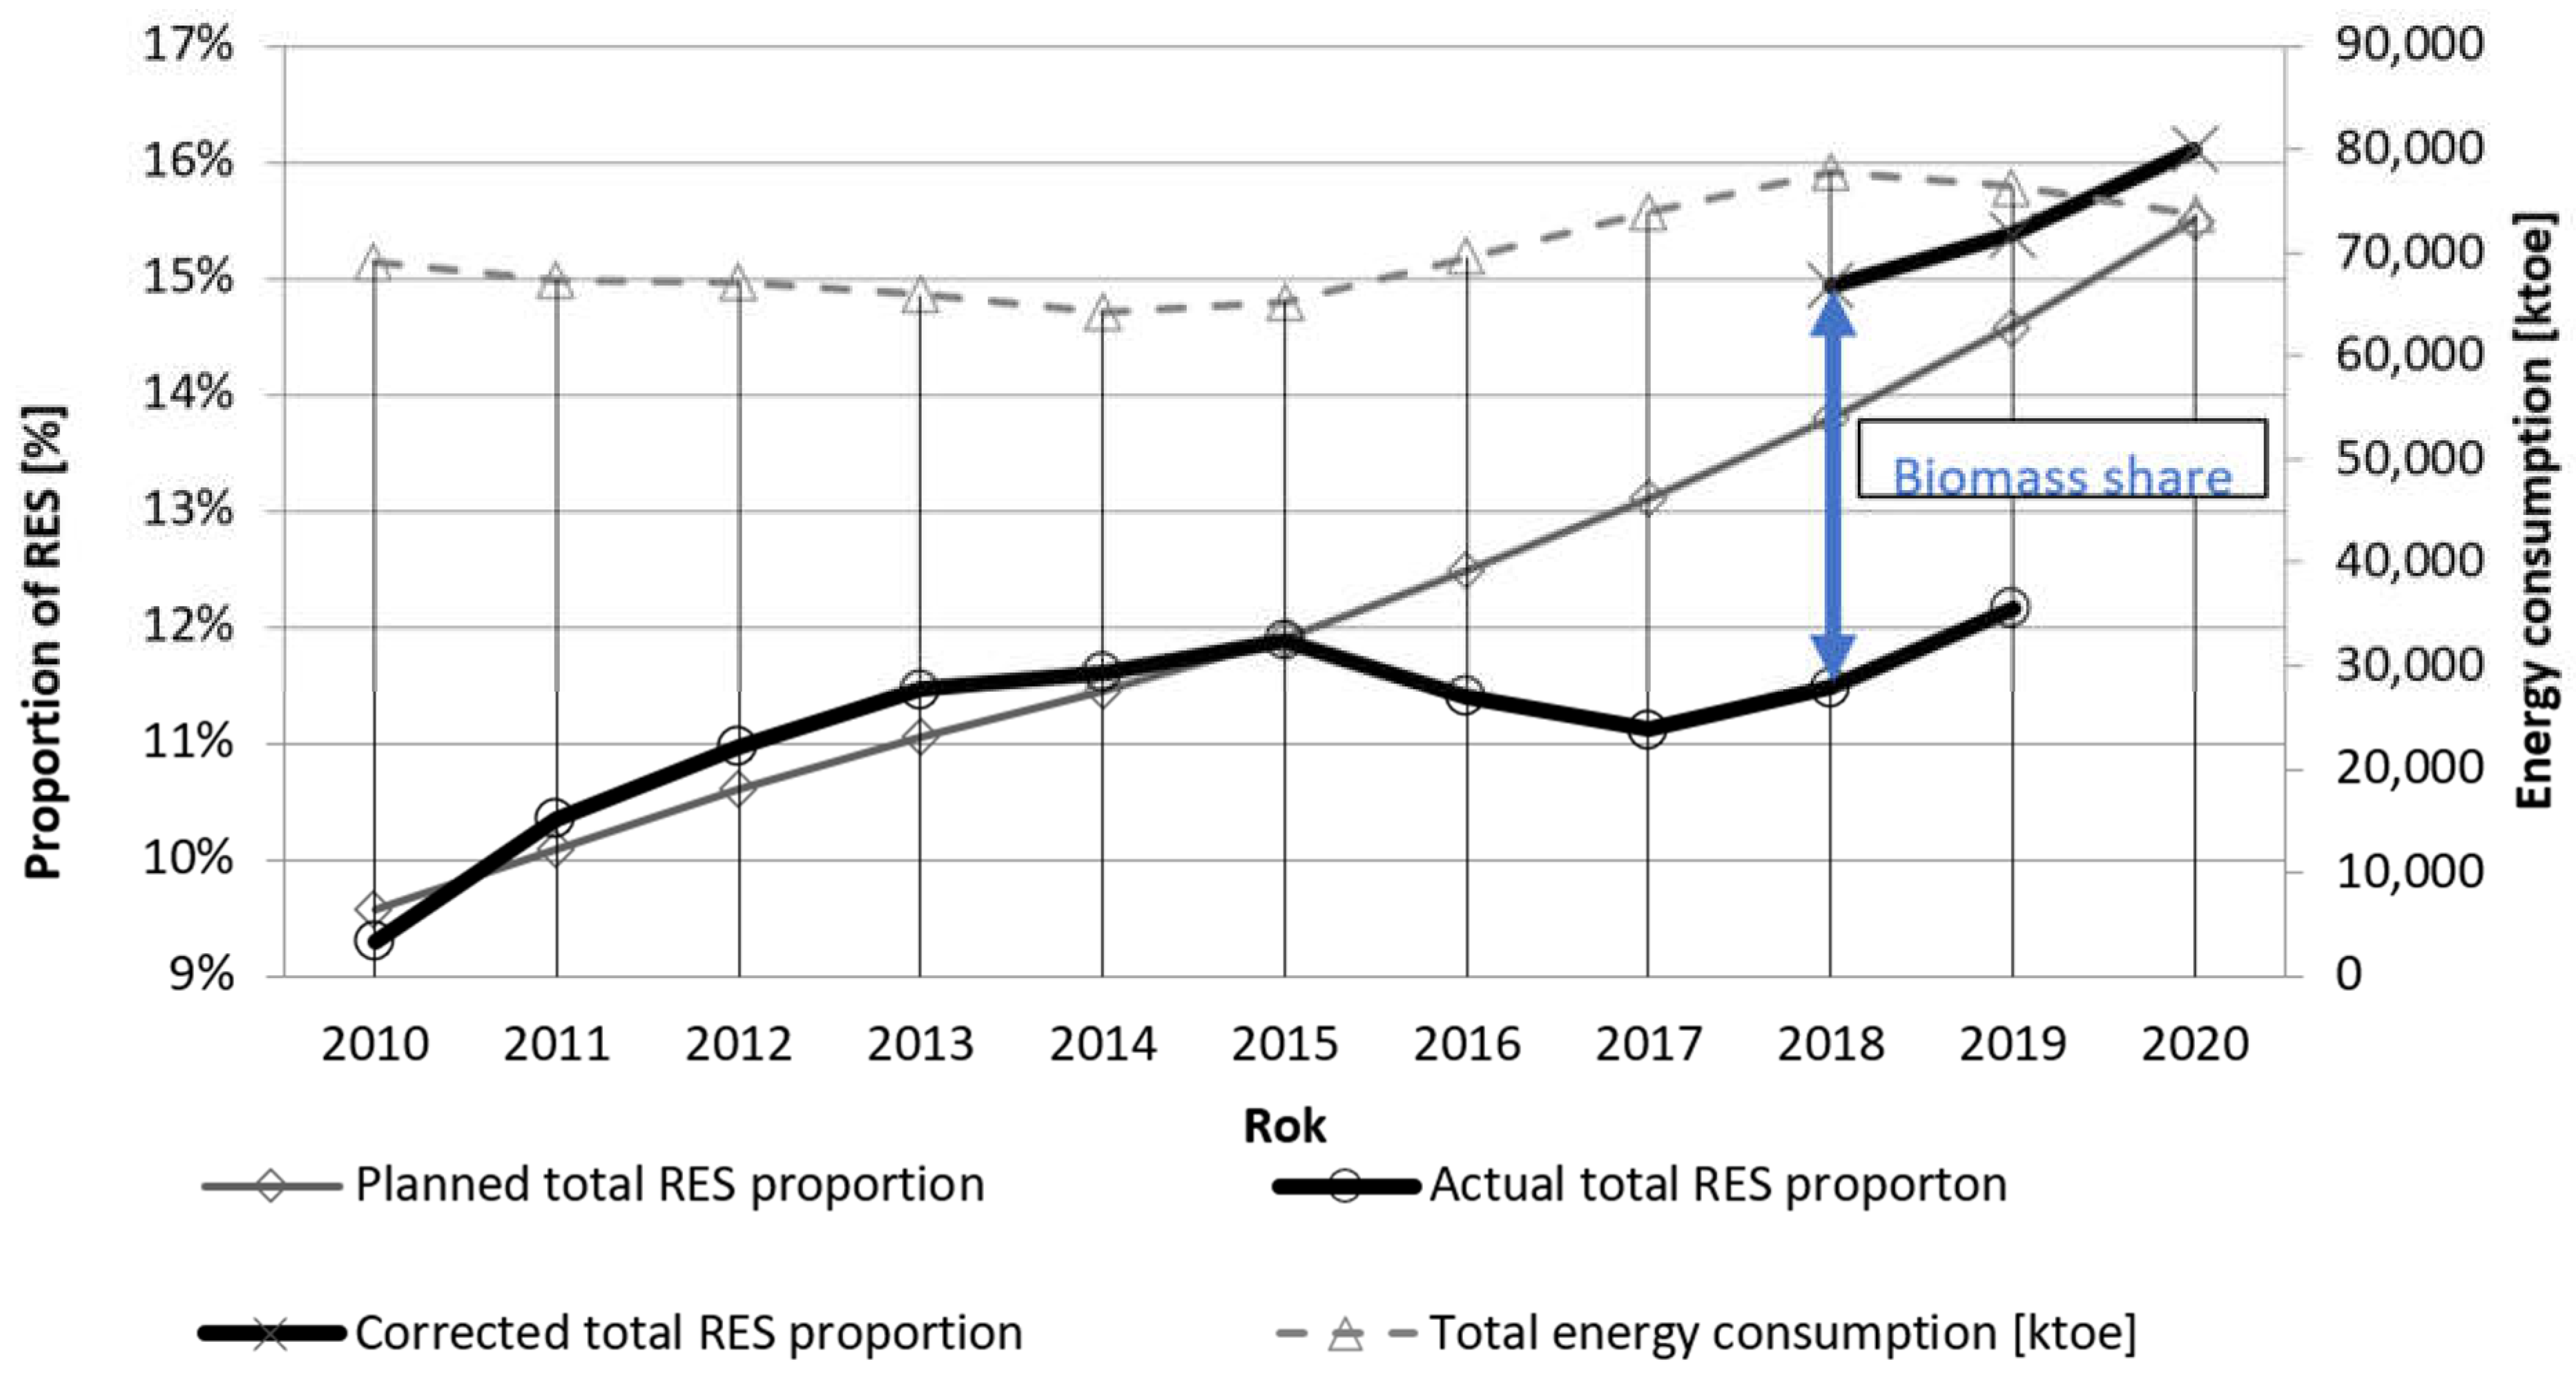
Promoting the use of RES is also important in the context of Poland’s international commitments; in 2018, Poland ratified the Paris Agreements, which were concluded in 2020. These agreements set goals on climate neutrality by 2050 via reducing “European” greenhouse gas emissions by 55%. This will require promoting the use of renewables. Already in 2010, Poland had prepared a national action plan in the field of renewable energy sources for 2010–2020, where the targets for the reduction in the use of non-RES and the share of energy generated from them were established in detail [
19]. From the analyses carried out until 2018, it seemed that the above goals would not be achieved. To meet the Paris Agreement obligations, Poland adjusted the use of renewable energy in 2018–2020 by using biomass in households. Three balance items concerning solid biofuels were corrected, namely extraction, domestic consumption, and final consumption in households [
34]. Thanks to the changed methodology, the objectives of the share of renewables in energy generation have been achieved (
Figure 4). The increased use of biomass affects the smog risk with all its consequences [
35]. There seems to be a purposeful movement away from biomass for energy production and towards alternatives, such as photovoltaic installations.
As already mentioned, promoting renewable energy through a system of financial incentives is crucial. Undoubtedly, one of them is the “My Electricity” program introduced in 2019 [
38]. The impact of previous editions of the My Electricity program has already been researched relatively well [
39,
40,
41]. The previous program aimed to increase the number of prosumers of PV installations among households. In the first round, 28,457 installations were built, and in the second (data as of 14 July 2021), 197,997 were built. The capacities were 158.4 MWp and 1137 MWp, respectively [
42,
43]. This means an eight-fold increase in the number of installations. The current edition extends the catalog of available subsidies to include energy and heat storage facilities, as well as energy management systems. Currently, the goal of the program is to increase the production of electricity from photovoltaic micro-installations or to increase the self-consumption of the generated electricity by storing it (electricity or heat storage). The subsidy will currently cover a maximum of about 15–25% of the price (own calculations based on [
44,
45]). The prices of energy storage are relatively high, and forecasts indicate only moderate price drops, i.e., approximately 20% over the next 10 years [
45]. From March 2022, the transition from the net-metering to the net-billing system has become a requirement to obtain subsidies for RES. This method of settlement was perceived as less profitable for prosumers, which was reflected in the slowdown of investments in photovoltaics in Poland.
The success of the new edition of the “My Electricity” program and the more “sustainable” use of PV installations will depend solely on the investment behavior of single-family house owners. It is crucial to adopt new technologies, such as energy accumulators, and accept a new method of accounting for the energy produced.
The new “deal” introduces changes in Poland to the method of settlement and to the purposes of subsidies for the research on energy consumer preferences, as well as their views on renewable energy. However, this was not of a global nature. The article presents the results of research on consumer preferences in the area of renewable energy for the whole of Poland. We aim to examine the relationship between comprehensive investments in renewable energy sources, i.e., photovoltaics (including energy storage), and other electrical devices in the new edition of the ‘My Electricity’ program.
2. Materials and Methods
Research Gap
The preferences of single-family house owners regarding comprehensive investments and the use of RES in the new conditions of the public subsidy system in Poland are not sufficiently understood. The effects of the “My Electricity” program so far have been researched relatively well. The most important task of the program was to expand the system of prosumer electricity production from photovoltaic cells. Subsequent editions of the program led to a substantial increase in installation numbers and their total capacity. The popularity of the subsidy system in Poland is very high. Almost every investment in photovoltaic systems has been made with the use of a subsidy system. This was due to the efficiency of installation companies that provided their customers with formalities related to obtaining subsidies. The priority in the current edition of the “My Electricity” program is energy storage and the use of energy produced at the place of production. This is a derivative of the increasing load on power grids caused by the rapidly growing popularity of the analyzed investments. In the context of moving away from direct subsidies for photovoltaics in Poland, it is crucial to study the preferences of single-family house owners regarding future RES investments.
Due to the assumptions of the new subsidy program, two complementary systems are currently critical, namely the use of electricity generated in single-family buildings for heating purposes (heat pump) or its storage either in electric batteries or in the form of heat, and then its subsequent use at the place of generation. It should be noted that the current subsidy system ceases the co-financing of photovoltaics, which means that prosumers will be forced to invest a lot more of their own financial resources than before. Therefore, there is a genuine reason to believe that people who currently own photovoltaic systems will be more likely to install complementary systems than people who have not yet taken advantage of the photovoltaic support system. Home users who want to take advantage of the current “My Electricity” program will first have to install photovoltaics on their own to access the current subsidy program. Therefore, it is likely that the level of prosumer income will be a crucial decision-making aspect in starting investments in RES.
In addition to the national program “My Electricity”, there are also local programs. Almost all medium and large cities in Poland have programs to reduce so-called low emissions, also with the use of RES. In small towns and villages, such programs operate less often or do not have the character of comprehensive solutions. Therefore, the impact of local complementary programs on the preferences of RES users is possible. Thus, the study also analyzed the impact of the residence area, referring to the size of the inhabited town. The verification of the expected effects of the new edition of the program discussed above was described by two research hypotheses.
The choice of renewable energy technology under the subsidy program is determined by the level of income or place of residence of the prosumer.
The new conditions of the subsidy system increase the propensity of users of photovoltaic installations to purchase (a) heat pumps and (b) energy storage.
Hence, the primary objective of the study is to determine the potential impact of the new version of the “My Electricity” program. The possible dependence of the place of residence and income on the decision to take advantage of the program will be investigated.
The study was carried out on a representative sample of 400 single-family home users who, at the time of the study, have at least one system based on RES (the maximum assumed standard error in the sample is 5%). Due to the highly diverse distribution of population density and urban structure in Poland, the sample selection took into account the quota empirical distributions for regions and the respondent’s ages. Only people living in detached, terraced, or semi-detached single-family houses, who made decisions regarding the purchase and service of heating/energy systems in their homes, participated in the study. It was also checked whether the premises had at least one of the following RES devices installed: photovoltaics, recuperation system, heat pump, electric flow boiler, or energy storage (battery or heat accumulator).
The examined problem was described with six diagnostic questions, with two questions regarding investment plans in a heat pump or energy storage in the next six months (dichotomous scale—I plan/I do not plan), one question of “Do you have/Will you have in the next few months a RES system”, with questions about monthly household income per capita (interval scale) and one question about the size of the town where the analyzed property is located (ordinal scale). By the end of the study, the previous edition of the “My Electricity” program was terminated.
Therefore, the study’s results allow us to balance the changes. Here, 40% of single-family homes had been equipped with photovoltaics. Such a level of market saturation is considered a great success of the subsidy system. However, it is associated with problems with the transmission and distribution of energy. Consumers used photovoltaics more as an element of balancing household budgets (sale of power to the grid) rather than as an element of real estate energy management. It was common to install redundant systems, far exceeding the property’s energy needs. About 35% of the houses had been equipped with an electric flow boiler, and 33% had been equipped with a heat pump. Only 1% of the surveyed users had an energy storage facility, so the goals of the current edition of the subsidy system are understandable. It should be emphasized that owners of photovoltaics treat them as an element of a more complex system. Every third house with photovoltaics is equipped with a flow-through boiler, and every tenth has a recuperator. A heat pump is used in 45% of homes with photovoltaics, so it is the most popular device in complementary energy and heating systems. However, this percentage can be improved, which seems to be the aim of the new version of the subsidy system. Only 1.3% of houses with photovoltaics have an energy storage facility. The high cost of electricity storage devices and their unsatisfactory depreciation period are the main reason for these low numbers and the popularity of energy resale in Poland. The cell life is currently lower than the amortization period. Thus, in the current conditions, public intervention seems indispensable; it is aimed at reducing the growth dynamics of the total installed capacity of photovoltaic panels, which will allow time for the adaptation of the energy system to the new conditions of prosumer production. In addition, the increase in energy consumption at the generation site is assumed to reduce the current overload of the existing transmission system.
It will be possible to discuss the potential impact of the program after its completion; however, this study allows for a thorough analysis of the expected impact of the new version of the program. The specificity of the data obtained requires the selection of appropriate statistical tools. Hypothesis 1 refers to the dichotomous variable (I have/do not have RES) and to the quantitative (income) and ordinal (city size) variables. Thus, the testing of this hypothesis was based on the Mann–Whitney U test, in which the distinction of two groups in a dichotomous variable is examined, taking into account the order relation in the explanatory variable. Hypothesis 2 refers to the current state and investment plans expressed as dichotomous variables. In this case, Pearson’s contingency coefficient was used. It is a measure of the assessment of the relationship between two qualitative (immeasurable) features, X and Y, when the data is presented in the form of a contingency table. This coefficient assumes values in the range [0;1]. If its value equals 0, the features are independent and, thus, uncorrelated. A value of 1 indicates a functional relationship. McNemar’s test was also used; this is a non-parametric statistical test used to compare two related samples with nominal or dichotomous variables. Accordingly, the structure indicator was used for the independent sample. Both tests are used to find differences between groups in the conditions of the experiment (before and after the application of the stimulus or compared to the control sample). In this study, the stimulus is the change in the resolutions of the “My Electricity” program. The contingency coefficient of the Kolmogorov–Smirnov test was also used to corroborate Hypothesis 1 for the place of residence, which was required by the limit value of statistical significance for the U test. The decision to accept or reject a statistical hypothesis is based on the p-value. This is a measure of the probability that a statistical test can take more extreme values than those observed in the sample. Small p-values indicate a low probability that a false statistical hypothesis has been accepted. A p-value of 0.05 was used as the threshold for inference in the publication.
3. Analysis Results
When analyzing the surveyed population of single-family house owners, it should be emphasized that income is a key factor in the decision to install RES. In the Mann–Whitney U test (based on median income), people who declare having some kind of RES solution have about 40% higher income per family member than people who do not have any RES devices installed (in the sample for RES holders, the median income is PLN 3.5 thousand per person). The statistical significance of this test is
p-value = 0.009, so it is very high. The U test confirms Hypothesis 1, namely that the investor’s income influences decisions to install RES. This result is in line with intuition. A personal contribution to the investment was required in each edition of the “My Electricity” program. The installation itself also requires incurring additional costs, such as the adaptation of the existing electrical installation, replacement of the meter, preparation of the surface for the use of panels, etc. These initial expenses can be borne by people with larger financial resources, as confirmed by this study. The size of the inhabited town has a different influence on the decision to install RES. As mentioned above, there are well-developed complementary programs in larger cities. There are noticeable differences in the size groups in the analyzed sample (
Table 2). In cities with more than 50,000 inhabitants, the advantage of RES holders over people who do not have such solutions is clearly visible. This may indicate that local complementary programs have a role in the RES policy. However, the significance of the implemented U test is characterized by a
p-value of 0.08, which indicates a relationship on the border of statistical significance. This inconclusive result requires additional statistical testing.
The contingency coefficient, which indicates the correlation of the analyzed variables, is 0.4, but it is not statistically significant (p-value = 0.09). The Kolmogorov–Smirnov test, verifying whether the distributions of the size of the place of residence in both groups (RES/NO RES) are identical, has a p-value of 0.88. Thus, despite insignificant differences in the research sample, the distributions are identical in the population. In terms of place of residence, Hypothesis 1 is not true.
The verification of Hypothesis 2 requires a methodical introduction. Changing the assumptions of the subsidy program brings about specific, measurable effects. What is important here is the actual change in the existing trends. By definition, a subsidy system makes sense if it allows one to achieve the assumed social or environmental goal. At the time of the research, the assumptions of the new edition of the program were publicly discussed. The investments planned by the respondents, implemented over the next six months, already refer to the new conditions of the subsidy system. The possible impact of the new program will be evidenced by a change in preferences and plans, expressed by the difference between the current state and the declared state. The statistical tool for testing this type of interaction is the McNemar test for dependent samples and the test for the structure indicator for independent samples. In accordance with the assumptions of the new “My Electricity” program, only houses with photovoltaics were included in the analysis; the goal is to increase the consumption of RES energy at the place of its generation. From the point of view of the methodology of the conducted analysis, it is important to emphasize that the investigation conducted for energy storage facilities concerns a dependent sample. People who already have energy storage can expand it with more components to increase their system’s capacity, thus, becoming potential beneficiaries of the new edition of the program. The situation is different for owners of heat pumps. The new program concerns investment activities, not modernization activities. Therefore, the current heat pump owners are not potential beneficiaries—methodologically, this is an independent sample. Thus, different tools were used to verify the research hypothesis for both devices. The results of the analysis are presented in
Table 3.
4. Discussion and Conclusions
The extensive use of fossil fuels in Poland is associated with many negative environmental and health consequences. The use of RES (photovoltaics), especially by households, contributes to the reduction in CO2 emissions and the reduction in so-called low emissions and “smog”. This is important, especially in areas with poor air quality. Photovoltaic installations are relatively expensive, so economic instruments have been used in Poland, such as direct subsidies to installations, among others, under the “My Electricity” program. As part of the research in question, it was shown that one of the main factors determining investments in RES is the amount of income.
The program was unquestionably successful, but the intermediate targets for the share of energy from RES in the total energy balance were not met. It is, therefore, advisable to further develop photovoltaics, especially since they have untapped potential. Unfortunately, barriers appeared in the form of inefficient transmission networks. This was noticed, and in the current edition of the “My Electricity” program, the main emphasis was placed on the use of electricity at the place of generation through the use of energy storage facilities and the transition to a new billing system, so-called net billing. Indirectly, the program should contribute to the popularity increase in heat pumps as an installation that uses electricity generated on-site.
The income of single-family house residents is a key factor in their investment decisions. Those who declare that they possess a type of RES solution have about 40% higher financial resources per capita than those who do not have any RES equipment installed. However, we found no influence on this number from local RES support schemes. Although there are a number of such initiatives in Poland (mainly in large cities), they do not have a clear impact on the development of RES. The new edition of the program is expected to increase the use of electricity on-site.
Based on the results of the research, it was found that the new version of the “My Electricity” program will almost exclusively affect the energy storage market, and it will be a clear stimulant for the development and use of technology. In the case of the heat pump market, the current demand will remain at the same level. The program will contribute to achieving the assumed goals, especially energy consumption at the place of production and reducing so-called low emissions. However, it will not affect the popularity of the heat pump. It should be noted that the research shows that approximately 75% of the market is saturated with heat pumps (in single-family houses), which is an important contribution to improving air quality.


