Article

Research on Optimal Design of Recycling System Based on Recovery State Assessment of Household Energy Storage

School of Electrical Engineering, Xinjiang University, Urumqi 830017, China
*
Author to whom correspondence should be addressed.
Energies 2023, 16(4), 1822; https://doi.org/10.3390/en16041822
Submission received: 12 January 2023 / Revised: 7 February 2023 / Accepted: 8 February 2023 / Published: 11 February 2023
(This article belongs to the Special Issue Sustainable Development, Energy Economics and Economic Analysis)

Abstract

:
In recent years, new energy power generation has been widely used. As household energy storage will be widely promoted in the future, many households’ energy storage will soon need to be replaced. It is of great significance to study the recycling of household energy storage to reduce environmental pollution and promote the sustainable development of the household energy storage market. However, the lack of research on the design of household energy storage and recovery network from the perspective of manufacturing enterprises hinders the sustainable development of household energy storage. Based on the above, a household energy storage recycling model considering carbon emissions was established in this paper. This model evaluated the recovery status of household energy storage online through a big data platform and proposed three different recovery schemes based on the evaluation results. Through a case study of Sichuan and Chongqing, the overall profit of the household energy storage and recycling system could be increased by about CNY 1.61 million, while reducing about 1.04 hundred tons of carbon emissions, thus verifying the feasibility and effectiveness of the model. In addition, the results of scenario analysis showed that the processing cost and demand are the main factors affecting the optimal design of the recycling network, and they can change the configuration of the network. Appropriate processing methods, locations, and transportation schemes would decrease the cost of production and carbon emissions. Household energy storage is possible for recycling residual values that decrease carbon emissions during storage. At the same time, further improving more efficient recycling technology is an important idea to increase the profits of household energy storage manufacturers.

1. Introduction

With the expansion of new energy grid connections, energy storage technologies, key technologies for new power systems, are considered as an important means to make the new energy output stable [1,2,3]. The household energy storage market boomed around the world in recent years, with the global market size reaching USD 7.5 billion with the Chinese market size arrived at USD 1.337 billion, equivalent to CNY 8.651 billion by 2022. These numbers are expected to reach USD 26.4 billion and USD 4.6 billion, respectively, in 2027 [4]. However, with the increase in the number of users, a large number of household energy storage products will reach the end of their lives. If they are not properly handled, the precious metal materials used to manufacture the products will be wasted and cause pollution to the environment [5,6]. In addition, the research on household energy storage is still at a relatively new stage, and its recycling system has not been established, and there is also a lack of corresponding policies and management methods. At present, household energy storage products have entered the market for only just over ten years and are at the front end of the product development life cycle. In order to promote the sustainable development of the household energy storage market, the key driving force is the efficient recycling of household energy storage products. Therefore, how to assess the recyclability of household energy storage and how to build an efficient recycling system for the enterprises to further promote its sustainable development are emerging as urgent issues which need to be dealt with.
For the study of distributed energy storage like household energy storage, Stuart Speidel and Thomas Bräunl discussed the feasibility and limitations of various renewable energy sources, energy storage, grid connections, and off-grid systems. In addition, they have studied the effect of combining household energy storage with renewable energy generation [7]. Bila [8] proposed that the household energy storage system will become the next generation of household appliances in the smart grid environment in addition to the growth of electric vehicles using lithium-ion batteries. Sander et al. [9] pointed out that household energy storage (HES) and community energy storage (CES) are two promising energy storage schemes for residential power producers, and evaluated and compared the technical and economic feasibility of these two schemes. Sd et al. [10] studied the technical, environmental, and economic assessment of household energy storage and community energy storage in the UK, and found that both household energy storage and community energy storage can significantly reduce the peak power input and output of the grid, improve the community self-consumption rate (SCR) and self-sufficiency rate (SSR), and contribute to higher energy efficiency. Tungadio et al. [11] improved off-grid household energy storage by developing a control for the battery storage system based on embedded supercapacitors. In addition, scholars have studied the flexible regulation of distributed energy storage in the distribution side of new power systems, offering new methods to enable the stability of electric systems [12,13]. Based on gray correlation analysis, Lv Zheqing and Xiu Jiapeng et al. [14] have made assessments. The similar trend as the variation of battery capacity with mileage can evaluate the discharge capacity of the battery from the actual working conditions and provide a reference for a more comprehensive assessment of the battery health. The EKPF algorithm proposed by X. H. Du and B. Y. Li [15] correctly estimated the SOC of the energy storage battery, thus providing a reference for the construction of the operating conditions of the energy storage battery and its performance test. Zhang Xiaoyuan and Jin Hao et al. [16] put forward a method to evaluate the SOH of power battery based on an improved temporal convolutional network model, which improved the evaluation accuracy and computation time.
In addition, as for recycling, Mou Siyu and Han Xiaogai et al. [17,18,19,20] analyzed and summarized the development status and existing problems of waste power battery recycling and gave some corresponding countermeasures and suggestions. In terms of recovery and treatment technology, Lei et al. [21] analyzed the recovery technology of waste batteries, battery composition, and the harm of common electrolytes and organic solvents to the environment and health, and also discussed the potential social security issues and environmental risks in the process of waste battery recovery. Lu Nali et al. [22] introduced in detail the recovery methods including fire recovery, wet recovery, high temperature solid phase recovery technology, bioleaching technology, mechanical activation treatment recovery technology, electrochemical methods, and other recovery methods. Among them, hydrometallurgy and pyrometallurgy are currently widely used as the main recovery methods for the extraction of battery raw materials [23]. Wang Bin et al. [24] described the recovery methods of metal ions in the leaching solution of waste lithium ion batteries globally, and focused on the impact of different methods such as precipitation, deposition, and ion exchange in the wet process on the recovery rate of Co2+, Mn2+, Li2+, and other valuable metal ions in the leaching solution. Gavin Harper et al. [25] sorted out the development trend of waste batteries and the shortcomings of various recycling technologies in detail, evaluated the current situation of various technologies, and looked forward to future development directions. Tian et al. [26] performed a comparative study of the main waste lead-acid battery recovery processes in China, and analyzed their economic benefits using the technology cost model based on the local material and energy market prices. Ciez et al. [27] examined the different recovery processes for lithium-ion batteries and compared the carbon emissions of three recovery technologies (pyrometallurgical recovery, hydrometallurgical recovery, and direct cathode recovery). They found that direct cathode recovery had the potential to reduce emissions and is economically competitive.
In terms of recycling network, Zhang Xuemei [28], Yao Peifan [29], and Chen Wei et al. [30] combed through the recycling standards which have been published or under research and focused on the specific processes of the recycling link and the potential of key resource recovery in retired power batteries. The rise of the recycling rate can effectively alleviate the foreign dependence of key resources required for the production of power batteries, and provide a reference for the industry to recycle used power batteries. Zhong Tong [31] envisioned a variety of recovery models in reverse logistics, and made a comparative analysis from the perspective of purchase and construction costs, operation risks, etc., and also built a reverse logistics recovery network. T.Li Hsing and Dong Jingfeng et al. [32,33,34] proposed applying a mixed integer programming model to reverse logistics mathematical modeling, and took cost minimization as the objective function to solve the location/allocation problem of the reverse logistics network. Xiong Haiou and Hu Yongjun et al. [35] used an approach of system dynamics according to the characteristics of blockchain technology to construct a reverse logistics network model of new energy vehicle batteries and analyzed its features. Furthermore, they simulated the model and put forward the policy suggestions. Geng Liyan et al. [36] designed the reverse logistics network of lead-acid batteries for vehicles, and explained the functions of each logistics node. Finally, suggestions were put forward to improve the reverse logistics network structure for the government, enterprises, and the public. Li Jian [37] analyzed the characteristics of reverse logistics of household waste batteries in medium-sized enterprises based on green logistics, and provided the construction elements of logistics recycling networks for waste batteries in medium-sized enterprises. Finally, the design scheme and development suggestions of a waste battery logistics recycling network suitable for medium-sized enterprises were put forward. Zhu Lingyun and Chen Ming et al. [38] have studied the reverse logistics mode and recycling network of waste power batteries, and studied the reverse logistics mode selection of waste power batteries using a fuzzy comprehensive evaluation method. Wu Jie [39] used Stackelberg game and Bertrand game methods to analyze the existing power battery recovery models of company B, and compared the reverse supply chain decision making under different recovery models, aiming at the reverse supply chain composed of battery supplier, vehicle manufacturer company B, and informal battery recovery enterprises. Shao Zhufeng and Liu Xinyuan et al. [40] attempted to reach echelon utilization of waste power batteries by leasing, selling, and extracting precious metals by dismantling. After comparing the overall profit of the reverse recycling supply chain, the batteries can be recycled optimally when profit was maximized. Yu Wei et al. [41] calculated the discharge at different life cycles in line with system structures of new and retired batteries used in energy storage power station. In terms of carbon emissions, it was obtained through the echelon utilization of retired power batteries.
In summary, the majority of the above studies focused on the reverse supply direction, and rarely combined the forward and reverse directions for the purpose of analysis and study. On one hand, there is almost no relevant literature on the design of household energy storage recycling systems, and the academic community lacks research on the recycling aspects of household energy storage at the manufacturing enterprise level. On the other hand, each individual household energy storage product has a distinct level of quality when it comes to recycling. In accordance with the current research on product recycling, the majority of the research focused only on reducing production costs and increasing revenues by recycling raw materials, ignoring the fact that divergent recycled products have distinct quality levels. Furthermore, the design and optimization of recycling networks also have a crucial impact on environmental improvements, and yet most of the literature to date has only singularly considered the economics of the recycling process, with few environmental benefits being integrated throughout the recycling network.
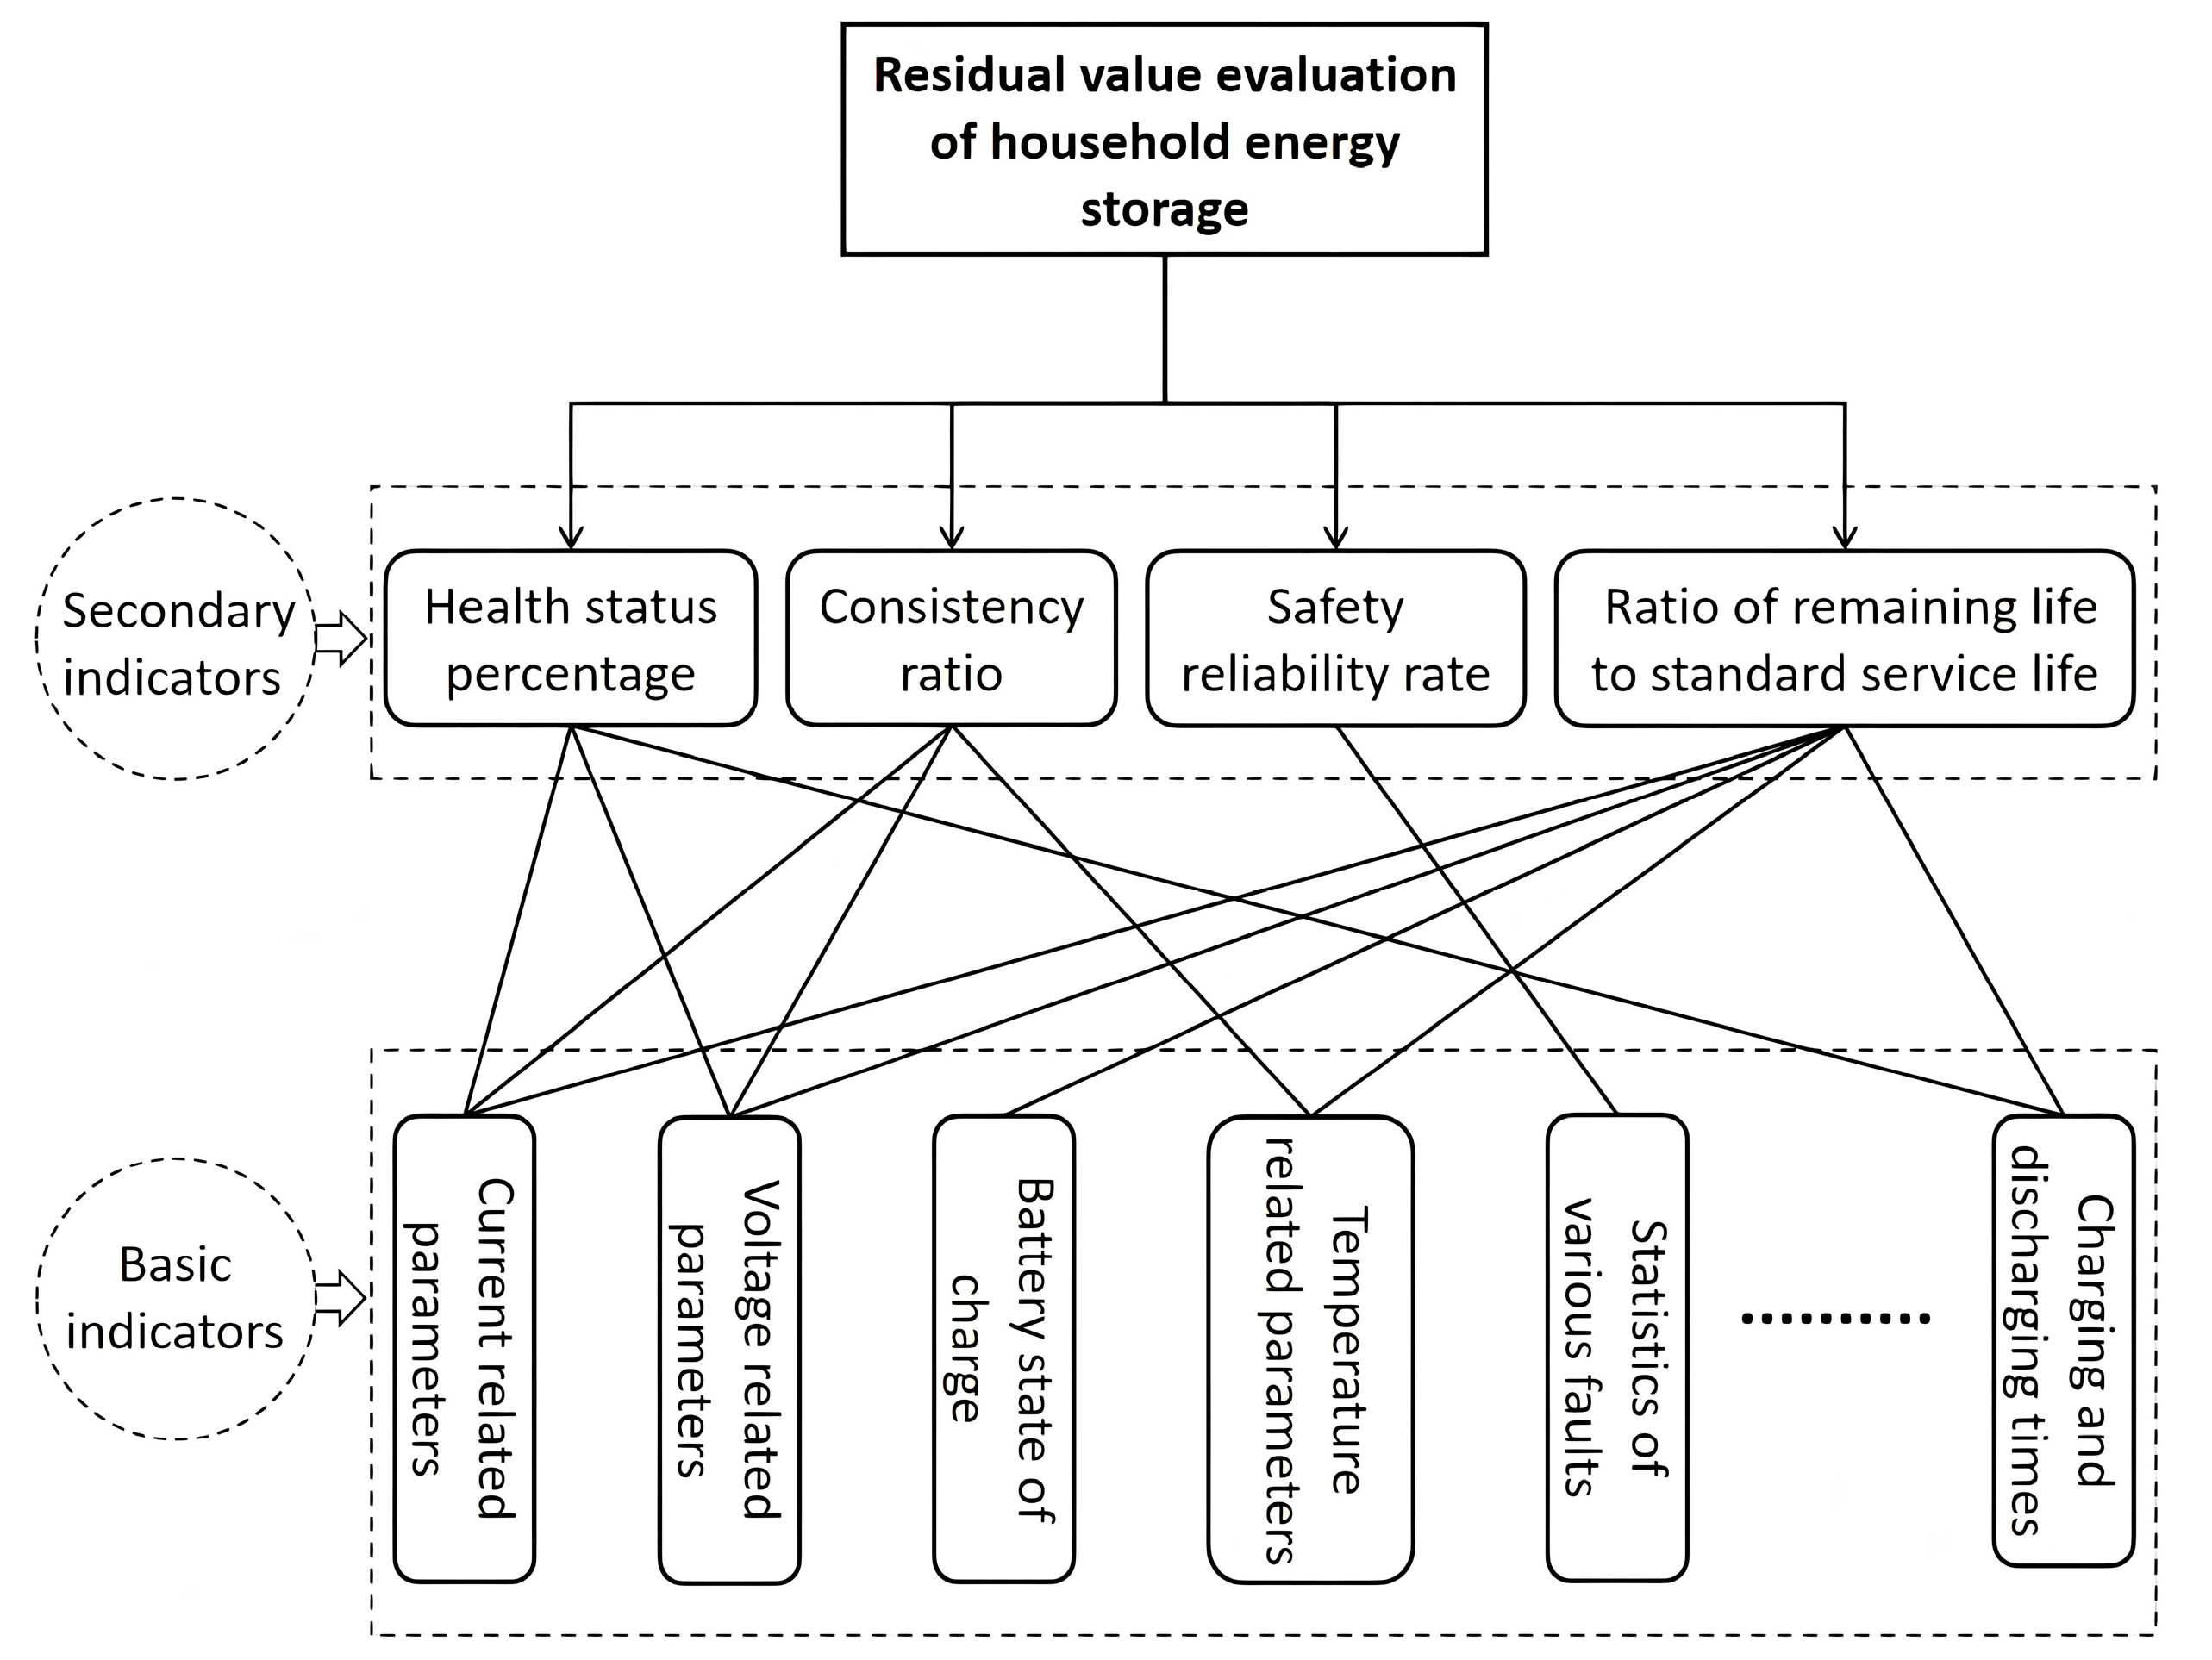
Consequently, to address the above issues, this paper introduces a closed-loop supply chain model and constructs a recycling system that combines forward supply and reverse recovery for household energy storage. On this basis, in order to make this paper more suitable for the development background of the global low-carbon economy, we also study how carbon emissions will affect the design of the household energy storage and recycling system. At the same time, considering the different levels of recovered product quality, this paper further analyzed a series of evaluation indices for the recovery status of household energy storage and constructed a residual value evaluation system for household energy storage. In addition, by classifying household energy storage through the evaluation results, this paper analyzed three distinct recovery strategies, which were assigned to divergent processing centers in the recovery network to achieve the optimization of the whole system. Ultimately, through a case study of the Sichuan and Chongqing regions and the comparative analysis of the scenarios set up by the simulation by changing each factor, this paper verified the feasibility and validity of the model and gives some effective industry suggestions to enterprises on the basis the research results.

2. Construction of Household Energy Storage Recycling System

The household energy storage recycling system constructed in this paper is shown in Figure 1. The figure considers a forward supply consisting of manufacturing plants, distribution centers, and sales/collection centers. In addition, the household energy storage manufacturing recycling system, which consists of the reverse supply to the sales/collection center, the recycling center, the waste treatment center, and the manufacturing plant. In the recycling process, the blockchain technology was used to record the source of recycled household energy storage, the detailed data of each center, the flow direction of recycled materials, transaction records, and other information.
In the forward supply stage of products, the raw materials of the manufacturing plant can be supplied by the material supplier or by the raw materials extracted from the recycling center. The manufacturing plant flows into the distribution center for distribution processing after manufacturing the household energy storage products, and then further transports the products to the nearby sales center through the distribution center, and finally sells the products to consumers through the sales center.
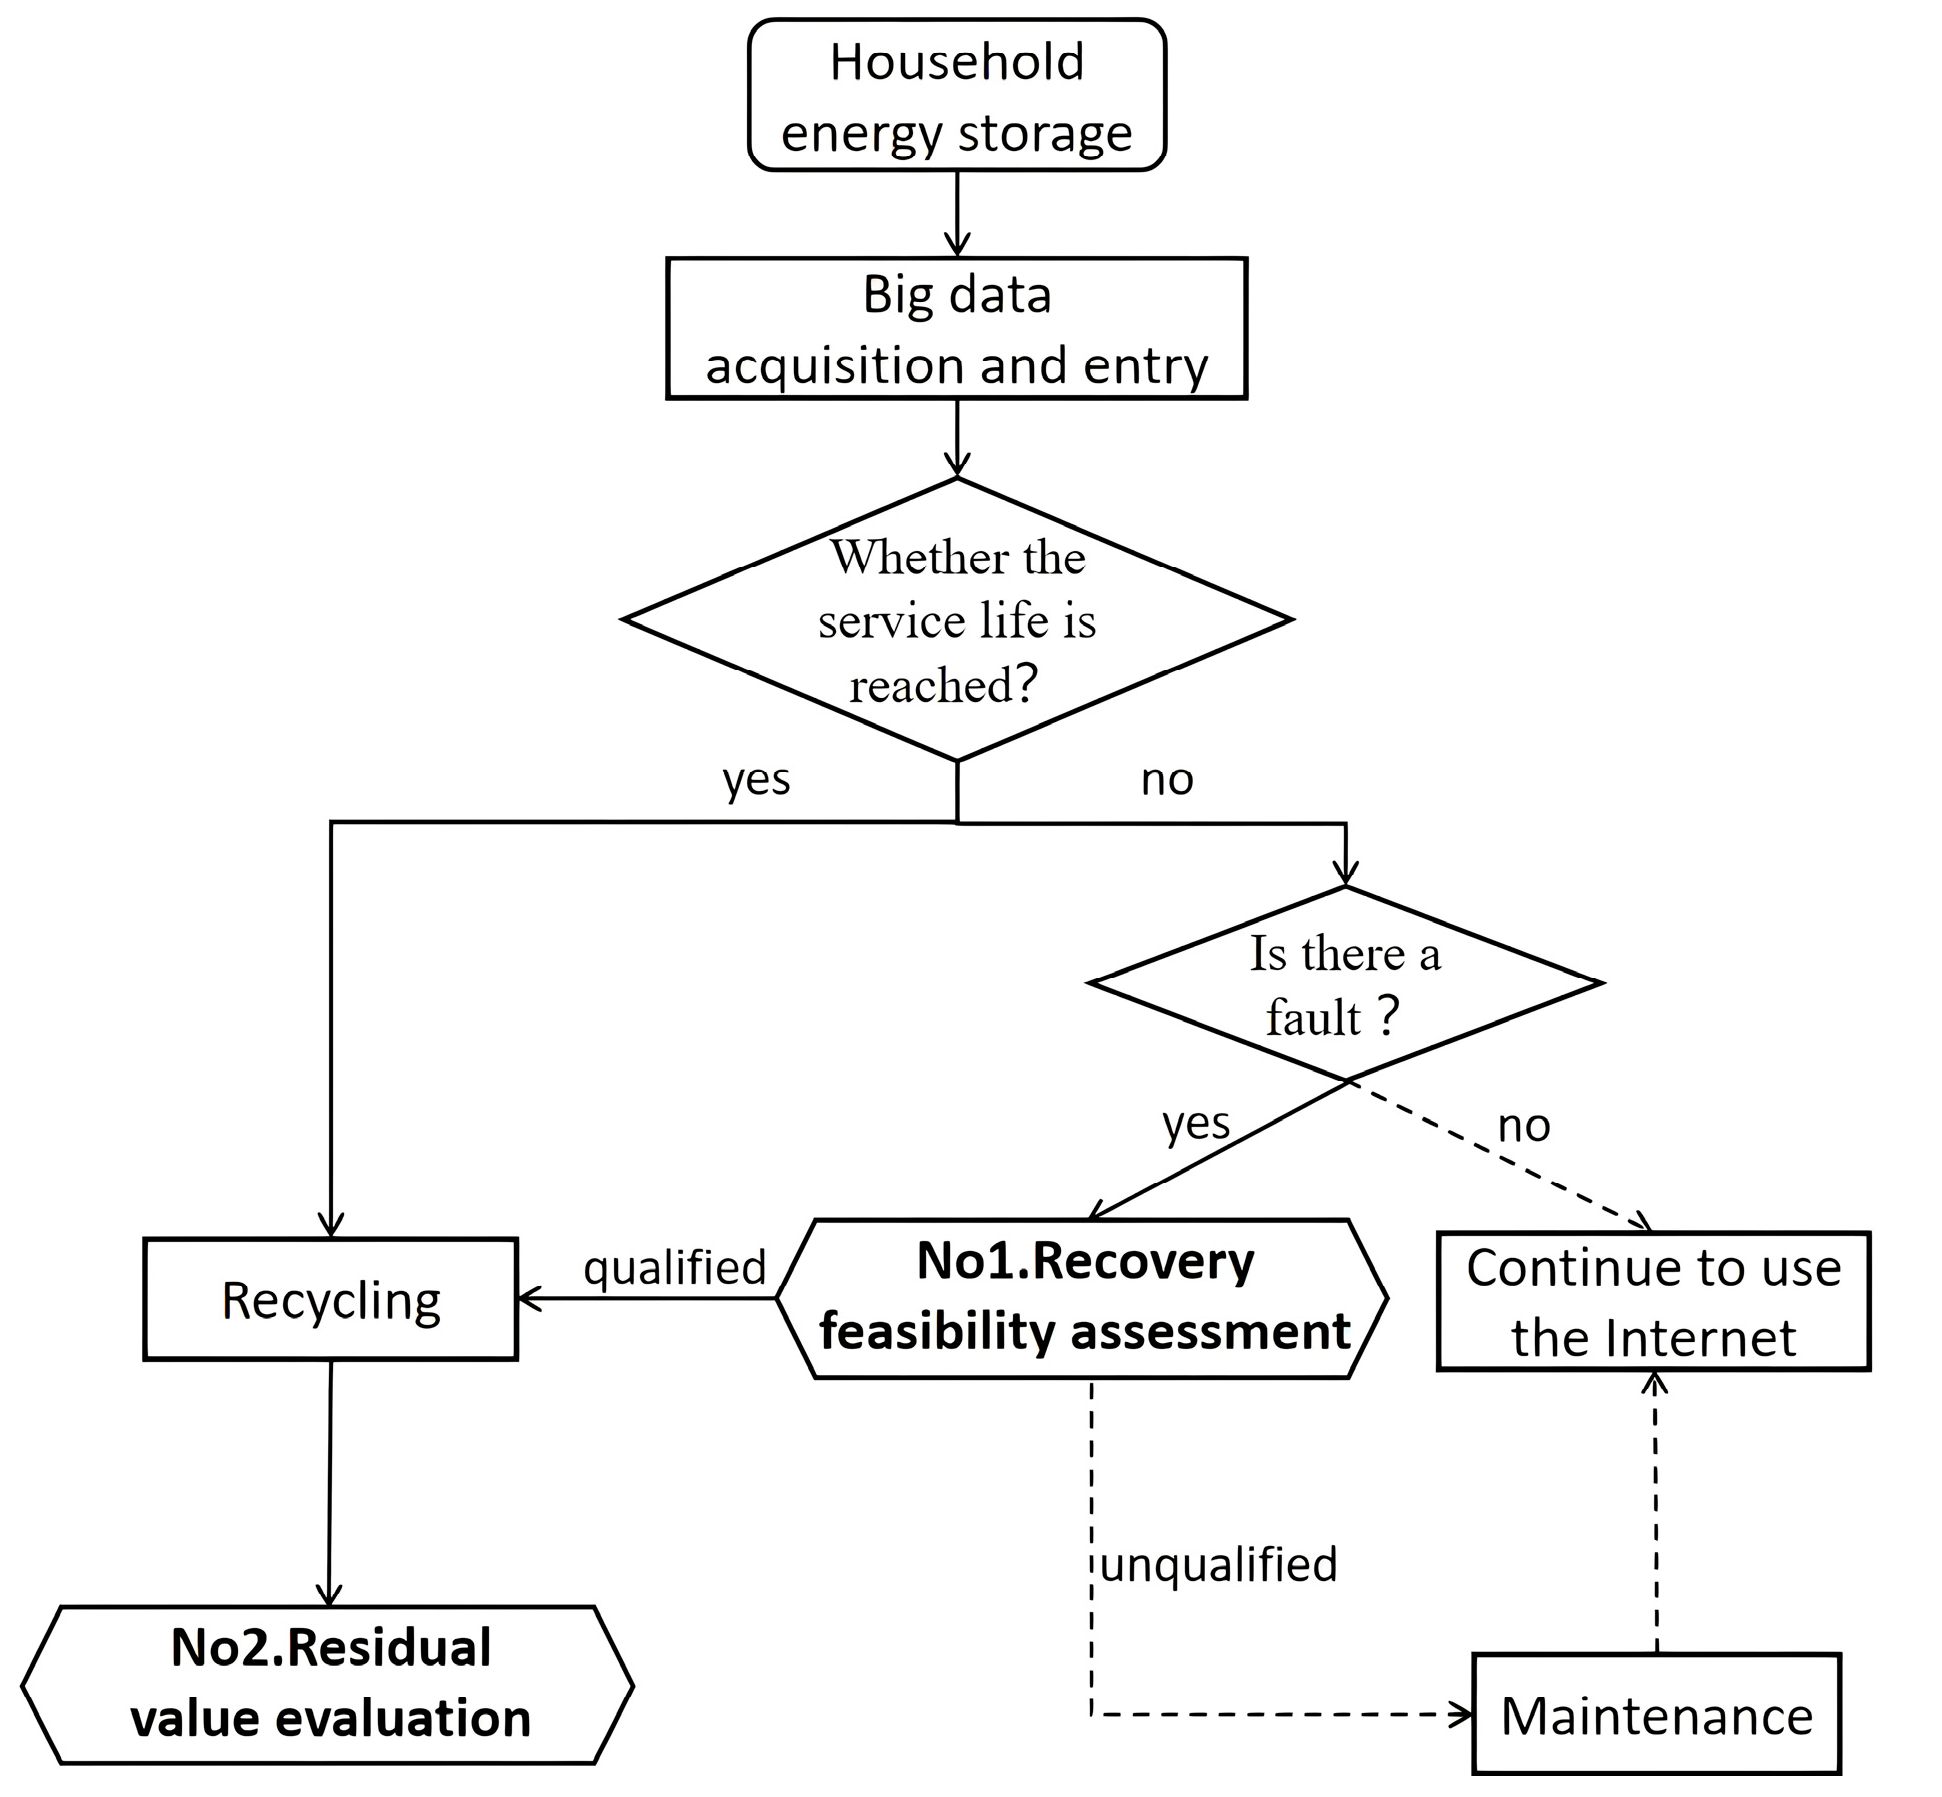
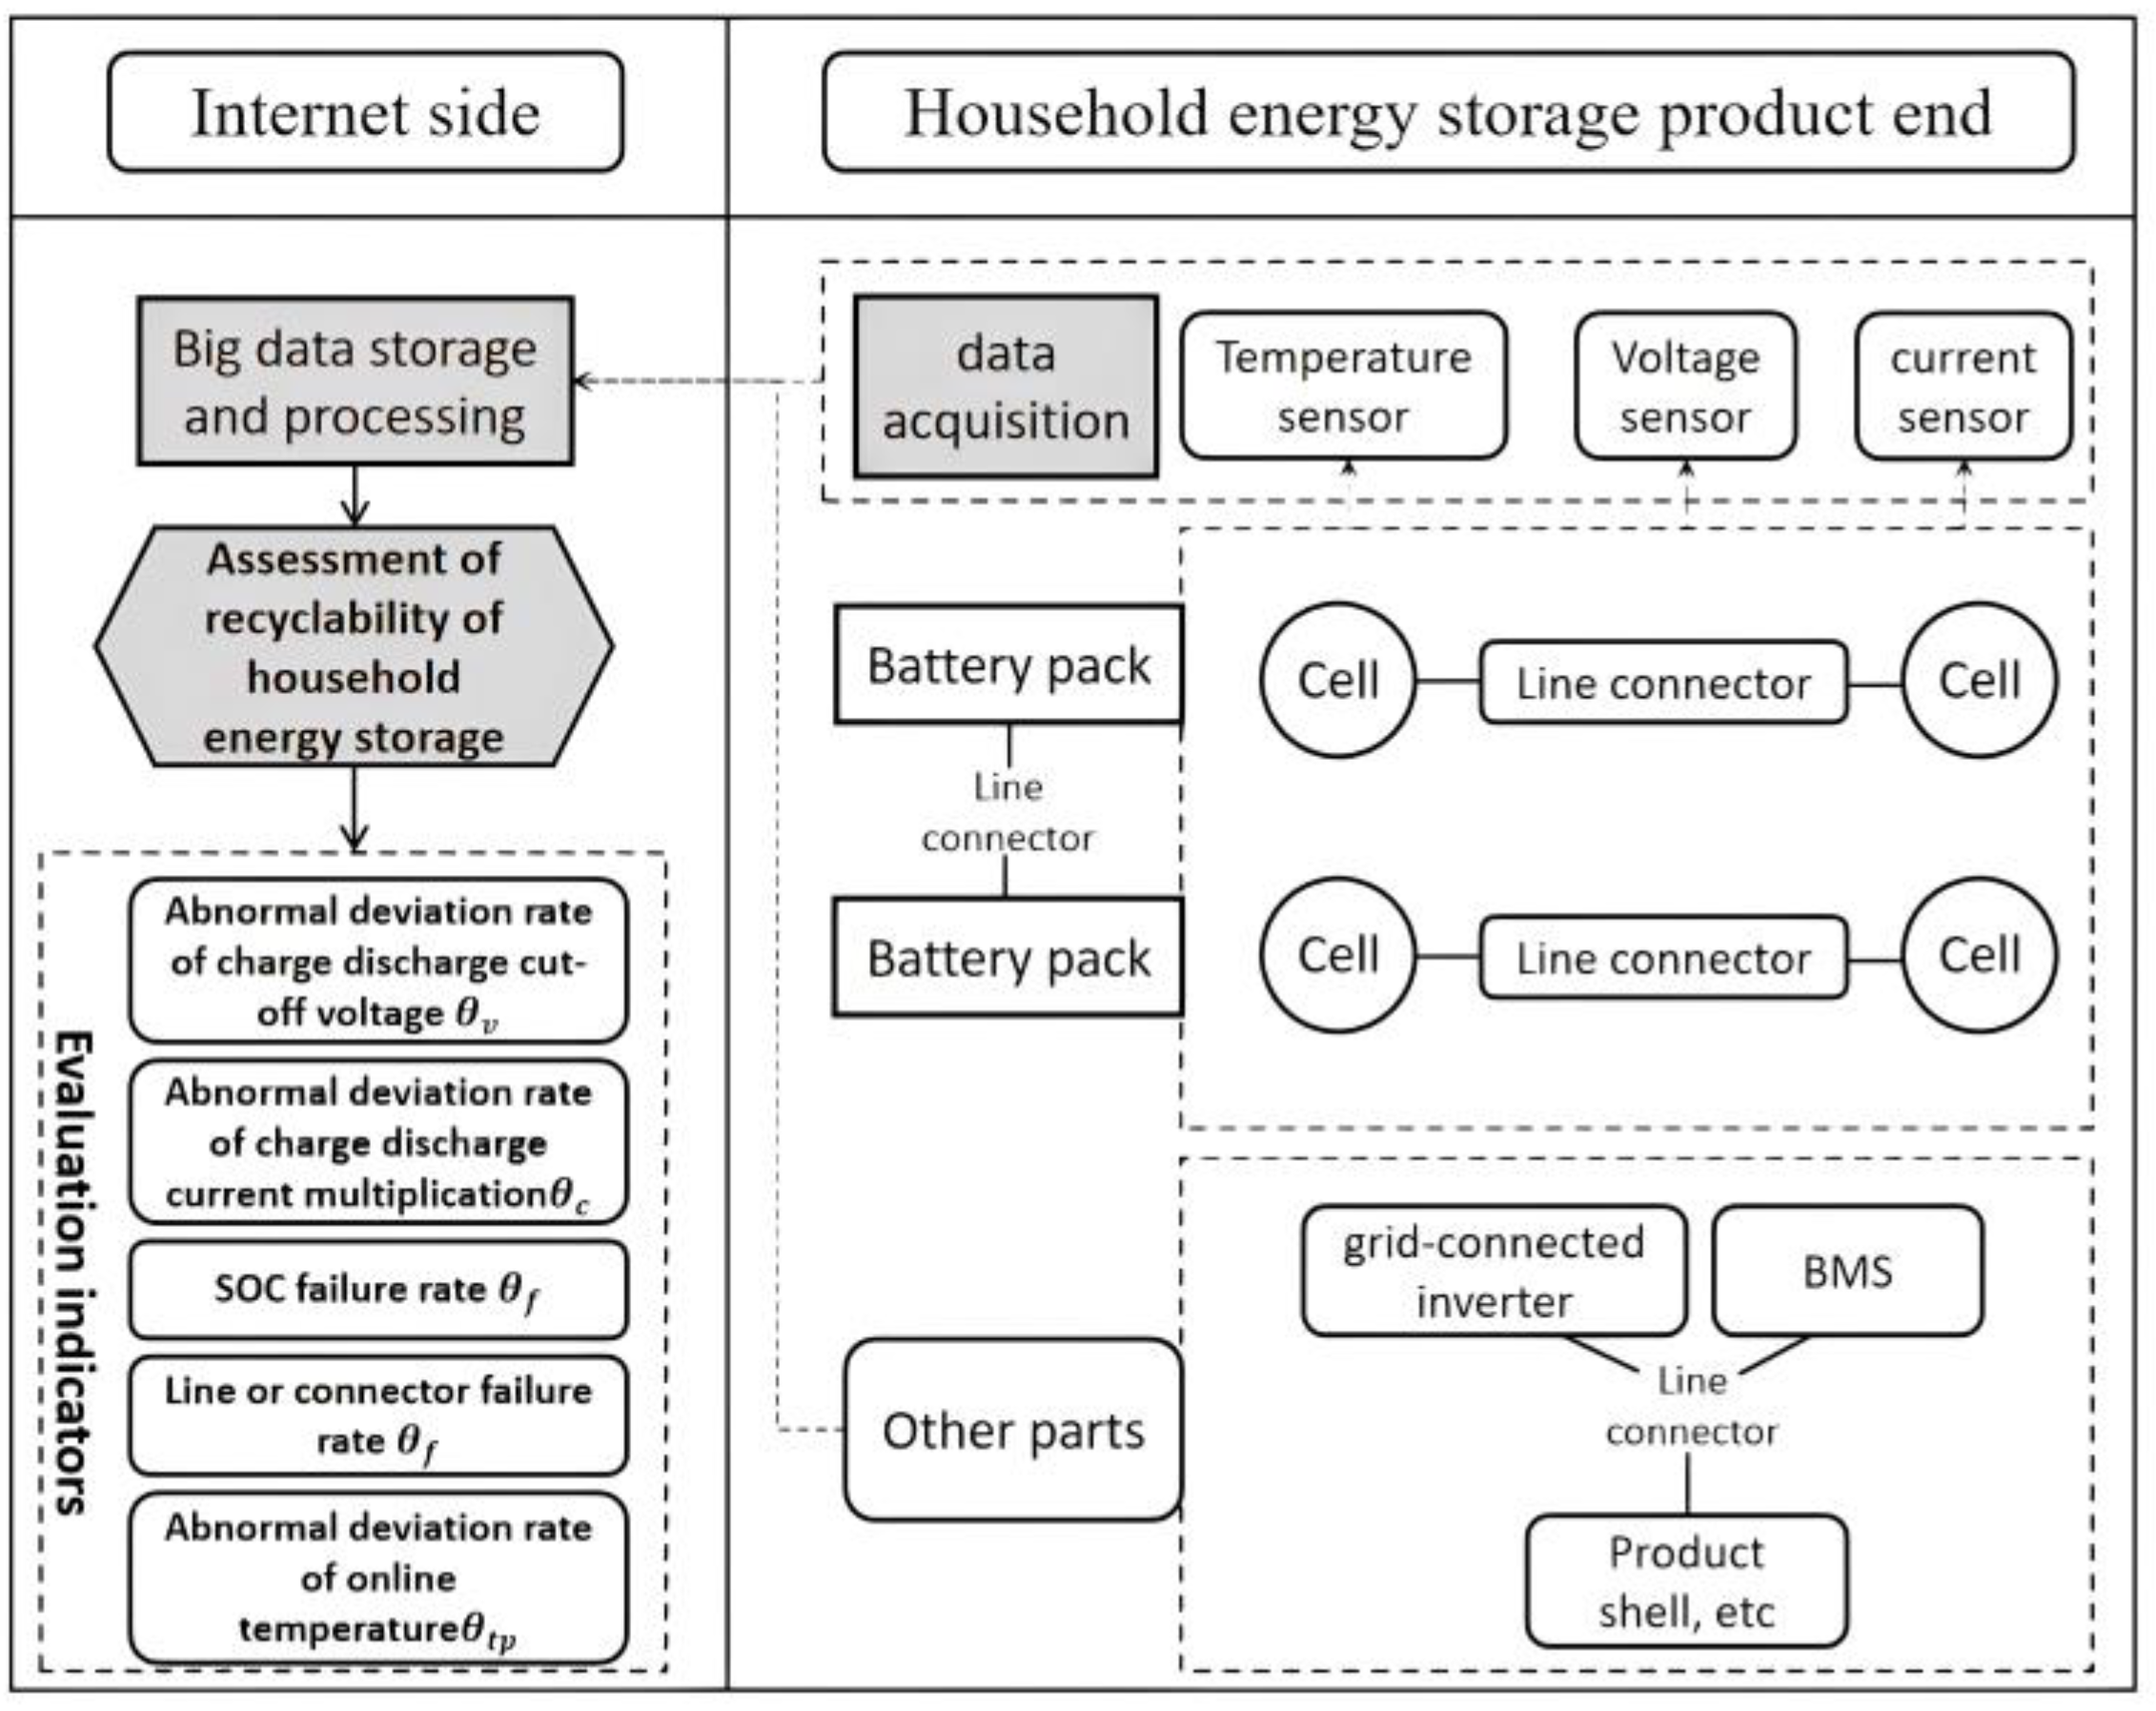
In the reverse recovery stage, the sales center plays the role of collecting waste household energy storage products from nearby consumers. First, household energy storage can introduce artificial intelligence, Internet Plus, and other practices and governance mechanism modes into the connection between consumers and the power grid, so as to realize the transmission and sharing of data with the power grid. At the same time, the recyclability and residual value of household energy storage can be evaluated in real time by storing the charging and discharging fault data when the household energy storage is connected to the Internet and conducting big data screening and analysis. Through the final residual value evaluation results, three different recovery strategies were adopted for household energy storage products of different quality levels, namely, directly flowing into the manufacturer’s factory, reassembling, replacing, and refurbishing parts and components to continue to use (M1); transport to the recycling center to extract metal raw materials, and transporting the extracted raw materials to the manufacturer’s factory for new domestic energy storage manufacturing (M2); and directly transporting to the waste treatment center for treatment (M3). Through this more detailed recycling process, the system optimization in the recycling process can be better realized. In addition, the parts can be disassembled at the product site and sold to a third party processing agency for processing

3. Construction of Recovery State Evaluation Scheme for Household Energy Storage

In this paper, the state assessment of household energy storage recycling was mainly divided into two categories: one to evaluate the feasibility of household energy storage recycling, and the other to evaluate the recovery residual value, as shown in Figure 2.
Because household energy storage has a certain life of service, the household energy storage products that reach the service life will not be evaluated for the feasibility of recycling, and the second type of recycling residual value will be directly evaluated. However, for household energy storage products that have not reached the service life, due to a series of faults in the use process of some household energy storage, the first recycling feasibility of this kind of household energy storage can be first evaluated through online big data analysis. The household energy storage product that cannot reach the recovery situation can be repaired and maintained, and the second type of recovery salvage value evaluation was carried out for the household energy storage that meets the recovery situation.

3.1. Feasibility Assessment of Household Energy Storage Recovery

The first type of evaluation mainly refers to the feasibility assessment of recovery of some household energy storage products that fail during the service period. The main idea is that the higher the failure rate of household energy storage products in the service period, the more unfavorable the online operation of household energy storage, so it needs to continue to recycle, as is shown in Figure 3.
During the service period, the failure rate of domestic energy storage and the detection of battery residual capacity can be stored in a series of failure data of domestic energy storage through artificial intelligence, Internet Plus, and other platforms, and the big data can be screened and analyzed, to calculate the value of the feasibility evaluation factor of domestic energy storage recovery. The recycling feasibility factors selected in this paper are: rate of line or connector failure ρf, battery capacity residual rate ρq, abnormal deviation rate of Internet access temperature ρtp abnormal deviation rate of charge and discharge current multiplier ρc, and abnormal deviation rate of charge and discharge cut-off voltage ρv.
Then, through the analytic hierarchy process, the weights of each energy storage recycling feasibility factor can be calculated as θf, θq, θtp, θc, and θv. The evaluation method and application formula of the feasibility of household energy storage recovery can be expressed as follows:
R = ( ρ f × θ f + ρ q × θ q + ρ t p × θ t p + ρ c × θ c + ρ v × θ v ) × 100 %
where R represents the recovery feasibility of household energy storage, and the recovery feasibility evaluation is shown in Table 1.

3.2. Evaluation of the Residual Value of Household Energy Storage Recovery

After reaching the service life of household energy storage, the government set that the product must be replaced in time. This is no longer an online operation, so the evaluation of the recyclability of such household energy storage products does not consider the occurrence of faults during the online period, and mainly focuses on the economy of the whole recycling system after recovery to consider its recyclability.

3.2.1. Selection of Residual Value Factor for Household Energy Storage Recovery

This paper analyzed and verified many influence factors in the database established by artificial intelligence, Internet Plus platform, and other storage, and fully considers the key indicators of practical application scenarios. We explored the selection of a series of basic indicators such as charge and discharge current, voltage and temperature, and formed the percentage of health state on this basis W1, safety and reliability rate W2, consistency ratio W3 and residual life and the ratio of standard service life W4. The four second-level indicators are shown in Figure 4.

3.2.2. Calculation of Residual Value of Household Energy Storage

The household energy storage residual value can be obtained by the previous determination of the recovered residual value factors, namely, the health state percentage, safety and reliability rate, consistency ratio, and the residual life ratio to the standard service life. Suppose that the weights corresponding to these four residual value factors are β1, β2, β3 and β4, then, the residual value of the household energy storage is:
W = W 1 β 1 + W 2 β 2 + W 3 β 3 + W 4 β 4
Household energy storage was classified according to the residual value evaluation results, and the following recovery strategies were adopted:
M1: Home energy storage with a residual value of 80% or more can be directly transferred to the manufacturer’s factory for reassembly, replacement, and refurbishment.
M2: Home energy storage with a residual value assessment of between 10% and 80% will be transported to the recycling center for metal raw material extraction, and the extracted raw materials will be transported to the manufacturer’s factory for new home energy storage manufacturing. The waste generated from the decomposition will be transported to the waste treatment center for disposal.
M3: Household energy storage with a residual value assessment of less than 10% will be transported directly to the waste treatment center for treatment.

4. Construction of Household Energy Storage Low-Carbon Recycling System Model

4.1. Relevant Hypothesis

To facilitate the construction of the benefit model of the household energy storage recycling system, the following assumptions are made:
① The alternative locations of each processing center are pre-known, and all processing centers have processing capacity limitations. ② The recovered household energy storage is classified according to the salvage value evaluation results, and the corresponding recovery strategies are adopted for the household energy storage in different salvage value ranges. ③ The service life of home energy storage is 10 years, and the percentage of recycled home energy storage flow that is recovered in different recycling strategies is known. ④ The waste parts that have been disassembled by the sales/collection center on the spot will be recycled by a third party, without considering their transportation and disposal costs. ⑤ The raw materials and components provided by the material supplier are transported by the material supplier itself, and therefore are not included in the carbon emissions and transportation costs of the recycling system. ⑥ The proportion of raw materials extracted from the household energy storage transported by the collection center to the recycling center in the same salvage value range is determined. ⑦ A year is used as the time unit and we assume that the number and location of consumption centers are fixed and that there is a fixed annual recovery quantity. ⑧ The raw materials that flow into the manufacturing plant after treatment by the recycling center have no difference from the raw materials supplied by the material supplier, and can also be used for the manufacture of household energy storage products. ⑨ The processing cost of each processing center and the distance between the processing center and the processing center are known. ⑩ The household energy storage products shall not be damaged during the forward flow transportation.

4.2. Relevant Parameters

(1)
Relevant parameters of the manufacturing plant
i indicates the location where the manufacturing plant may be located, and   i ϵ { 1 , 2 , , I } . See Table 2 for the relevant parameters.
(2)
Relevant parameters of the distribution center
j represents the location of the distribution center for the alternative products, and j ϵ { 1 , 2 , , J } . See Table 3 for the relevant parameters.
(3)
Relevant parameters for the sales/collection center
k indicates alternative sales/collection center, and k ϵ { 1 , 2 , , K } . See Table 4 for the relevant parameters.
(4)
Relevant parameters of the consumption center
l represents the local consumption centers, and l ϵ { 1 , 2 , , L } . See Table 5 for the relevant parameters.
(5)
Relevant parameters of the recycling center
r represents the possible recovery center, and   r ϵ { 1 , 2 , , R } . See Table 6 for the relevant parameters.
(6)
Relevant parameters of the waste treatment center
p is the possible construction of the waste treatment centers, and   p ϵ { 1 , 2 , , P } . See Table 7 for the relevant parameters.
(7)
Parameter of the distance correlation of each point
See Table 8 for the distance parameters between each point.
(8)
Other relevant parameters
See Table 9 for other relevant parameters.

4.3. Decision Variables

(1)
Location decision variables
yi, yj, yk, yr, and yp are the 0–1 variables for the manufacturing plant, distribution center, sales/collection center, recycling center, and waste treatment center, respectively, with 1 indicating that the corresponding building was selected and 0 indicating that it was not selected.
(2)
Transportation decision variables
See Table 10 for transportation decision variables.
(3)
Other decision variables
See Table 11 for other decision variables.

4.4. The Objective Function

Relevant formulas of the objective function are shown in the Formula (3)–(10):
m a x = A P ( C 1 + C 2 + C 3 + C 4 + C 5 + C 6 )  
A P = { P 1 = t T l L D m t l P r f 1 P 2 = t T k K r R x t k r P r f 2 + t T k K p P x t k p P r f 2
C 1 = { i I y i F c i + j J y j F c j + k K y k F c k + r R y r F c r + p P y p F c p
C 2 = t T i I j J x t i j d i j T c 1 + t T j J k K x t j k d j k T c 1 + t T k K l L x t k l d k l T c 1 + t T l L k K x t l k d l k T c 1 + t T k K i I x t k i d k i T c 1 + t T k K r R x t k r d k r T c 2 + t T k K p P x t k p d k p T c 2 + t T r R i I x t r i d r i T c 3 + t T r R p P x t r p d r p T c 3
C 3 = { t T i I ( o t R a c ) + ( z t i S p c ) + t T k K i I x t k i R e 1 + t T k K r R x t k r P r i 2 R e 2 + x t k r P r i 1 R e 3 + t T k K p P x t k p R e 4
C 4 = t T i I z t i M c i + t T i I j J x t i j D c j + t T j J k K x t j k S c k + t T l L k K x t l k C c k + t T k K i I x t k i R c i + t T k K r R x t k r R c r + t T k K p P x t k p P c 1 g 2 + t T r R p P x t r p P c 2
C 5 = C t t T i I z t i M a i + t T i I j J x t i j D a j + t T j J k K x t j k S a k + t T l L k K x t l k C a k + t T k K i I x t k i R a i + t T k K r R x t k r R a r + t T k K p P x t k p P a 1 g 2 + t T r R p P x t r p P a 2
C 6 = t T i I j J x t i j d i j T r a g 1 + t T j J k K x t j k d j k T r a g 1 + t T k K l L x t k l d k l T r a g 1 + t T l L k K x t l k d l k T r a g 1 + t T k K i I x t k i d k i T r a g 1 + t T k K r R x t k r d k r T r a g 2 + t T k K p P x t k p d k p T r a g 2 + t T r R i I x t r i d r i T r a + t T r R p P x t r p d r p T r a C t
Equation (3) represents the maximization of the total profit of the whole household energy storage recycling system. Equation (4) represents the total revenue from selling household energy storage products and selling used parts after recycling and dismantling the system. Equation (5) represents the total construction cost of the system. Equation (6) represents the total transportation cost in the system. Equation (7) represents the total purchasing cost in the system. Equation (8) represents the total processing cost in the system. Equations (9) and (10) represent the treatment carbon emission and transportation carbon emission cost in the system, respectively.

4.5. The Constraint Condition

Relevant formulas of the constraint condition are shown in the Formula (11)–(14)
s . t . { z t i = s t i , t T , i = 1 z t i + k K x ( t 1 ) k i = s t i , t T , i 2 s t i = j J x t i j , t T , i I D m t l = k K x t k l , t T , l L
s . t . i I x t i j = k K x t j k , t T , j J j J x t j k = l L x t k l , t T , k K R q l = k K x t l k , t = 1 , l L l L x t l k P c i = i I x t k i , t = 1 , k K l L x t l k P c r = i I x t k r , t = 1 , k K l L x t l k P c p = i I x t k p , t = 1 , k K k K x t k r P r i 1 g 3 + k K x t k r P r i 2 g 4 i I x t r i k K x t k r P r i 1 g 4 + k K x t k r P r i 2 g 3 p P x t r p t = 1 , r R
s . t . o t = i I z t i g 2 , t = 1 o t = i I z t i g 2 r R i I x ( t 1 ) r i , t 2 z t i y i C p i , t T , i I i I x t i j y j C p j , t T , j J j J x t j k y k C p k , t T , k K l L x t l k y k C p k , t T , k K k K x t k r y r C p r , t T , r R k K x t k p g 2 + r R x t r p y p C p p g 1 , t T , p P k K x t k i y i M , t T , i I r R x t r i y i M , t T , i I
s . t . { z t i , s t i , x t i j , x t j k , x t k l , x t l k , x t k i , x t k r , x t k p , x t r i , x t r p { 0 , 1 , 2 . . N } y i , y j , y k , y r , y p { 0 , 1 } t T , i I , j J , k K , l L , r R , p P
The first term in Equation (11) indicates that the amount of household energy storage produced at the stage 1 manufacturing plant i is equal to the amount that can be supplied at the manufacturing plant i. The second term indicates that the quantity available at the stage 2 manufacturing plant i is equal to the sum of the home energy storage manufactured at the stage 2 manufacturing plant i and the quantity k shipped to the manufacturing plant i by the stage 1 collection center. The third term indicates that the quantity available at the stage t manufacturing plant i is equal to the transportation volume from the manufacturing plant i to the distribution center j. The fourth term indicates that the demand quantity of the consumption center is equal to the transportation quantity from the sales/collection center k to the consumption center l. Equation (12) represents the balance of transportation direction of household energy storage products among nodes.
The first term in Equation (13) indicates that the quantity of raw materials purchased by the manufacturing plant i from the raw material supplier is equal to the amount of household energy storage that can be supplied from the manufacturing plant i multiplied by the disassembled weight. The second term means that after the first stage, the quantity of raw materials purchased by the manufacturing plant i from the raw material supplier is equal to the quantity of household energy storage that can be supplied from the manufacturing plant i multiplied by the weight after disassembly, minus the transportation volume from the recycling center r to the manufacturing plant i after the first stage. Items 3 to 10 indicate that the processing capacity of each processing center is less than or equal to its maximum processing capacity. Equation (14) represents the value range of each variable.

5. Example Analysis

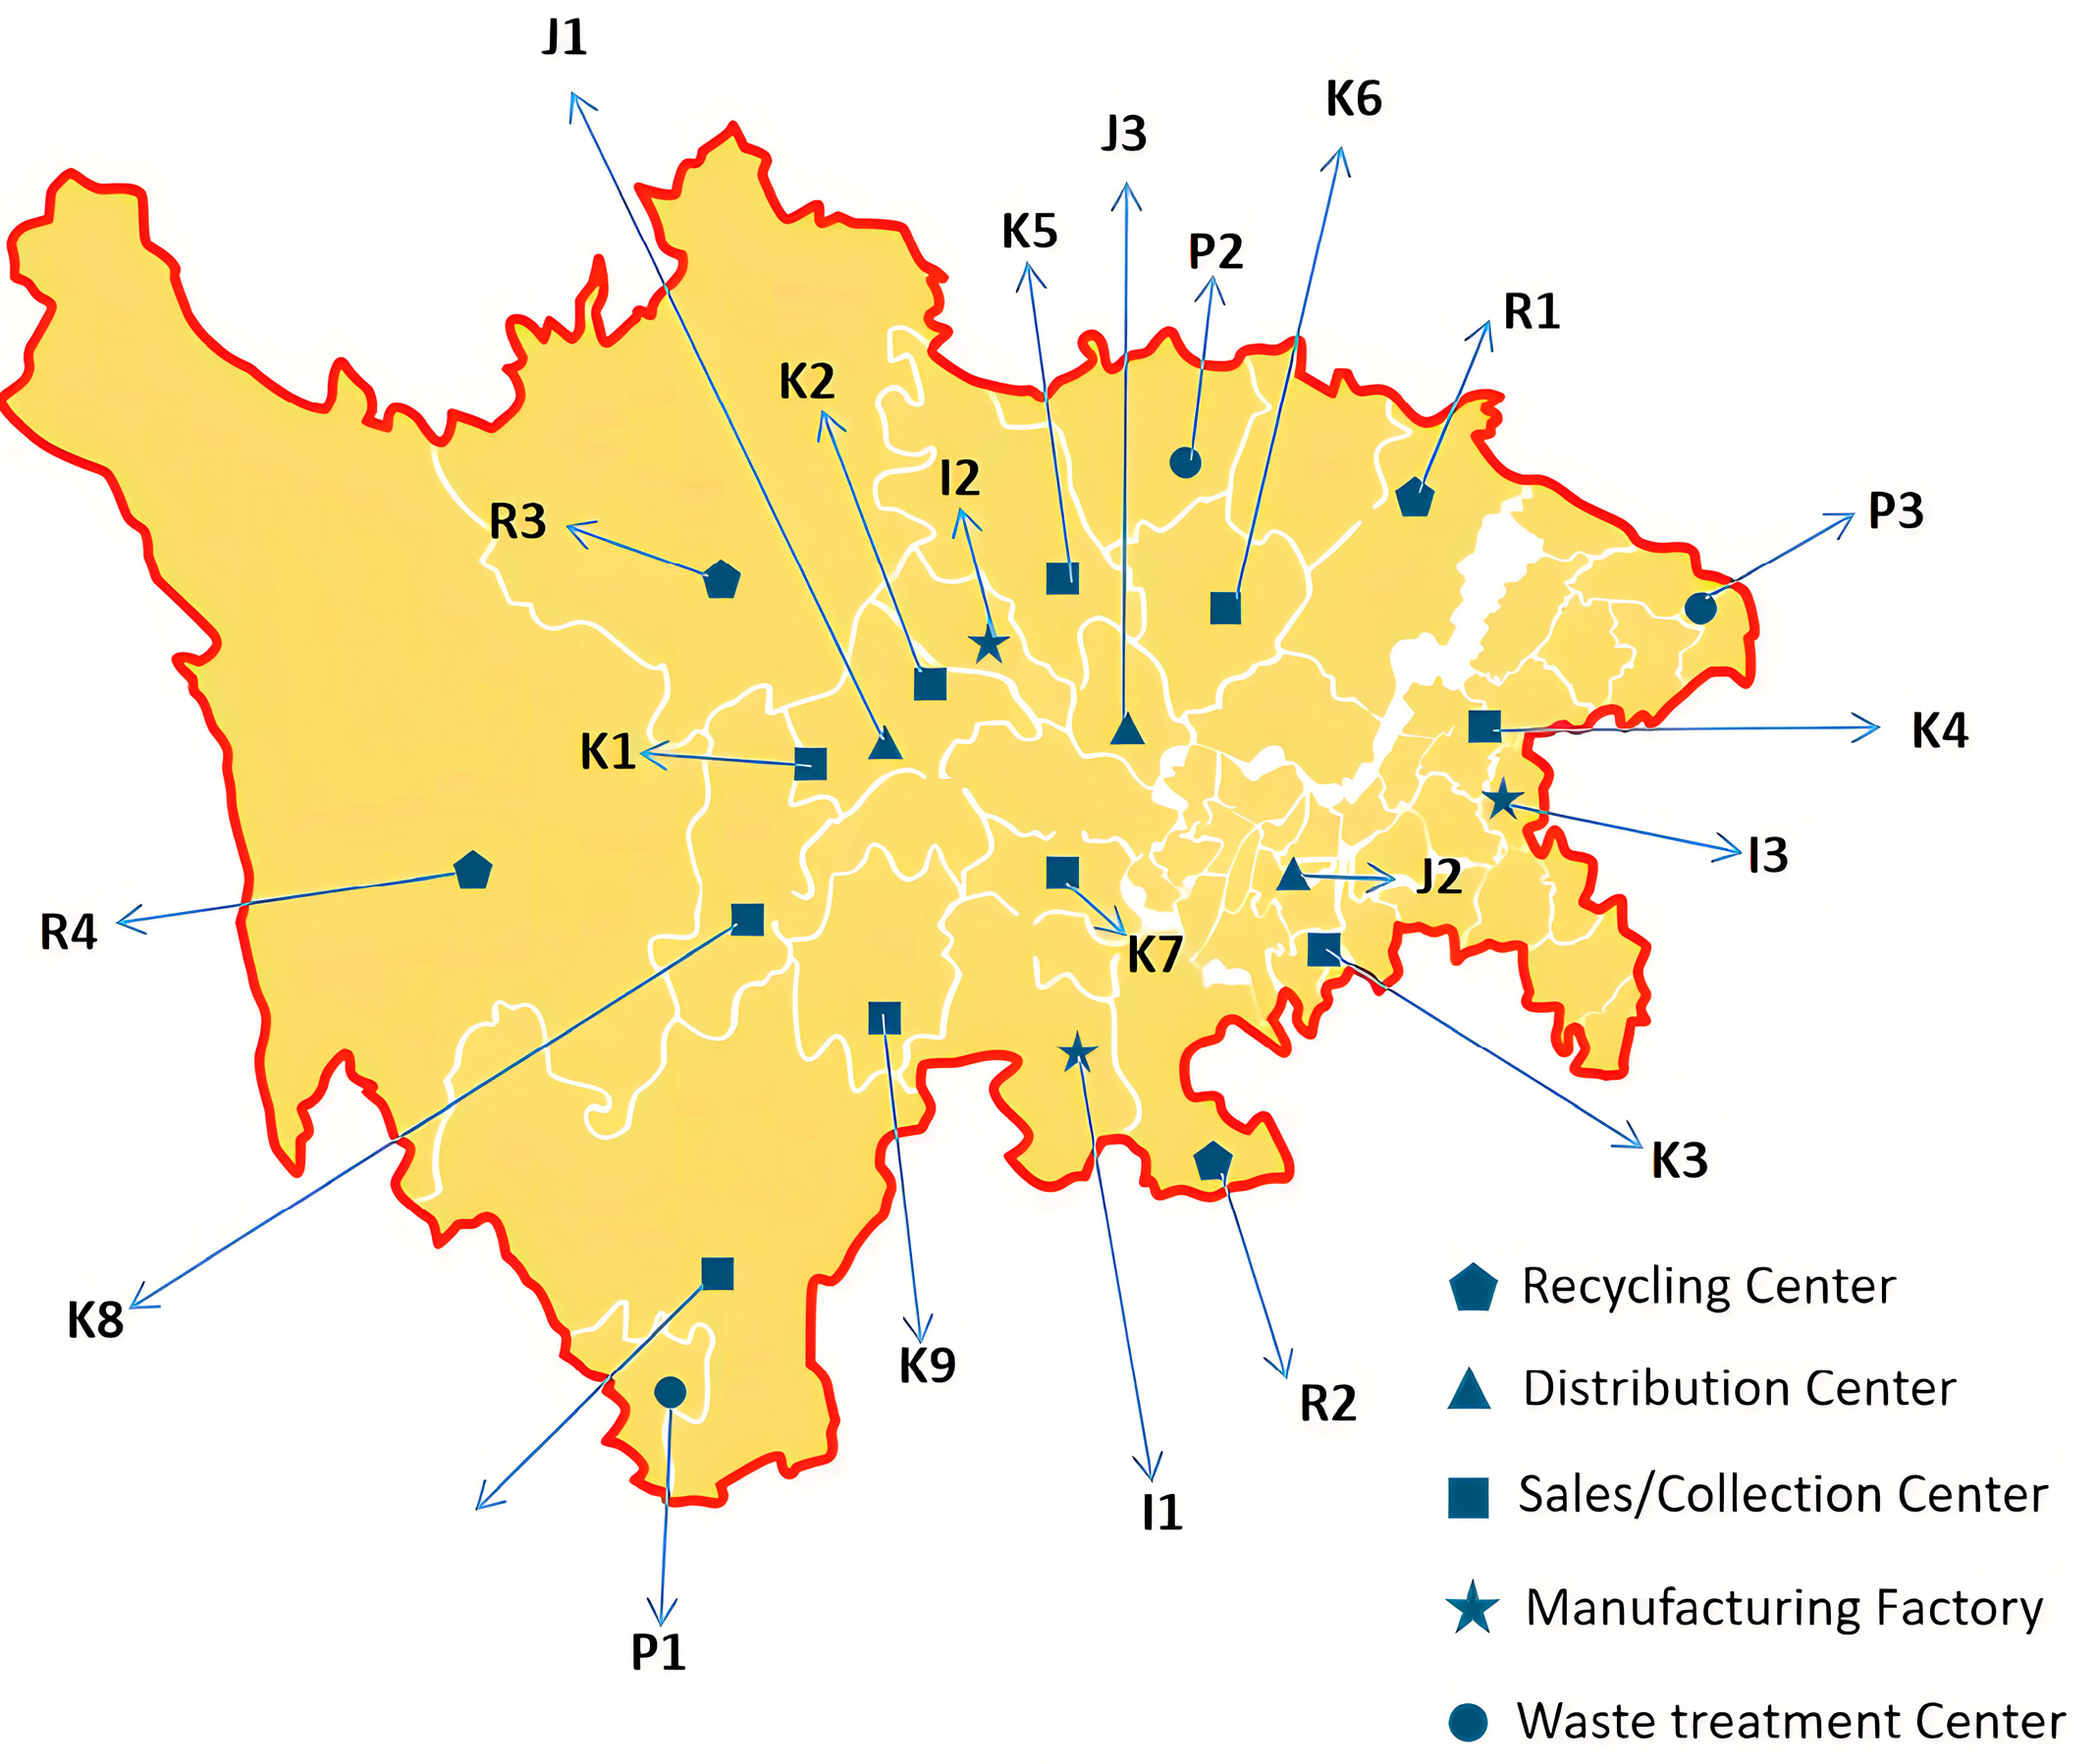
In this paper, the Sichuan and Chongqing region is taken as the main service area of household energy storage Enterprise X. Through the low-carbon recycling system model of household energy storage based on recovery evaluation, the relevant parameters of domestic energy storage are shown in Table 12; the geographical environment, energy consumption structure, industrial structure, per capita GDP, and other factors of the Sichuan and Chongqing regions are considered. Finally, three alternative manufacturing plants, three alternative distribution centers, four alternative recycling centers, three alternative waste treatment centers, and ten alternative sales/collection centers were selected, as shown in Figure 5. The location of each processing center is determined and known. According to the longitude and latitude of each node, the distance between each processing center is calculated based on the Gaode open platform. See the Appendix A Table A1, Table A2, Table A3, Table A4, Table A5, Table A6 and Table A7 for specific data. In addition, the enterprise has 27 fixed and known consumption centers, and the market demand and recovery volume of each consumption center are known. See Appendix A Table A13 for details.
According to the research of Paul et al. [42], consumption of 1 L diesel fuel can generate about 0.0718 kg of carbon dioxide emissions, while the normal fuel consumption of a truck with a load of about 6 tons per kilometer is about 0.308 L, so the unit carbon emissions of Enterprise X in the product transportation process can be calculated to be about 0.0036 kg CO2/(ton·km). In addition, each treatment center, treatment cost, unit carbon emission, and treatment capacity are determined and known. See Appendix A Table A8, Table A9, Table A10, Table A11 and Table A12 for the relevant data.

5.1. Verification and Analysis of Household Energy Storage Recycling System for Enterprise X Considering Recycling Evaluation

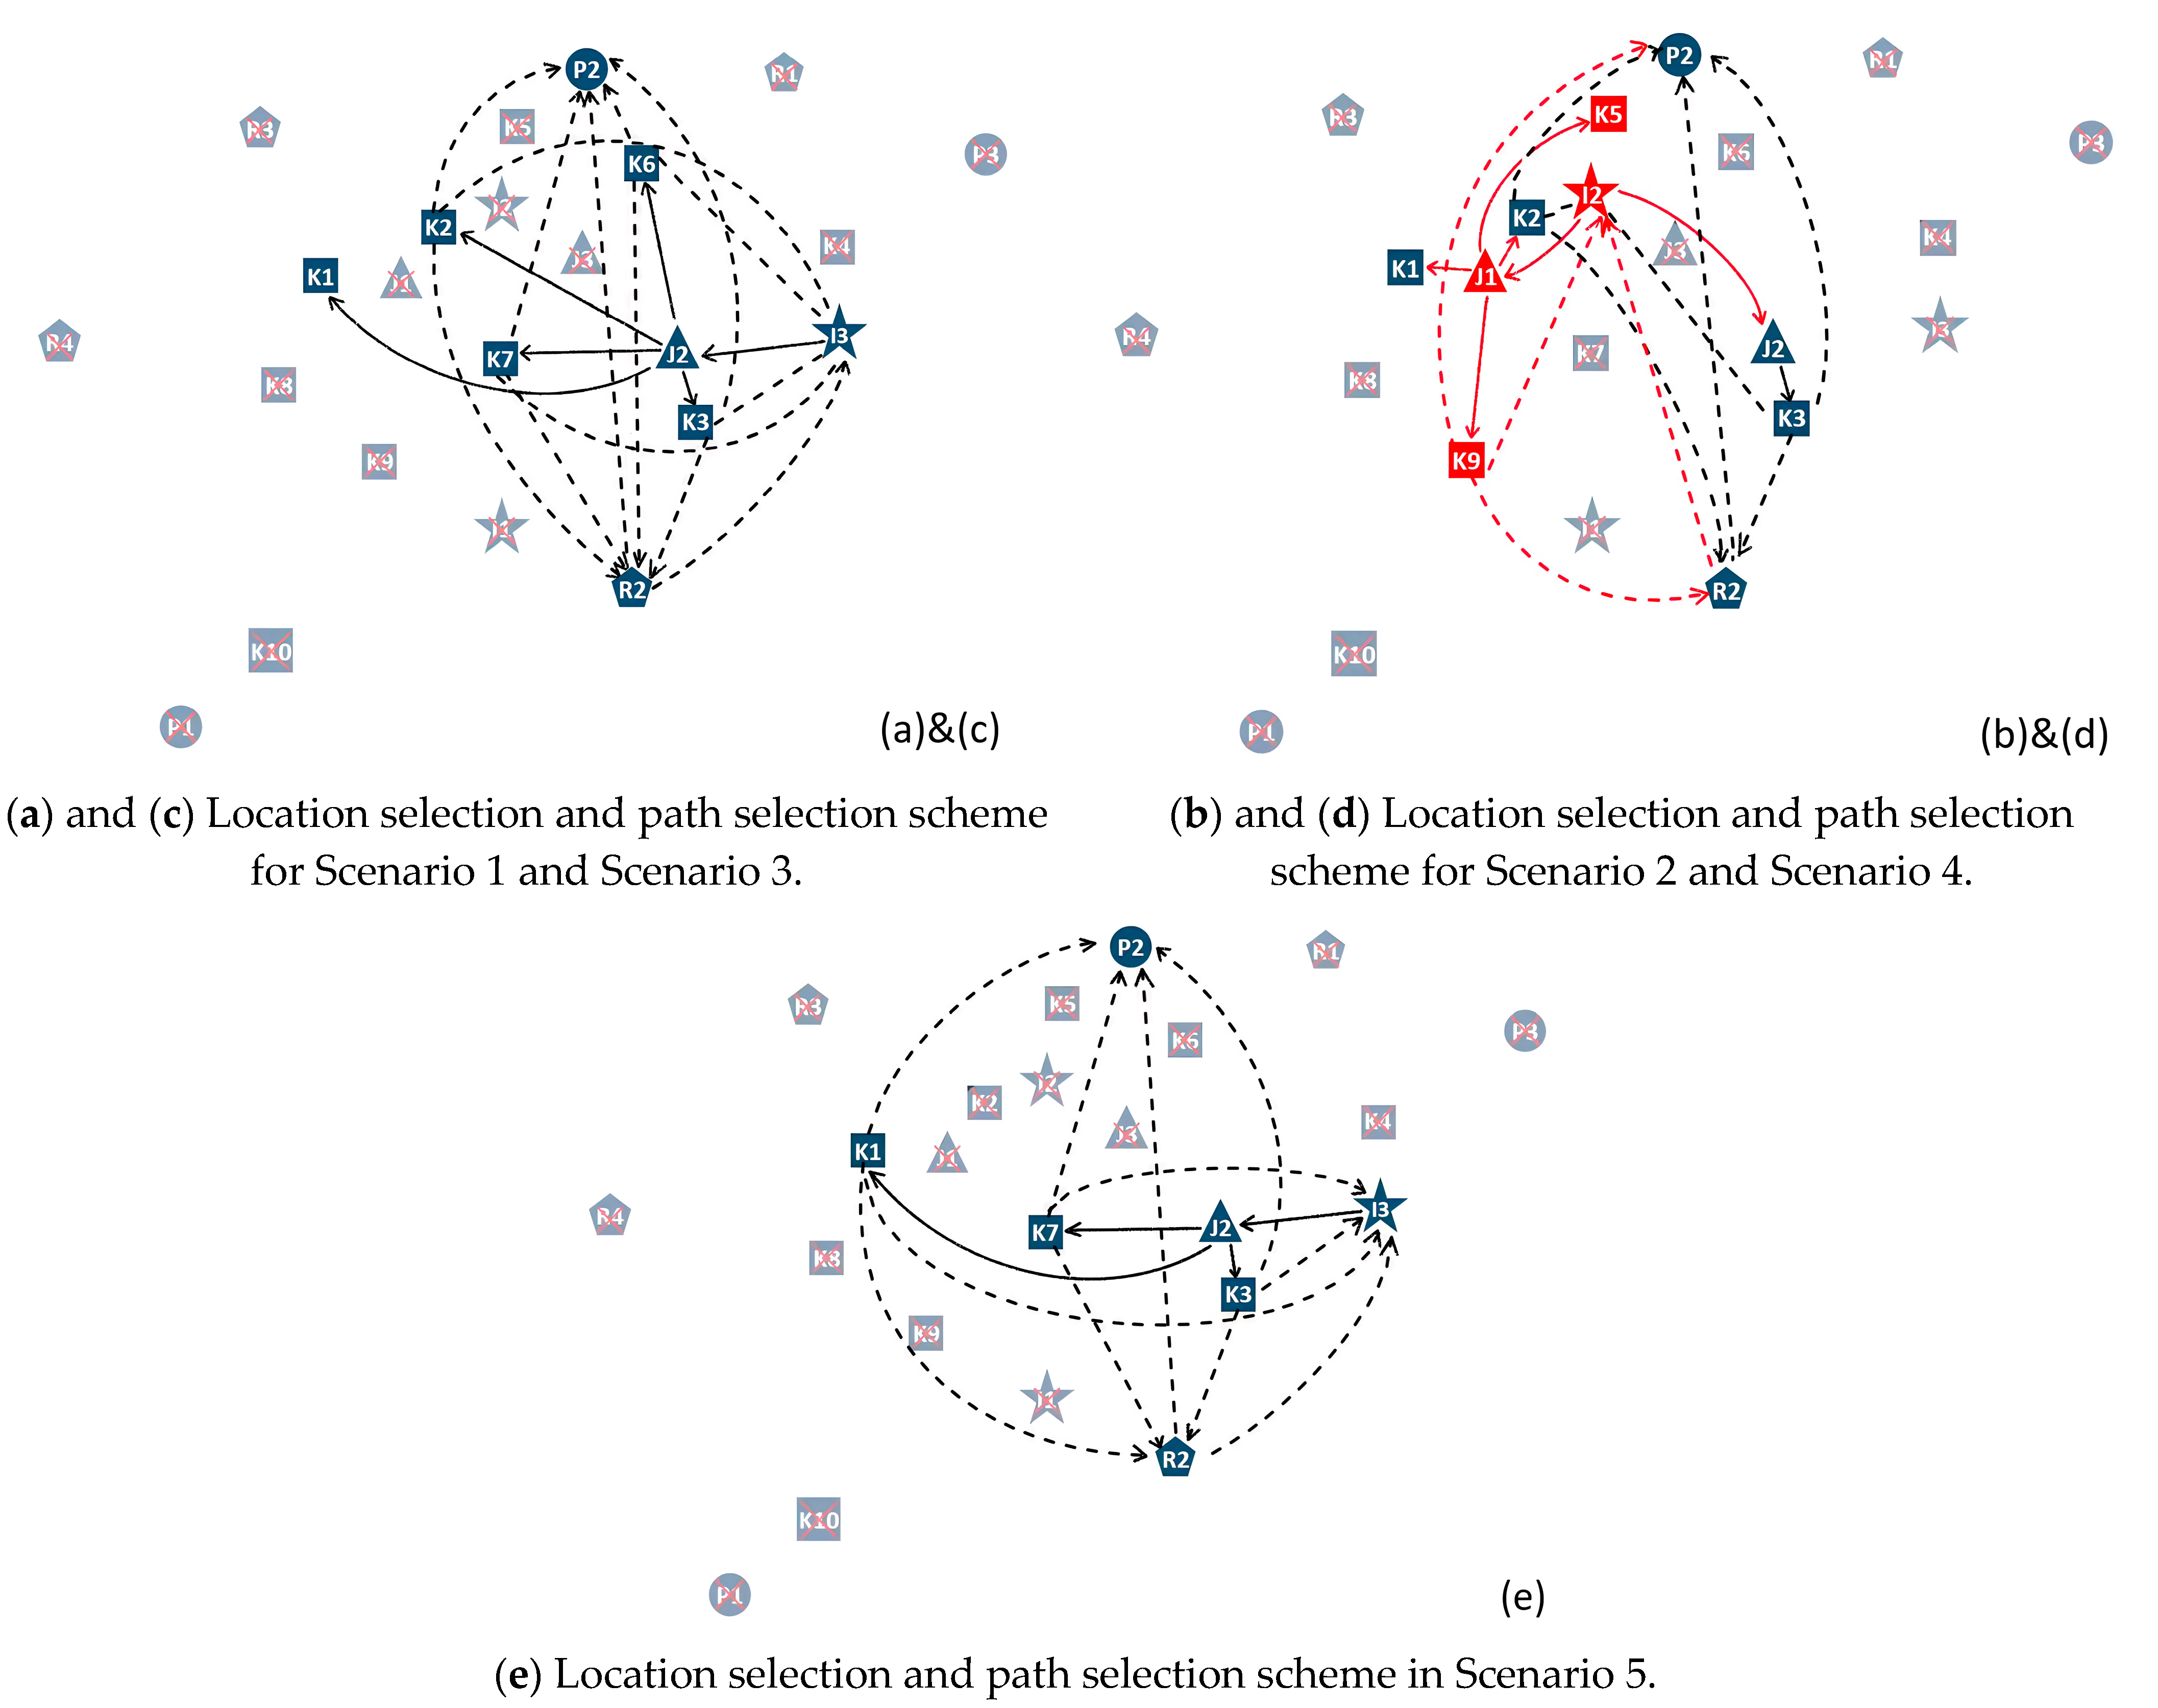
To verify the effectiveness of the system model, two schemes were adopted for comparison, among which scheme 1 is the benchmark scheme, that is, the case of direct recycling without considering the quality of the household energy storage products. Scheme 2 is the recycling model proposed in this paper, that is, we considered the different quality levels of the household energy storage products during recycling, and the situation of adopting three different targeted recycling strategies and distributing them to different processing centers in the recycling network was evaluated. In this paper, we used lingo18 as a platform for us to build the model of programming and simulation; scheme 1 and scheme 2 recycling network as shown in 
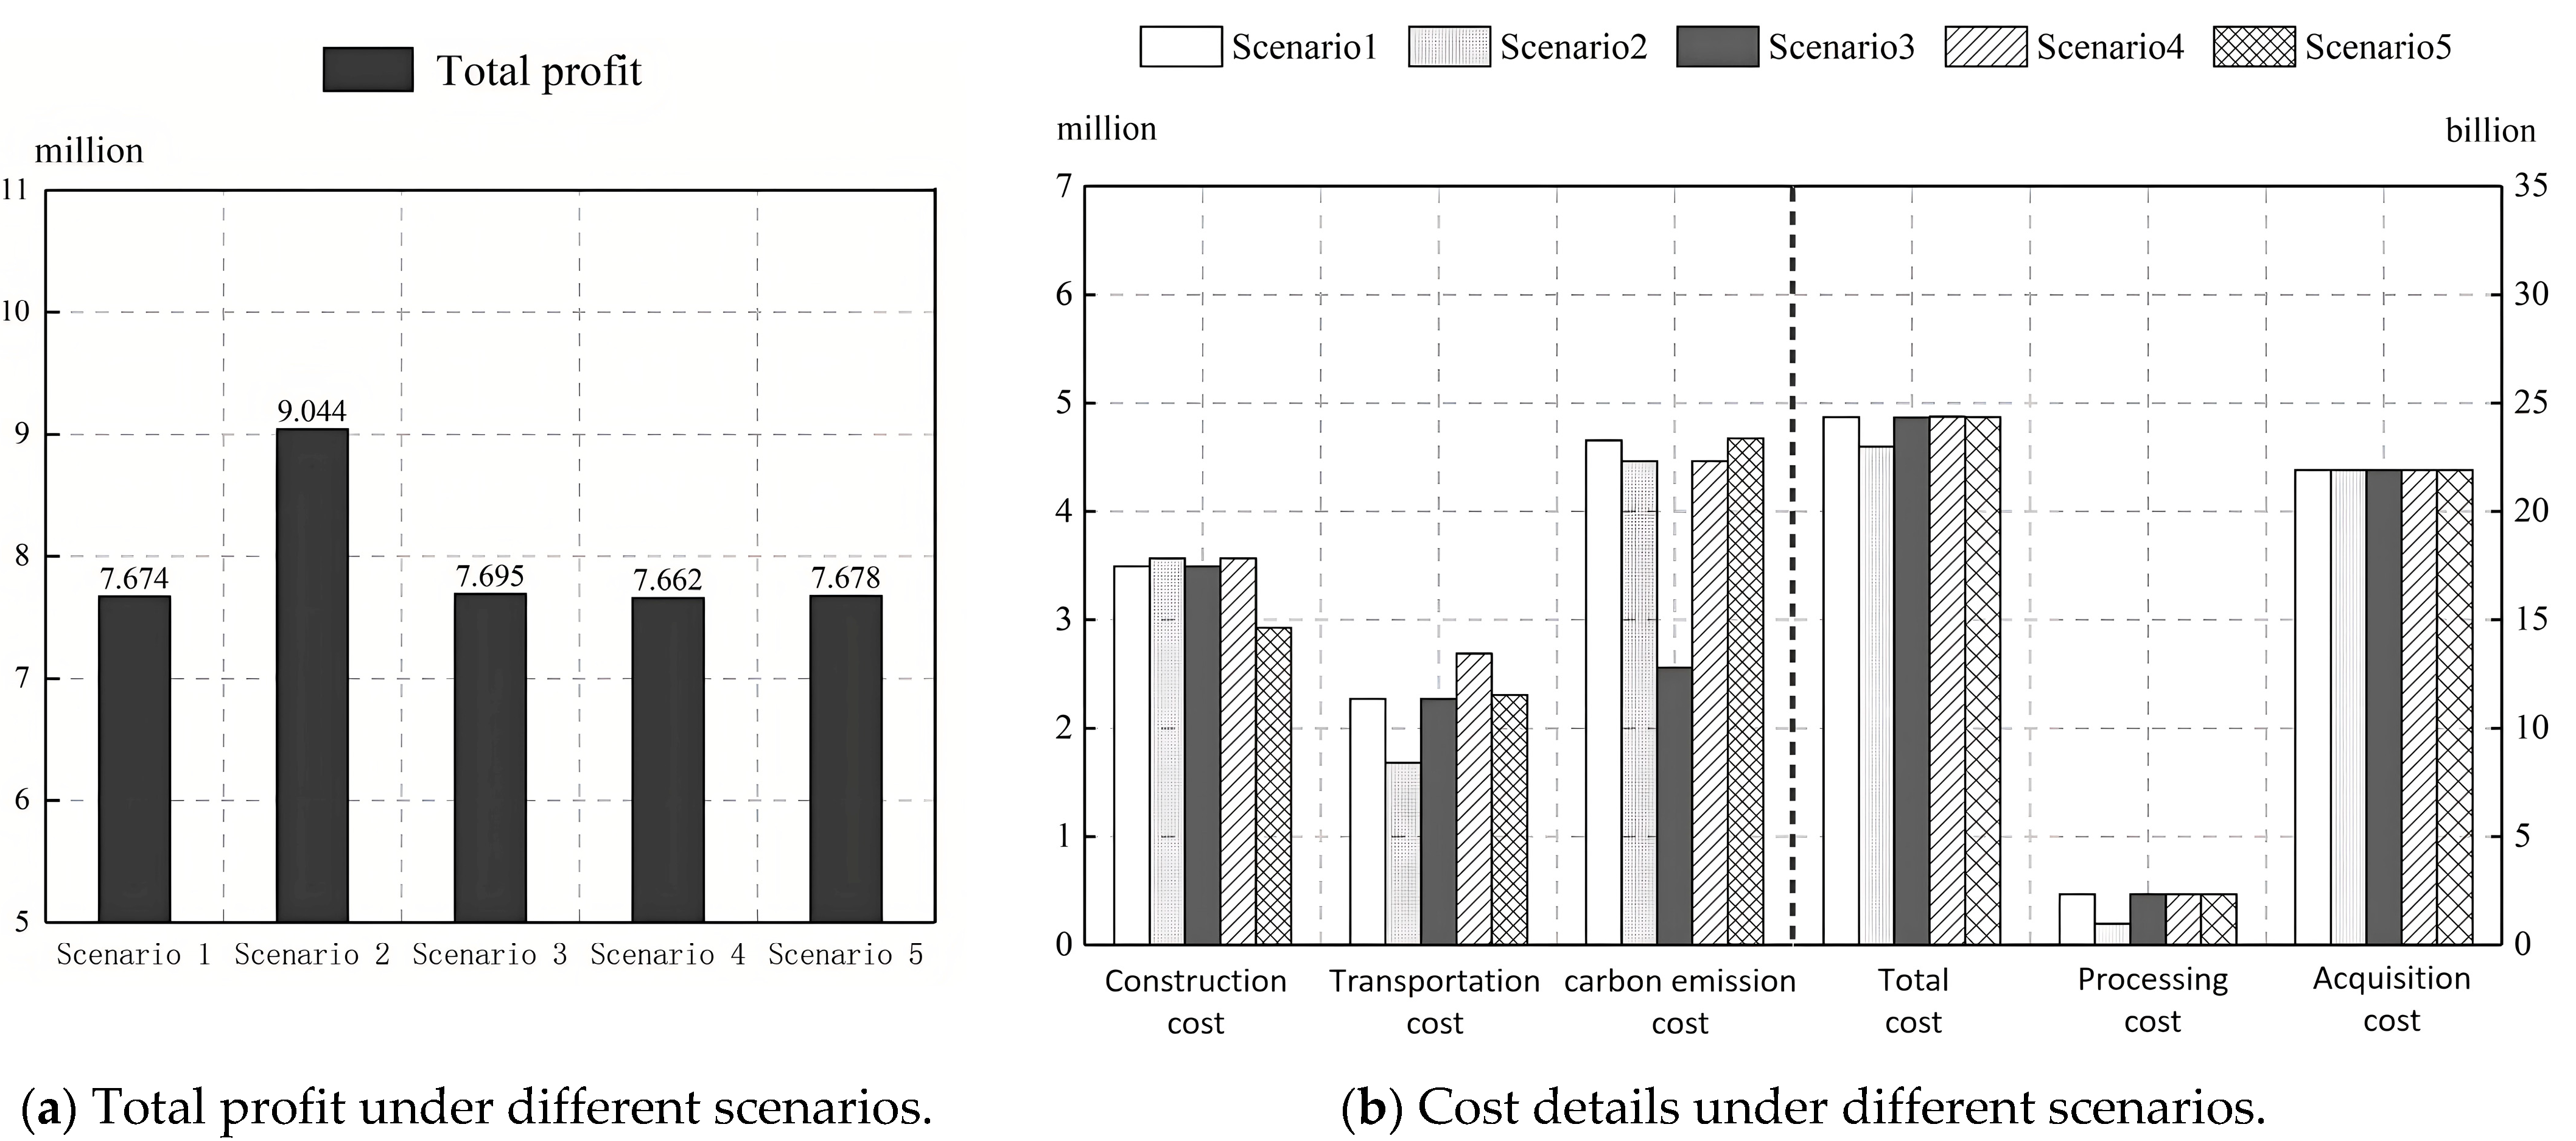
Figure 6 and the total profit and total carbon emissions results are shown in Table 13.
The blue dashed line and the red dashed lines in Figure 6 show the new recycling strategy, and the red nodes indicate the newly opened center compared to the traditional scheme. It can be seen from the experimental results that the optimized scheme 2 recycling system changed the selection of sales/collection centers, and accordingly, the transportation scheme and route between the centers were also changed, and finally, the overall profit of the household energy storage recycling system was increased by about CNY 1,610,004, and the carbon emissions were reduced by about 1,040,006 kg. These data further verify that it is effective and feasible to adopt different recycling channel optimization schemes for different recycling quality levels after evaluation.

5.2. Evaluation of Scenario Analysis of Household Energy Storage Recycling System for Enterprise X Considering Recycling State

According to the optimization model constructed in this paper and Enterprise X results analysis, it was found that there are many factors affecting the cost, location, and path of the household energy storage low-carbon recycling system. Therefore, we set up five scenarios to simulate the impact on the site location, path, economy, and environmental benefits of the household energy storage recycling system when the various factors were changed.
Scenario 1 (a): Assuming that this case is the reference case, all the parameters are set at the standard level;
Scenario 2 (b): Assuming that the manufacturing plants and recycling centers introduce more advanced processing technology, reducing the processing costs of the manufacturing plants and recycling centers by 60% and 50%, respectively;
Scenario 3 (c): Assuming that each treatment center adopts more advanced emission reduction technology, the unit carbon emissions of each treatment center are reduced by 60%;
Scenario 4 (d): Assuming that the global oil prices rise due to the decline in the DOLLAR index or as an impact of war, the unit transportation costs increase by 60% compared to the original benchmark;
Scenario 5 (e): Suppose that the number of household energy storage products processed at the collection/sales center increases by 55% compared to the original benchmark;
The total profit and cost details in the different scenarios are shown in Figure 7; the location selection and path selection scheme is shown in Figure 8.
From the results of (b) and (d), the manufacturing plant changed from I3 to I2, the distribution center added J1, and opened the sales/collection centers K5 and K9 to replace K6 and K7. On the one hand, the improvement of processing technology reduced the unit processing cost; on the other hand, the increase in oil prices increased the transportation cost, which means that the weight of the transportation cost was increased indirectly and directly. After exceeding the economic benefits range of the original location and transportation scheme, the system chose a better location and transportation scheme to maximize the total profits of the whole system.
According to the results of (c), the change of unit carbon emissions of a node had a weak influence on the location selection and path selection of the household energy storage recycling system. From the results shown in (e), the increase of node processing means that some nodes can be considered as meeting the corresponding processing requirements, and the system chose K2 and K6 to reduce the fixed construction cost.

6. Conclusions

In this paper, a recycling system model considering the evaluation of household energy storage recycling state was established, and the optimization of the whole recycling system was realized through the evaluation of household energy storage. The current study provides a planning and decision-making method for home energy storage manufacturers to recycle at the enterprise level. Through the designed model, the results obtained in this paper are summarized as follows:
(1)
Compared with the traditional recycling model, this paper proposed a recycling model that adopts different potential processing strategies for different quality levels through household energy storage evaluation, which can effectively optimize the network configuration in the recycling system.
(2)
Through the scenario comparison, it was concluded that the processing cost, transportation cost, processing capacity, and unit carbon emissions are the main factors affecting the recycling system profit and network configuration.
(3)
The recycling system model constructed in this paper can be used for all household energy storage products produced by different manufacturers. It should be emphasized that the specific conditions of different manufacturers and geographical locations may vary according to the situation.
To sum up, the recovery and reuse of household energy storage can make the production of household energy storage products more sustainable, thus further promoting the sustainable development of the household energy storage market. Although this paper has done more detailed analysis and research on the construction of the household energy storage recycling system model, there are still many problems that need further in-depth study and improvement in the future work.
(1)
With the deepening of relevant research, we can consider the recovery of many different types of household energy storage products and the impact of different transportation modes on the whole recycling system in the process of product transportation, so as to better model the reality.
(2)
Although this paper simulated the impact of various market factors on the system, there are many factors that need to be considered in real life. Therefore, in future research, we can further consider the impact of government intervention or other social behaviors on the recycling system.
(3)
For the recovery system, in addition to carbon emissions, we can also consider other pollutants (various gaseous pollutants) generated during the production of household energy storage products, so as to better predict the impact of the whole system on the environment.

Author Contributions

Conceptualization and methodology, Y.L. and X.W.; simulation and analysis, Y.L.; investigation, X.W.; data curation, Y.L.; writing—original draft preparation, Y.L.; writing—review and editing, Y.L. and X.W.; supervision, X.W.; literature research, Y.L. All authors have read and agreed to the published version of the manuscript.

Funding

This research was supported by the Natural Science Foundation of the Xinjiang Uygur Autonomous Region under Grant 2020D01C031.

Institutional Review Board Statement

Not applicable.

Informed Consent Statement

Not applicable.

Data Availability Statement

Not applicable.

Conflicts of Interest

The authors declare no conflict of interest.

Appendix A

Table A1. Distance between manufacturing plant I and distribution center J (km).
J 1J 2J 3
I 1247.6258.4217.3
I 270.3325.5194.3
I 3463.115.1321.4
Table A2. Distance between manufacturing plant I and sales/collection center K (km).
K 1K 2K 3K 4K 5K 6K 7K 8K 9K 10
I 1251.9252.2245521.7377.2315.6120.2261.1141.7543.7
I 284.272.8338.5505.769.7236.4229.8204.7203.5502.8
I 3479454175.4140.5458.8282369.2561.1468.1859.1
Table A3. Distance between distribution center J and sales/collection center K (km).
K 1K 2K 3K 4K 5K 6K 7K 8K 9K 10
J 117.116.5314.5491.5134.7222.2182.4132.9137.5431
J 2313.4228.420.4271303.3172.8184.6395.5291.6693.5
J 3201155170.5352.8183110.7109.6283.1205.8581.2
Table A4. Distance between recycling center R and sales/collection center K (km).
K 1K 2K 3K 4K 5K 6K 7K 8K 9K 10
R 1403.4381.4249166346.9170.5374.6523.5455.9821.6
R 2278.9279.2158.9435.6385.2312.9109.3327.5186.4600
R 3185210.8501.6682.5271.1413367.1266.3327.5564.4
R 4235.1252.5511.2724.2363.3459.6349.2112.1254.4370.7
Table A5. Distance between waste treatment center P and sales/collection center K (km).
K 1K 2K 3K 4K 5K 6K 7K 8K 9K 10
P 1867.6867.98651141.7992.9944.1748.8797757.4496.6
P 2303.4287403.7410.5178.9221.6379.7408.8417.7706.8
P 3688.7659.5468.3187.1624.4448625798.5721.21096.6
Table A6. Distance between manufacturing I plant and recycling center R (km).
I 1I 2I 3
R 1481.9401.8228.6
R 2110340.9310.3
R 3429.9230650.1
R 4348.5307.7664.1
Table A7. Distance between recycling center R and waste treatment center P (km).
P 1P 2P 3
R 11107.5269.4318.8
R 2730.8483.4602.8
R 31052.3417.7852.9
R 4861.3511.7901.5
Table A8. Details of various costs, processing capacity and unit carbon emissions of manufacturing plant I.
I 1I 2I 3
Construction cost (CNY)700,000872,000822,000
Processing capacity (pcs)48,30052,60046,800
Manufacturing cost (CNY/piece)263026202610
Refurbishment cost (CNY/piece)128012601230
Manufacturing carbon emissions (kg/piece)288.24285.44276.48
Refurbished carbon emissions (kg/piece)104.08100.898.88
Table A9. Details of various costs, treatment capacities, and unit carbon emissions of waste treatment center P.
P 1P 2P 3
Construction cost (CNY)384,500368,900356,000
Processing capacity (pcs)712357265950
Processing cost of the collection center (CNY/kg)1.081.121.29
Treatment cost of recycling center (CNY/kg)0.690.740.89
Carbon emissions through the collection center (kg/kg)0.1760.180.192
Carbon emissions through recycling center (kg/kg)0.1040.1120.124
Table A10. Details of various costs, processing capacities, and unit carbon emissions of distribution center J.
J 1J 2J 3
Construction cost (CNY)255,000290,000330,000
Processing capacity (pcs)45,30046,30045,600
Processing cost (CNY/piece)1514.914.48
Carbon emissions treatment (kg/unit)0.240.220.2016
Table A11. Details of various costs, treatment capacities, and unit carbon emissions of the recovery center R.
R 1R 2R 3R 4
Construction cost (CNY)506,000590,000498,000518,000
Processing capacity (pcs)6900570059006700
Processing cost (CNY/piece)3312315934563519
Recovered carbon emissions (kg/piece)79.5673.0879.6880.32
Table A12. Details of various costs, processing capacities, and unit carbon emissions of sales/collection center K.
Construction Cost (CNY)Processing Capacity (pcs)Sales Processing Cost (CNY/Piece)Collection Processing Cost (CNY/Piece)Sales of Carbon Emissions (kg/Unit)Collection Carbon Emissions (kg/Piece)
K 1180,00010,00019.56103.560.34080.8928
K 2250,000800018.3299.840.33120.8064
K 3280,000900017.56100.320.32640.7968
K 4295,60010,04016.2100.080.34560.9408
K 5196,000996019.32106.320.360.9552
K 6316,000988016.2100.20.32640.792
K 7298,00011,64018.72101.040.35520.9696
K 8326,00013,24021104.280.37921.0464
K 9284,000864017.2100.920.36481.0032
K 10303,00012,96015.96100.320.38881.0752
Table A13. Detailed data of demand and recovery of each consumption center L.
Demand in Stage 1Demand in Stage 2Recoverable Quantity in Stage 1
L 118942272235
L 219652358268
L 317362083242
L 417692122291
L 516651998301
L 616892026235
L 716782013201
L 8785942138
L 9796955125
L 10778933201
L 1113651638214
L 1212581509220
L 1313691642196
L 1411231347195
L 1510981317196
L 1613691642199
L 1714861783204
L 1813891666213
L 1913751650223
L 2013441612225
L 2115321838218
L 2214321718209
L 2313211585199
L 2413691642189
L 2514211705209
L 2614411729243
L 2713561627211

References

  1. Huang, Y.; Ding, T.; Li, Y.; Chi, F.; Wang, K.; Wang, X.; Wang, X. Summary of energy low-carbon technology in the context of carbon neutrality and its inspiration for the development of new power systems. J. China Electr. Eng. 2021, 41, 28–51. [Google Scholar]
  2. Zhang, X.; Qin, C.C.; Loth, E.; Xu, Y.; Zhou, X.; Chen, H. Arbitrage analysis for different energy storage technologies and strategies. Energy Rep. 2021, 7, 8198–8206. [Google Scholar] [CrossRef]
  3. Zhao, D.; Xu, C.; Tao, R.; Zheng, Y. Summary of research on flexible regulation of multiple distributed energy storage on distribution side of new power system. J. China Electr. Eng. 2022, 8, 23. [Google Scholar]
  4. ChinaIRN. Home Energy Storage Application Market Scale and Development Prospect Analysis in 2022. 2022. Available online: https://it.chinairn.com/news/20220905/210259571.html (accessed on 5 September 2022).
  5. Tang, D.; Wang, J.; Chen, W.; Ji, G.; Ma, J.; Zhou, G. Research status and prospect of direct recovery of cathode materials for retired lithium ion batteries. Inorg. Salt Ind. 2022, 11, 14. [Google Scholar]
  6. Cao, Y.; Zhang, Y.; Duan, J.; Dong, P. Research progress in recovery of lithium cobaltate cathode materials for waste lithium ion batteries. China Nonferrous Metall. 2022, 51, 23–31. [Google Scholar]
  7. Speidel, S.; Bräunl, T. Leaving the grid-The effect of combining home energy storage with renewable energy generation. Renew. Sustain. Energy Rev. 2016, 60, 1213–1224. [Google Scholar] [CrossRef]
  8. Bila, M.; Opathella, C.; Venkatesh, B. Grid connected performance of a household lithium-ion battery energy storage system. J. Energy Storage 2016, 6, 178–185. [Google Scholar] [CrossRef]
  9. Sander, V.; Aiskaif, T.; Sark, W. Techno-economic analysis of household and community energy storage for residential prosumers with smart appliances. Appl. Energy 2017, 209, 266–276. [Google Scholar]
  10. Dong, S.; Kremers, E.; Brucoli, M.; Rothman, R.; Brown, S. Techno-enviro-economic assessment of household and community energy storage in the UK. Energy Convers. Manag. 2019, 205, 112330. [Google Scholar] [CrossRef]
  11. Tungadio, D.; Sun, Y. Isolated household energy storage improvement using ultracapacitor. In Proceedings of the 2021 1st Odisha International Conference on Electrical Power Engineering, Communication and Computing Technology (ODICON), Bhubaneswar, India, 8–9 January 2021. [Google Scholar]
  12. Zhao, W.; Li, X.; Qiao, R.; Li, P.; Lei, E. VSG control strategy of isolated island microgrid based on hybrid energy storage. Power Syst. Prot. Control 2021, 49, 33–40. [Google Scholar]
  13. Zhang, Q.; Deng, X.; Yue, H.; Sun, T.; Liu, Z. Electric vehicles taking into account the battery life loss participate in the energy-FM market collaborative optimization strategy. J. Electr. Technol. 2022, 37, 72–81. [Google Scholar]
  14. Lv, Z.J.; Xiu, J.P.; Yang, Z.Q.; Liu, T.X. Evaluation of power battery discharge performance based on electric vehicle driving data. J. Beijing Univ. Posts Telecommun. 2022, 45, 30–35. [Google Scholar]
  15. Du, X.; Li, B.; Miao, J.; Guo, X. Operation condition and performance detection analysis of distributed energy storage battery. China Electr. Power 2021, 54, 119–124. [Google Scholar]
  16. Zhang, X.; Jin, H.; Jiang, Y. Health assessment of power battery based on improved TCN model. Energy Storage Sci. Technol. 2022, 11, 1618–1626. [Google Scholar]
  17. Mou, S.; Xie, Y. Development status, existing problems and countermeasures of waste power battery recycling in China. Non-Ferr. Met. Eng. 2022, 12, 153–158. [Google Scholar]
  18. Chen, W.; Wang, X.; Li, X. Overview of patents for recovery and pretreatment of waste lithium ion batteries. Battery 2021, 51, 530–533. [Google Scholar]
  19. Xiao, W.; Zhang, H. Overview of recycling and utilization of lithium ion batteries for used vehicles in China. Power Supply Technol. 2020, 44, 1217–1222. [Google Scholar]
  20. Han, X.; Zhang, J.; Fan, J.; Wang, Y. Summary of recovery and treatment methods of waste lithium ion battery electrolyte. Battery 2021, 51, 205–208. [Google Scholar]
  21. Lei, L.; Li, W.; Li, H.; Li, W.; Zhang, B. Waste lithium ion power battery recovery technology and safety risk analysis. Sci. Technol. Innov. 2020, 25, 189–190. [Google Scholar]
  22. Lu, N.; Zhang, B.; Liu, G.; Zhang, F.; Wang, F. Review of waste lithium iron phosphate battery recovery technology. Compr. Util. Resour. China 2020, 38, 105–109. [Google Scholar]
  23. Liao, Y.; Meng, X.; Huang, Q.; Su, Y. Review of lithium ion battery recovery technology from an economic perspective. Battery 2022. Available online: http://kns.cnki.net/kcms/detail/43.1129.TM.20221220.1154.002.html (accessed on 11 January 2023).
  24. Wang, B.; Liang, J.; Li, H.; Yang, Y.; Zheng, T. Overview of metal ion recovery technology of waste lithium ion batteries. Power Supply Technol. 2019, 43, 165–167. [Google Scholar]
  25. Harper, G.; Sommerville, R.; Kendrick, E.; Driscoll, L.; Slater, P.; Stolkin, R.; Walton, A.; Christensen, P.; Heidrich, O.; Lambert, S.; et al. Recycling lithium-ion batteries from electric vehicles. Nature 2019, 575, 75–86. [Google Scholar] [CrossRef] [PubMed]
  26. Tian, X.; Wu, Y.; Hou, P.; Liang, S.; Qu, S.; Xu, M.; Zuo, T. Environmental impact and economic assessment of secondary lead production: Comparison of main spent lead-acid battery recycling processes in China. J. Clean. Prod. 2017, 144, 142–148. [Google Scholar] [CrossRef]
  27. Ciez, R.; Whitacre, J. Examining different recycling processes for lithium-ion batteries. Nat. Sustain. 2019, 2, 148–156. [Google Scholar] [CrossRef]
  28. Zhang, X.; Wu, B.; Ming, B.; Liang, Y. Interpretation of the series of standards for recycling and regeneration technology of retired power batteries. Battery 2022, 52, 569–573. [Google Scholar]
  29. Yao, P.; Huang, Q.; Zhang, X.; Li, H.; Song, X.; Wang, J. Research on the recovery potential of key resources in China’s retired power batteries. Rare Metals 2022, 46, 1331–1339. [Google Scholar]
  30. Chen, W.; Wang, X.; Li, H. Overview of waste lithium ion battery recycling and pretreatment patents. Battery 2021, 51, 530–533. [Google Scholar]
  31. Zhong, T. Research on reverse logistics mode selection and network construction of waste lead-acid batteries. Jiangxi Univ. Technol. 2015. [Google Scholar] [CrossRef]
  32. Shih, L.H. Reverse logistics system planning for recycling electrical appliances and computers in Taiwan. Resour. Conserv. Recycl. 2001, 32, 55–72. [Google Scholar] [CrossRef]
  33. Ko, H.J.; Evans, G.W. A genetic algorithm-based heuristic for the dynamic integrated forward/reverse logistics network for 3PLs. Comput. Oper. Res. 2007, 34, 346–366. [Google Scholar] [CrossRef]
  34. Dong, J.; Wang, G.; Lu, M.; Gao, G. Multi-level reverse logistics network optimization design model for product recovery. Comput. Integr. Manuf. Syst. 2008, 14, 33–38. [Google Scholar]
  35. Xiong, H.; Hu, Y.; Xu, J.; Huang, W. Construction and optimization of reverse logistics network for new energy vehicle batteries from the perspective of blockchain. Logist. Eng. Manag. 2022, 44, 36–39. [Google Scholar]
  36. Geng, L.; Zhang, N.; Zhang, Z. Planning and design of reverse logistics network for recycling lead-acid batteries for electric bicycles. Logist. Technol. 2020, 39, 8–11. [Google Scholar]
  37. Li, Y. Research on the construction of logistics network for household waste battery recycling by medium-sized enterprises. Logist. Technol. 2022, 45, 1–4. [Google Scholar]
  38. Zhu, L.; Chen, M. Research on reverse logistics mode and recycling network of waste power batteries. China Mech. Eng. 2019, 30, 1828–1836. [Google Scholar]
  39. Wu, J. Research on the optimization of power battery recovery mode of Company B based on reverse supply chain. Liaoning Univ. Eng. Technol. 2022. [Google Scholar] [CrossRef]
  40. Shao, Z.; Liu, X.; Zhang, S. Research on the economic benefits of power battery recovery method based on system dynamics model. Logist. Technol. 2022, 41, 44–48. [Google Scholar]
  41. Yu, W.; Yan, Z.; Zhang, Y. Carbon Emission Reduction by Echelon Utilization of Retired Vehicle Power Batteries in Energy Storage Power Stations. World Electr. Veh. J. 2022, 8, 144. [Google Scholar] [CrossRef]
  42. Nieuwenhuis, P.; Beresford, A.; Choi, K. Shipping or local production? CO2 impact of a strategic decision: An automotive industry case study. Int. J. Prod. Econ. 2012, 140, 138–148. [Google Scholar] [CrossRef]
Figure 1. The household energy storage recycling system.
Energies 16 01822 g001
Figure 2. Status assessment process of household energy storage recycling.
Energies 16 01822 g002
Figure 3. Feasibility assessment process of household energy storage and recovery.
Energies 16 01822 g003
Figure 4. Household energy storage recovery residual value evaluation index.
Energies 16 01822 g004
Figure 5. Distribution of alternative processing centers.
Energies 16 01822 g005
Figure 6. Comparison diagram of recovery network between scheme 1 and scheme 2.
Energies 16 01822 g006
Figure 7. Total profit and cost details under different scenarios.
Energies 16 01822 g007
Figure 8. Location selection and path selection schemes in different scenarios.
Energies 16 01822 g008
Table 1. The recovery feasibility evaluation of household energy storage.
RecyclabilityAssessment Result
80% ≤ R ≤ 100%Suitable for recycling
60% ≤ R < 80%Suitable for repair, recycling is not recommended
R < 60%Not suitable for recycling
Table 2. Relevant parameters of the manufacturing plant.
ParameterMeaningParameterMeaning
F c i The fixed construction cost of building the manufacturing plant i (CNY) R c i The refurbishment cost of per home energy storage (CNY/unit)
C p i The maximum processing capacity of home energy storage at the manufacturing plant i M a i The carbon emission of household energy storage manufacturing (kg/unit)
M c i The manufacturing cost of per household energy storage (CNY/unit) R a i The household energy storage refurbished carbon emissions (kg/unit)
Table 3. Relevant parameters of the distribution center.
ParameterMeaningParameterMeaning
F c j The fixed construction cost of distribution center j (CNY) D c j The unit distribution cost of household energy storage by the distribution center j (CNY/unit)
C p j The maximum processing capacity of home energy storage at the distribution center j D a j The carbon emissions of household energy storage treatment by the distribution center j (kg/unit)
Table 4. Relevant parameters for the sales/collection center.
ParameterMeaningParameterMeaning
F c k The fixed construction cost of the sales/collection center k (CNY) C c k The processing cost (CNY/unit) of the sales/collection center at the time of collection
C p k The sales/collection quantity(s) at the sales/collection center k S a k The carbon emissions (kg/unit) from sales/collection centers at the time of sales.
S c k The processing cost (CNY/unit) of the sales/collection center at the time of sales C a k The carbon emissions (kg/unit) of the sales/collection center at the time of collection.
Table 5. Relevant parameters of the consumption center.
ParameterMeaningParameterMeaning
D m t l The quantity of household energy storage required by each stage of the consumption center. R q l The amount of household energy storage that is recyclable by the consumer center
Table 6. Relevant parameters of the recycling center.
ParameterMeaningParameterMeaning
F c r The fixed construction cost for building the recovery center r (CNY) R c r The processing cost of the recovery center r (CNY/unit)
C p r The maximum processing capacity of the recovery center r (CNY) R a r The unit carbon emissions of the recovery center for processing (CNY/unit)
Table 7. Relevant parameters of the waste treatment center.
ParameterMeaningParameterMeaning
F c p The fixed construction cost for building waste treatment center p (CNY) P c 2 The waste treatment cost for recovery center r (CNY/kg)
C p p The maximum processing capacity of the waste treatment center p (CNY) P a 1 The carbon emissions of the waste treatment for sales/collection center k (kg/kg)
  P c 1 The waste treatment cost for sales/collection center k (CNY/kg) P a 2 The carbon emissions of the waste treatment for recovery center r (kg/kg)
Table 8. Parameters of the distance correlation of each point.
ParameterMeaningParameterMeaning
T c 1 The unit transportation cost (CNY/piece/km) of household energy storage (genuine product) d k i The distance from sales/collection center k to manufacturing plant i (km)
T c 2 The unit transportation cost (CNY/piece/km) for household energy storage (disassembled) d k r The distance from sales/ collection center k to recycling center r (km)
T c 3 The unit transportation cost (CNY/kg/km) of household energy storage (decomposed) d k p The distance (km) from the sales/collection center k to the waste treatment center p
d i j The distance from manufacturing plant i to distribution center j (km) d r i The distance from the recycling center r to the manufacturing plant i (km)
d j k The distance from distribution center j to sales/collection center k (km) d r p The distance from the recycling center r to the waste treatment center p (km)
d k l The distance from sales/collection center k to consumer center l (km)
Table 9. Other relevant parameters.
ParameterMeaningParameterMeaning
g 1 The genuine weight of the household energy storage product (kg) R e 3 The recovery cost of 11–59% of the product residual value (CNY)
g 2 The disassembled weight (kg) R e 4 The recovery cost of 10% or less of the product residual value (CNY)
g 3 The decomposed weight below 60% of the residual value (kg) P r f 1 The selling price of home energy storage products (CNY/piece)
g 4 The decomposed weight of 60% or more of the output value (kg) P r f 2 The price of the disassembly and recycling part of household energy storage products (CNY/ piece)
P c i The proportion of product residual value 80% or above R a c The purchasing cost of raw materials purchased by the manufacturing plant i from the material supplier (CNY/kg)
P c r The product residual value of the above 11–79% proportion S p c The purchase cost (CNY/set) of the parts purchased by the manufacturing plant i from the material supplier
P c p The proportion of 10% or less of the product residual value T r a The transport unit carbon emissions (kg/kg/km)
P r i 1 The selling price of home energy storage products (CNY/piece) C t The carbon tax price (CNY/kg)
P r i 2 The price of the disassembly and recycling part of household energy storage products (CNY/piece) M Denotes an infinite number
R e 1 The recycling cost of 80% or more of the product residual value (CNY) t The number of time phases and the time period t ϵ { 1 , 2 , , T }
R e 2 The recovery cost of 60–79% of the product residual value (CNY)
Table 10. Transportation decision variables.
ParameterMeaningParameterMeaning
x t i j The transportation volume from manufacturing plant i to distribution center j in stage t (unit) x t k r The transportation volume of stage t collection center k to the recycling center r (unit)
x t j k The transportation volume of stage t distribution center j to sales/collection center k (unit) x t k p The transportation volume of stage t collection center k to the waste treatment center p (unit)
x t k l The stage t sales/collection center k to consumer center l volume (unit) x t r i The transport volume (kg) from the stage recovery center t to the manufacturing plant i
x t l k The transportation volume of stage t consumer center l to sales/collection center k (unit) x t r p The transport volume (kg) from the stage recovery center r to the waste treatment center p
x t k i The transportation volume of stage t collection center k to the manufacturing plant i (unit)
Table 11. Other decision variables.
ParameterMeaningParameterMeaning
o t The stage t plant quantity of raw material purchased from raw material suppliers (kg) s t i The amount of household energy storage available at the stage t manufacturing plant i (unit)
z t i The amount of household energy storage of the stage t manufacturing plant i
Table 12. Relevant parameters of household energy storage products produced by Enterprise X.
Related ParametersNumerical ValueUnits
Product quotation38,500CNY
Service life10year
Product capacity13.5kWh
Product weight120kg
Size (H × W × D)160 × 75 × 16cm
Operating temperature−20~50°C
Table 13. Total profit and carbon emissions of scheme 1 and scheme 2.
Scheme 1Scheme 2
Profit (ten million CNY)7.5127.673
Carbon emissions (ten thousand tons)7.8647.759
Disclaimer/Publisher’s Note: The statements, opinions and data contained in all publications are solely those of the individual author(s) and contributor(s) and not of MDPI and/or the editor(s). MDPI and/or the editor(s) disclaim responsibility for any injury to people or property resulting from any ideas, methods, instructions or products referred to in the content.

