Article

Investigations on the Heat Transfer between an Electrical Heating Rod and a Rail for Heated Railway Switch Points

Chair of High Voltage and High Current Engineering, Faculty of Electrical and Computer Engineering, Institute of Electrical Power Systems and High Voltage Engineering (IEEH), Technische Universität Dresden, 01069 Dresden, Germany
*
Author to whom correspondence should be addressed.
Energies 2023, 16(4), 1678; https://doi.org/10.3390/en16041678
Submission received: 20 December 2022 / Revised: 30 January 2023 / Accepted: 2 February 2023 / Published: 8 February 2023

Abstract

:
Electrical heating rods are a commonly used application for switch point heating in order to keep switch points free from ice and snow. Clamps made of spring steel usually attach the heating rod to the rail. They are localized at certain positions at a distance from each other. Thermal images showed significant temperature differences on the surface of the heating rod depending on the longitudinal position. That might be an indicator of a varying heat transfer due to a changing joint force applied by the clamps. In order to investigate the correlation between the joint force and the heat transfer between the heating rod and rail, the clamping force of newly manufactured heating rod clamps was measured initially. Therefore, a modified tensile test was used. Applied thermal and mechanical loads over a period of 4000 h could reduce the clamping force by 13%. Finally, the correlation between the heat transfer resistance, the joint force and the surface condition was experimentally determined with a heating test setup. Considering only the clamp area, the specific thermal contact resistance will not change due to a change in the joint force. However, surface preconditioning, such as milling or an application of a thermal-conducting paste, is capable of significantly reducing the thermal contact resistance.

1. Introduction

Switch points (also called points or turnouts) are an important part of the railway infrastructure by enabling trains to change their tracks without interrupting their travel. It became apparent that switch points are often affected by failures compared with other components of the railway infrastructure [1]. In wintertime, there is a risk of accumulating snow and ice at and between the moveable components of a switch point. In order to prevent an obstruction of the switch point setting, switch point heating systems are utilized. A proven technical application for switch point heating is electrical heating rods in Europe [2]. However, the operation experiences of railway companies have shown that electrical heating rods do not work effectively under all conditions. Wind and precipitation, especially, impede the effective operation of the switch point heating [3].
A great uncertainty is the heat transfer from the heating rod into the rail. The heating rod is usually attached to the rail with clamps made of spring steel that is set at a distance of 30 cm from each other. Evaluating the temperature on the surface of the heating rod, it becomes obvious that this quantity depends on the longitudinal position of the heating rod (Figure 1). A temperature difference of approx. 55 K could be measured at the surface in the middle between two clamps and the surface next to a clamp. As Fourier’s-law of heat conduction states, a better heat transfer ϑ A leads to a lower temperature difference grad- ϑ between a heat source and an adjacent body, as long as the heat infeed (heat flow) Q ˙ is constant (Equation (1), [4]).
Q ˙ = λ A grad   ϑ
The generated heat flow is constant along the heating rod. The heat is either transported into the rail or emitted to the environment by convection and radiation. So, if the thermal contact resistance between the heating rod and rail is high, only a low amount of heat is transported into the rail. The thermal resistance for the entire heat emission of the rod increases, and its surface temperature increases, too.
Considering this, the heat transfer between the heating rod and the rail seems to be better in the area close to the heating rod clamps and worse in the middle between the two clamps. That could be caused by a varying joint force between the heating rod and rail in the longitudinal direction. In order to determine the correlation between heat transfer and the joint force, the force that is provided by heating rod clamps has to be investigated first.
During their operation, heating rod clamps undergo mechanical and thermal load, which can lead to a force reduction for aged clamps. So, the impact of these loads on the clamping force has to be measured subsequently. Finally, a customized experimental setup can be used to correlate the heat transfer with the applied joint force between the heating rod and rail for a force range that covers clamping forces of newly manufactured clamps, aged clamps and almost no remaining joint force. Here, the area where the clamps are located is considered separately from the area between the two clamps.

2. Fundamentals

The heating rod clamps are made of steel 1.4310. This austenitic steel is stainless and is often used for mechanic springs [5]. An initial look at the structure of metals helps to understand the respective aging processes.

2.1. Fundamental Aspects of Metallurgy and Ageing

In metals, the atomic cores are ordered in a lattice structure (Figure 2a). The electrons, however, can move between the cores as an electronic gas. In reality, the structure of metals differs from the ideal lattice due to lattice defects of different kinds. These defects can cause residual stresses in the material and so affect its mechanical properties of it [6]. Basically, three kinds of load can be applied externally on a material: tensile stress, compressive stress and shear stress. The material’s resilience to various stresses can be determined by performing respective tests. The tensile test is the fundamental test procedure for investigating the strength that will be applied against tensile stress.
Materials without a pronounced yield strength have a continuous correlation between stress and strain (Figure 2b). This characteristic can be divided into elastic and plastic deformation. The dependency between stress and strain has a linear relation to the elastic deformation, which will change by entering the plastic deformation range. There is no sharp separation between both types of deformation visible in the strain-stress-diagram, though. Rather there is a soft transition from elastic to plastic deformation for increasing stress. However, at the atomic level, both processes can differ clearly. Atomic bonds are elongated without an irreversible displacement for elastic deformation, whereas atomic bonds glide along the material as dislocations for plastic deformation [6,7]. The external mechanical and thermal load can change the mechanical properties of the material over time. Two metallurgical processes are hereby relevant: stress relaxations and creeping. In the case of stress relaxation, residual and external stresses are reduced for a constant elongation of the entire component. Creeping describes a continuous plastic deformation for a constant load. Both processes are based on the alternation of metallurgical defects and the greater particle movement for increasing temperature [6,8].

2.2. Fundamentals of Heat Transfer through a Joint

On the subject of electrical switch point heating, the heating rod and the rail constitute the bodies exchanging heat in the first place. The steel alloy R350HT is a commonly used material that rails are made of [9]. The heating rod consists of one forward and return conductor that is electrically insulated and covered by a stainless steel jacket. Even if the contact areas of both components look macroscopically flat, the surfaces have a certain roughness. So, both contact members do not touch each other at the entire joint (apparent contact area) but at single subareas, the load-bearing area, instead. Additionally, a corrosion layer is likely to appear on the surface area, especially for the rail steel. Within the load-bearing area, contacts not covered by an impurity film (like the corrosion layer) are called metallic contact spots. Quasimetallic contact spots, on the contrary, are defined to be covered by a very thin impurity layer.
Generally speaking, the thermodynamic processes of heat transfer are conduction, convection and radiation. The air gap caused by the roughness of the contact members is too narrow for convection to occur since convection is negligible for air gaps smaller than 6 mm at room temperature [10]. The widths of the air gaps are assumed to be several orders of magnitude smaller than 6 mm; convection can also be neglected for temperatures in the measured range at the heating rod (Figure 1b). Considering the size of the interface between the heating rod and the rail, and the range of temperatures that will occur, heat exchange by radiation can be neglected. An electric current can only pass the interface of two metallic contact members through metallic and quasimetallic contact spots [11]. In past studies, it has already been determined that between metallic contact members, the heat flow is greater than expected by calculation with the electrical contact resistance and the Wiedemann-Franz law [12]. That means not only metallic, and quasimetallic contact spots contribute to the heat transfer but also contact spots covered by the corrosion layer and air-filled gaps in-between (Figure 3) [10,11]. Heat exchange by conduction occurs if particles directly touch each other. In gases, the diffusion of the molecules enables heat conduction. In liquids and solids, heat is transported by elastic waves of the molecules. In metals, however, the majority of heat conduction is caused by the diffusion of electrons [13].
Electrons are also the charge carrier for electrical current. The electrical joint resistance has a clear dependency on the applied joint force (Figure A1) [14]. With increasing joint force, the surfaces of the contact members deform. Thereby, the number and the area of metallic contact spots increase, and oxides can break. So, it is to be assumed that the thermal conduction through metallic contact spots increases with increasing joint forces.
The literature research did not yield any results for a precise determination of the thermal conductivity of the corrosion layer. However, the value for the thermal conductivity was always assumed to be significantly lower than that for the steel material in various calculations [15,16]. Thus, the corrosion layer affects heat transport by conduction. The corrosion layer on carbon steels like R350HT has a porous structure and does not protect the steel material with increasing thickness [17].
The specific thermal contact resistance Rth,c is an appropriate, area-related quantity to describe the heat transfer at the interface of two contact members Equation (2).
R th , c = A Δ ϑ Q ˙
It is calculated with the apparent contact area A, the temperature difference Δ ϑ of both contact members and the respective heat flow Q ˙ .

3. Methods and Results

The aim of the investigations was to describe the correlation between the clamping force, the resulting thermal contact resistance and various surface conditions of the rail. Therefore, the magnitude of the joint force applied by heating rod clamps has to be measured first in order to limit the range of force for the thermal measurements.

3.1. Determination of the Applied Joint Force by Heating Rod Clamps

To ensure that no preload had any impact on the mechanical properties of the heating rod clamps, 85 newly manufactured clamps were selected for the initial mechanical tests. They are designed to attach an electrical heating rod with a cross-section of 13 mm × 5.5 mm to the foot of a UIC60-E1 stock rail (Figure 4). The width of the heating rod clamps was 35 mm, and the thickness was 1 mm.
A modified tensile test was performed to measure the clamping force depending on the deviation of the clamp. Thereby, a specially manufactured fixture ensured that the clamps were locked in place while the machine movement and the required force were measured with a universal testing machine by ZwickRoell and an Xforce K/Xforce P load cell (Figure 5). The range of machine movement was chosen to start in the completely relaxed position of the clamp and to reach a maximum deviation that is 3 mm greater than in the installed position. This additional 3 mm was set to also consider the installation process, where the clamp is likely to be bent more than in the installed position. After reaching the maximum machine movement, the test procedure continued by decreasing the machine movement until the start position was reached again. During the entire test procedure, the machine movement and the respective pulling force were recorded.
Since after the initial measurements of all specimens, repetitive load-related measurements with the same specimens are planned, it is important to check whether the test procedure itself has an impact on the mechanical properties of the clamps. It is required for the machine movement not to exceed the range of elastic deformation. Otherwise, plastic deformation of the clamp would occur, and the results of consecutive measurements of the same clamp could not be compared. Thus, one clamp was selected to perform the described test procedure 50 times in succession. The mean tensile force for the respective maximum machine movement was 94.3 N, with a respective standard deviation of 0.6 N. Considering these values, it can be assumed that there is no impact of the test procedure itself on the mechanical properties of the specimens. The dependency between tensile force and machine movement for one specimen shows the characteristics that also could be noted for all the others (Figure 6a). Initially, the tensile force remains at zero for increasing machine movement. The range of this section depends on the specimen and the respective production tolerances. Subsequently, the tensile force increases nearly linearly with increasing machine movement. After the reversal point, a difference between the curve for increasing and decreasing machine movement can be noted. This occurs due to small friction forces in the test setup and is not to be mistaken as an indicator for plastic deformation.
Considering the clamping forces of the newly manufactured clamps for a bending that represents their installing position, it can be stated that the majority of applied force is slightly greater than 70 N (Figure 6b). Single outliers exist, but the majority of measured values are close together.
In the next step, the influence of mechanical and thermal load on the clamping force was investigated in order to detect force reduction or stress relaxation over time. Therefore, the total number of 85 clamps was divided into six groups depending on the combination of loads they were stored at (Table 1). A clamp that is stored in its relaxed position gets the mechanical label “no load”. The description “installed”, on the contrary, means that the clamp was stored bent to the same extent as attached to the foot of a stock rail. Regarding the thermal load, the clamps were either stored at room temperature, at 150 °C, or at 200 °C. The temperature values were selected by means of temperature measurements on the surface of the heating rod in previous tests at real switch points. As shown in Figure 5b, the area of the clamp where the major stresses are located is not in direct contact with the hot surface of the heating rod. Thus, the selected temperatures can be considered as the worst-case scenario.
According to the respective loads, the heating rod clamps were stored for a total period of 4000 h. Within this period, the correlation between tensile force and machine movement was determined with the described modified tensile test several times. It was not possible to perform the test while the respective loads were applied. So, the application of load was paused for the duration of the modified tensile test.
Considering one characteristic sample that was installed and stored at 200 °C, the differences in the correlation of tensile force and machine movement are obvious (Figure 7).
While the basic shape of the curve is similar for the three different load periods, the maximum tensile force that is required for the largest machine movement is lower for longer load periods. Furthermore, the initial machine movement increases, which is required for the tensile force to increase for longer load periods. The length of the initial force-free machine movement is determined by the bending of a relaxed clamp since the starting position of the test procedure is absolutely defined. This fact confirms that plastic deformation has taken place during the load period caused by creeping. The reduction of tensile force for longer load periods could additionally be caused by stress relaxation. However, this process cannot be explicitly verified by evaluating the measurement results.
Having a look at the clamping force (tensile force measured at a bending as in the installed situation) of all loaded clamps, trends with respect to the load group can be recognized (Figure 8).
Over time, the clamping force of mechanically loaded clamps was reduced. The majority of the decrease already had happened after 50 h of load. Subsequently, this process continued very slowly. The large proportion of force reduction in the first hours indicates occurring embedding processes that are completed soon [18]. Within the mechanically loaded groups, the force reduction is greater for specimens loaded with higher temperatures. The biggest force reduction occurred for mechanically loaded clamps that were stored at a temperature of 200 °C. In this case, the median of the clamping force was 14.1% smaller than before the load cycles were started.

3.2. Determination of the Thermal Contact Resistance

Considering the usual installation of a switch point heating rod, the heating rod clamps are set with a 30 cm center-to-center distance. In the following, it is expedient to differ the longitudinal areas where the clamps are located (clamp area) and the areas between two clamps (middle area, Figure 9).
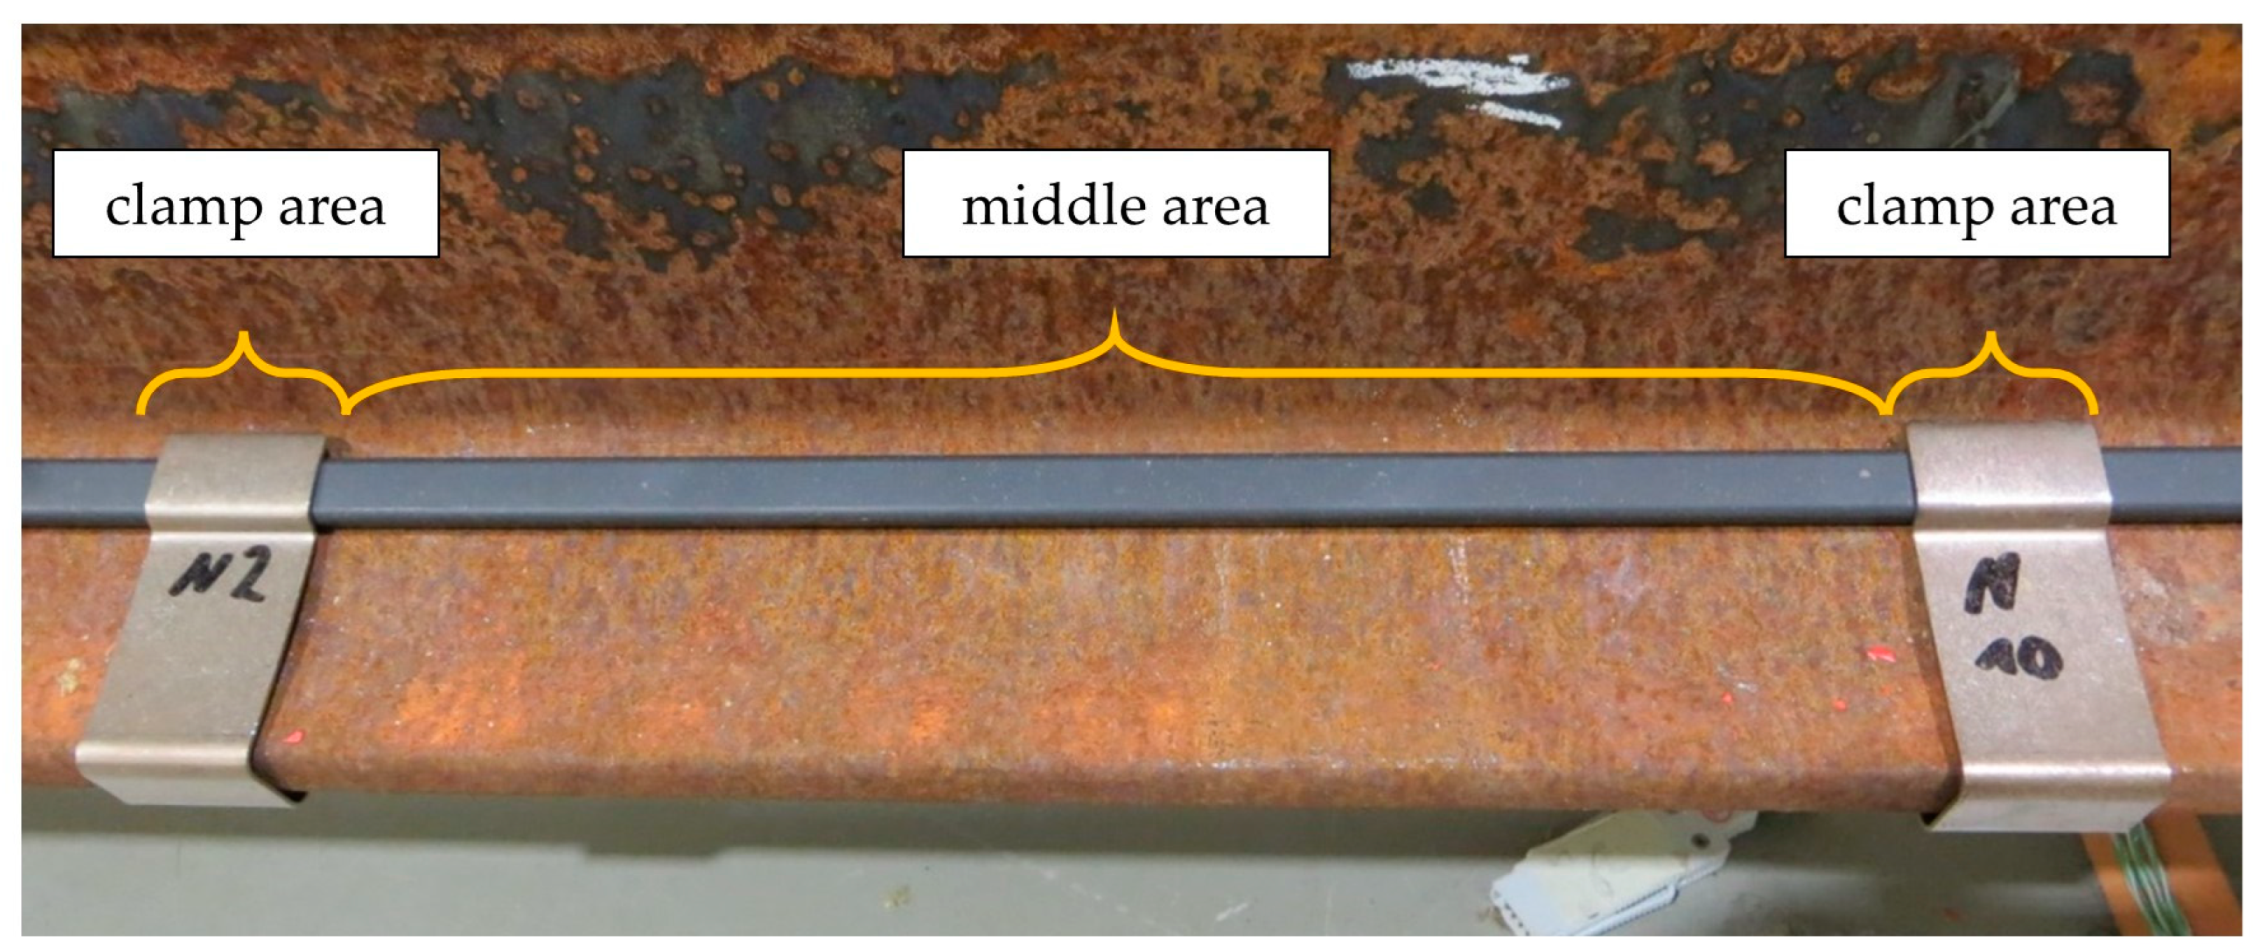
The joint force is fed into the system heating rod-rail at the clamp areas. Depending on the mechanical properties of the heating rod, especially its stiffness, the applied force by the clamps will be distributed along the heating rod. In order to determine the thermal contact resistance between the heating rod and rail, the approach was to consider the clamp area and middle area separately from each other. Thereby, the thermal contact of the clamp area was investigated with a model that only considers an isolated clamp area first. Subsequently, the findings were applied to the thermal consideration of the middle area.

3.2.1. Determination of the Thermal Contact Resistance at the Clamp Area

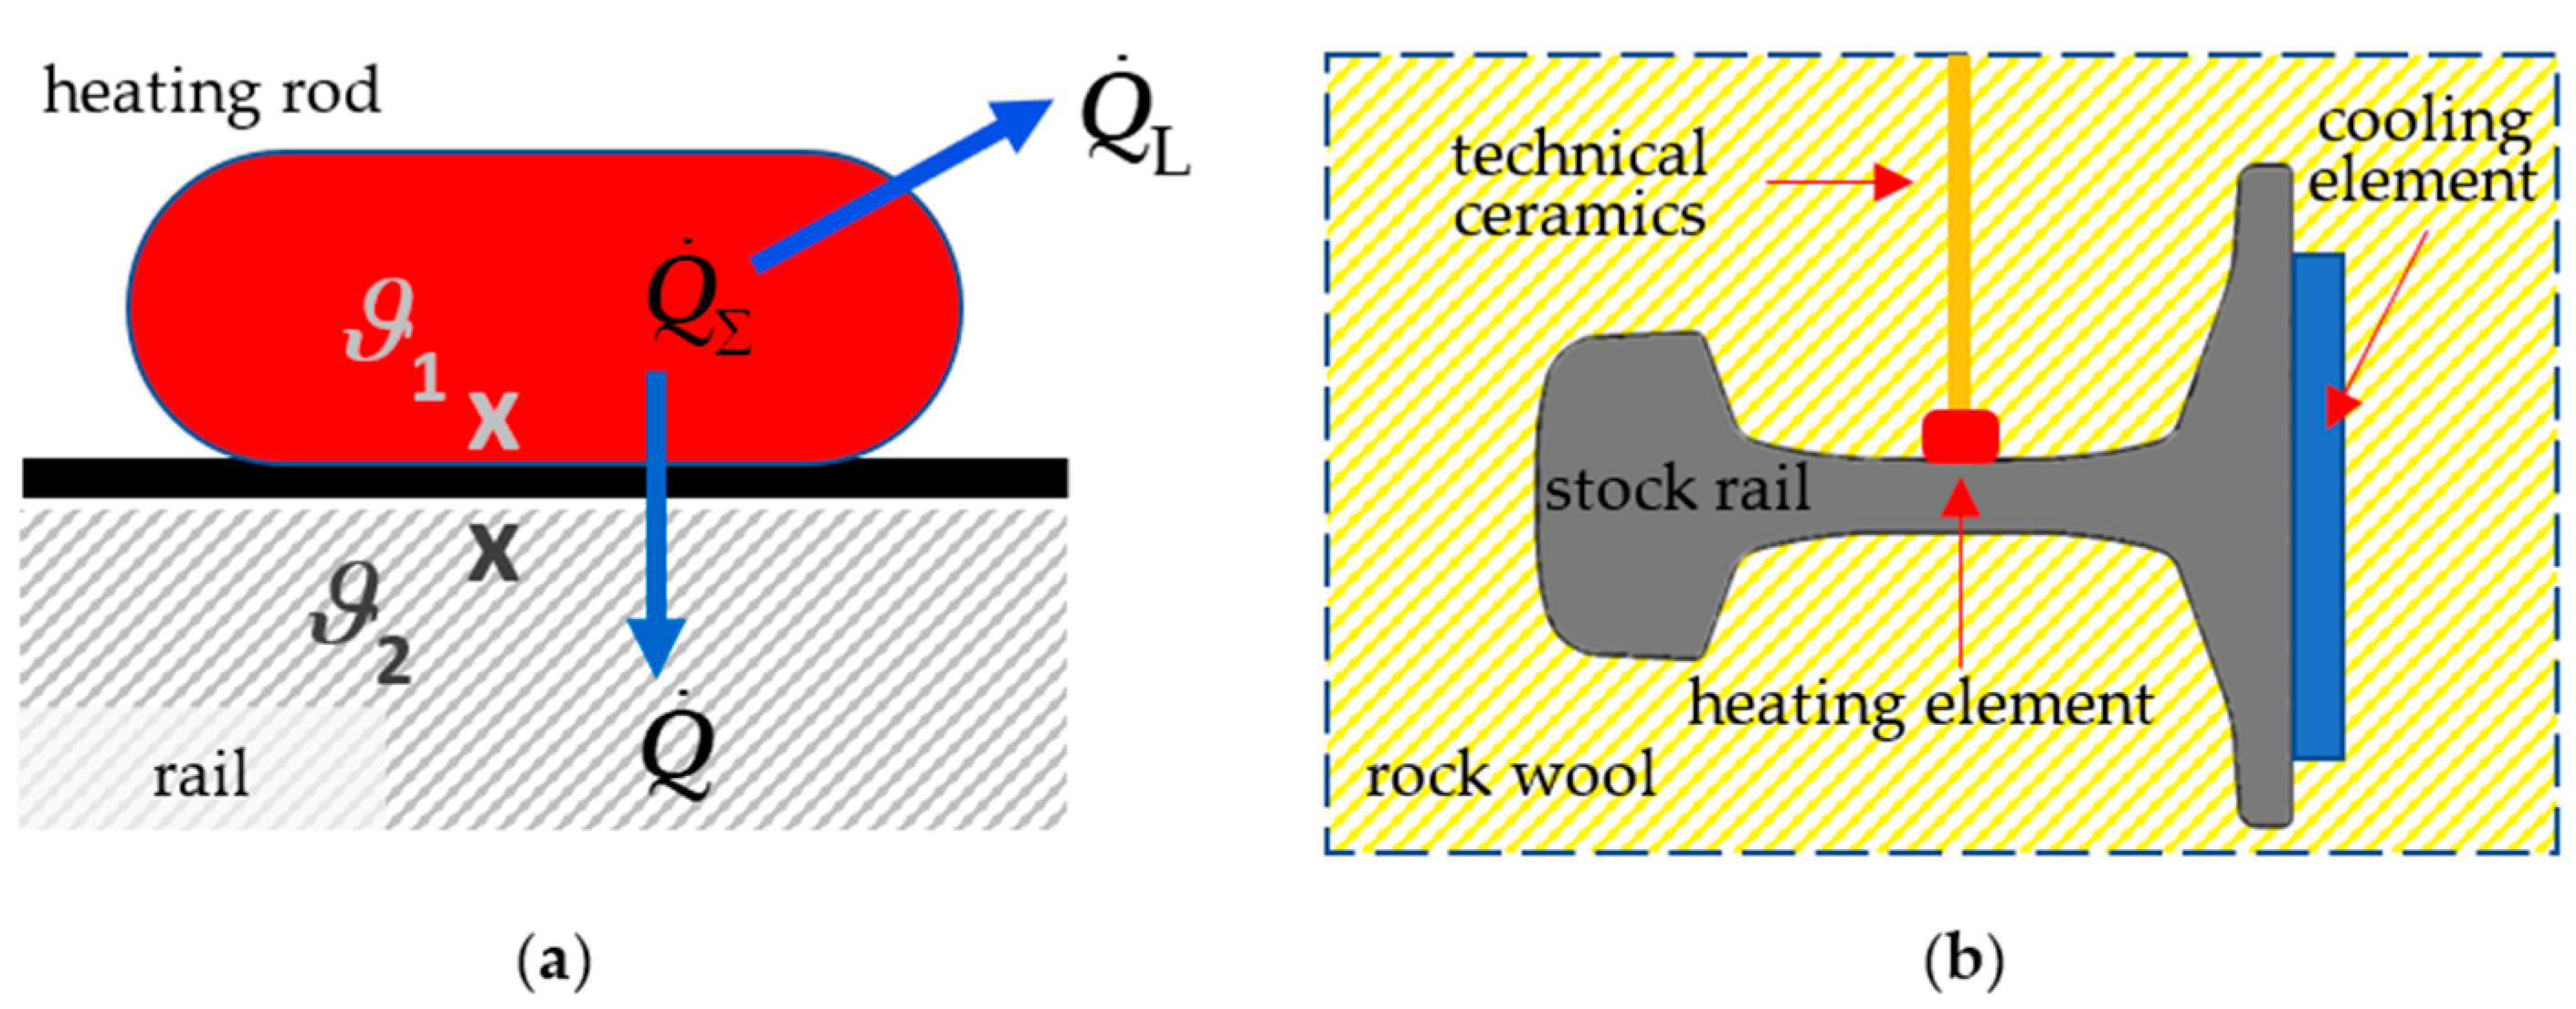
In order to measure the thermal contact resistance between the heating rod and rail for a varying joint force, a measurement setup was designed. According to Equation (2), the temperature difference at the contact surface and the thermal flow, which passes it, have to be known to calculate the thermal contact resistance. Because the heating rod is only attached to the rail with one of its outer surfaces, not the entire amount of the heat- Q ˙ Σ generated in the heating rod is transmitted into the rail. One proportion Q ˙ L of the total heat- Q ˙ Σ is dissipated to the environment; the other part Q ˙ is conducted into the rail (Figure 10a). The higher the proportion of the dissipated heat- Q ˙ L is, the lower the accuracy of the determination of the thermal contact resistance is. Thus, the heating rod and the rail were covered in rock wool with an edge length of approx. 0.4 m × 0.4 m × 0.5 m. In the next step, a cooling element was attached to the rail in order to direct the majority of the heat flow from the heating rod into the rail (Figure 10b).
A plane surface area of the rail is required to which the heating rod can be attached. Additionally, a simple adjustment of the joint force is to be ensured that also takes the acting weight force into account. Due to this requirement, the stock rail was rotated through 90°, and the heating rod was positioned in the middle of the rail web. In that manner, the joint force can be applied vertically, and it can be calculated by the sum of the set force (from 0 N to 200 N) and the weight force (W = 1 N). The cooling element is positioned at the foot of the rail. This location of the cooling element has two benefits. On the one hand, the plane and large surface of the foot ensure a big apparent contact area with the cooling element. Moreover, on the other hand, the geometrical distance between the heat input and heat sink increases the accuracy of the temperature measurement due to a smaller temperature gradient within the rail compared with a situation where both elements are installed close to each other.
The length of the heating rod and rail was chosen to match the length of the investigated heating rod clamps by 35 mm. By using a customized heating element with the same properties of the joint area as the real heating rod, the adjustment of the heating power is more accurate. Therefore, the heating element was made of stainless steel 1.4301. A heating cartridge that was inserted into this heating element generated the heat flow. The height of the heating element was chosen to be bigger than the height of a normal heating rod in order to reach a homogeneous temperature distribution at the interface of the heating element and rail. An aluminum frame kept the entire experimental setup in place (Figure A2). The cooling element was fed with water of constant temperature.
The applied joint force was measured with an Alluris FMI-250 force gauge. The DC power source “GW GPR-30H10D” supplied the heating cartridge with voltage. Voltage and current were measured with a “ZES LMG 95”. The temperatures were measured at 30 positions with thermocouples of type T at the rail, heating rod, technical ceramics, cooling element, and within the rock wool insulation. An “Ahlborn Almemo 5690-2” recorded the temperatures.
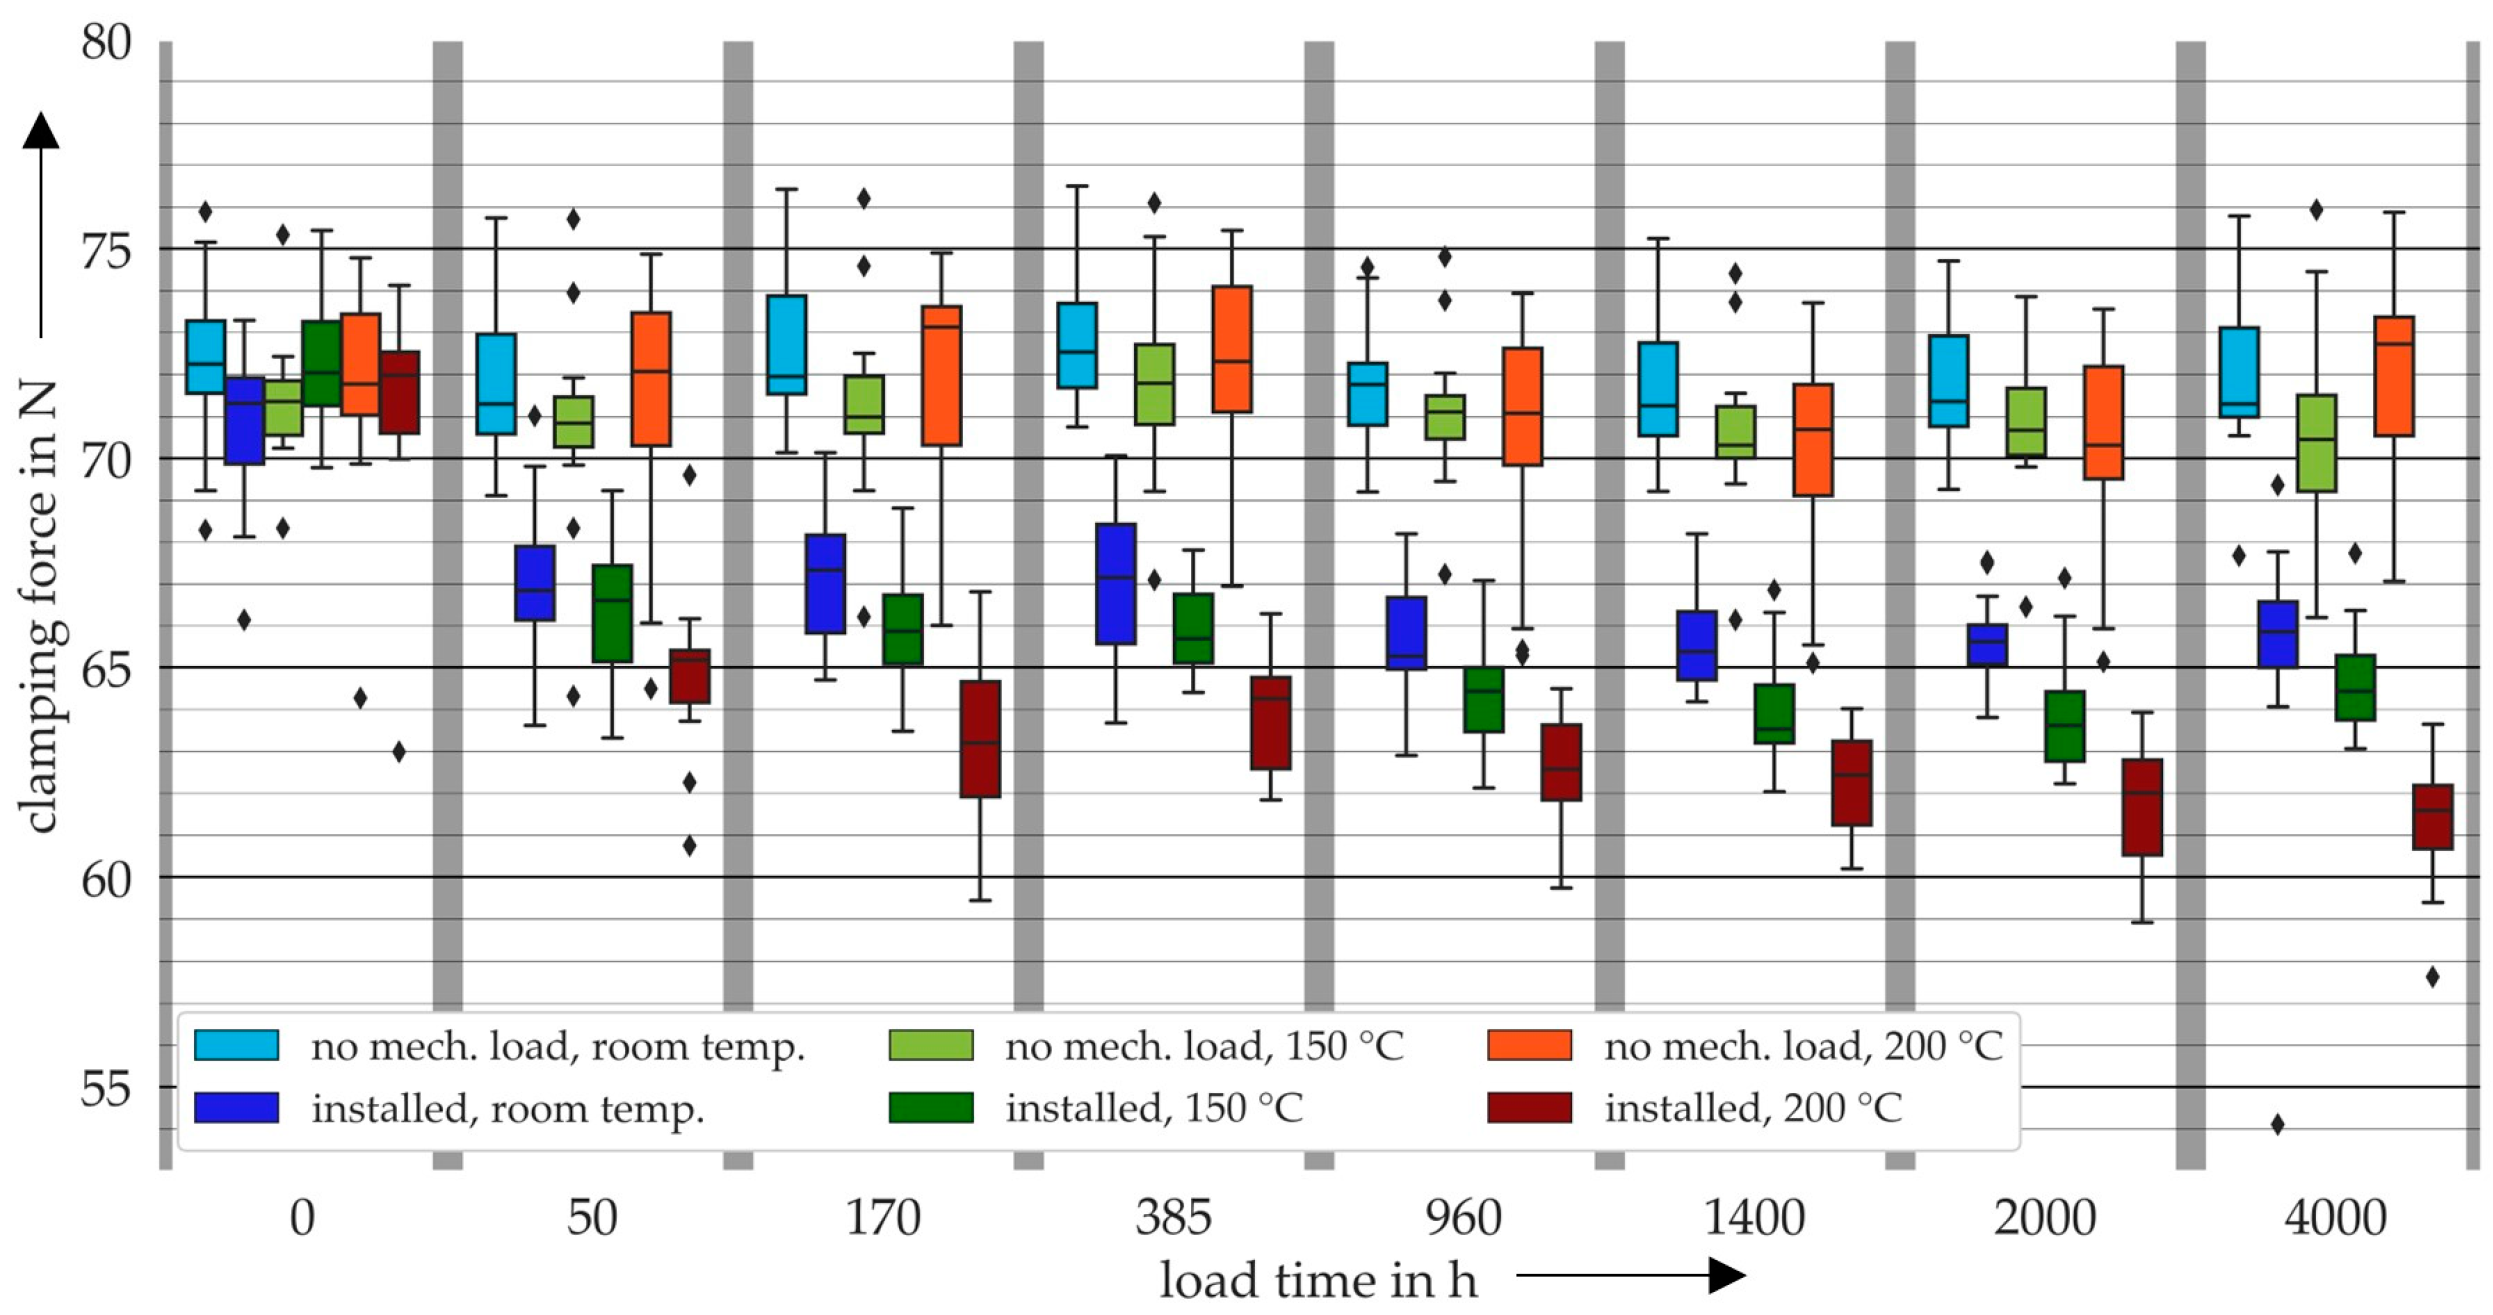
Based on the results of the clamping force investigated (Section 3.1), the range of the joint force to be considered is determined. The investigated range is set significantly larger in order to take into account the effects of possible greater clamping forces and significantly smaller forces between the heating rod and the rail in the middle between two clamps. Thus, joint forces in the range of 1 N (the lowest realizable force due to the weight of the heating element) and 200 N were applied. The measurements were performed with an untreated rail surface, the original rail surface with a thermal-conducting paste (Figure A3), a milled rail surface, and a milled rail surface with a thermal-conducting paste. Considering these cases gives information about the influence of the rail preconditioning on the heat transfer between the heating rod and rail. For every combination of joint force and rail surface condition, a heating power of 20 W was applied, and the temperature at the cooling element was set to 10.5 °C. After an operation period of approx. 4 h, the entire test setup reached the thermally steady state, and the static temperatures could be recorded.
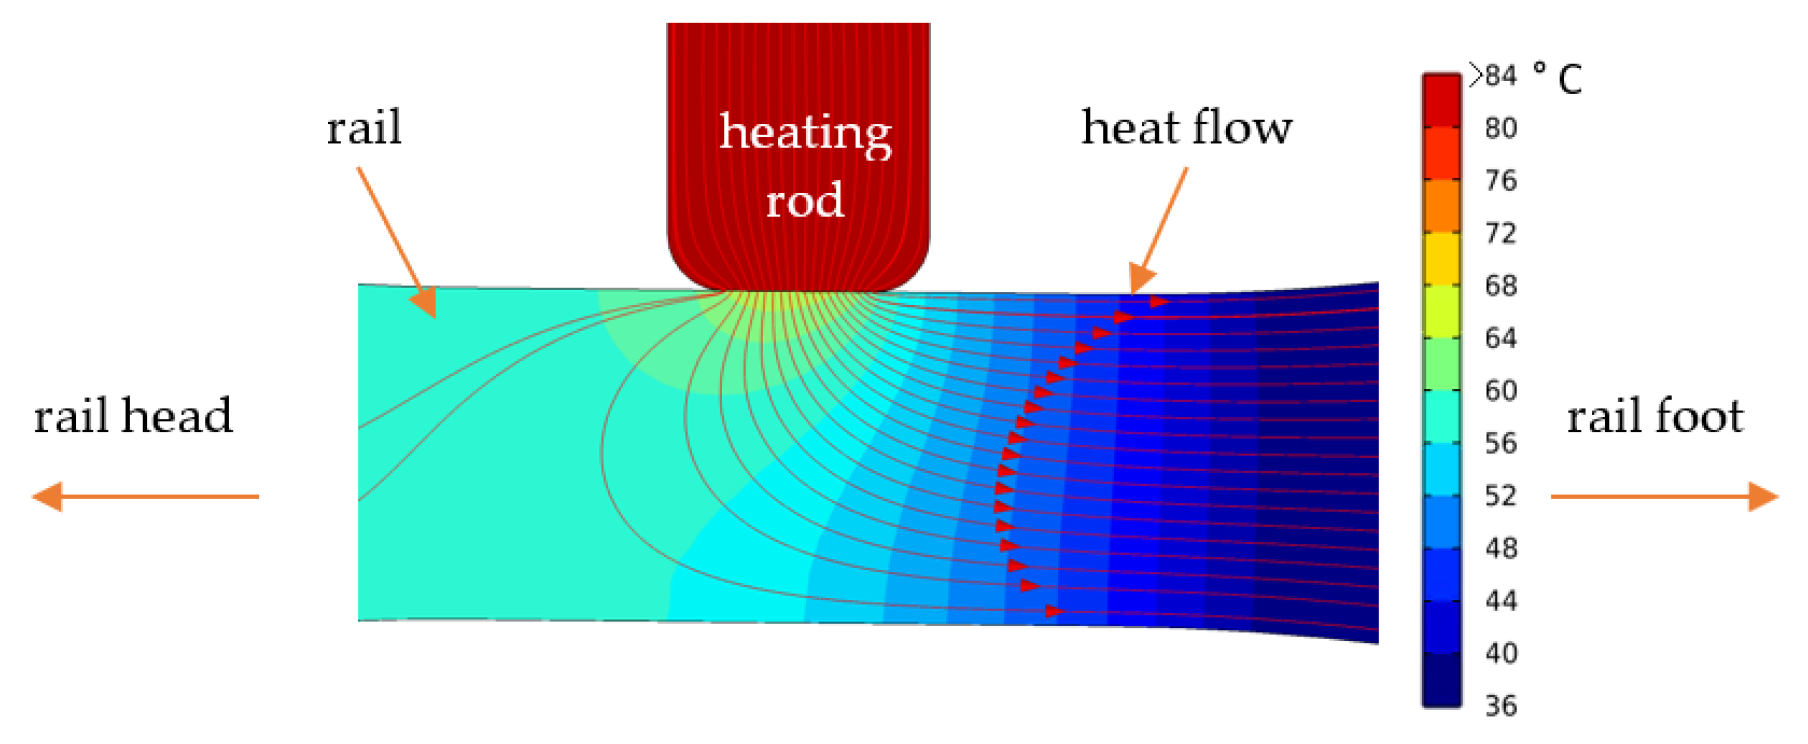
An analytical calculation of the thermal contact resistance with Equation (2) can be applied for the case of a one-dimensional heat flow which creates parallel isotherms with respect to the normal to the intersection surface. A previous calculation with the FEM program “Comsol Multiphysics 5.6” showed that this is not the case (Figure 11).
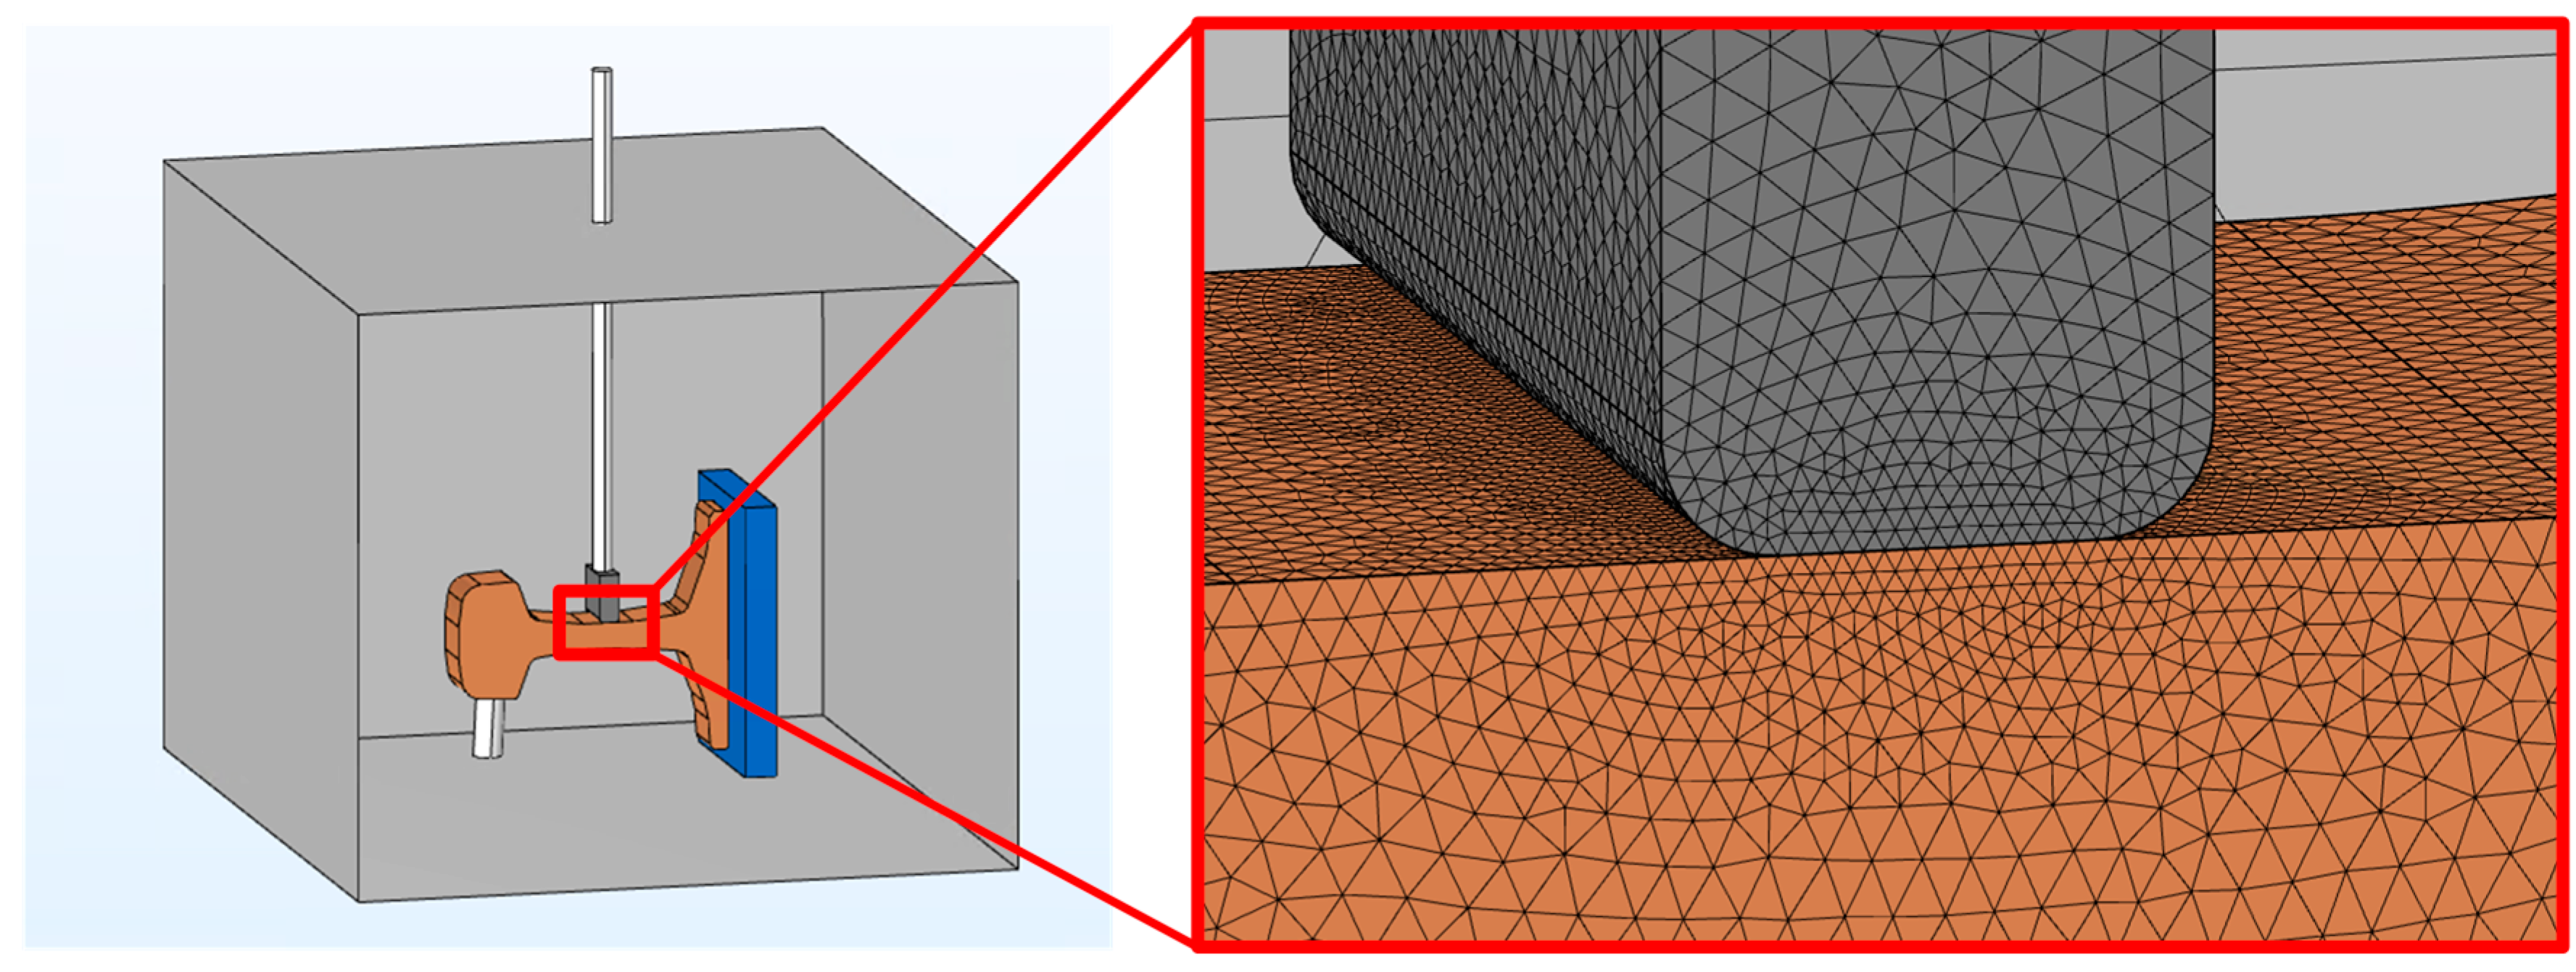
Due to the location of the heat input and heat sink, the heat flow is at least two-dimensional. The graphical display of the calculation result also shows clearly that the isotherms are not parallel to the orthogonal of the contact interface. It is technically not possible to measure the temperatures indefinitely close to the interface of the joint area. Rather, temperatures can be measured on the surface of the rail to the right and to the left of the heating element. According to the FEM calculation results, different temperatures will occur at these positions. So, it is not possible to determine a unique temperature of the rail at the joint area for the analytical calculation of the thermal contact resistance. Numerical calculations were used to determine the thermal contact resistance instead. Therefore, the geometry of the experimental setup was replicated except for the metallic frame that kept the rail in place (Figure 12).
The area close to the interface of the heating element and rail was densely meshed. A parameter study with changing thermal contact resistances between the heating element and rail showed the temperatures at the heating element and rail for the selected parameter value. Those temperatures were matched with measured temperatures in the experiment in order to determine the valid thermal contact resistance in the respective case. For the highest considered thermal contact resistance, the calculation showed that still, 97.7% of the generated heat passes the interface to the rail. Thus, the proportion of heat Q ˙ L emitted to the environment is low, and the accuracy of the heat transfer determination by using experimentally measured data can be ensured.
Although it was tried to keep external parameters that might affect the measured temperatures constant, that was not completely possible. Due to various reasons, the ambient temperature, the temperature of the cooling element, and the heat input varied within the respective range (Table 2).
In order to obtain accurate calculation results, these parameters should be adjusted in the FEM model for every single experimental run. Considering that more than 50 separate experimental runs were performed and the parameter study of the thermal contact resistance for every combination of the mentioned parameters, the effort would become very large. Instead, the basic approach of statistical design of experiments was used [19]. Therefore, a standard value for every parameter was selected first. Subsequently, the influence of the variation of respectively one parameter on the temperature difference between the heating rod and rail could be investigated by calculation. Within the respective ranges of variation, the influence could be approximated linearly (Equation (3), Table 3).
Δ ϑ c = Δ ϑ m + 3.3 K W ( 20 W P in ) 0.004 ( 10.5 ° C ϑ cool ) + 0.0027 ( 25 ° C ϑ air )
Here Δ ϑ m is the measured temperature difference between the heating rod and rail and Δ ϑ c the corrected one for the selected standard parameters. Pin is the heat input, ϑ cool the temperature of the cooling element, and ϑ air the temperature of the ambient air.
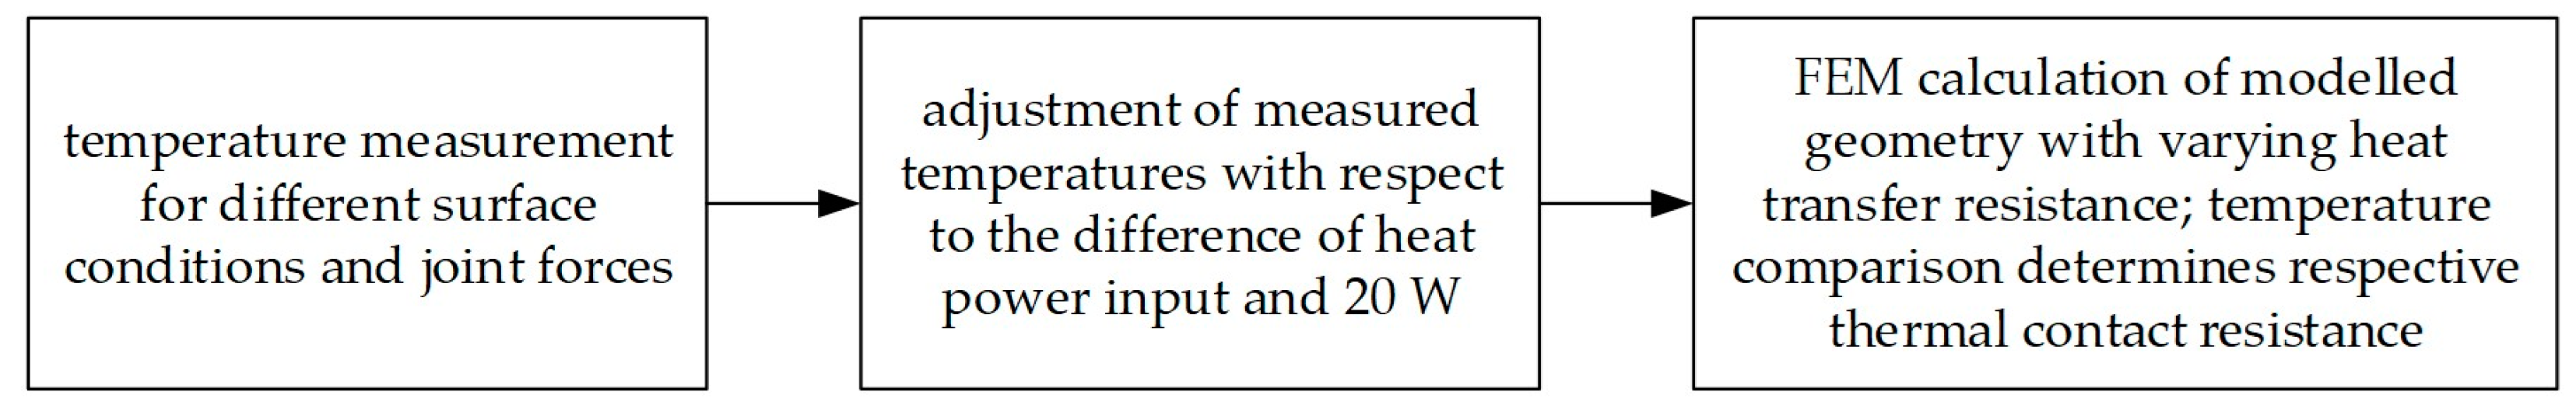
Considering the maximum temperature difference for varying parameters, the calculations showed that fluctuations in the ambient air temperature and the temperature of the cooling element could be neglected regarding their effect on the temperature difference between the heating rod and rail. In the next step, the measured temperatures were adjusted in accordance with the difference between the measured heat input and 20 W. Finally, parameter studies of the thermal contact resistance in FEM calculations determined the respective thermal contact resistance (Figure 13).
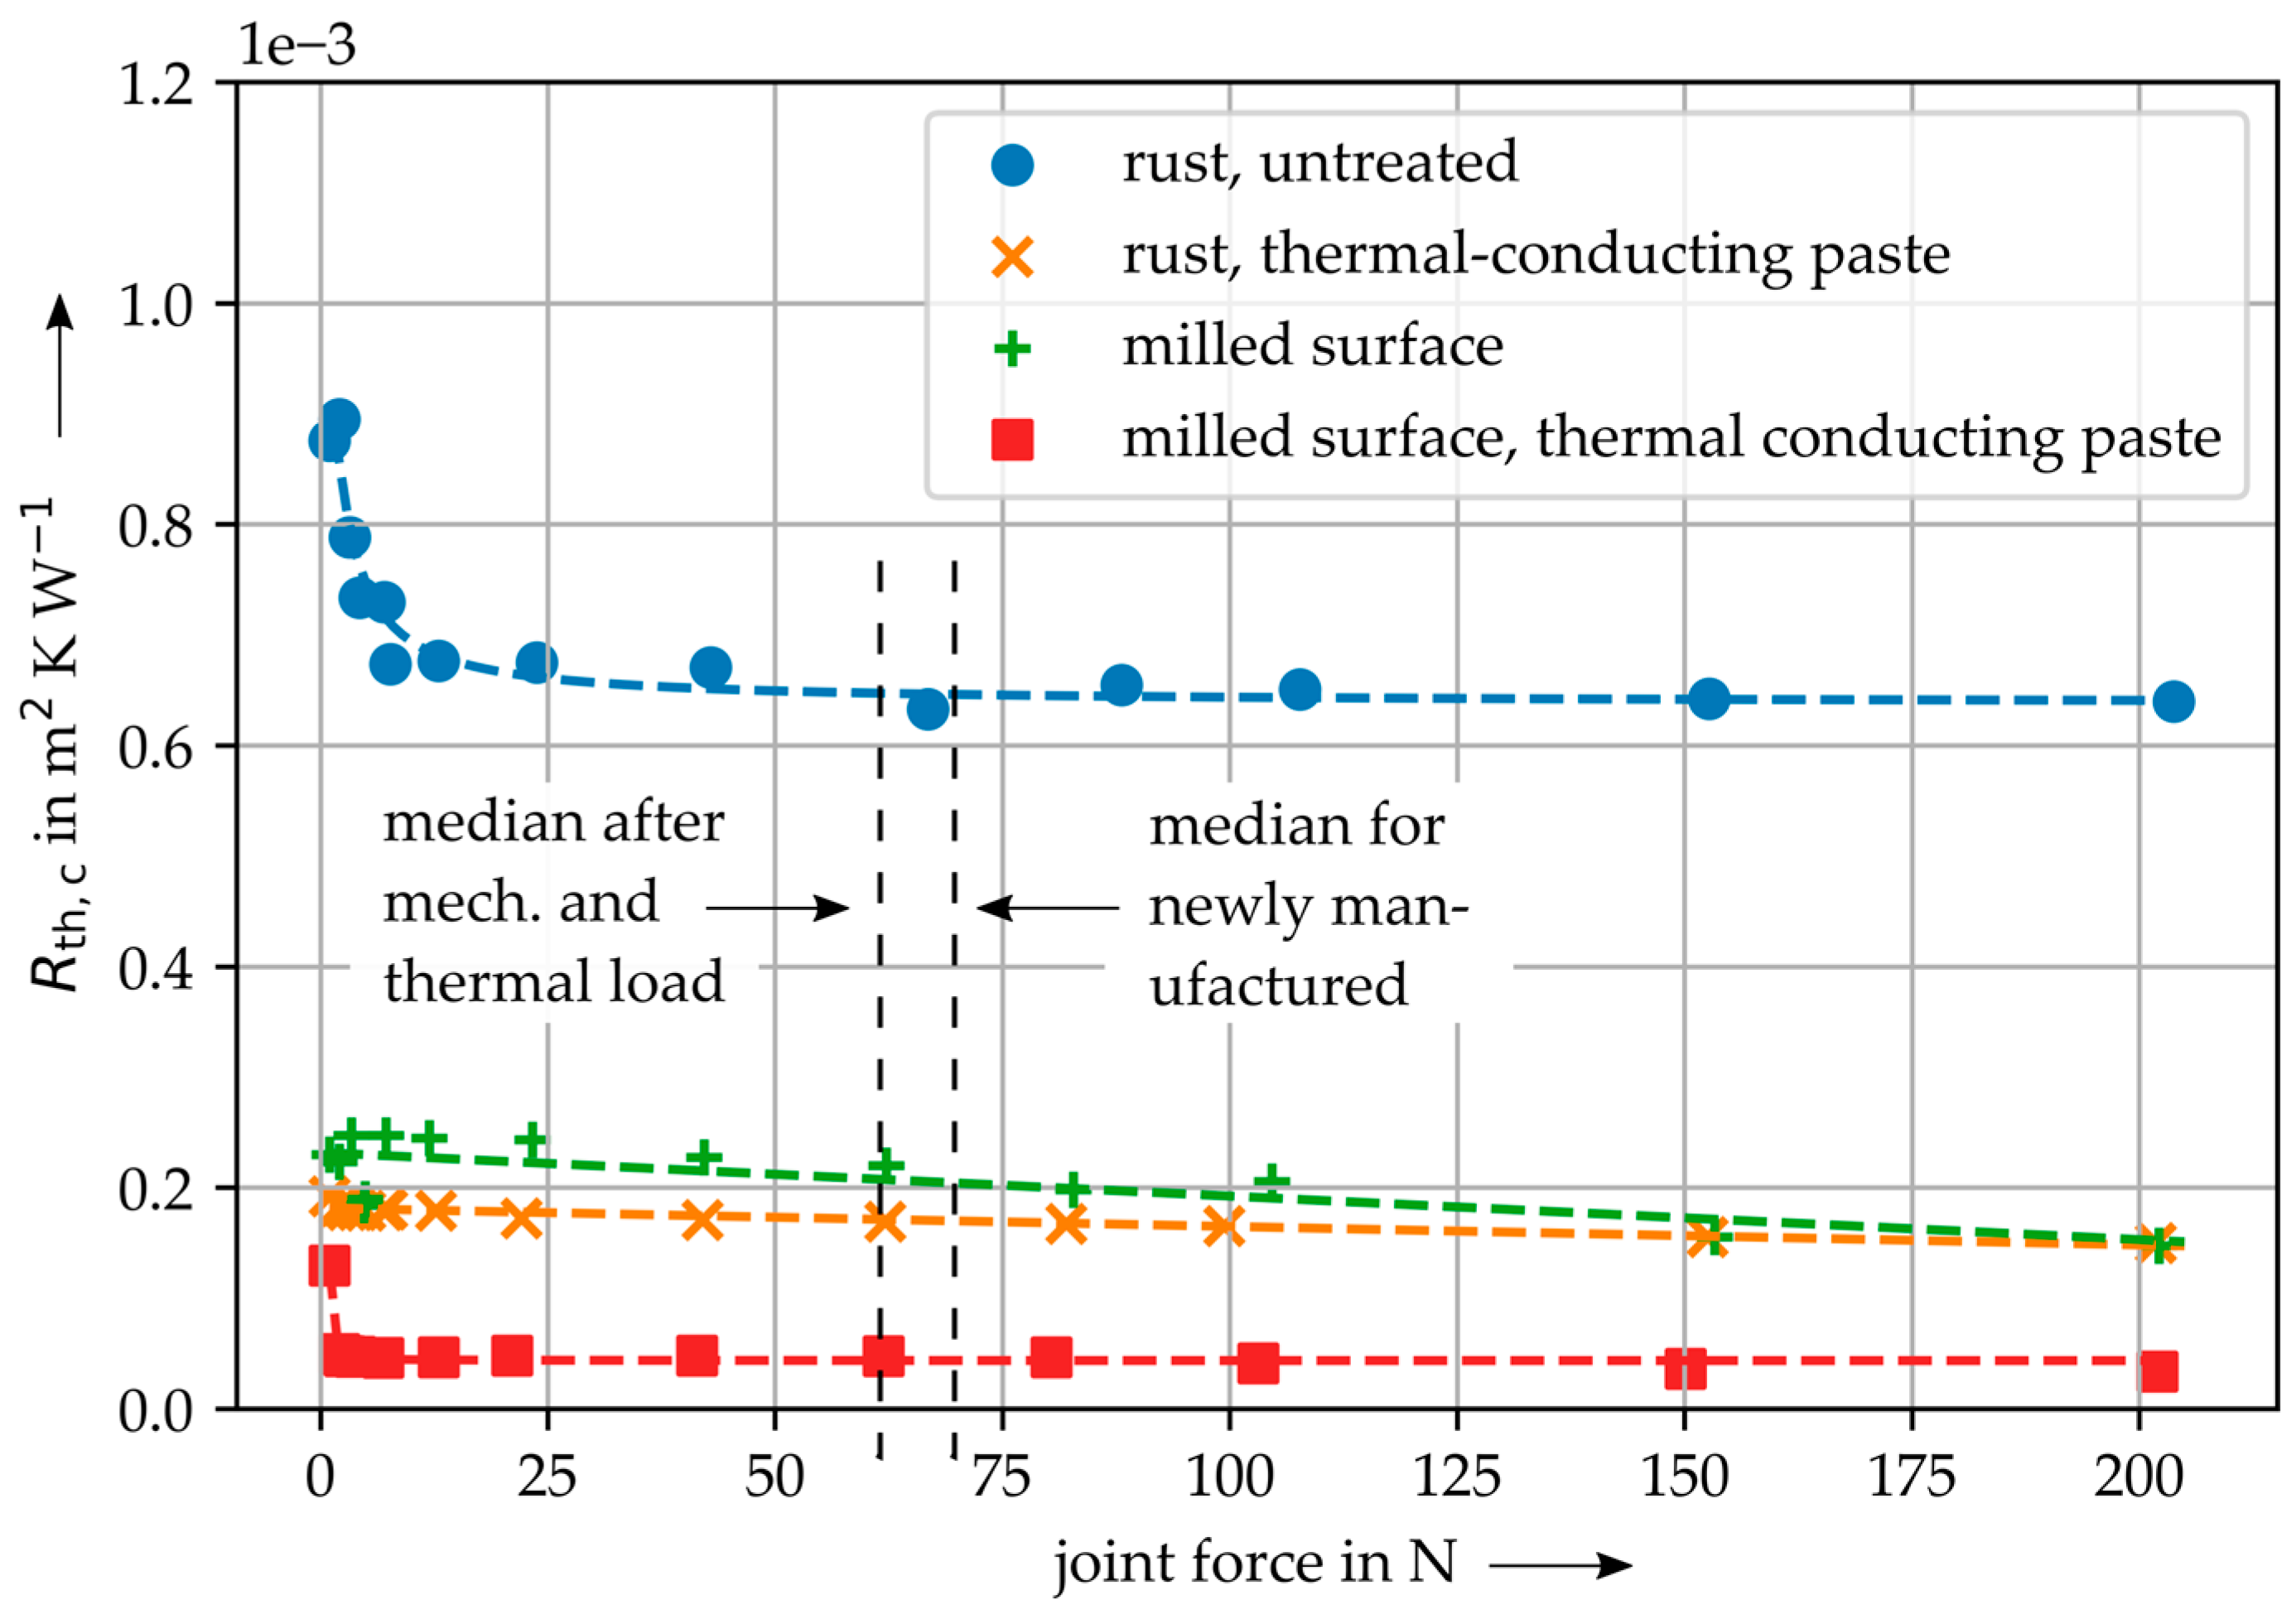
The specific thermal contact resistance is significantly higher for a rusted and untreated rail surface ( R th , c 0.65 10 3 m 2 K W - 1 for 100 N) than for the other examined surface conditions (max. R th , c 0.2 10 3 m 2 K W - 1 for 100 N; Figure 14). For decreasing joint forces from 25 N and a rusted, untreated rail surface, the magnitude of the thermal contact resistance becomes larger and has a value of R th , c 0.9 10 3 m 2 K W 1 for a joint force of 1 N. For joint forces greater than 25 N, the specific thermal contact resistance has an approximately constant value. If the surface is milled in advance or coated with a thermal-conducting paste ( λ   = 0.5   W m 1 K 1 ) , the specific thermal contact resistance is approx. three times smaller than in the untreated case ( R th , c 0.2 10 3 m 2 K W 1 for 100 N). The lowest value for the thermal contact resistance was reached for the combination of milling and using a thermal-conducting paste ( R th , c 0.04 10 3 m 2 K W 1 ) . The dependency on the joint force is not strongly pronounced for the milled surfaces or the rusted surface with thermal-conducting paste and cannot be clearly distinguished from measurement uncertainties.
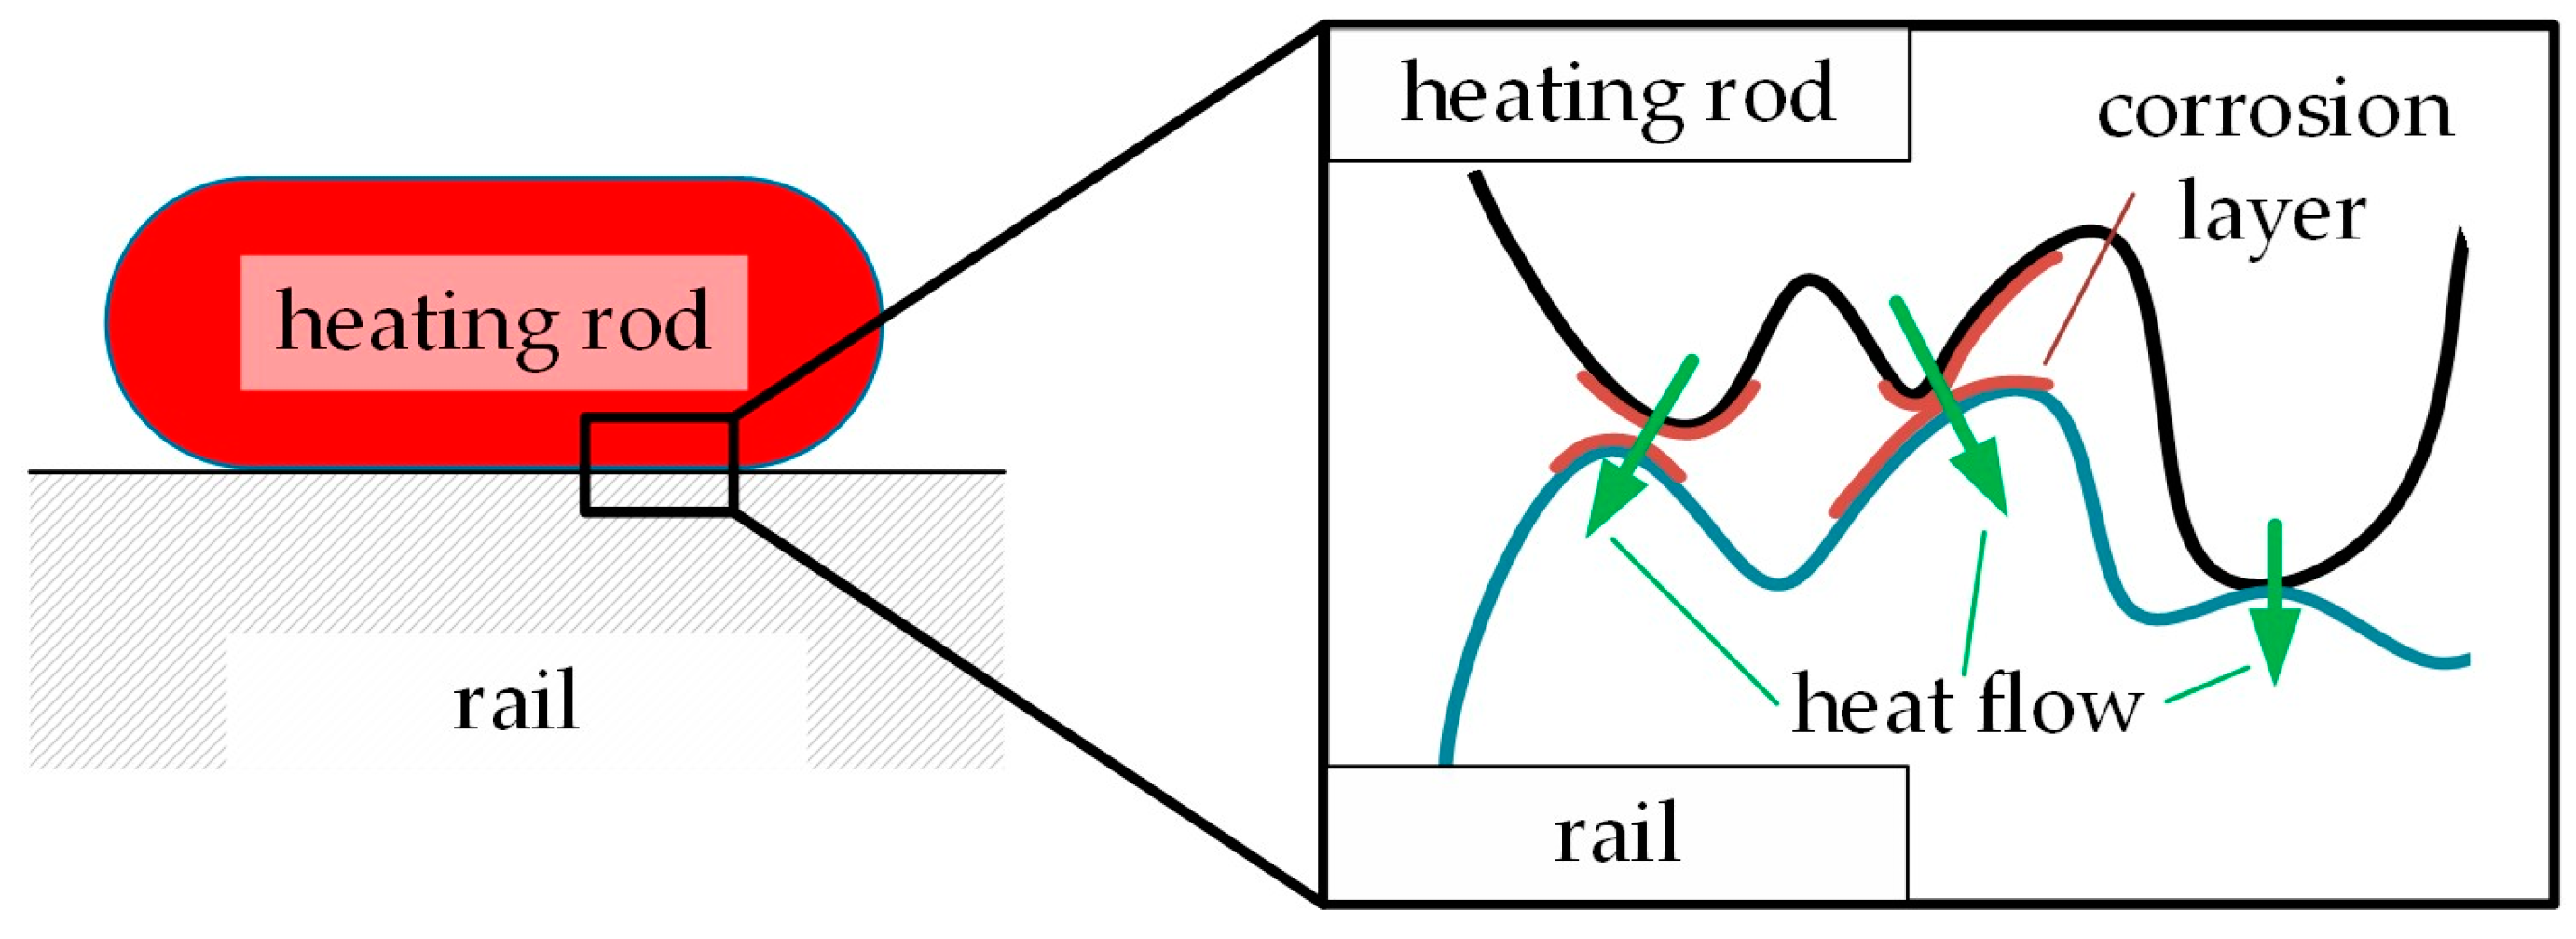
If the thermal-conducting paste is coated onto the surface, it will be pressed into the cavities between the surfaces of both contact members when realizing the joint. The cavities (caused by the roughness of the surfaces) were originally filled with air that is now substituted by the thermal-conducting paste. The specific thermal conductivity of the thermal-conducting paste ( λ   = 0.5   W m 1 K 1 ) is significantly higher than the one of air ( λ   = 0.024   W m 1 K 1 0.035   W m 1 K 1 [14]). Thus, the thermal contact resistance becomes smaller by using a thermal-conducting paste. Considering the measurement results of the rusty, untreated surface, the change of the thermal contact resistance for small joint forces can be explained by deformation processes. The corrosion layer that covers the rail material will be deformed due to the mechanical load. The microstructure changes, and so the proportion of the load-bearing area increases. That results in lower thermal contact resistance since the corrosion layer seems to have greater thermal conductivity than the air in the cavities. An increase of the joint force to more than 10 N does not lead to a further reduction of the heat contact resistance since presumably no more deformation processes of the corrosion layer take place. Even though no thermal properties of the corrosion layer are known, it can be stated that the specific thermal conductivity for the corrosion layer is greater than for air.
The thermal-conducting paste also reduced the thermal contact resistance for the milled rail surface. That shows that surface roughness still influences heat transfer significantly after the milling process. The thermal-conducting paste can at least partially compensate for this roughness by filling the cavities.

3.2.2. Determination of Thermal Contact Resistance at the Middle Area

The previous findings were valid if the entire length of a heating rod was covered by the heating rod clamp; in reality, that is not the case. Considering the investigated clamp width and the usual center-to-center distance of the clamps of 30 cm, clamps cover only 11.7% of the length of a heating rod. The mechanical quantity that is actually appropriate to evaluate the processes in a joint is mechanical stress. When a force F is applied, it results in the mechanical stress σ from the surface A on which it acts Equation (4).
σ = F A
Depending on the mechanical properties of a heating rod, the force that is applied to a certain area varies. The clamping force would be only applied to an area as big as the clamp for an infinitely soft material of the heating rod. In contrast, the force would be applied to the entire apparent contact surface between the heating rod and rail for an infinitely rigid material. In reality, the status of the material will be somewhere between these border cases. Assuming a very rigid material of the heating rod that is evenly attached to the rail, the mechanical stress is homogeneously distributed over the interface between the heating rod and rail. Taking the correlation between force and stress (Equation (4)) and the proportion of covered rod surface by the clamp (11.7%), the occurring thermal contact resistance will correspond to 11.7% of the force that is set by the clamp. That means, for an initial clamping force of approx. 70 N, the specific thermal contact resistance correlates with the measured value at the force of 8.2 N, since the clamping force acts on the entire length between two heating rod clamps (30 cm). Considering the correlation between joint force and specific thermal contact resistance (Figure 14), this force value is not in the static range of the resistance anymore. So, greater thermal contact resistances are to be expected if the mechanical stress is homogeneously distributed along the entire heating rod and not only over the clamp area.
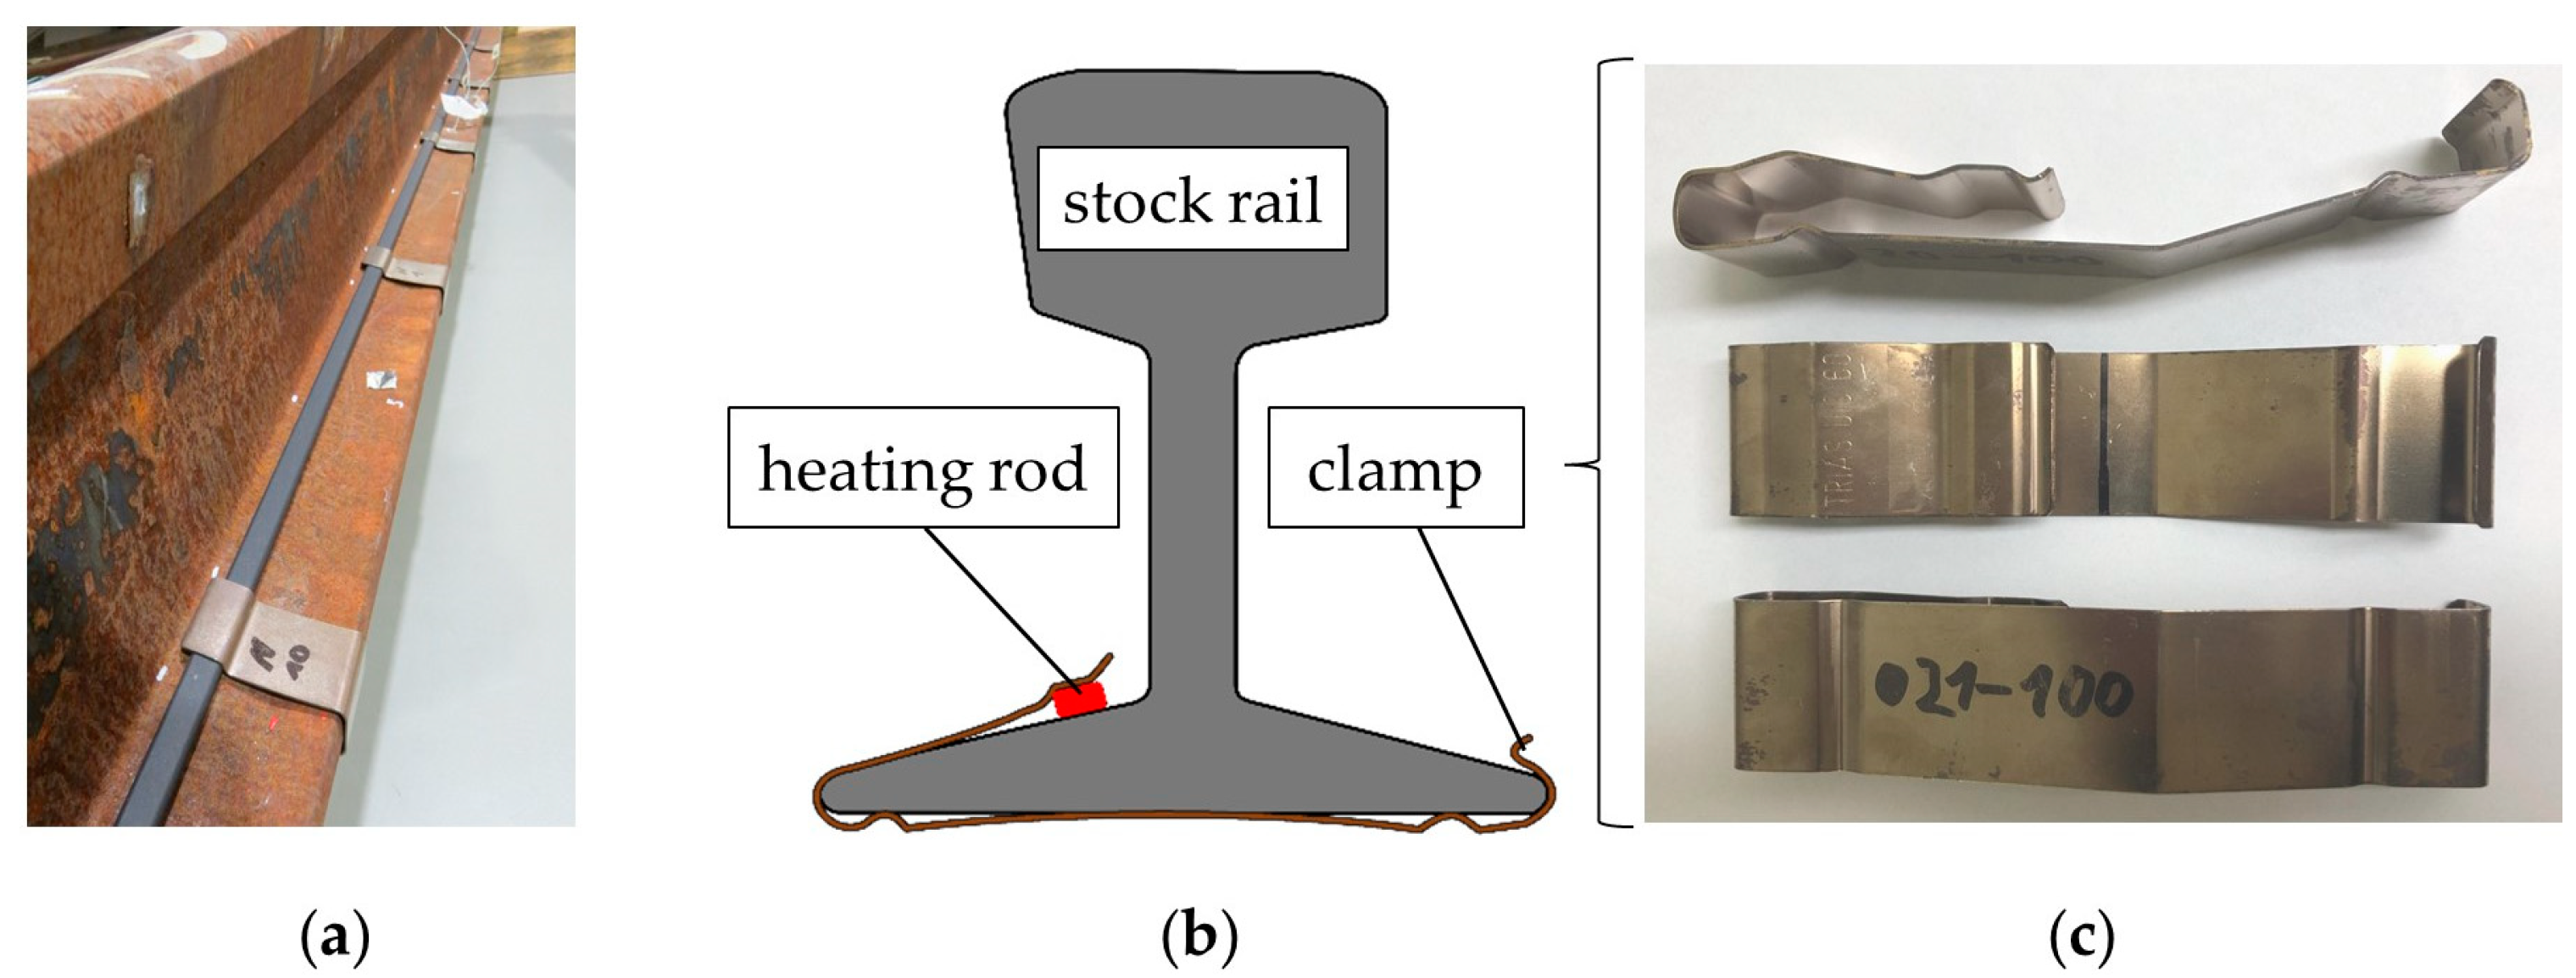
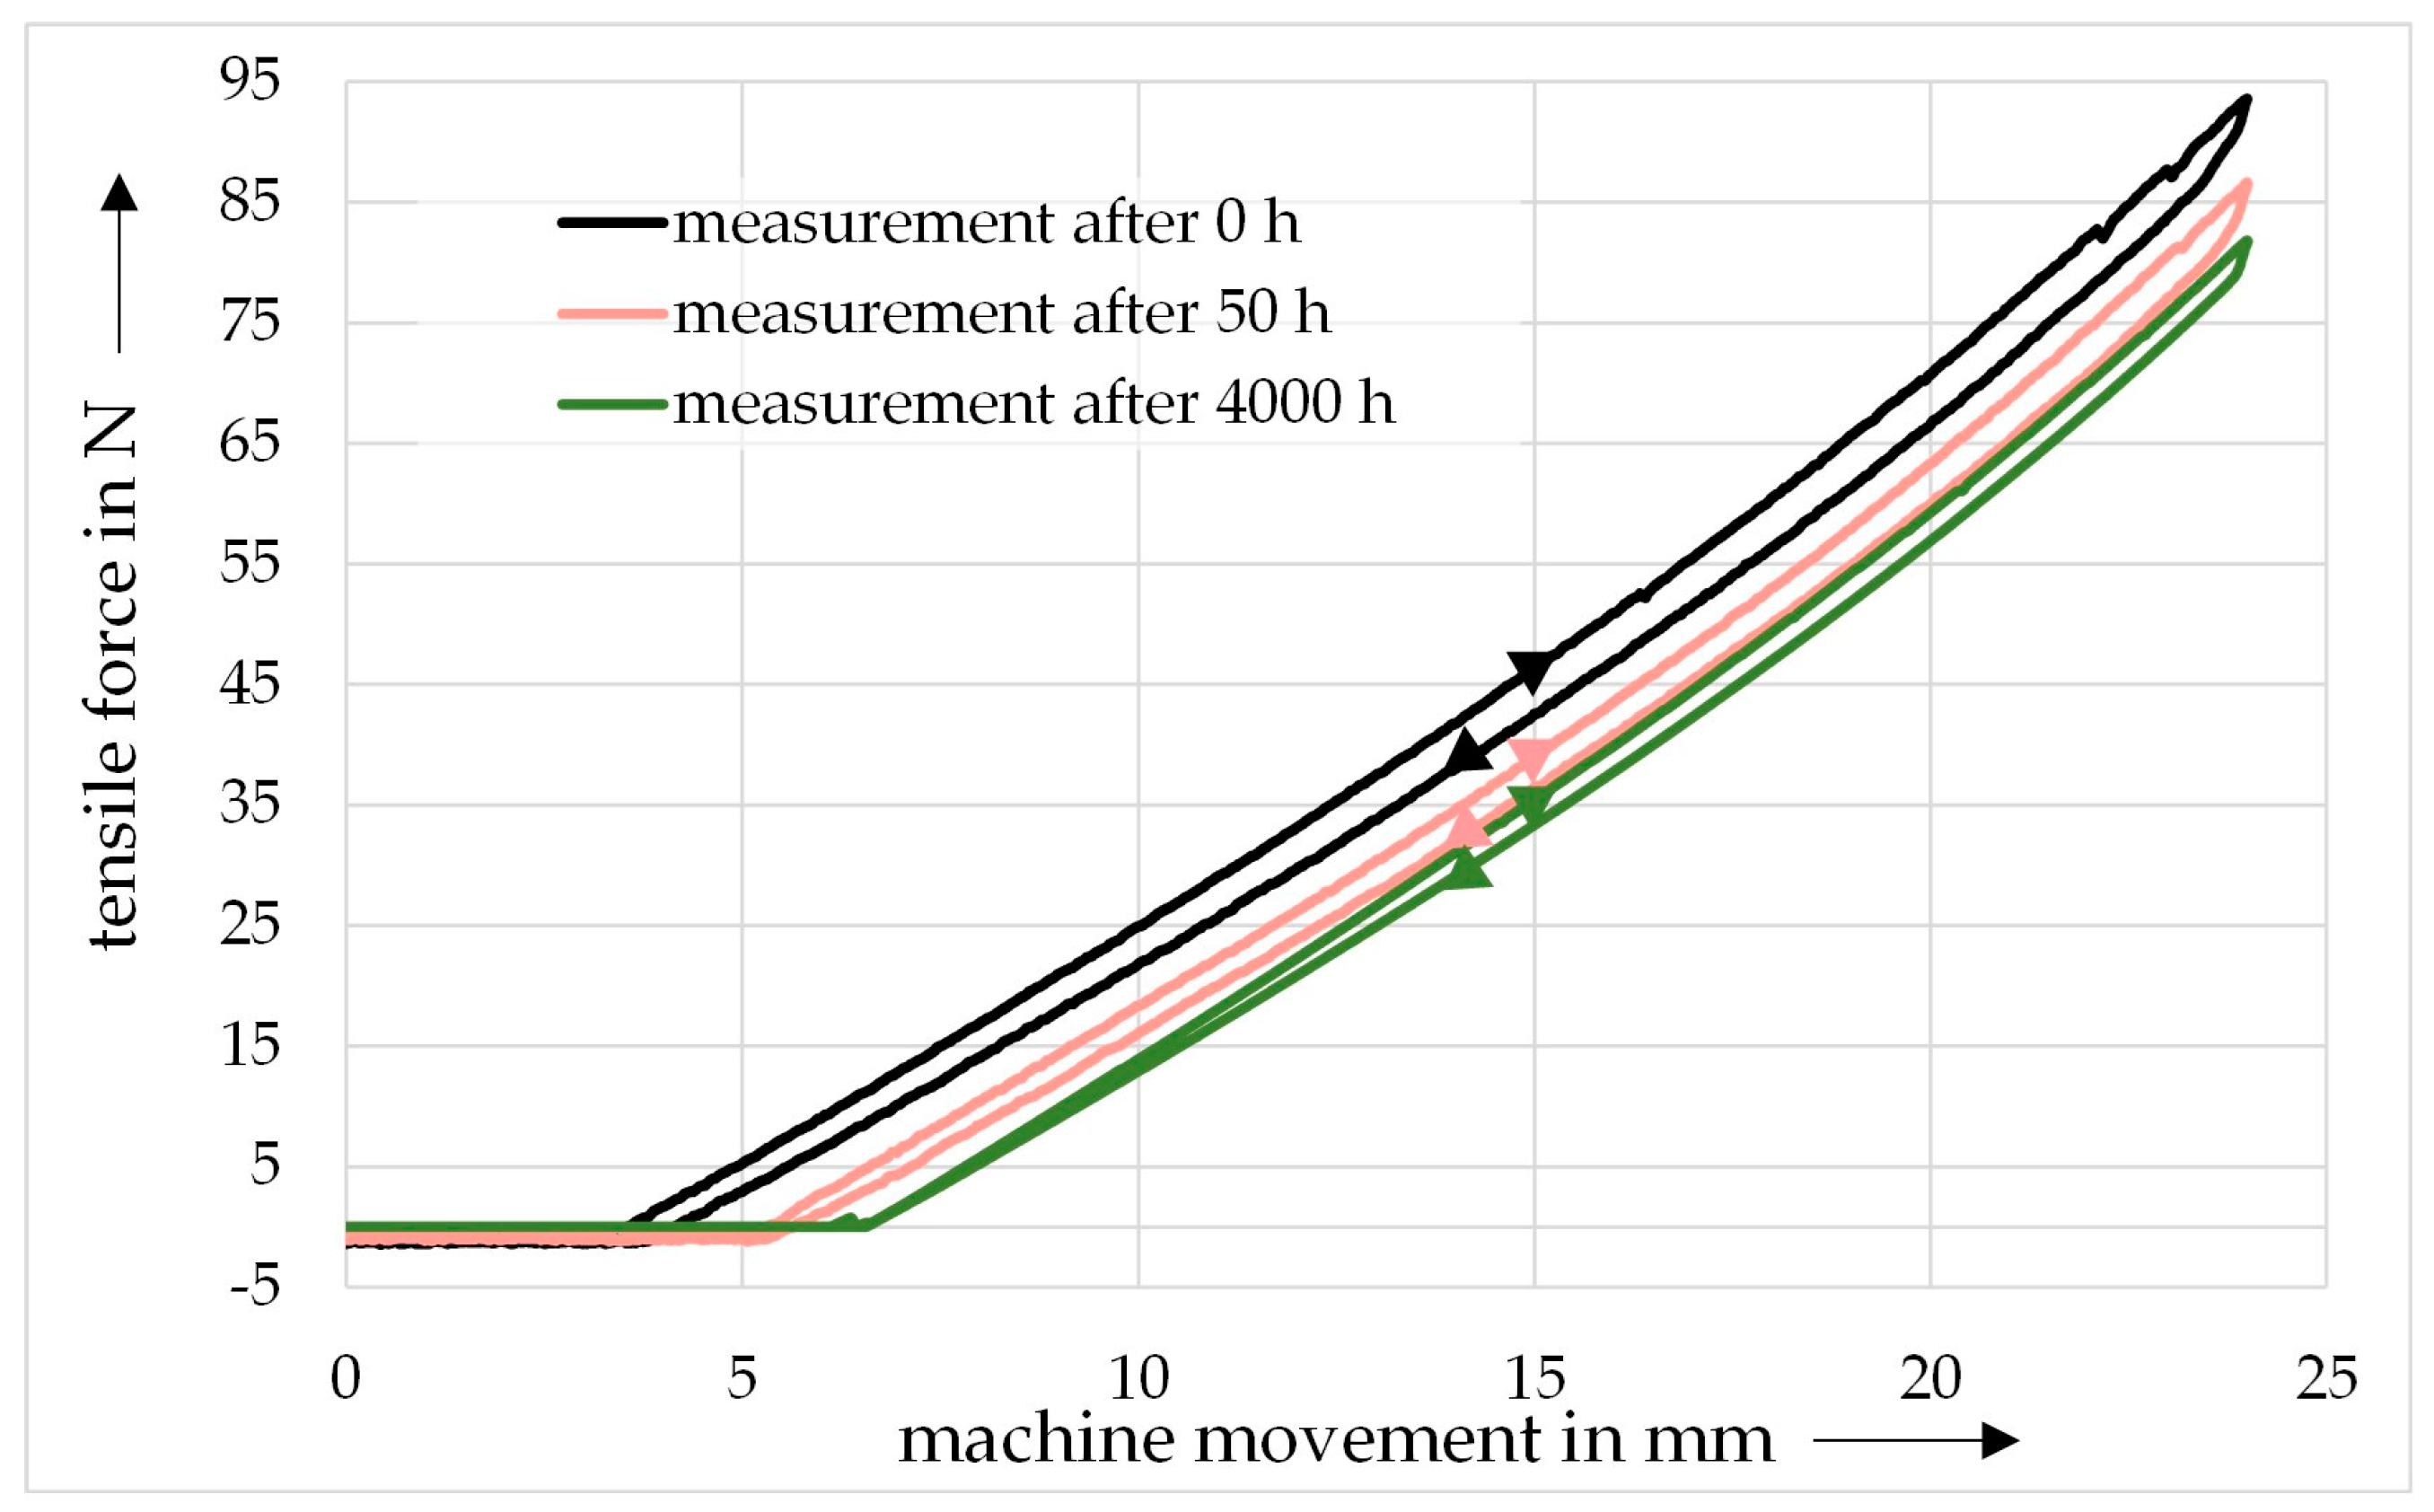
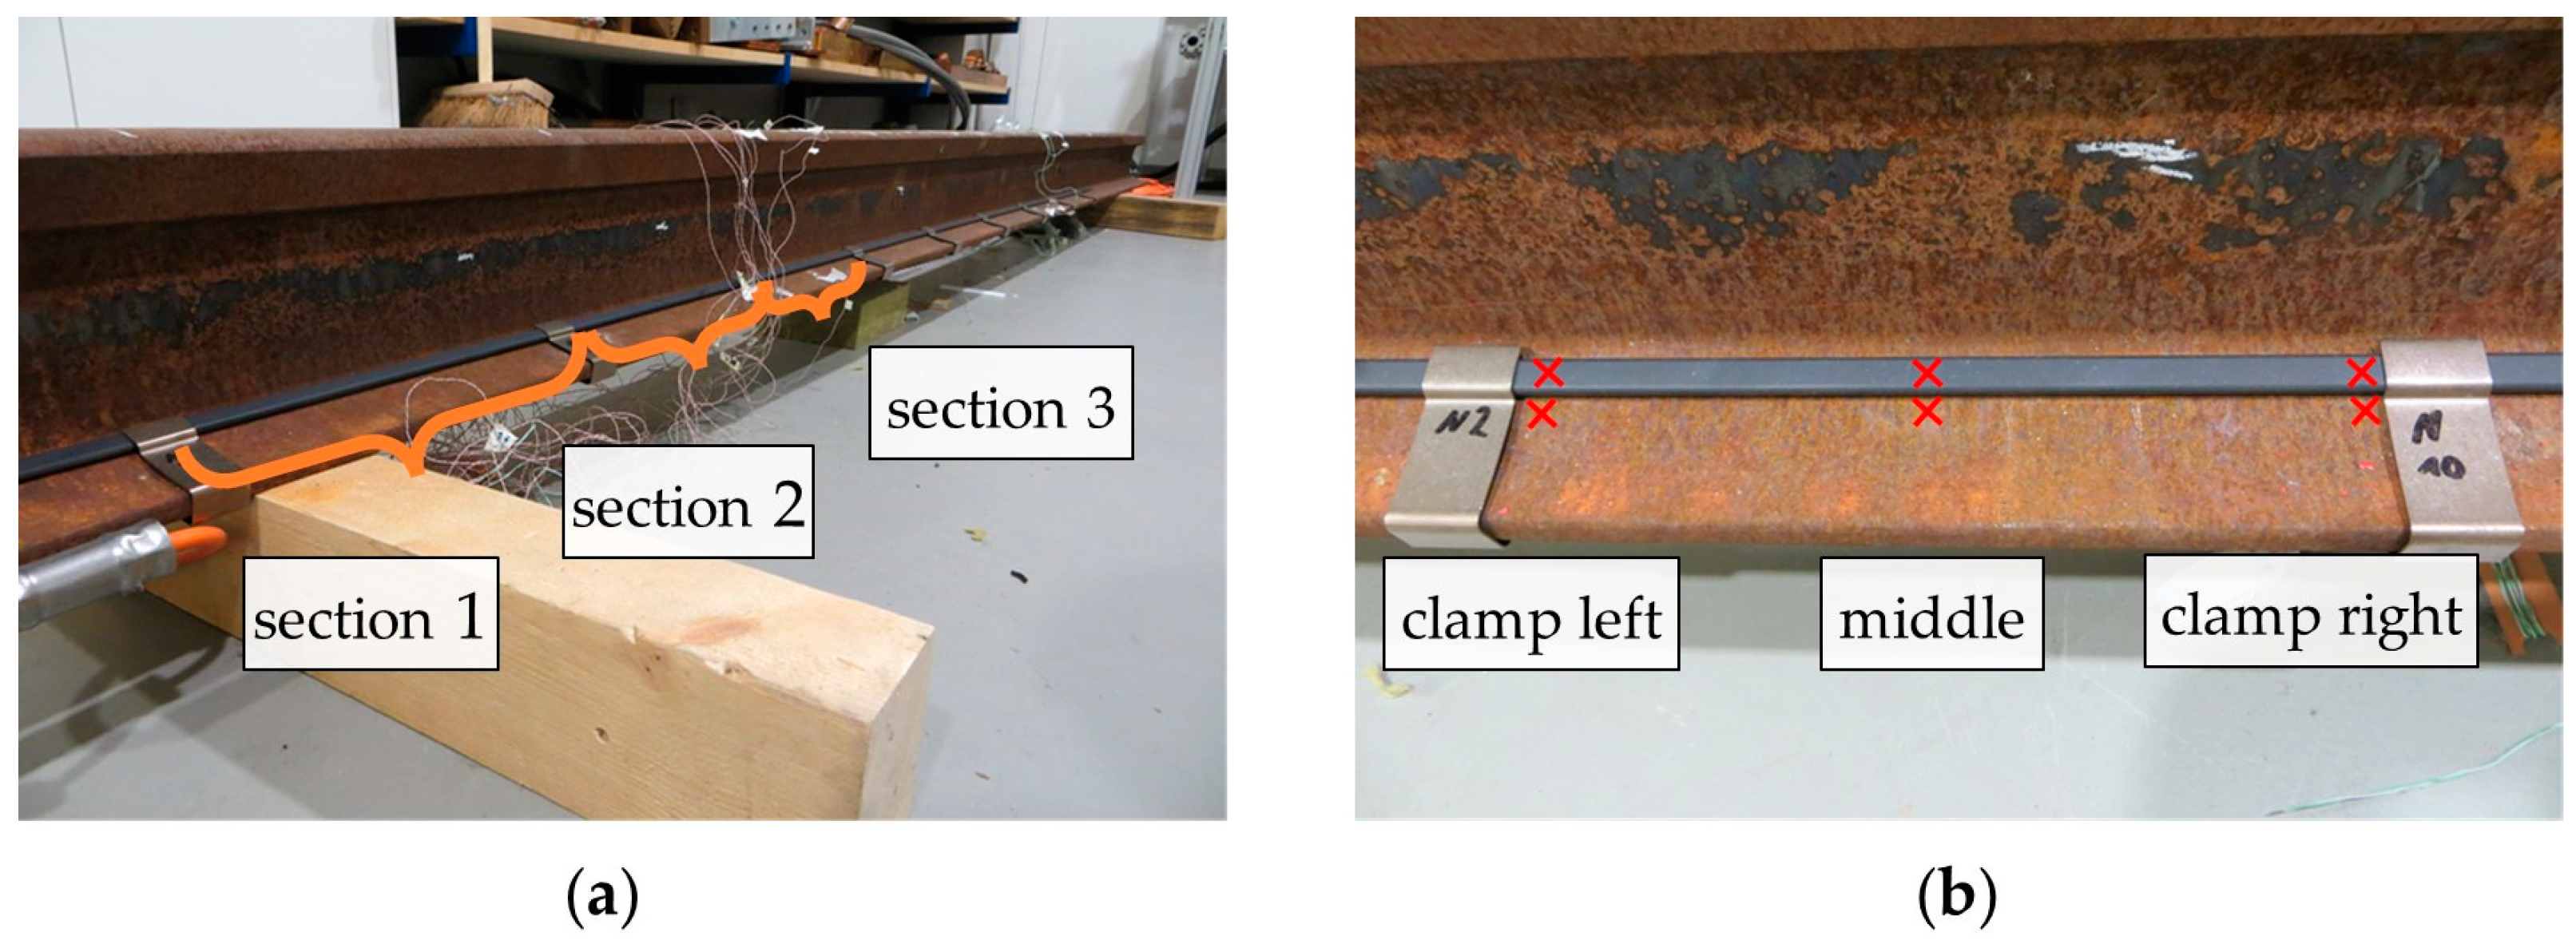
In order to get an idea about the force distribution between the heating rod and the rail in the longitudinal direction, another experimental setup was used. A separate UIC60 E1 stock rail was laid onto a wooden bearing, and an electrical heating rod was attached with clamps that were set at a center-to-center distance of 30 cm. The surface of the rail was neither milled nor coated with a thermal-conducting paste. For this investigation, a thermal imaging camera measured the temperatures. While the emissivity of the rail surface was known from former investigations ( ε rail = 0.835, [20]), the surface of the heating rod was coated with a special varnish to ensure a specific emissivity ( ε rod = 0.87). A “ZES LMG 95” measured the heating power. Due to the length of the heating rod, nine heating rod clamps were used for its installation. Thus, eight sections consisting of a middle area and two adjacent clamp areas can be defined (Figure 15a).
Within every section, the temperatures on the surface of the heating rod and on the rail surface close by were measured next to both clamps and in the middle (Figure 15b). In the next step, a two-dimensional FEM model of the heating rod and the rail was set up with “Comsol Multiphysics 5.6”. By comparing the measured temperature differences between the heating rod and rail with the results of FEM calculations with varying thermal contact resistance between heating rod and rail, the respective specific thermal contact resistance could be found for the positions next to the clamps and in the middle for all eight sections (Table 4).

4. Discussion

Considering the findings of the investigation on the clamping force of the heating rod clamps and the heat transfer at the clamp area, it can be stated:
  • The range in which the clamping force of newly manufactured heating rod clamps varies has no influence on the thermal contact resistance between the heating rod and rail.
  • Heating rod clamps with a reduced clamping force due to aging by mechanical and thermal stress cause the same thermal contact resistance in the clamp area as before any load was applied.
  • A higher initial force provided by modified heating rod clamps would not improve the heat transfer between the heating rod and rail in the clamp area.
The application of thermal-conducting paste really improved the heat transfer from the heating rod into the rail under laboratory conditions. However, its usage under real conditions might be challenging. The impact of weather, dust and dirt can reduce the longevity of the thermally advantageous properties. In addition, the milling of the rail surface reduced the thermal contact resistance in the experiment. However, this preparation is too time-consuming for the standardized installation process of a heating rod. Corrosion would subsequently take place again in the prevailing weather conditions. Therefore, it cannot be guaranteed to improve heat transfer long-term.
Considering the specific thermal contact resistance at the middle area, the determined values (min. R th , c = 2.0 10 3 m 2 K W 1 ) are significantly higher than for the clamp area (max. R th , c 0.9 10 3 m 2 K W 1 ). The usage of a two-dimensional FEM-model for the determination of the thermal contact resistance with measured temperatures at a rail involves an inaccuracy due to the longitudinal heat flows. The big size of the rail cross-section affects greater heat conduction compared to the heating rod. Assuming that the thermal contact resistance varies along the rail, greater proportions of heat will pass interfaces with lower thermal contact resistances. Within the stock rail, good thermal conduction leads to temperature compensation between sections with good and poor thermal contact resistances. This effect is not covered by a two-dimensional calculation model. Nevertheless, the results show the tendency of high thermal contact resistances in the entire areas between two clamps, especially in the middle areas. Hence, either the surface conditions of the heating rod and rail are much more thermally unfavorable, or the joint force is lower than investigated in these areas. The corrosion process on the rail surface continuously progresses, albeit slowly. So, it cannot be excluded that the corrosion layer of the used rail differs in thickness from the one that was used to determine the heat transfer depending on the joint force. Besides that, the distribution of the mechanical stress along the heating rod and the rail surface is not known. In addition to the material properties, previous deformations of the heating rod are likely to have occurred. Reasons for this may lie in the transport or installation process or in a resulting plastic deformation due to thermal extension. High clamping forces that prevent the heating rod from moving longitudinally might enhance this effect.

5. Conclusions

This article provides a contribution to the first investigations of the heat transfer between an electric switch point heating rod and the rail. The findings show that the clamping force of newly manufactured or loaded clamps over time is thermally sufficient. Rather, treatment of the rail surface is capable of reducing the thermal contact resistance between the heating rod and rail at the clamp areas. However, in practice, this application faces various challenges, and thus, railway companies will probably not use it. Nevertheless, based on the achieved results, further investigations can be performed aimed at the layer thickness and shape of the corrosion layer. This will allow a determination of the specific thermal conductivity of the corrosion layer. Additionally, the shape-related information of the corrosion layer and its mechanical properties could provide information about further optimization methods for the heat transfer from the heating rod into the rail. In this paper, the studies are based on the rail material R350HT in particular. Since there are also other materials being used for rail construction, further investigations into these materials are necessary. The selection of the specific steel alloy might affect the heat transfer between the heating rod and rail due to the mechanical, thermal, and chemical properties of the respective corrosion layer.

Author Contributions

Conceptualization: M.S., R.A.; Methodology: M.S., R.A.; Software: M.S.; Validation: M.S., R.A., S.S.; Formal Analysis: M.S.; Investigation: M.S.; Resources: M.S.; Data curation: M.S.; Writing—original draft preparation: M.S.; Writing—review & editing: M.S., R.A, S.S.; Visualization: M.S.; Supervision: R.A.; Project administration: R.A., S.S.; Funding acquisition: M.S., R.A., S.S.; All authors have read and agreed to the published version of the manuscript.

Funding

This research received no external funding.

Institutional Review Board Statement

Not applicable.

Informed Consent Statement

Not applicable.

Data Availability Statement

Not applicable.

Conflicts of Interest

The authors declare no conflict of interest.

Appendix A

Figure A1. Correlation between the electrical joint resistance and the joint force [14].
Energies 16 01678 g0a1
Figure A2. (a) Mechanical test setup for measuring the thermal contact resistance dependent on joint force; (b) Thermal insulation realized with rock wool and glass wool.
Energies 16 01678 g0a2
Figure A3. Milled rail surface as the contact surface and adjacent measurement spots of the thermocouples.
Energies 16 01678 g0a3

References

  1. Marquez, F.P.G.; Weston, P.; Roberts, C. Failure analysis and diagnostics for railway trackside equipment. Eng. Fail. Anal. 2007, 14, 1411–1426. [Google Scholar] [CrossRef]
  2. Brodoswki, D.; Flis, M. Experimental Verification of Contactless Heating Method in Railway Turnouts Heating System. Railw. Rep. 2022, 2022, 73–79. [Google Scholar] [CrossRef]
  3. Schladitz, M.; Adam, R.; Großmann, S. Calculation of the temperature distribution in heated switch points. In Proceedings of the CETRA: Conference on Road and Rail Infrastructure VI 2021, Zagreb, Croatia, 20–21 May 2021; pp. 647–654. [Google Scholar]
  4. Baehr, H.D.; Stephan, K. Heat and Mass-Transfer, 2nd rev. ed.; Springer: Berlin, Germany; New York, NY, USA, 2006; ISBN 9783540295266. [Google Scholar]
  5. DIN EN ISO 6931-1:2020-11, Nichtrostende Stähle für Federn_-Teil_1: Draht (ISO_6931-1:2016); Deutsche Fassung EN_ISO_6931-1:2020; Beuth Verlag GmbH: Berlin, Germany, 2020.
  6. Bargel, H.-J.; Schulze, G. Werkstoffkunde; Springer Berlin Heidelberg: Berlin, Heidelberg, Germany, 2012; ISBN 978-3-642-17716-3. [Google Scholar]
  7. Rösler, J.; Harders, H.; Bäker, M. Mechanisches Verhalten der Werkstoffe; Springer Fachmedien Wiesbaden: Wiesbaden, Germany, 2012; ISBN 978-3-8348-1818-8. [Google Scholar]
  8. Handbuch Hochtemperatur- Werkstofftechnik; Bürgel, R.; Jürgen Maier, H.; Niendorf, T. (Eds.) Vieweg+Teubner: Wiesbaden, Germany, 2011; ISBN 978-3-8348-1388-6. [Google Scholar]
  9. Gruber, B. Auswertung und Analyse von Streckenmessdaten zur Beschreibung der Empfindlichkeit gegenüber Head-Checks. Ph.D. Thesis, Technische Universität Wien, Wien, Austria, 2018. [Google Scholar]
  10. Madhusudana, C.V. Thermal Contact Conductance; Springer International Publishing: Cham, Germany, 2014; ISBN 978-3-319-01275-9. [Google Scholar]
  11. Holm, R. Electric Contacts: Theory and Application, 4th ed.; Springer Berlin: Heidelberg, Germany, 1967. [Google Scholar]
  12. Gatzsche, M. Elektrisch-Thermisches Betriebs- und Langzeitverhalten Hochstromtragfähiger Kontaktelemente. Ph.D. Thesis, Technische Universität Dresden, Dresden, Germany, 2017. [Google Scholar]
  13. Michejew, M.A. Grundlagen der Wärmeübertragung, 3. Auflage; Verl. Technik: Berlin, Germany, 1961. [Google Scholar]
  14. Böhme, H. Mittelspannungstechnik: Schaltanlagen Berechnen und Entwerfen, 2., Stark Bearb. Aufl.; Huss-Medien Verl. Technik: Berlin, Germany, 2005; ISBN 3341014950. [Google Scholar]
  15. Im, D.; Sancharoen, P.; Julnipitawong, P.; Tangtermsirikul, S. Effect of Chloride and Corrosion of Reinforcing Steel on Thermal Behavior of Concrete and Its Modeling. Eng. J. 2018, 22, 143–163. [Google Scholar] [CrossRef]
  16. He, Y.; Tian, G.; Cheng, L.; Zhang, H.; Jackson, P. Parameters influence in steel corrosion evaluation using PEC thermography. In Proceedings of the 17th International Conference 2011, Hong Kong, China, 17–21 August 2021. [Google Scholar]
  17. Chen, Y.Y.; Tzeng, H.J.; Wei, L.I.; Wang, L.H.; Oung, J.C.; Shih, H.C. Corrosion resistance and mechanical properties of low-alloy steels under atmospheric conditions. Corros. Sci. 2005, 47, 1001–1021. [Google Scholar] [CrossRef]
  18. Schlegel, S. Langzeitverhalten von Schraubenverbindungen mit Stromschienen aus Reinkupfer in der Elektroenergietechnik unter Besonderer Berücksichtigung der Temperatur. Ph.D. Thesis, Technische Universität Dresden, Dresden, Germany, 2017. [Google Scholar]
  19. Scheffler, E. Statistische Versuchsplanung und -Auswertung: Eine Einführung für Praktiker; 186 Tabellen; Dt. Verl. für Grundstoffindustrie; Wiley-VCH: Stuttgart, Weinheim, Germany, 2001; ISBN 978-3-342-00366-3. [Google Scholar]
  20. Schladitz, M.; Adam, R.; Grossmann, S. Set up of a thermal network method model for the calculation of temperature distribution in heated points. In Proceedings of the CETRA Conference on Road and Rail Infrastructure, Zadar, Croatia, 17–19 May 2018; pp. 277–283. [Google Scholar]
Figure 1. (a) Thermal image of heating rod and stock rail taken under laboratory conditions at an ambient temperature of 22 °C for a heating power of 300 W m−1 and an emissivity of 0.87 that was reached by using a specific emissivity varnish; (b) related temperature at the heating rod along the green horizontal evaluation path dependent on the respective pixel in the thermal image.
Energies 16 01678 g001
Figure 2. (a) Lattice structure of metals; (b) Stress−strain−diagram for materials without pronounced yield strength [6].
Energies 16 01678 g002
Figure 3. Heat flow through metallic contacts, corrosion layers, and the air gaps at the interface of the heating rod and rail.
Energies 16 01678 g003
Figure 4. (a) Attachment of the heating rod by clamps; (b) schematic view of a heating rod, stock rail, and clamp; (c) shape of a relaxed clamp.
Energies 16 01678 g004
Figure 5. (a) Test setup with ZwickRoell Universal testing machine; (b) Close−up of fixed clamp during the test procedure in a bent position with acting tensile stress on the inside and acting compressive stress on the outside of the clamp while the tensile force was applied.
Energies 16 01678 g005
Figure 6. (a) Measured tensile force that is required for increasing and decreasing machine movement for one selected sample of newly manufactured clamps; (b) Boxplot with median, upper and lower quartile; respective whiskers, and outliers of clamping force (the tensile force that is applied at the installed position of the clamp) for 85 newly manufactured clamps.
Energies 16 01678 g006
Figure 7. The tensile force depends on the machine movement of one sample stored mechanically installed at a temperature of 200 °C after three different load periods.
Energies 16 01678 g007
Figure 8. Boxplot with median, upper and lower quartile; respective whiskers, and outliers of clamping force (a tensile force that is applied at the installed position of the clamp) for the load groups depending on the load period.
Energies 16 01678 g008
Figure 9. Division of the joint heating rod and rail into clamp area and middle area.
Energies 16 01678 g009
Figure 10. (a) Connection of heating rod and rail with the respective temperatures and heat flow to calculate the thermal contact resistance; (b) Experimental setup to measure thermal contact resistance dependent on the joint force between heating rod and rail.
Energies 16 01678 g010
Figure 11. Isotherms and heat flow are displayed in the cross-section of the heating rod and rail from a previous calculation.
Energies 16 01678 g011
Figure 12. Geometric setup in FEM program “Comsol Multiphysics” with a meshed area close to the interface of heating element and rail.
Energies 16 01678 g012
Figure 13. Approach for determination of thermal contact resistance based on experimentally measured temperatures.
Energies 16 01678 g013
Figure 14. Specific thermal contact resistances for heating rod and rail with a length of 35 mm dependent on the joint force for different surface conditions (untreated or milled and with or without thermal-conducting paste ϑ = 0.5 K W−1).
Energies 16 01678 g014
Figure 15. (a) Stock rail with eight sections (three of them marked) consisting of two heating rod clamps and heating rod in between; (b) Section with temperature measurement spots (marked by red crosses) at clamp left, middle, and clamp right.
Energies 16 01678 g015
Table 1. Allocation of the number of clamps to the respective loading groups.
Group123456
mechanicalno loadinstalledno loadinstalledno loadinstalled
thermalroomroom150 °C150 °C200 °C200 °C
no. of clamps101515151515
Table 2. Varying parameters with the respective range.
QuantityMinimum ValueMaximum Value
ambient air temperature23.6 °C27.9 °C
temperature cooling element9.7 °C10.8 °C
heat input19.76 W20.64 W
Table 3. Standard values, adjustment factors, and maximum temperature difference caused by a variation in the measured range for the varying parameters according to Equation (3).
QuantityStandard ValueAdjustment FactorMax. Difference
ambient air temperature25.0 °C0.0027 °C0.01 K
temperature cooling element10.5 °C0.0040.004 K
heat input20.0 W3.3 K W−12.9 K
Table 4. Determined specific thermal contact resistances by experimental temperature measurement at the heating rod and rail surface and according to FEM calculation.
R th , c in 10 3 m 2 K W - 1 SectionMean
12345678
clamp left2.53.23.03.03.42.83.63.62.9
clamp right2.02.32.32.93.33.52.92.8
middle3.53.23.13.23.84.94.14.33.8
Disclaimer/Publisher’s Note: The statements, opinions and data contained in all publications are solely those of the individual author(s) and contributor(s) and not of MDPI and/or the editor(s). MDPI and/or the editor(s) disclaim responsibility for any injury to people or property resulting from any ideas, methods, instructions or products referred to in the content.

