1. Introduction
Human activity is gradually affecting the earth’s climate, adding enormous amounts of greenhouse gases (GHG) to those naturally occurring in the atmosphere. This process is driven mainly by the burning of fossil fuels for energy production, as well as deforestation, agriculture, livestock, and chemical production. Carbon dioxide is the main greenhouse gas produced by human activities, causing global warming and imminent climate change. The Paris Agreement adopted at the UNFCCC Paris climate conference (COP21) in December 2015, has set the ambition to limit global warming to well below 2 °C above pre-industrial levels and pursue efforts to limit the temperature increase even further to 1.5 °C [
1]. These targets can be achieved through the attainment of a substantial reduction in global greenhouse gas emissions. The energy sector is by far the largest contributor, accounting for over 75% of the global GHG emissions.
The global energy system, including small islands, is still massively based on fossil fuels [
2], which indicates the importance of energy demand and supply decarbonization towards limiting temperature increase. A key lever for achieving the Paris Agreement climate target, is the transition from fossil-based electricity generation to ‘clean’ electricity generated by renewable resources, while reducing emissions from the demand sectors (i.e., buildings, transport, industries) through accelerated energy efficiency improvements, electrification, and use of low- to zero-emission fuels (such as biofuels, green hydrogen, etc.).
Islands, due to their geographic location, small size, and climatic conditions as well as, often, lack of interconnections, are largely dependent on fossil fuels for power generation, especially diesel-fired power plants, to cover the electricity load. The high costs and price volatility of diesel fuel, coupled with the relatively low efficiency of internal combustion engines, the seasonal load variability (e.g., due to the touristic season or changing weather conditions within a year) and the growing tourism sector, introduce certain challenges and a degree of complexity into the design of energy systems in non-interconnected islands [
3].
In the context of a decarbonization transition, islands must phase out the use of fossil fuels and replace them with domestic renewable energies, including wind, solar and hydro power. Although renewable energy systems can reduce the greenhouse gas emissions to a great extent, the fluctuating electricity generation requires the provision of reliable balancing services and the installation of energy storage technologies to close the gap between demand and supply in daily, weekly and seasonal terms.
Non-interconnected islands are often forced to deal with interruptions in electricity supply, as energy production cannot meet island’s energy demand due to the absence of efficient local energy supply planning. The shift from fossil fuels to cleaner resources poses additional challenges as it requires a new energy planning agenda given that renewable energy sources (RES) exhibit different characteristics from fossil fuels in their operation, production variability, and local impacts. The effective energy system planning of non-interconnected islands requires the development of rigorous scientific methods that can comprehensively assess the different aspects of the energy demand and supply sectors and their complex interlinkages, the available power generation technologies, and the impacts associated with their deployment. The islands, because of their remote location, lack of energy interconnections, and relatively small size, can be seen as blueprints for energy transition pathways and become examples of the effective uptake of clean energy technologies for the mainland energy systems [
4].
Long-term energy system planning involves the participation of different actors (e.g., policy makers, technology providers, local businesses, citizens, regulators), domestic energy resources, available and emerging technologies, while also respecting the local legal framework (e.g., Croatian government has forbidden the installation of wind turbines on islands [
5]), the national climate policies, social patterns, and climatic specificities. Energy system modelling is an essential tool for effectively planning the transition towards ambitious emission reduction targets, while accelerating the penetration of RES in the best economic way to benefit the energy system, the economy, the environment, and the society. Energy modelling tools can simulate the performance of energy systems and devise different scenarios to come up with the most efficient options, policies and technology pathways and support decision makers in steering the future energy system towards decarbonization and decentralization [
6].
Although several research articles and studies have been published on the topic of island’s decarbonization [
7,
8,
9], there is still a large gap in the required modelling techniques covering the actual insular specificities. Most published approaches, according to authors’ knowledge, focus on forecasting techniques for renewable energy generation strategies [
10,
11,
12,
13]. In particular, the majority of the studies only focus on the electricity sector [
14], usually assuming an exogenous electricity demand, and do not represent other fuels and energy forms or their interactions with electricity. Commonly, they do not address energy demand explicitly and in high detail, lacking the capacity to fully capture the interlinkages between energy supply and demand [
15]. Therefore, they fail to simulate explicit abatement measures in large emitting sectors in non-interconnected islands, like transport (including maritime) and buildings. Finally, these studies do not quantify the socio-economic impacts of deep decarbonization pathways as they lack a soft link to macroeconomic models [
16,
17].
Considering the gap that exists in energy planning at the insular level, we designed and developed a state-of-the-art energy–economy model (IntE3-ISL) for medium- and long-term energy system planning and impact assessments of energy and climate policies in island-scale systems. The energy system model E3-ISL incorporates the detailed representation of energy demand and supply sectors and their complex interlinkages through energy markets. It can assess the needs for flexible services, driven by the high uptake of variable renewables, including those related to the activation of local energy communities. In order to assess the socio-economic impacts of alternative energy system configurations, E3-ISL has been soft-linked to the computational general equilibrium (CGE) economic model GEM-E3-ISL [
16] with its iterative process through appropriate data exchange routines. Using input and expertise of local stakeholders, we took a pragmatic research approach to building a state-of-the-art modelling tool to capture an island’s specificities and, capable of developing and assessing energy transition strategies at a local level, tackle also self-sufficiency and energy security in the medium- and long-term.
The structure of the study is as follows:
Section 2 includes the literature review that describes the previous efforts to model decarbonization pathways in islands.
Section 3 presents the development of IntE3-ISL model, including the modelling architecture, the mathematical principles and the sectoral, technology and policy coverage.
Section 4 summarizes the indicative results of a scenario, assuming the continuation of current policies in a non-interconnected island. The main findings are discussed in
Section 5, while
Section 6 concludes and presents an outlook for future research.
2. Literature Review
Energy system models are widely used by policy makers to quantify and analyze the impacts of several policy options and develop strategies towards climate and energy security targets. They are usually classified, based on their methodological approach, as either bottom-up and top-down. The latter approach is used to examine the macroeconomic impacts of a certain energy policy with a simplified, aggregate representation of the energy system. On the other hand, the bottom-up approach focuses on the energy system in depth. Bottom-up methods analyze the technologies and processes which characterize the energy system and evaluate different alternatives for technology uptake in future projections. Bottom-up approaches aim to identify the energy and technology mixes that can reduce CO
2 emissions to meet the Paris Agreement goals [
4].
Until now, bottom-up energy models have been commonly applied in islands to assess energy transition pathways, but only several of them were designed especially for islands while none of them for non-interconnected islands. For instance, the EnergyPlan, TIMES, and OseMOSYS models, although they have been applied at the insular level, were designed principally for country-level analysis [
4]. The literature review on the applications of energy models on non-interconnected islands shows that models have been mostly used for the short-term forecasting of electricity demand and RES penetration, covering only the electricity sector, without capturing the interactions with other energy commodities and economic sectors, the broader macroeconomic relationship, the climate policies, and the society. For example, EnergyPlan was applied on the Aland Islands by developing several scenarios based on various combinations of wind and solar production and storage solutions, electrified transport, and strategic energy carrier trade [
18]. The HOMER model was used to propose a renewable hybrid system for Agios Efstratios Island to substitute the current fossil-based system, aiming at maximum RES penetration without causing stability problems to the system [
19]. The H2RES model was implemented on the island of Malta to assess the technical potential of different energy scenarios, focusing on the integration of RES while maintaining system stability and reducing fossil fuel consumption [
20]. OseMOSYS model was applied in the island of Cyprus to assess the impact of electric vehicle deployment on the share of renewable electricity generation, electricity costs and carbon dioxide emissions [
21]. Finally, the UC-Plexos model was used to assess the impacts of electric vehicles on production costs for Barbados Island, a metric determined depending on different charging profiles and considering the value added from allowing electric vehicles to provide ancillary services to the grid [
22].
Table 1 includes the energy system models applied for energy planning at insular level. In
Appendix A, we gathered previous case studies using bottom-up energy system models, applied in non-interconnected islands, and their results. Most previous research studies mentioned in
Appendix A focus on the electricity sector without examining the whole system, the complex interactions of power, gas, heat, transport and buildings sectors under different pragmatic scenarios, or exploring medium and long-term energy transition strategies.
LEAP model is an integrated, scenario-based energy system modelling tool that uses an accounting framework to perform analysis of the energy policy and climate mitigation assessments. LEAP provides a tool to recognize resource extraction in all economic sectors, energy production and energy demand. It allows for medium- to long-term projections and can be applied at various geographical levels, from local to national, regional, and global. The LEAP model has been used in Taiwan [
22]; in the islands of Antigua and Barbuda, Haiti, Jamaica and the Philippines [
23]. The LEAP model gives the convenience to users to build their own energy forecast systems based on the existing data of energy supply and demand, to prepare different long-run scenarios, and compare results with other countries that also apply the LEAP model using a common approach. Energy demand in the LEAP model is completely exogenous and thus it cannot be used to project the long-term development of energy demand in islands based on economic grounds [
23].
TIMES (Integrated MARKAL-EFOM system) is a long-term planning model which performs energy system modelling, simulation, and optimization (using a single objective function) while considering sector pairing effects. TIMES [
24,
25] has been used in the non-interconnected island of Reunion [
24]. It adopts a 3-hour-long time resolution to perform long-term energy planning, while at the same time it reduces the computational effort. In TIMES model, it is difficult to integrate non-economic factors as the model includes a simplified linear programming cost minimization function, assuming the optimal behavior of agents without capturing realistic behavioral elements and heterogeneity in agents’ decisions. The above statements imply that TIMES is not suitable for developing long-term energy system projections on the insular level as it fails to capture the high load variability, the intermittency of renewable energy production or the impacts from behavioral change [
23].
OSeMOSYS is an open-source modelling system which is used for long-term energy system planning. It uses linear optimization to compute the energy supply by technology, minimizing the total discounted costs to meet the exogenously specified energy demand. The model covers the heat, electricity, and transport sectors but does not adequately cover the energy consumption, as it lacks a detailed representation of energy end uses, e.g., in buildings and industries. Energy demand is fully exogenous in OSeMOSYS and the model cannot be used for analyzing the long-term energy demand and supply transformations [
23]. It is currently used to represent electricity generation and trade between African countries and to evaluate the need for future investments [
26]. The Cypriot government has also used the OseMOSYS model to get guidance in their policy decision on how energy infrastructure should develop and in other regional or country-specific cases [
27].
The Homer energy system model, developed by the National Renewable Energy Laboratory, is mostly used at micro-grid level. In order to meet the electricity load for the whole year in time steps, the model simulates all possible combinations of energy technologies, and sorts all possible combinations by the least costly approach [
28]. Regarding non-interconnected islands, HOMER has been applied in St. Martin Island in Bangladesh [
29], in the pilot island in Favignana [
30], in Popova Island [
31], in Star Island [
32] and in Agios Efstratios in Greece [
33].
H2RES [
34] is a linear optimization model based on hourly time series analysis of electricity demand, wind and solar characteristics, and precipitation data. The aim of H2RES is to reduce the (discounted) yearly system costs and has been applied in an isolated island in the Madeira Archipelago, the Porto Sando Island [
35], to optimize the incorporation of hydrogen usage to periodically renewable energy sources. Regarding non-interconnected islands, the model has been applied on S. Vicente Island [
36] and on Malta [
37].
EnergyPlan [
38] is widely used in scientific projects to simulate energy systems on national and regional scales. The EnergyPlan model tries to simulate the electricity sector, industry sector, and transport sectors on an hourly basis with a time horizon of over one year. The model can be used on various geographic divisions and sizes of energy systems. Furthermore, it can be adjusted to specific locations and years once the respective data are applied. The model has been applied to the non-interconnected island of Gran Canaria [
39] and on La Gomera island [
40]. It has also been used in Lanzarote Island [
41] to investigate the possible concept methods that the smart energy system can increase the contribution of renewables to the primary energy supply of the island. In the islands Flores [
42], Pico and Faial in Azores [
43], the model used to analyze the interconnection between these two islands, with the objective of increasing the share of RES-based electricity. Lastly, it has also been used for the islands of Favignana [
44,
45] and Aland [
17] to investigate the optimal configurations of the islands’ energy system in 2050 with a multivariate analysis.
PLEXOS is a simulation software that uses specific techniques to optimize and simulate the integrated electric power and gas power systems [
46]. PLEXOS provides flexibility to the modeller because of the user-defined time resolution. Although it is a unit commitment and economic dispatch tool considering different security levels, fuel types and other operational constraints, it does not explicitly simulate the demand-side sectors [
47]. The model has been applied to the non-interconnected island of Aruba [
48]. UC-PLEXOS has been also applied in the non-interconnected island of Barbados to assess the impacts of the penetration of electric vehicles on the production costs and the stability of the grid [
49].
CompactPRIMES [
50] is a fully fledged model for single-country projections of energy system planning, energy pricing, energy demand projections, power generation in-vestment and policies related to energy and climate. It follows the market equilibrium approach between sectoral energy demand and supply and fuel type, and in this respect differentiates from models like LEAP and OSEMOSYS, which commonly do not capture the interactions between energy demand and supply and energy pricing. The model incorporates fuel prices, energy-related CO
2 emissions, climate policy instruments and several emission reduction technologies. It is designed for medium- and long-term projections and produces analytical quantitative results up to 2050 at 5-year steps, while also capturing intra-annual variability regarding the production of variable RES and electricity demand. The model can perform comprehensive energy supply and demand analysis for all types of energy and fuels. It was created in the general algebraic modelling system (GAMS), a high-level modelling tool for mathematical programming. The model has been applied to assess energy system planning in several countries including Slovakia, Bulgaria, Turkey, Azerbaijan, and Georgia in the frames of energy forecasting, long-term energy strategies and national energy and climate plans [
23].
Pursuing decarbonization targets and sustainable development goals, energy system models need to follow more holistic and integrated approaches that addresses the whole energy–economy spectrum. This is achieved in our methodology by linking Com-pactPRIMES with a macroeconomic model to consistently assess the socio-economic im-pacts of different energy system configurations. The model was soft-linked to the GEM-E3 model [
51] to cover the specificities of an insular-level economy as part of MAESHA project [
23]. GEM-E3 is a utilized computable general equilibrium (CGE) model that covers the interactions between the economy, the energy system, and the environment. It is well suited to evaluating the macroeconomic, trade, employment, financial, income and distributional impacts of climate and energy policies. The GEM-E3 model has been broadly used by the European Commission, as well as by national authorities, while GEM-E3-based analyses have been published widely in top-ranked scientific journals [
52].
The developed modelling framework can effectively simulate the specificities of Mayotte, which is an outermost region of the EU with a great geographical distance from the European continent but remains an integral part of the European Union. It has several common features with other EU islands: non-interconnected energy system, heavily oil-dependent, limited available resources, subsidization of energy prices by the mainland. These facilitate the replicability of the E3-ISL to other European islands, this replication being among the objectives of the MAESHA project, for the purposes of which this model has been developed. On the other hand, Mayotte has certain specificities compared to most European islands that affect the energy system planning and should be considered in the modelling. The outermost regions, Mayotte included, must deal with a number of difficulties related to their geographical characteristics, such as: remoteness, small size, difficult topography and climate. Remoteness entails high transportation costs (for fuels, products, etc.) and difficulty for interconnections. Mayotte has a different climate, compared to that of the European continent, characterized by a tropical monsoon climate (no space heating needs, need for air conditioning, etc.) Finally, Mayotte faces certain economic and social problems. It is a densely populated island with high population growth rates and migratory pressure from the neighboring regions. The youth unemployment is higher than 50% and Mayotte has among the lowest GDP per capita in the EU (68% below the EU average).
3. The IntE3-ISL Modelling Approach for Non-Interconnected Islands
3.1. General Modelling Features
Taking into consideration the specificities of non-interconnected islands pursuing decarbonization, the availability of data in island scale, and the gap in modern energy modelling literature, we developed a customized energy–economy modelling tool based on the CompactPRIMES and GEM-E3 models. The island-scale version of this tool is called IntE3-ISL and has initially been developed for and applied to the island of Mayotte (as part of the MAESHA project) but can be easily adapted for other islands in transition.
The IntE3-ISL modelling tool is the result of the combination between bottom-up and top-down methodological approaches, adapted to explore the energy, technology and economic conflicts of alternative policies and energy–economy system configurations on an insular level. This new modelling architecture is designed to represent long-term energy system developments, capture the island specificities, and simulate different flexibility solutions, energy market designs and climate policies. It is differentiated from the models described in the section above in the sense that it can consistently capture the interactions between energy–economy systems, energy demand–supply and energy pricing, as well as sectoral integration.
The model comprehensively covers in detail energy demand and supply by sector and energy carrier, heating/cooling and mobility requirements, energy efficiency, load seasonality, technology costs, the potential emergence of prosumers (and possible energy communities), electricity pricing mechanisms and different storage types, and finally flexibility solutions to support the integration of variable renewable energy sources like wind and solar PV. The main elements of IntE3-ISL model are:
- ➢
Detailed and complete representation of the key drivers of energy demand by sector, including both activity- and price-based drivers;
- ➢
Adequate sectoral disaggregation to represent key dynamics shaping up future developments in the energy markets of non-interconnected islands;
- ➢
Explicit representation of energy-related and climate policies and their impacts on the development of energy demand and supply and technology uptake by sector;
- ➢
Engineering-based representation of the power market to consistently simulate the energy system operation, including the variability of wind and solar energy;
- ➢
Incorporation of electricity and other networks (e.g., hydrogen, e-fuels) to analyze the synergies and interactions between them from the perspective of decarbonization;
- ➢
Behavioral representation of economic agents in the transport and buildings sectors (preferences of consumers over different types of energy forms);
- ➢
Comprehensive representation of the inter-linkages between energy demand, supply and the formation of energy prices as well as the relations between the energy system, economy and CO2 emissions;
- ➢
Easy adaptability to island-scale specificities, especially related to decarbonization of islands, with a large expansion of variable renewables, storage, and flexibility services.
3.2. Energy System Model Architecture
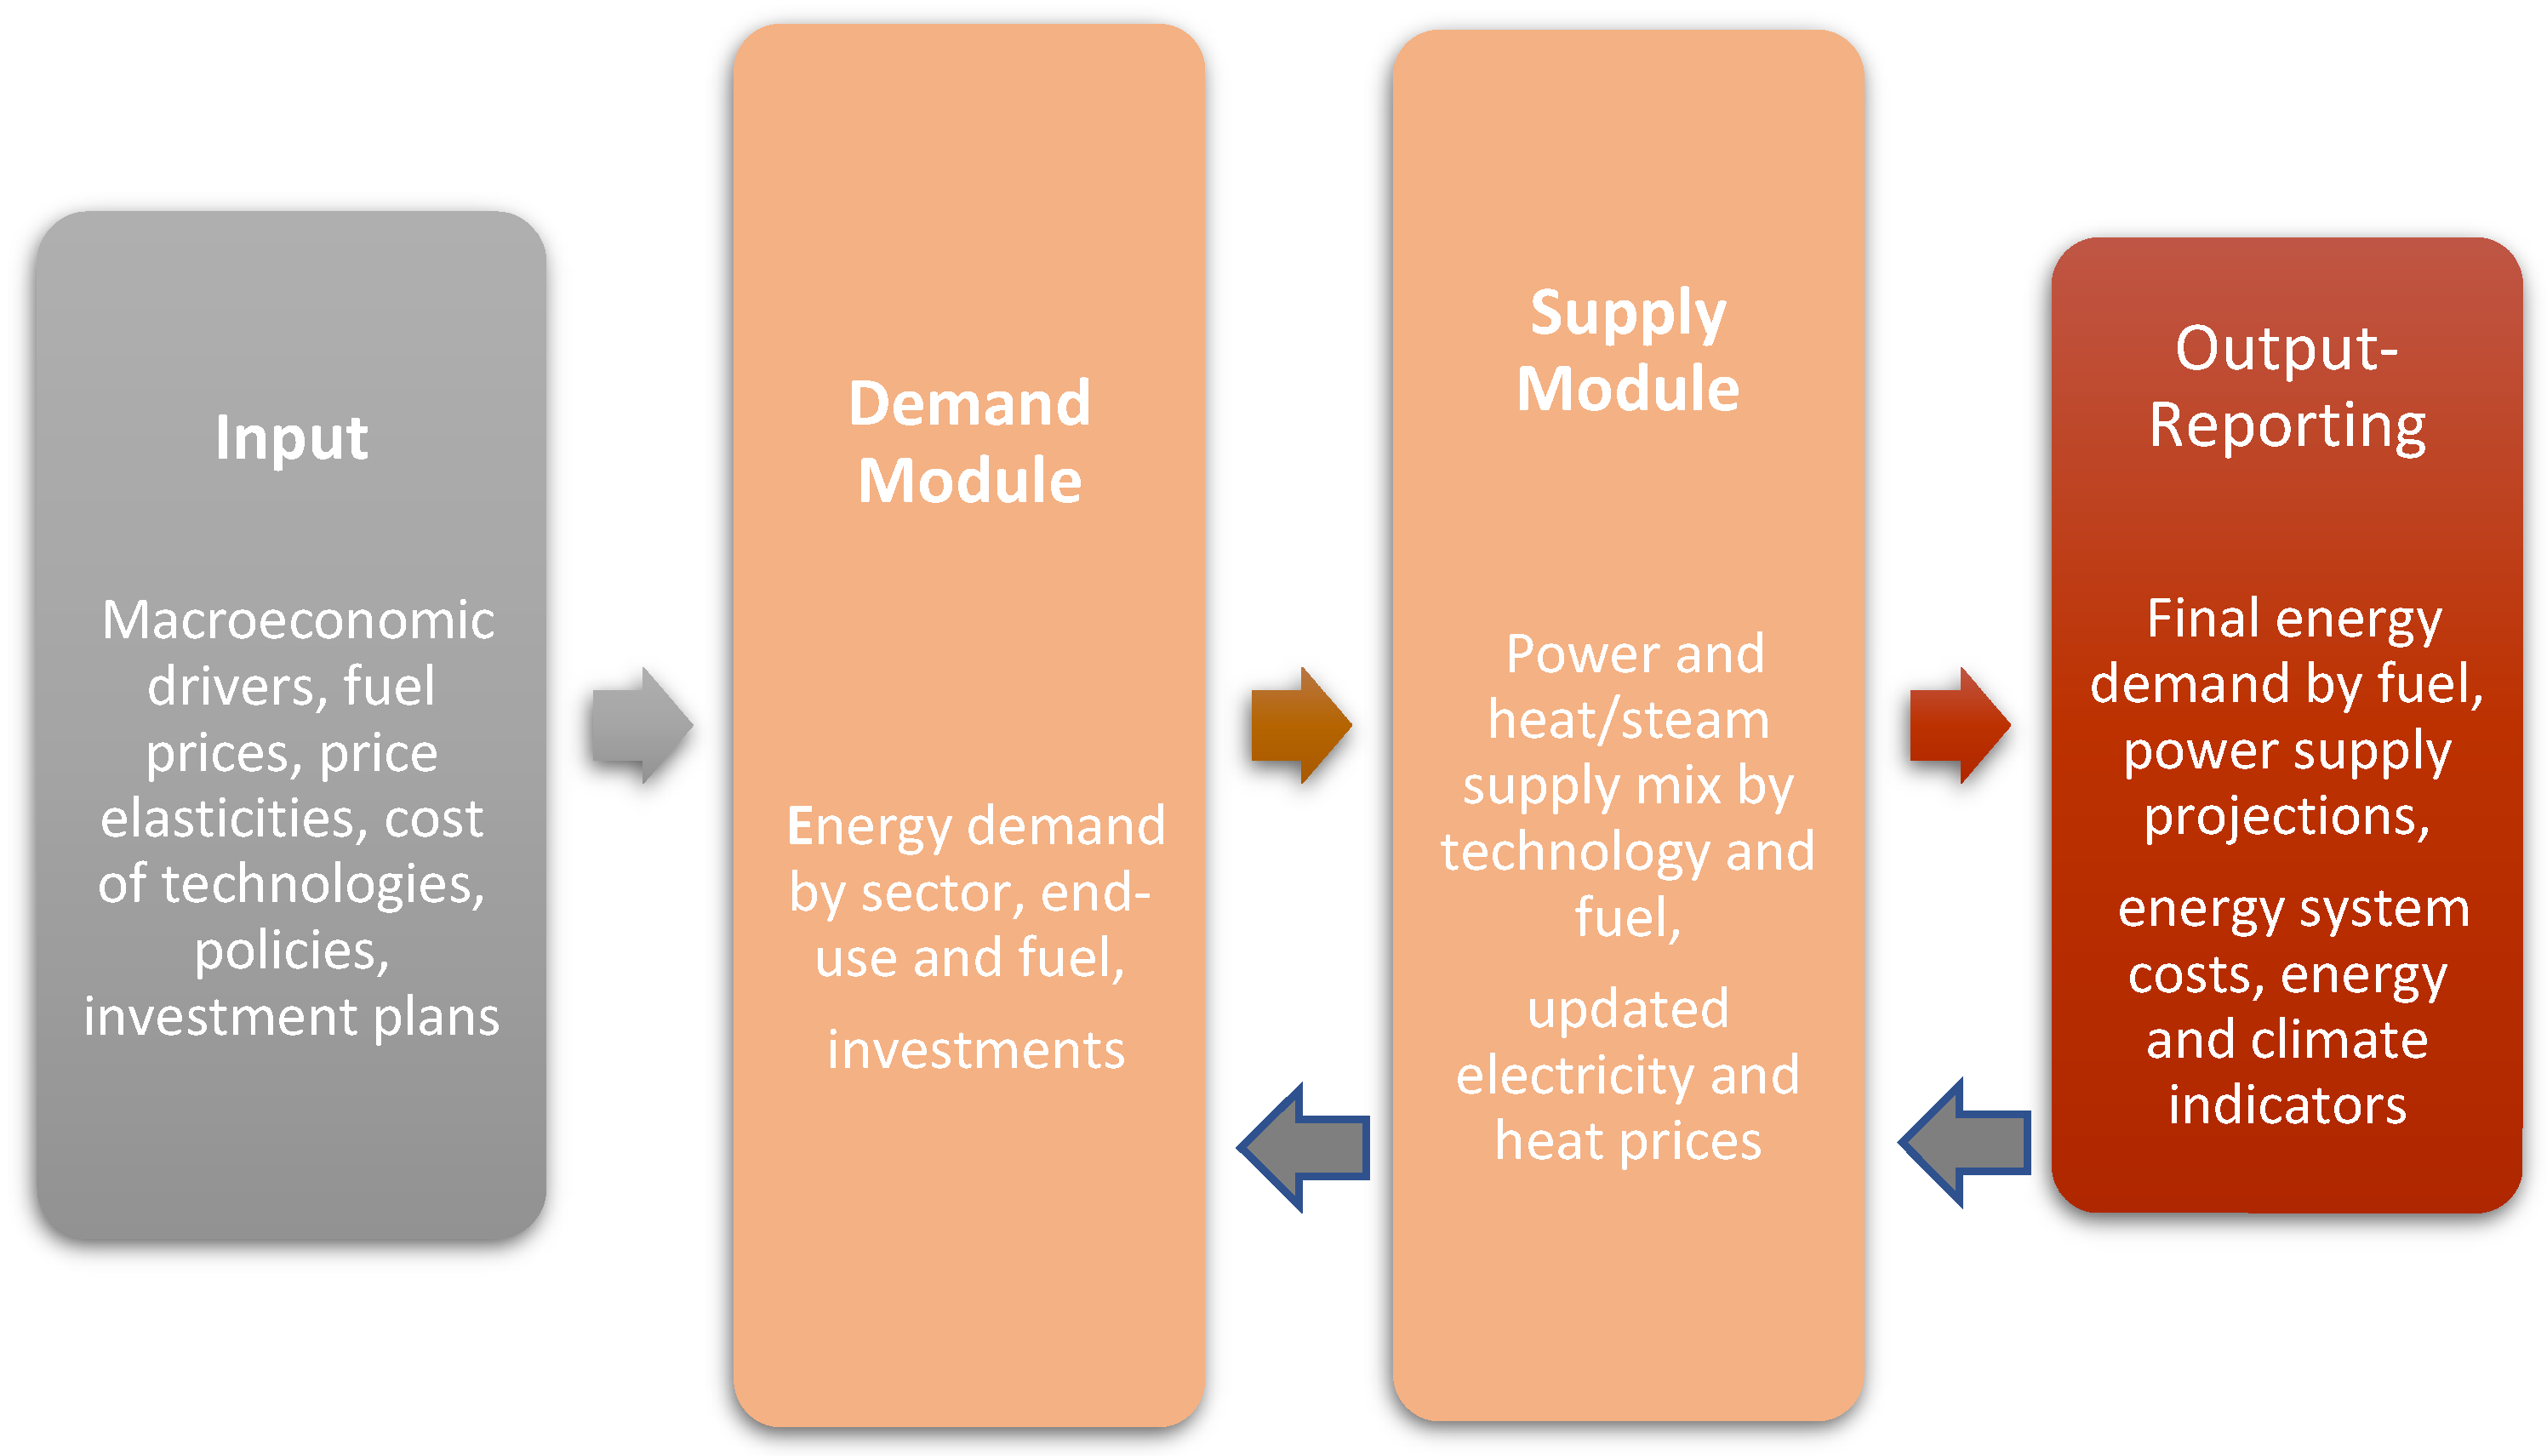
The energy system planning model E3-ISL is developed through the general algebraic modelling system (GAMS) for detailed projections of the energy system, forecasting of the energy demand, planning of the power sector, as well as for determining consequences of national and local climate and energy policy incursion, with a horizon up to 2050 as a fully fledged model. According to its methodology, the model is actor- and market-oriented, representing individual actors’ judgment in the energy demand and energy supply and the balance of their decisions in energy markets that are cleared by energy prices simultaneously. The model clearly projects electricity future prices as derived from cost minimization in the supply-side and the price-elastic behaviors of energy consumers, thus achieving market equilibrium. The model has a base year of 2015, is executed in 5-year time steps up to 2050 and comprises two main components:
Demand Module: It projects the demand for energy commodities and the equipment investments in the industrial, tertiary, agricultural, residential and transport sectors.
Supply Module: This module decides on how to cost-optimally serve the demand for electricity and steam, as well as hydrogen and clean synthetic fuels when eligible. It incorporates a separate sub-module for energy commodity pricing, which calculates the tariffs of electricity and steam per demand sector considering the grid costs, as well as the tariffs for green hydrogen and clean fuels. The module projects energy supply, including power, steam, hydrogen, and clean fuel production, with distinct representations of the power and heat supply systems.
The modules run sequentially, performing user-induced iterations. The Reporting Module produces the final results of the E3-ISL tool (
Figure 1) in user-friendly Excel-based files, which can be easily customized to include additional energy indicators, specified by the tool user.
3.3. The Demand Module of E3-ISL
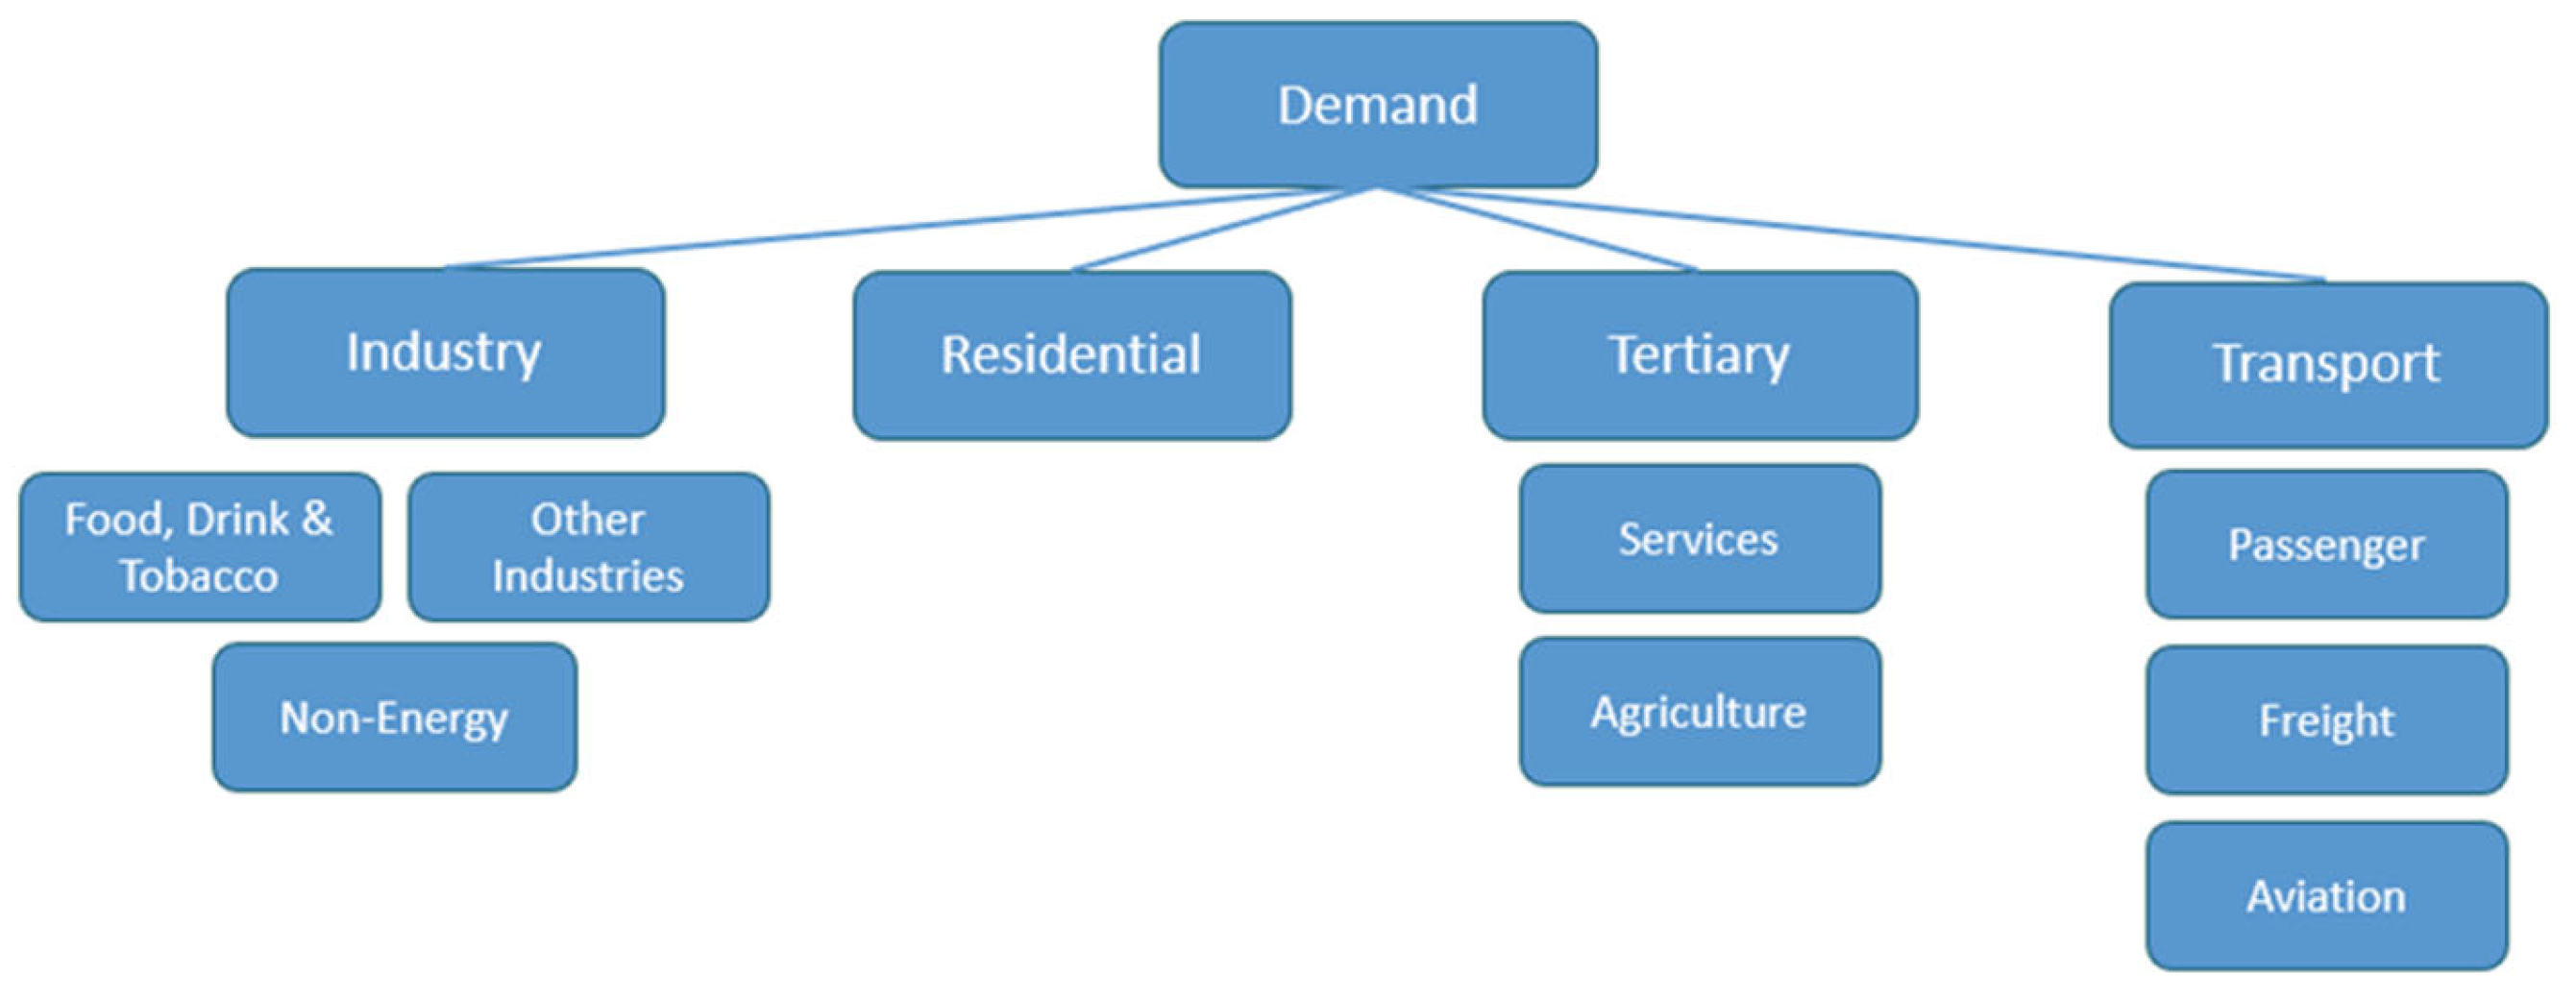
The demand module depicts all energy demand sectors and processes in a comparatively high level of detail with different end uses and processes associated with different fuels and energy requirements. The representation of different processes enables the impact assessment of several policies and measures related to energy efficiency. The demand module projects the investments in the end-use sectors and the demand for energy commodities in order to satisfy the sector’s activity, measured in different units depending on the sector, as shown in
Table 2.
Figure 2 illustrates the sectoral coverage of the E3-ISL demand module, with energy demand split into the main demand-side sectors, namely transport, industry, residential and tertiary/commercial.
In most energy demand sectors of E3-ISL, a representative decision-making agent is considered to operate. The representative agent per sector (
Table 3) decides on the use of the existing capital (private cars, heating equipment, appliances), the use of fuel in the equipment, and on the investment in new equipment to cover increasing activity needs, based both on their actual preferences (inertia biases) and on the economically optimum choices. The Demand Module is developed based on imperfect substitution among energy forms and technologies and its mathematical formulation follows the discrete choice theory with the use of logit functions representing discrepancy of preferences of individual consumers based on their income level, behavioral and social aspects [
53,
54]. (Discrete choice models are used to estimate the allocation of activity (shares) across sectors, the choice of equipment and fuel in the energy system planning tool and describe the selection process between two or more alternatives by estimating the respective probabilities upon which an agent will make a specific choice over these alternatives.) The Demand Module considers one decision-making agent by sector (who represents the entire population), except for the choice of heating/cooking equipment and private cars, where it assumes the existence of more than one stylized agents with different probabilities over the various alternatives.
Several policy drivers (including emissions’ trading, fuel taxation, RES and energy efficiency targets, subsidies for new efficient technologies, regulatory instruments, biofuel mandates, carbon/efficiency standards, behavioral changes) are factored in and influence the decision-making process. Those are disposed in the model input file and can be modified by the user in each scenario.
The Demand Module decomposes each sector into subsectors following the structure of a nested tree, with the raw level of the tree (SB) used to represent the most centralized form of demand sectors (e.g., passenger transport). In the level SD, the sectors of SB level are split into subsectors representing a more detailed classification (e.g., and passenger transport splits in private and public passenger transport, and then the private transport splits further in passenger cars and 2-wheelers). The final level of the nested tree (SF-sw) represents the categorization of the processes or end uses of every subsector that are meant to provide the final energy needed to satisfy the activity for the level SD. Every process is assumed to represent a relevant equipment category. These subsectors/processes may be complementary or substitutable (for instance, in transport only substitution applies, while in industrial sectors complementarity is valid in most cases). The first-level branches of the tree accommodate the projections of the sectoral activities, defined exogenously by the user. Then, the percentages by which every process or subsector of a lower level assists in the satisfaction of the demand for activity of the corresponding upper-level process/equipment or subsector are calculated. The percentages for the allocation of activity and final energy carriers are calculated based on cost minimization criteria, taking into account complementarity and substitutability across the subsectors and processes. In the decision-making process of the Demand Module, the comparison of long-term costs will determine the allocation of activity and process along the levels SB-SD and SD-SF, as well as the equipment type mix of the new investments (SF-SW), while the choice of fuel mix will be determined by the fuel-related short-term costs. The final level of the nested tree accounts for the most detailed equipment categorization and is the level where useful energy is translated into final energy consumption. Every technical feature of the equipment, including certain energy consumption, utilization ratios, investment, and fixed costs, etc. are specified for every equipment type.
3.4. The Supply Module of E3-ISL
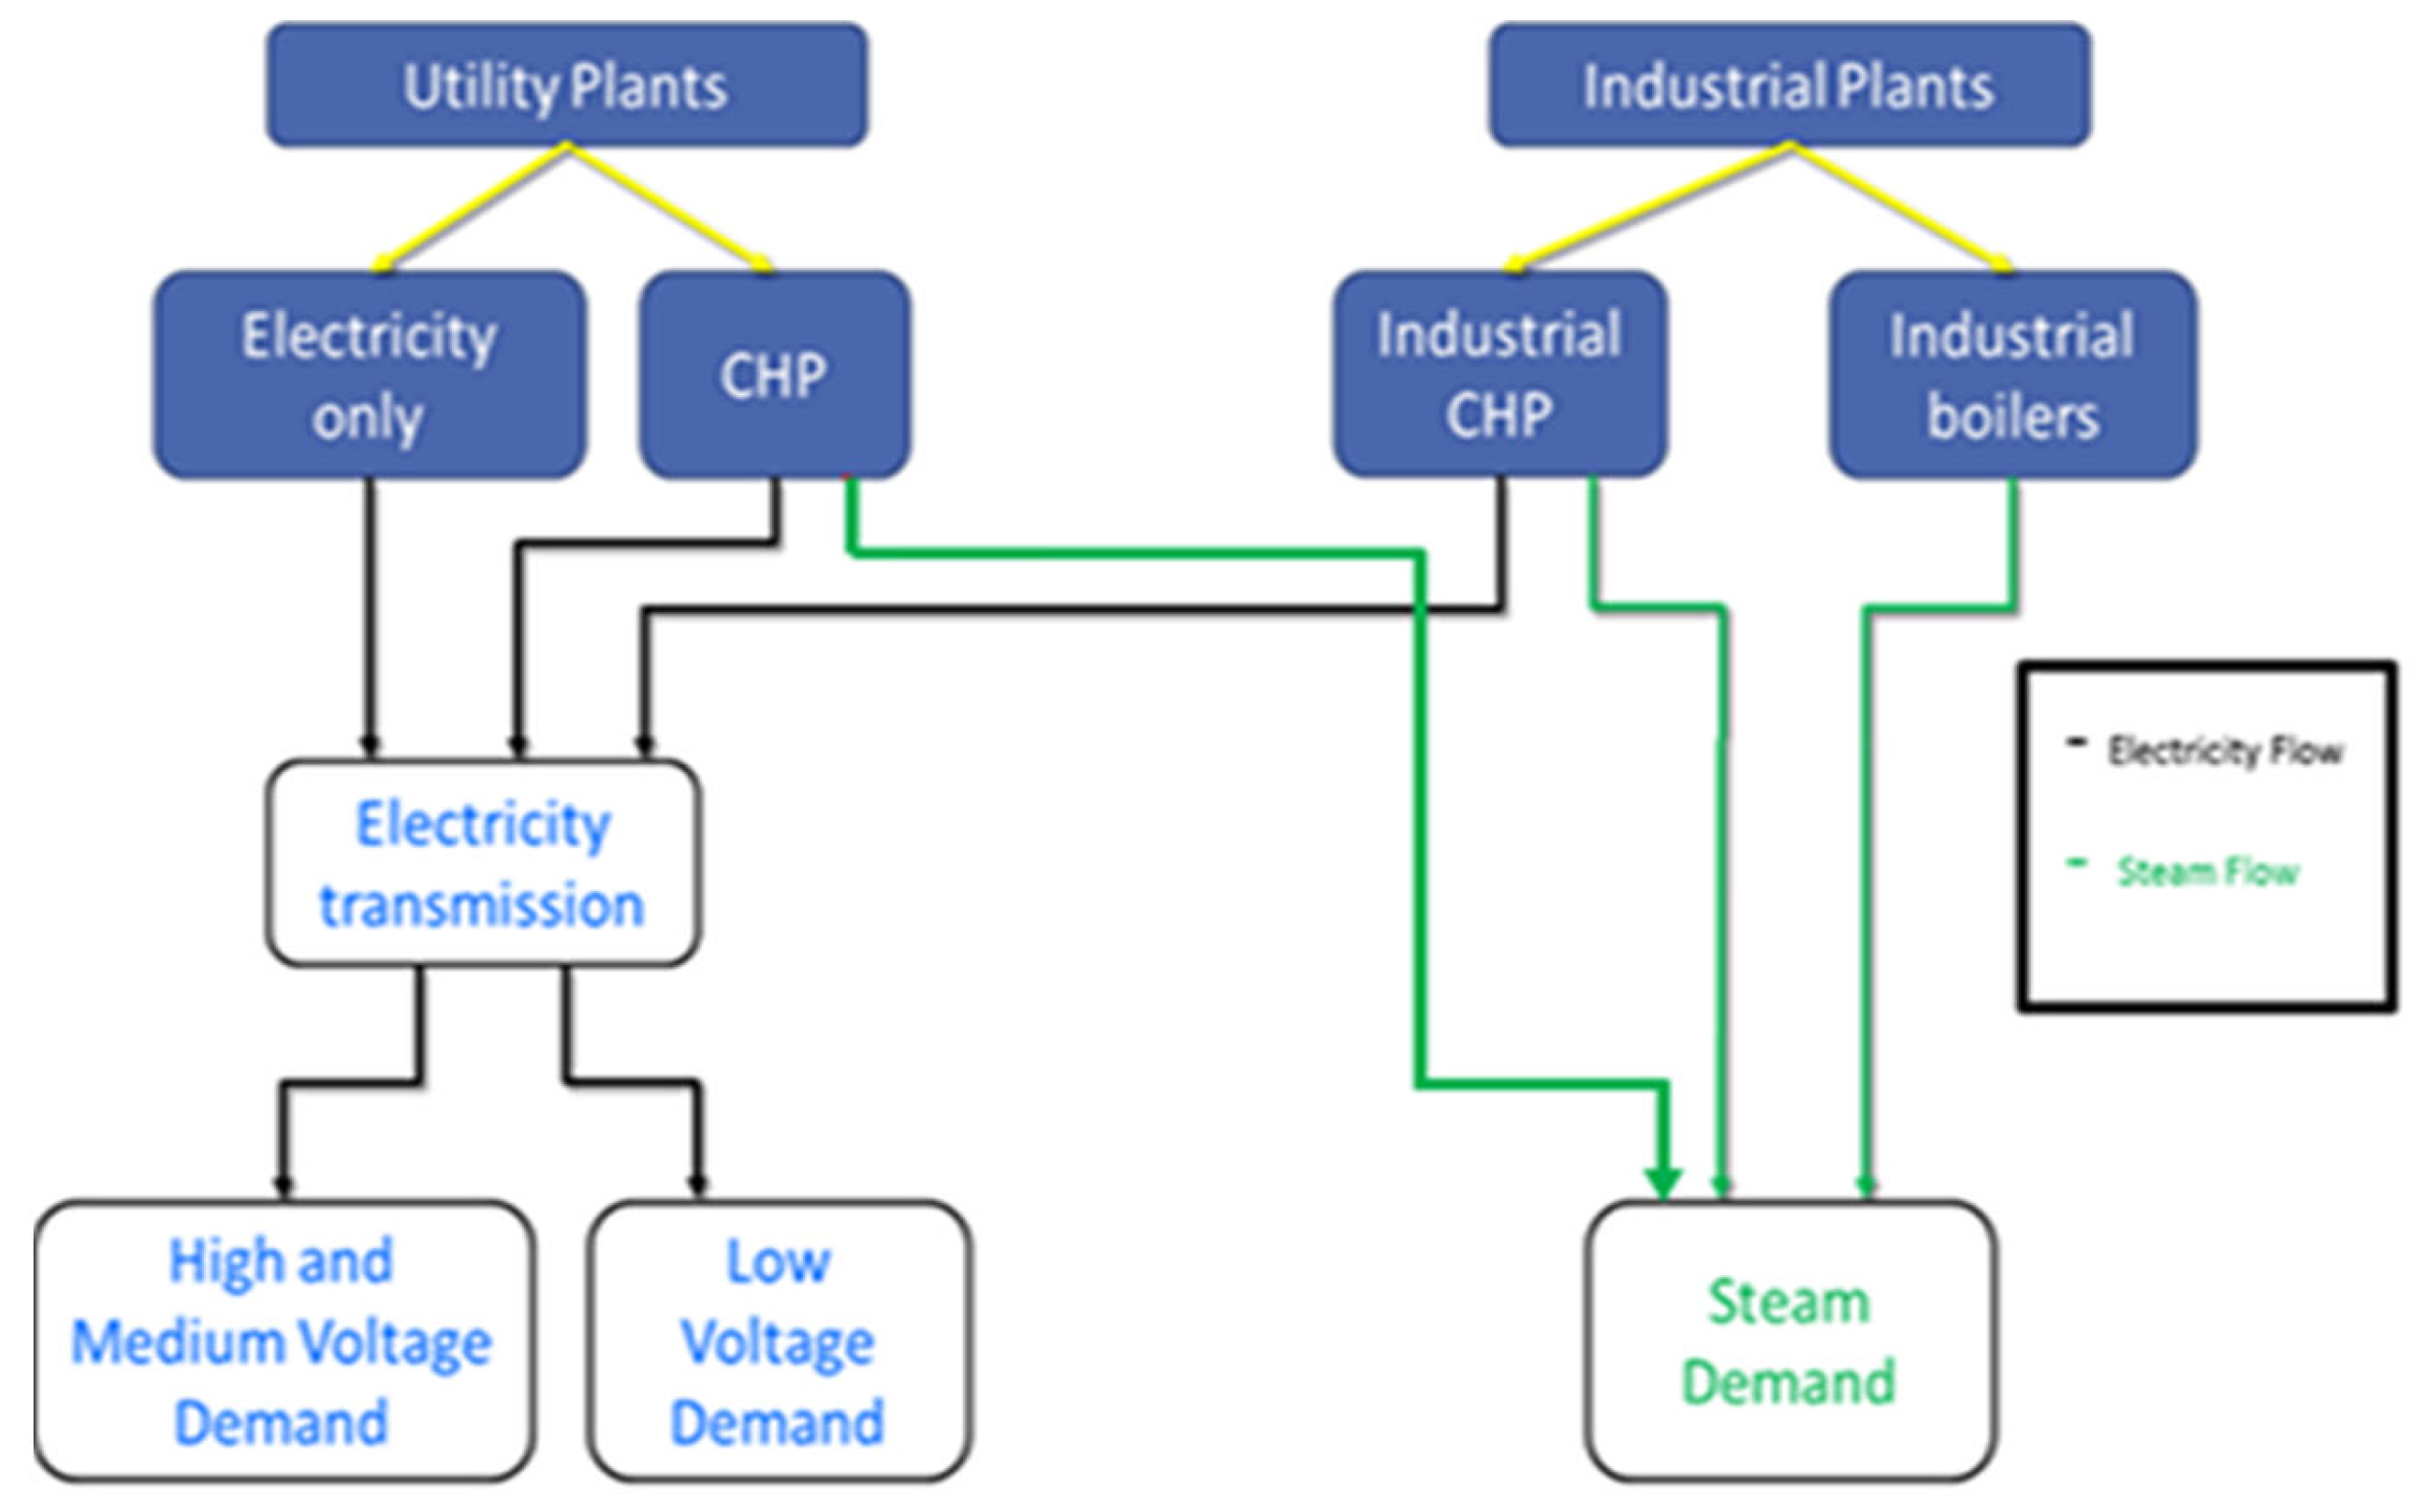
The Supply Module runs right after the Demand Module and includes all the necessary mathematical formulations for projecting electricity and heat/steam supply, with distinct representations of the utility and industrial plants. The model simultaneously solves the capacity expansion problem by estimating the optimal investment mix and the unit commitment problem by dispatching the power plants in several time segments within a year.
Figure 3 illustrates the representation of power and steam supply system.
The power plants incorporated in the Supply Module can be classified into utility plants, industrial plants, storage facilities, and power-to-X plants (
Table 4). The model distinguishes between different plant types that can be introduced in islands, including various forms of renewable energy (biogas, wind turbines, solar PV, solar thermal, geothermal, biomass and waste) and fossil-fired plants (gas turbines, ICE oil or gas, gas open cycle, gas combined cycle).
The utility power plants are distinguished from plants of fixed size and plants of non-fixed size for dispatching reasons. The plants with fixed size include gas-fired steam boilers, ICE, CCGT and biomass-fired steam turbines and have specific technical constraints for their operation. One power plant may comprise more than one unit. Other plant types (including various renewable energy technologies, etc.) have no fixed size per plant. The industrial plants are in the premises of industrial sites and are divided into steam-only plants (boilers producing only steam) and cogeneration plants with the main purpose of generating steam to serve the industry.
The Supply Module requires details about the techno-economic data of existing and candidate utility power plants, as well as industrial CHP plants and boilers, including gross and net capacity, year of commissioning, heat rate, fuel input, lifetime, capital costs, variable costs, fixed O&M costs, the technical lowest exit level at which a plant can operate, ramp-up and ramp-down rates, and their contribution in ancillary services.
The E3-ISL model accounts both for the expansion and the operation (dispatching) of the power system in order to meet the load for each specific hour in a year. Instead of representing the hourly load variation per year for the entire projection period (365 days–8760 h) until 2050, a process that would entail enormous computational time, the model compresses the annual hourly load curve by using representative daily hourly load curves with a specific frequency/occurrence. These representative daily load curves vary according to months, season (winter, summer) and type of day (peak, off-peak, etc.) to better represent the power system operation on non-interconnected islands. The E3-ISL model currently includes two different versions of time resolution, and the first version of time resolution includes one typical 24 h day with the average load and frequency of 365 days for the facilitation of the user. This enables the user to run multiple iterations with the supply module with a short execution time. The second version includes 9 typical days that are differentiated across the months of the year to capture the high load variation between the seasons (e.g., due to the touristic season), including extreme days to cover the peak load and days with high/low Sun irradiance. A relevant switch is included in the source code of E3-ISL to enable the user of the tool to easily switch to the different versions of time resolution.
The power system modelling takes into account the hourly profiles of electricity demand by sector (e.g., industries, households, transport), and similarly the hourly profile of production from variable renewable resources, such as wind and solar power. The choice of investing in new power production and storage plants is endogenous in the model, while the optimization is inter-temporal (perfect foresight). E3-ISL considers two types of power grids, the transmission high-voltage grid and the distribution grid with medium or low voltage. Every demand sector is connected to the high or/and medium/low voltage, either fully or partially; a grid loss rate is applied, aiming to represent the electricity losses.
E3-ISL defines the investment and mode of the varied power storage options in parallel with the capacity extension and function of power plants. The operation of energy storage power plants is determined by the charging times when the storage unit consumes electricity (usually in times of high production from variable RES) and thus increases the electricity demand (The storage unit supplies electricity to the grid, usually in times of poor power generation from solar and wind sources). The balancing cycle for hydro-pumping and batteries is daily and for the power-to-X technologies is seasonal. Demand Response acts as demand displacement and is rendered as a daily balancing storage.
Furthermore, the Power Supply Module can consider a wide variety of policies such as the carbon price in EU-ETS, fuel taxation, feed-in-tariff and other forms of RES support, environmental policies for airborne emissions and permitting policies, policies related to lifetime expansion of plants, retrofitting and early departure, technology evolution and market setbacks (individual parameters allow the users to exogenously define the year of final decommissioning, a retrofitting scheme or the limitation of the operating hours for a specific plant), as well as fuel switching and fuel blending. Modelling parameters related to non-linear cost–supply curves are factored in to reflect regulatory and market barriers that can impede the exploitation of local resources.
The model calculates the tariffs of electricity, steam, hydrogen and synthetically produced fuels per sector assuming that total energy system costs are recovered by energy producers, including also possible stranded costs. The tariffs distinguish between electricity generation and the provision of grid services (grid tariff). The price of electricity is calculated by type of voltage (base, medium, high) and consumer (households, industries, transport).
3.5. The Macroeconomic Model
GEM-E3 [
23,
51,
52] is a multiregional, multi-domain, repetitive dynamic computable general equilibrium (CGE) model which guarantees modalities on the macroeconomy and its interactions with the environment and the overall energy system. The model has been applied at global and national scale until now [
53,
54], but in the context of MAESHA an island version of the model is developed (GEM-E3-ISL). GEM-E3-ISL is based on a simplification of the macroeconomic GEM-E3 model (widely used by the European Commission), which is adapted to the island scale, improving and customizing it for island-scale analysis [
55]. The E3-ISL energy system model is soft-linked with GEM-E3-ISL economic model with an iterative process through appropriate data exchange routines. In this way, the impacts of macroeconomy, employment, trade of alternative energy system configurations and climate policies at insular level can be assessed.
The GEM-E3-ISL model has been applied to the island of Mayotte. GEM-E3-ISL model identifies Mayotte as a single region, but also its linkages with the rest of the world through endogenous trade and financial transfers. The model represents various activity sectors including agricultural sectors, energy sectors, industrial manufacturing, multiple service-related sectors (both public and private), transport sectors by mode, construction, and multiple electricity generation technologies. The model considers perfect competition market regimes, individual representation of technologies relative to energy and power, the prospective of inserting energy efficiency standards, as well as carbon pricing and carbon taxation, and revenue recycling. It computes a market equilibrium option, applied simultaneously for all indigenous markets and external trade links (general equilibrium). The model is driven by capital growth, equipment and knowledge, features equilibrium unemployment and can quantify the socio-economic impacts of policies, ensuring that in all scenarios the economic system remains in general equilibrium.
The GEM-E3-ISL model individually defines the supply or demand behavior of the economic agents which are considered to separately optimize their objectives, while market-developed prices assure global equilibrium, allowing the consistent evaluation of distributional policy effects. It considers clearly the market mechanism and the related price formation in the capital, labour and product markets. Prices are estimated by the model as an output of market-driven interactions between supply and demand and market clearing mechanisms. The model formulates production technologies in an intrinsic manner allowing for price-driven derivation of all intermediate consumption and the services from capital and labor. For the demand side, the model formulates consumer behavior and distinguishes between durable (equipment) and consumable goods and services.
Using a constant elasticity of substitution (CES) production function and operating within a perfect competition market regime, firms are assumed to maximize their profits. The lineal expenditure system (LES) function allows households to maximize their utility and decide on the consumption of various goods. The labor market formulation in GEM-E3-ISL allows for unutilized resources through involuntary unemployment, enacted by an empirical labor supply equation which links wages and unemployment through negative correlation. The model can handle different assumptions regarding the mobility of capital and labor, ranging from full resource mobility across regions to assuming that each region is limited to its own capital and labor resources, implying limitations to extra-insular investments and interregional labor migration. A series of modelling innovations, involved during the GEM-E3 development, enabled its departure from the constraining framework of standard CGE models to an innovative modelling system that represents the complexity of the economic system in a more realistic situation.
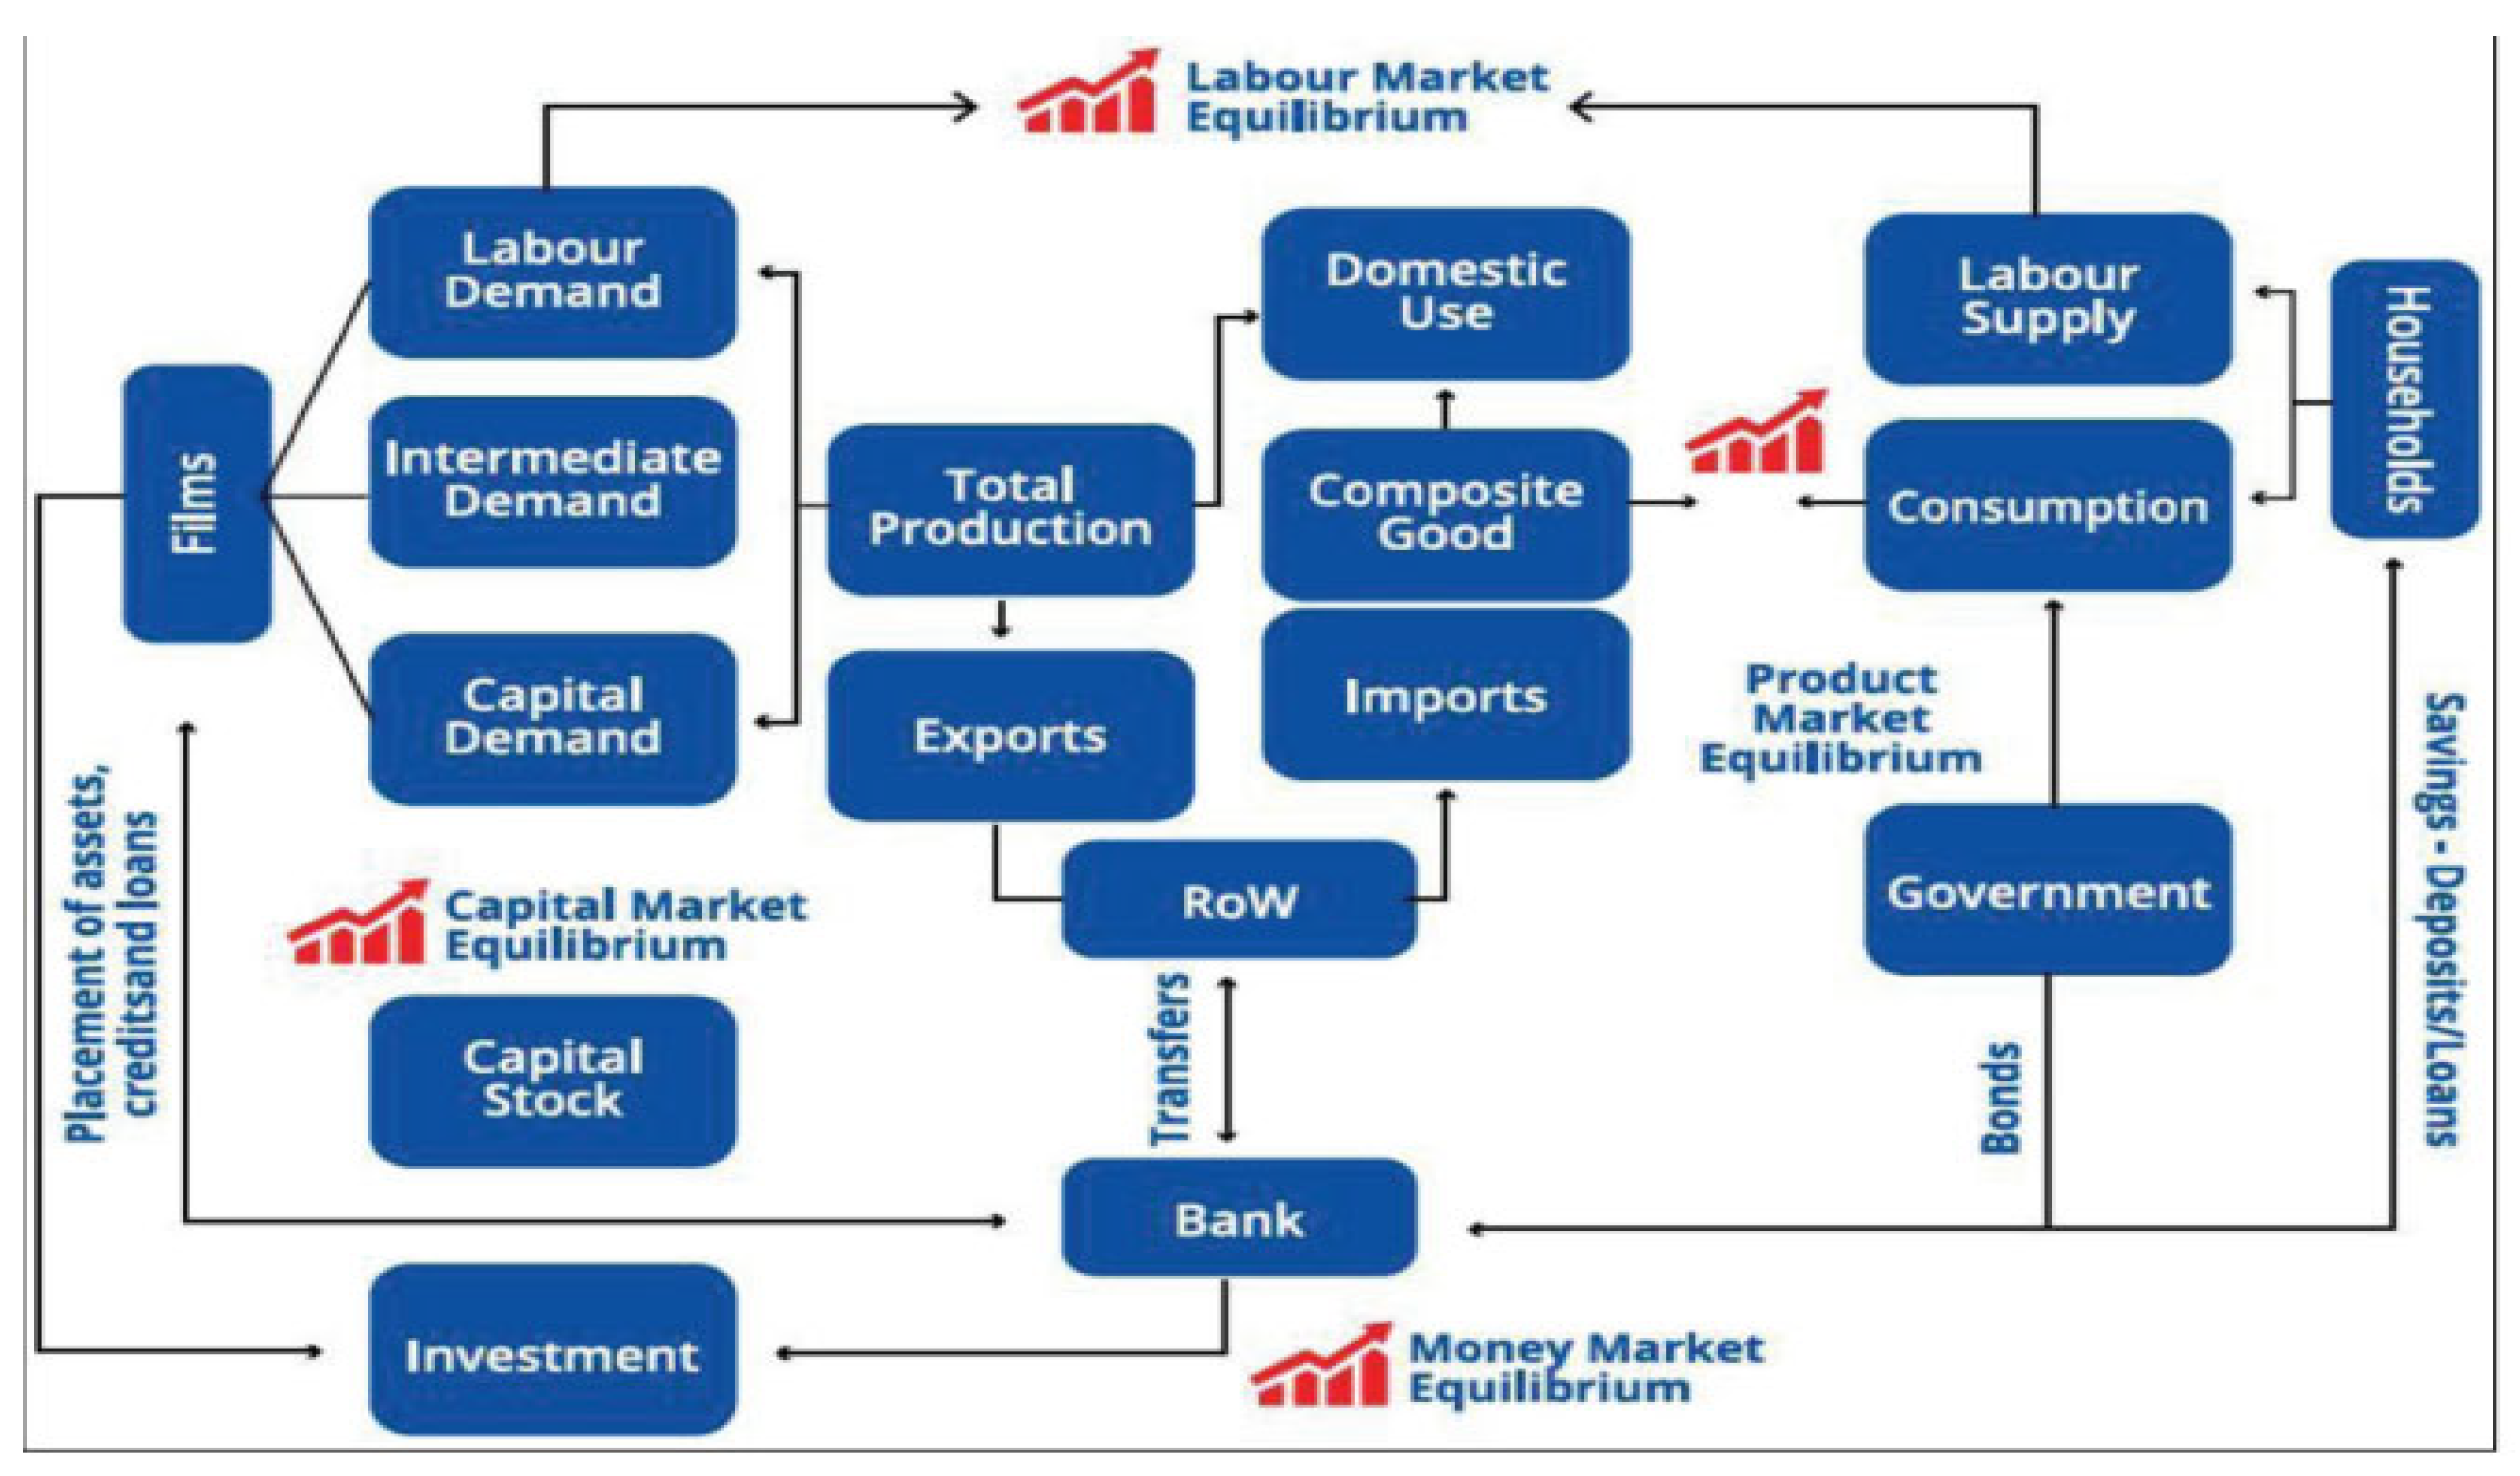
The basic component of the GEM-E3-ISL model is the detailed representation of the energy system and technologies (
Figure 4), improving the credibility of CGE modelling for decarbonization analysis as the substitution patterns in energy supply and demand are based on real-life technologies rather than restrictive functional forms. The analytical, bottom-up energy system representation in GEM-E3-ISL includes electricity production by technology fuel mix by sector, uptake of different car types (e.g., EVs or plug-in hybrids), energy efficiency improvements, etc.
The model has in-depth sectoral coverage, with 38 products (goods and services), each produced by a specific production sector, and it is calibrated to a wide range of datasets (input–output tables), financial accounting tables, institutional transactions, energy balances, emission inventories, trade, investment matrices and household budget inquiries. The model is established on strict and sound microeconomic theory, giving the ability to investigate the inter-connections of the five sectors of the economy in a consistent and coherent framework.
GEM-E3-ISL represents a bottom-up approach for electricity sector and the GEM-E3-power module [
56] computes the best investment and operation of the electricity system reducing the total production costs, including capital costs (CAPEX), operation and maintenance (O&M) charges, carbon expenses and costs to purchase fuels, while meeting limits including technology possibilities, resource availability, policy limits and the robustness of the system. Thirteen power technologies are listed (coal, oil, gas and biomass-fired, nuclear, hydro, solar photovoltaics, onshore and offshore windfarms, geothermal, carbon capture and storage—CCS—with coal, gas, and biomass) and compete based on their levelized cost of electricity to meet electricity requirements in each time segment. The modelling includes non-linear cost–supply curves for power technologies, which capture the depletion of renewable energy likelihood, the boost of internally produced fuels, difficulties in developing CO
2 storage areas, policies relative to nuclear site development, etc. [
56]. Full coherence of the power supply mix between the GEM-E3-ISL and E3-ISL models is ensured through using the same costs and potentials for power generation technologies and other parameters influencing investment in power generation and storage technologies.
The most important results, provided by GEM-E3-ISL are: full input–output tables for each country/region identified in the model, GDP by region, employment by economic activity and unemployment ratios, investment by country and by sector, private and public energy consumption, two-sided trade flows, consumption matrices by product and investment matrix by ownership branch, emissions by economic sector and fuel type and extensive energy system projections.
3.6. Soft-Linking Energy and Economy Models
Although CGE models can arrest the complex links between energetic, environmental and economic systems, conventional CGE models, being top-down tools, are not adequate to represent in detail the energy system and related technologies and processes. This relates to how they commonly treat the energy sector using aggregate production functions like constant elasticity of substitution (CES). The limitation with top-down models is the fact that they are not able to explicitly represent specific sectoral policies, subsectoral policies or technologies. Electricity generation, for example, in top-down models is reflected as an individual technology although it includes different technologies (hydro, nuclear, solar, wind, coal, oil, gas) [
55].
On the other hand, bottom-up models represent the technological, figurative and economic aspects that are used in both energy supply and demand and can simulate the evolution of the future energy system, capturing real-world dynamics; these models are very common in the energy–economic literature. Bottom-up technology-rich energy system models, like E3-ISL, include a disaggregated depiction of energy demand and supply sectors and related technologies, but are not capable of estimating economy-wide impacts of energy or climate change policies and ignore the responses from the interaction of the energy sector with the wider economy.
Researchers [
56,
57,
58] are trying to combine the top-down with bottom-up models, aiming to capture technological details and provide the wide economic impacts of a policy [
59]. Two methods are used to soft-link energy and economy models: (i) a hard-link approach where the computational general equilibrium model is protracted to cover extensive representation of the energy system and (ii) a soft-link approach where the two models are connected through defined variables and a continuous process to ensure the models’ meeting point. Commonly, the soft-linking approach is preferred because it exploits the advantages and strengths of both methods while limiting the computational burden [
60,
61]. The methodology used in the current study is based on a soft link between GEM-E3-ISL and E3-ISL energy system model through exchanges of model parameters and variables.
GEM-E3-ISL enhances the credibility of most CGE modelling for climate policy analysis as the substitution patterns in energy supply and demand are based on technologies that exist in the real world rather than other limited functional forms. The GEM-E3-ISL model has two modes of operation; a stand-alone mode, where the energy system is endogenous in the model, and a soft-linked mode, where GEM-E3-ISL is linked to the E3-ISL energy system model through a soft-link approach. A methodology based on the soft-link approach has been developed for the calibration of the relevant parameters of GEM-E3-ISL to the energy and technology-related projections of the E3-ISL energy system model. The developed methodology is based on examining and synchronizing different sets of energy-related variables, including among others, power generation mix, energy demand and fuel mix, transport by fuel, mode and technology, and energy efficiency measures. The link between E3-ISL and GEM-E3-ISL models is illustrated in
Figure 5 below and the process has been evaluated in several test scenarios, examining the behavior of the soft-linked modelling suite under different assumptions.
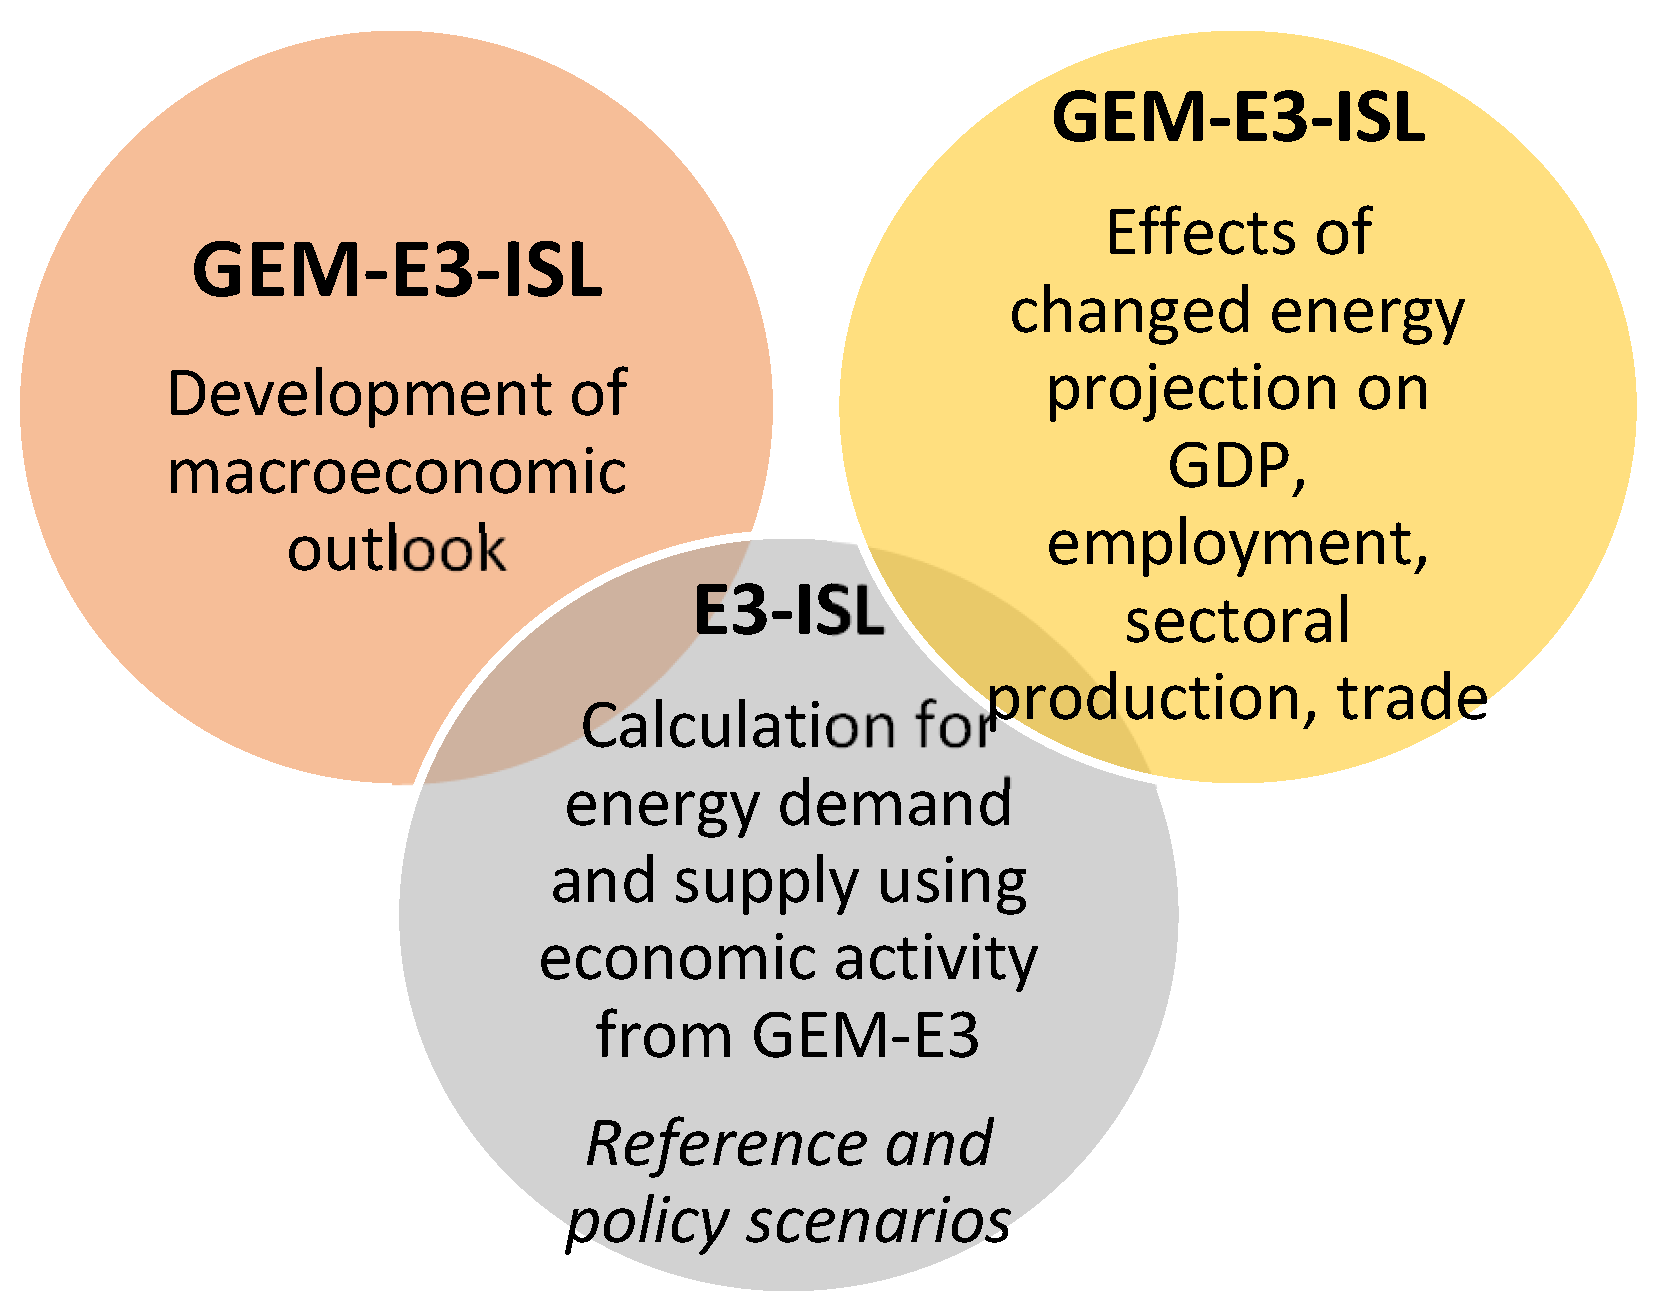
In the baseline scenario, the process starts with a first run of the GEM-E3-ISL model which provides the development of a ‘’baseline’’ macroeconomic outlook for Mayotte. Then, this macroeconomic outlook is used by the E3-ISL energy system model, as the energy demand by sector is driven by the relevant socio-economic indicators. In this step, the E3-ISL model takes variables related to GDP growth and population development as exogenous inputs from GEM-E3-ISL. These include as sectoral production, especially for services, industry and the agriculture sectors. As exogenous parameters, their integration into E3-ISL is straightforward. These parameters are transferred between the models and customized in Excel-based spreadsheets (The parameters can be modified by the user of the modelling tool). The E3-ISL model then runs with the baseline macroeconomic outlook and provides energy demand and supply projections for the baseline scenario, which then feed back into the GEM-E3-ISL model to close the full “energy–economy” loop. Finally, GEM-E3-ISL integrates the energy system results for each scenario from the E3-ISL model and simulates the effects of changed energy projections on GDP, sectoral production, trade, and employment. The energy system results are integrated into GEM-E3-ISL based on the synchronization of different sets of energy-related variables. This process is implemented until the two models converge to a common solution, which is usually obtained with 2–3 iterations.
3.7. Data Used for Mayotte
A key prerequisite for the robust modelling of an energy–economy system in the medium- and long-term horizon is the accurate and inclusive data. In the MAESHA project, the data collection has been a collaborative process, with multiple partners (both local and international) included in order to identify, collect, review and categorize the various data in a structured way. Data mainly on the power sector of Mayotte were collected as these were available only through the Electricite De Mayotte (EDM), which (is a public-private company that is responsible for the production, distribution, and supply of electricity on the territory of Mayotte. EDM was the main provider of data regarding the power sector of Mayotte and the local intermediary for the provision of other relevant data (e.g., oil consumption from SIGMA-TOTAL, economic accounts from INSEE) as well as the provider and translator of the local reports. Data regarding the demand-side factors have been collected, mostly from local official reports as well as local fuel suppliers.
After the process of data gathering, comprehensive excel-based templates were developed. These included socio-economic factors (including GDP, sectoral production, labor market data) and demand-side energy data for buildings, industries and transport sectors, all necessary supply side data (with a focus on power generation mix and electricity-producing technologies) and fuel prices. In addition, a Word document served as a technical guide for filling in the aforementioned Excel-based templates and included a questionnaire on possible new energy projects and existing energy, transport and climate policies in Mayotte, requirements for high-resolution electricity generation data by plant (15 min resolution) to be used for short-term modelling, and a request for historical weather data, local and school holidays required for load profile modelling.
All data sources used for the population of the data templates and the modelling tools were obtained from official local and national sources as well as local stakeholders, apart from the historical weather data and weather forecasts, which were derived from Meteomatics [
62]. Useful information and data have been gathered from official local technical and economic reports as well as relevant policy documents. The main data sources for Mayotte were EDM, The National Institute of Statistics and Economic Studies (INSEE) [
63], The SOciété MAhoraise de GAZ (SOMAGAZ) [
64], Total Energies Mayotte and SMSPP (Société Mahoraise de Stockage de Produits Pétroliers), The Institut d’émission des départements d’outre-mer (IEDOM) [
65], and The Commission de régulation de l’énergie (CRE) [
66].
Although the data collection process was efficient, in some cases the collected data were not in sufficient detail (e.g., in case of emissions by major sector, etc.) and the granularity was low (e.g., in terms of split of fuel consumption by sector of activity, etc.). There were no data available for some categories, including final energy consumption by sector, industrial production by sector, transport activity data by mode, time series of heating degree days (HDDs) and cooling degree days (CDDs), and hourly electricity load profiles by type of consumer. Assumptions based on expert’s experience, common sense and information from countries or regions with similar characteristics of their energy–economy systems, have been used to address these gaps in the model development. To overcome the reliance on one dataset we used variable sources in a coherent manner, with the one process directly informing the other (e.g., if data were not available for a specific industrial sector in Mayotte and EDM informs researchers that there is no relevant industrial activity in the island, then this subsector is omitted from E3-ISL). The energy database for Mayotte was consolidated and structured into one Excel file, including energetic and economic data, as well as a library containing the most recent policy and technical documents on the energy sector in Mayotte. Each sheet of the Excel-based file corresponds to data of different categories and is structured in a time series in order to be directly usable by the island-scale modelling tools. Then, these data are inserted into the E3-ISL model by populating the relevant input files and calibrating the model to reproduce the energy reality in Mayotte for 2015 and 2020, capturing the island’s specificities.
4. Indicative Results for a Baseline Scenario
The baseline scenario projects the way that macroeconomic, technological, policy-related, and market trends will shape the development of the energy and transport systems and the associated CO2 emissions in Mayotte until 2050. It assumes that no new, additional energy and climate policies will be implemented in Mayotte apart from those already in legislation. The baseline scenario reflects the extension of current trends of the energy and economic system, integrating a set of exogenous framework conditions, including socio-economic development, international fuel prices and technology costs. This scenario serves as a reference from which alternative scenarios can be developed and assessed.
4.1. Exogenous Drivers and Energy Demand
A series of assumptions regarding the evolution of the main drivers for the energy–economy development of the island up to 2050 were provided as exogenous inputs to the E3-ISL energy–economy modelling tool. The main exogenous drivers were considered to be: (i) macroeconomic drivers, namely population, GDP, and sectoral value added; (ii) technology costs for energy-related technologies; (iii) international fuel prices (e.g., for oil products); (iv) energy, economic and climate policies (e.g., carbon price); (v) renewable energy (RE) potentials.
The medium- and long-term population projections derive from the population trajectory of Mayotte according to the medium-variant scenario of the “United Nations (UN) World Population Prospects: The 2019 Revision” [
67]. In recent years, the population of Mayotte has increased at an average annual growth rate of 3.77% based on INSEE statistics [
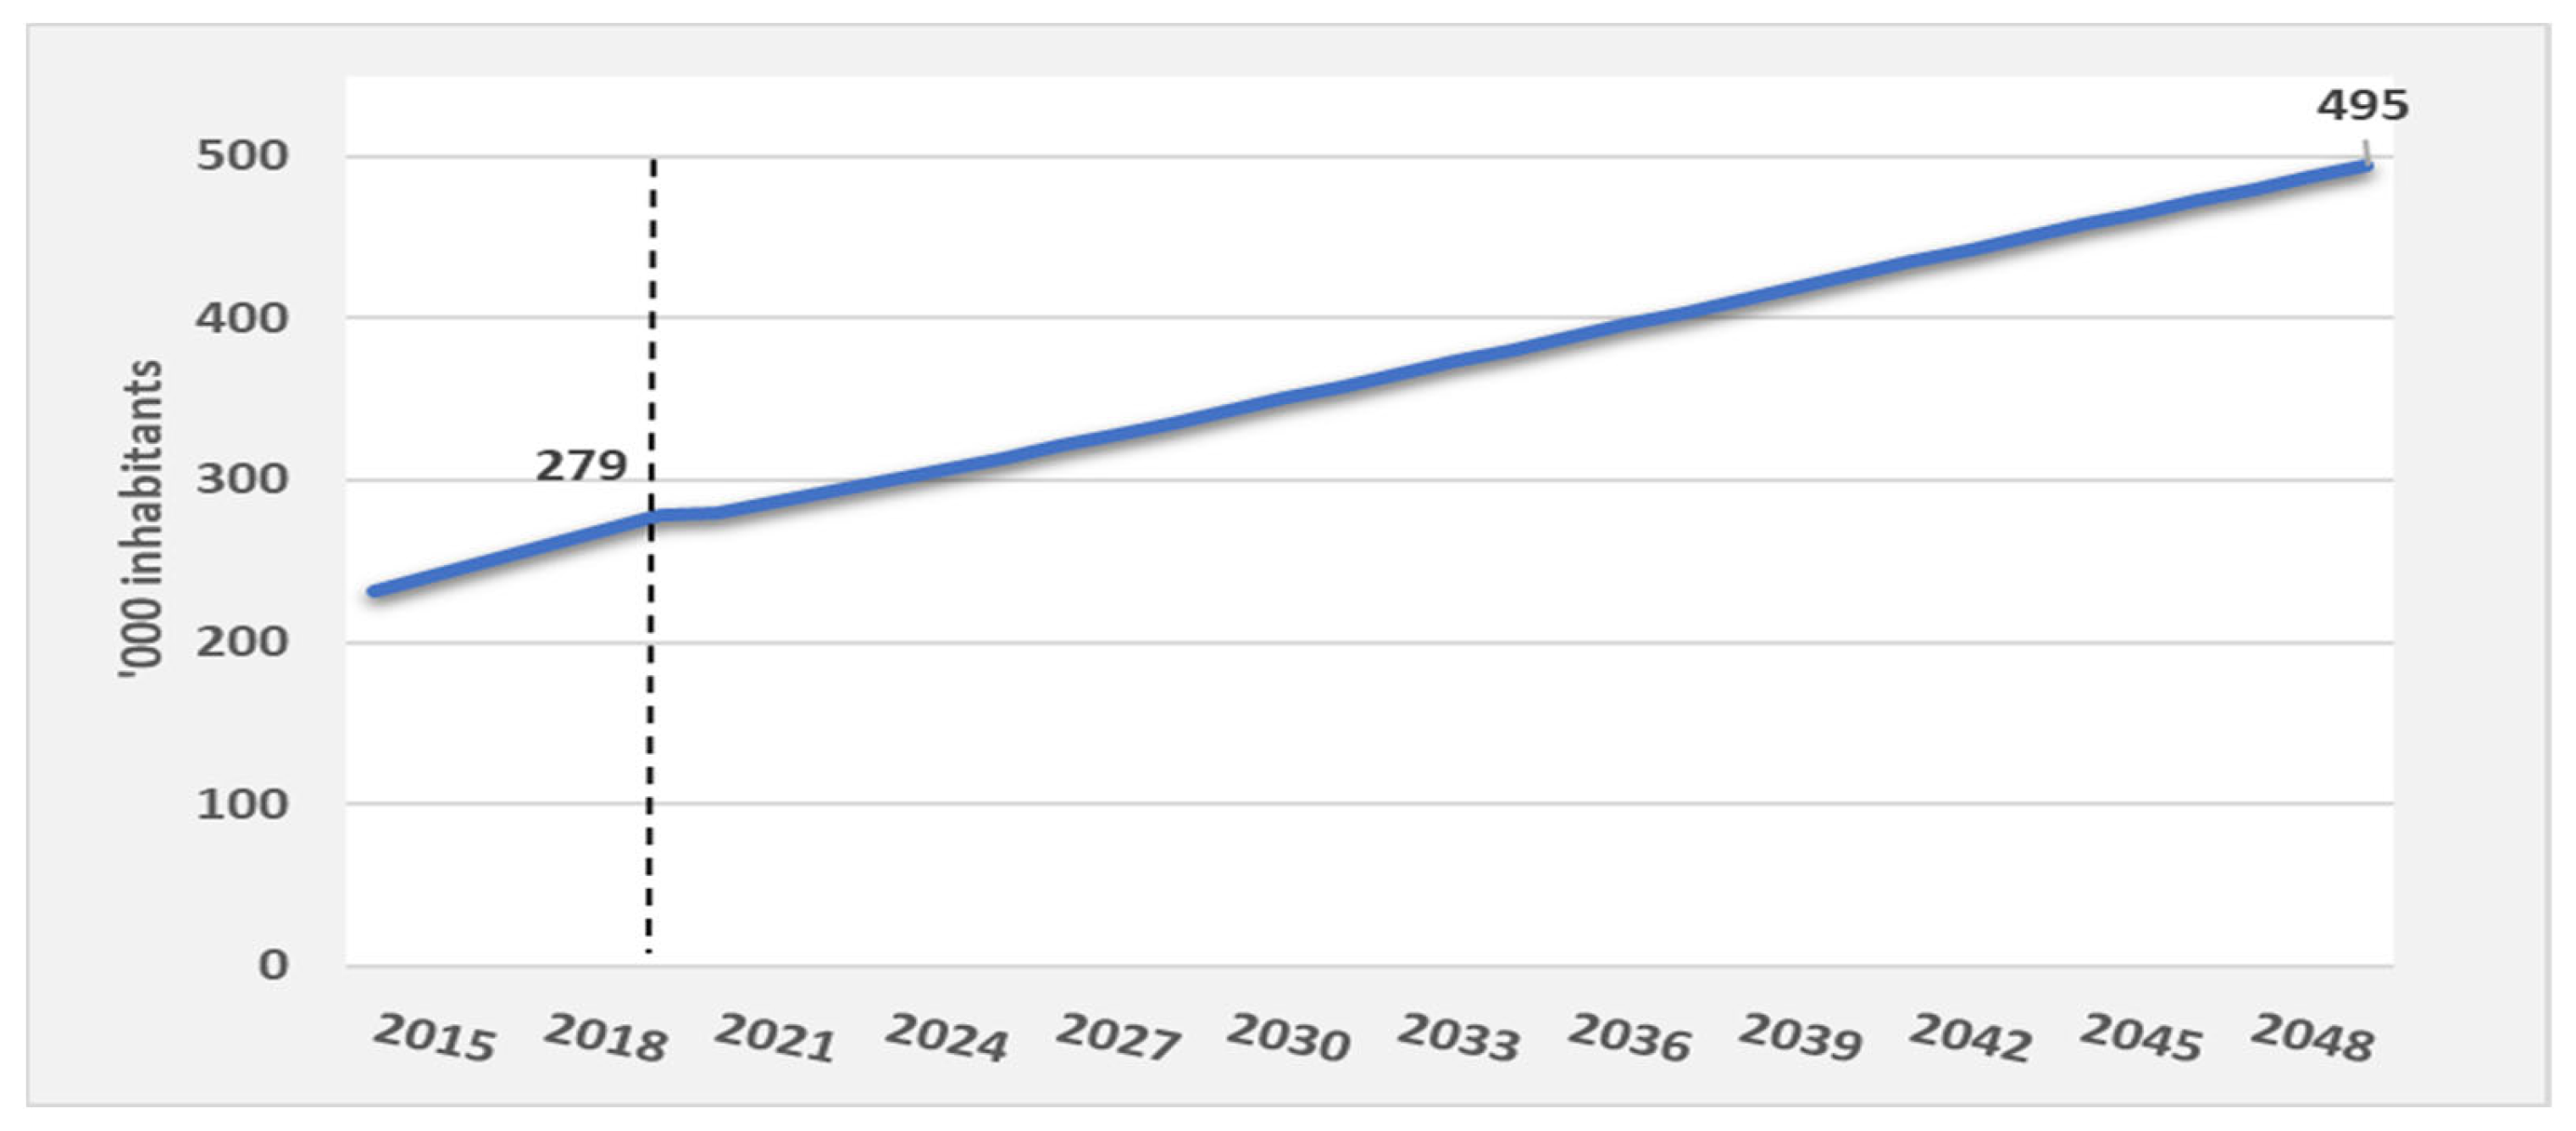
63]. The UN Population Prospects project that this growth rate will gradually slow down to 2.1% by 2035 and further to 1.75% by 2050, in line with trends observed in European and African countries. In the MAESHA baseline scenario, the population of Mayotte is expected to increase from about 279,000 in 2020 to 495,000 in 2050 (
Figure 6).
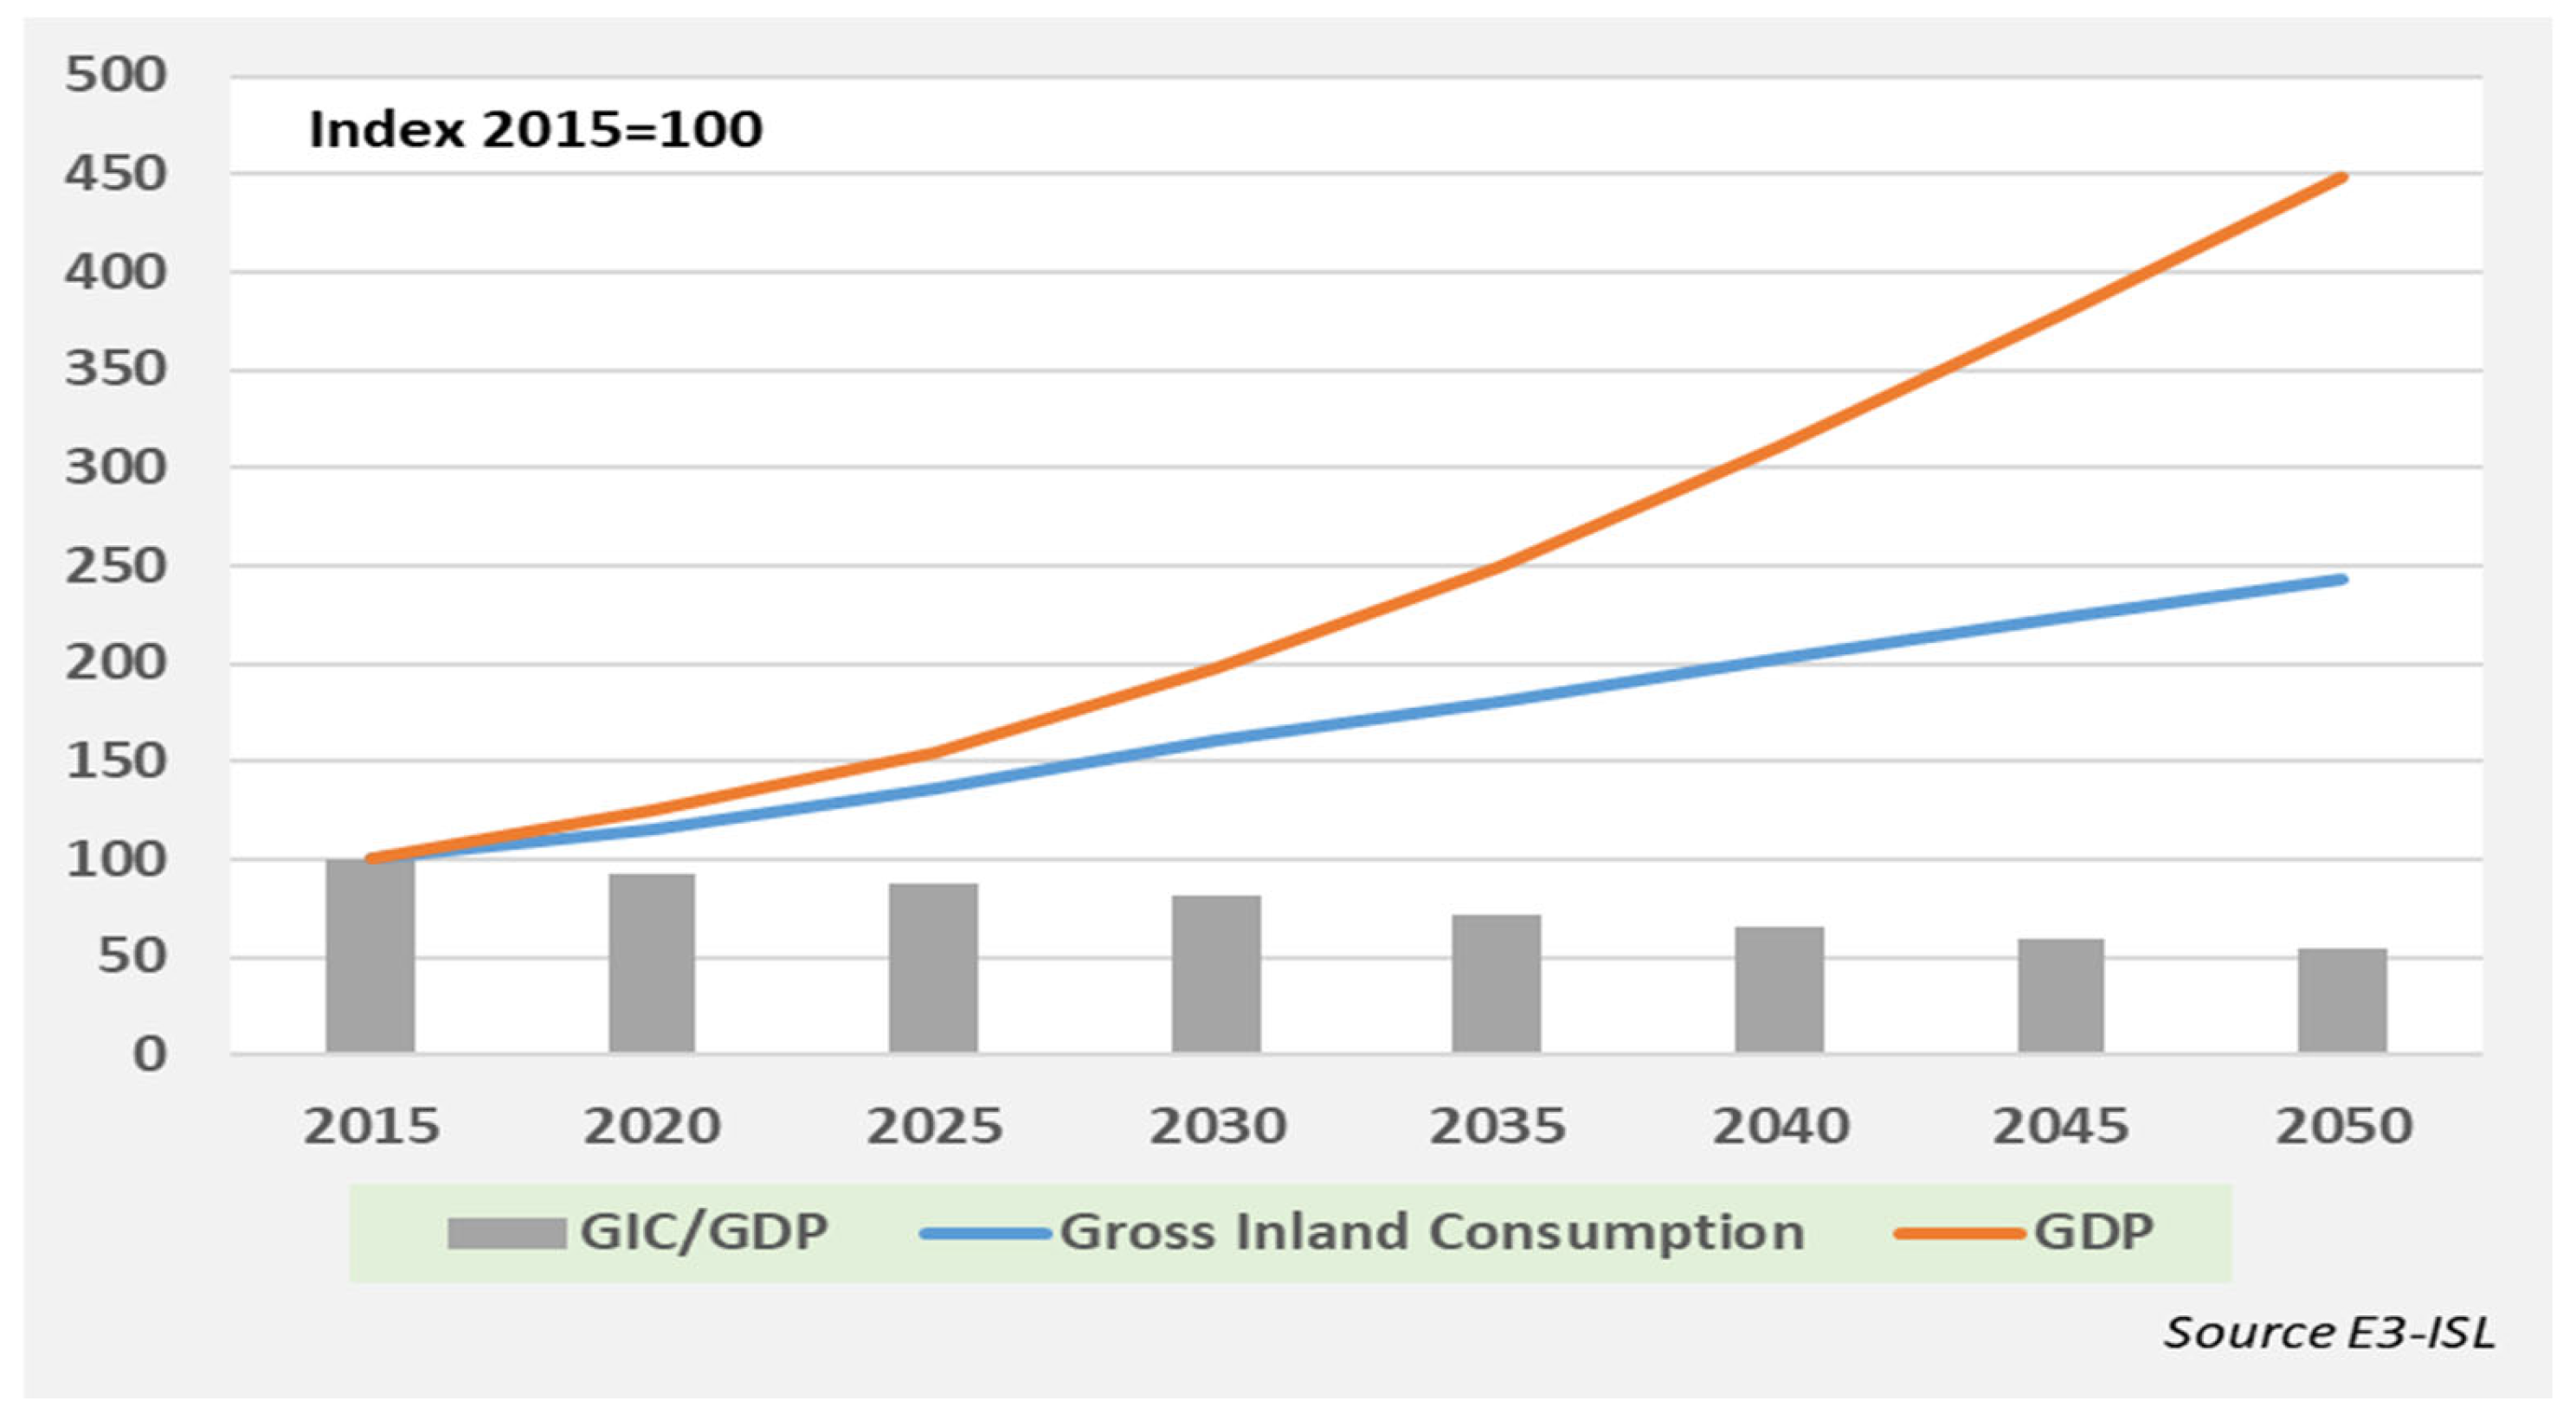
The baseline scenario projects that during the period 2020–2050, the GDP of Mayotte will grow by 259% (
Figure 7), accompanied by an increase in energy consumption. The real GDP of Mayotte has shown a rapid increasing trend in the period 2015–2019, with an average annual growth rate of 5.3% based on data from INSEE (
https://www.insee.fr/en/statistiques/serie/010751764, accessed on 12 December 2022.) and EUROSTAT (Regional economic accounts, at:
https://ec.europa.eu/eurostat/web/national-accounts/data/main-tables, accessed on 10 December 2022.). This momentum was halted in 2020 due to the COVID-19 repercussions for Mayotte’s economy, with this year presenting a growth of 1.72% compared to 2019 according to recent EUROSTAT data.
In the baseline scenario, energy intensity is projected to decline by 1.8% per year in the same period, shows that the energy consumption will be gradually decoupled from the GDP growth. This is triggered by the promotion of energy efficiency across sectors through various measures, most importantly the increased adoption of more efficient technologies, equipment, appliances and vehicles and the transition towards more efficient energy forms (for example, the use of renewable energy instead of diesel in power generation or of electricity instead of petroleum products in transport).
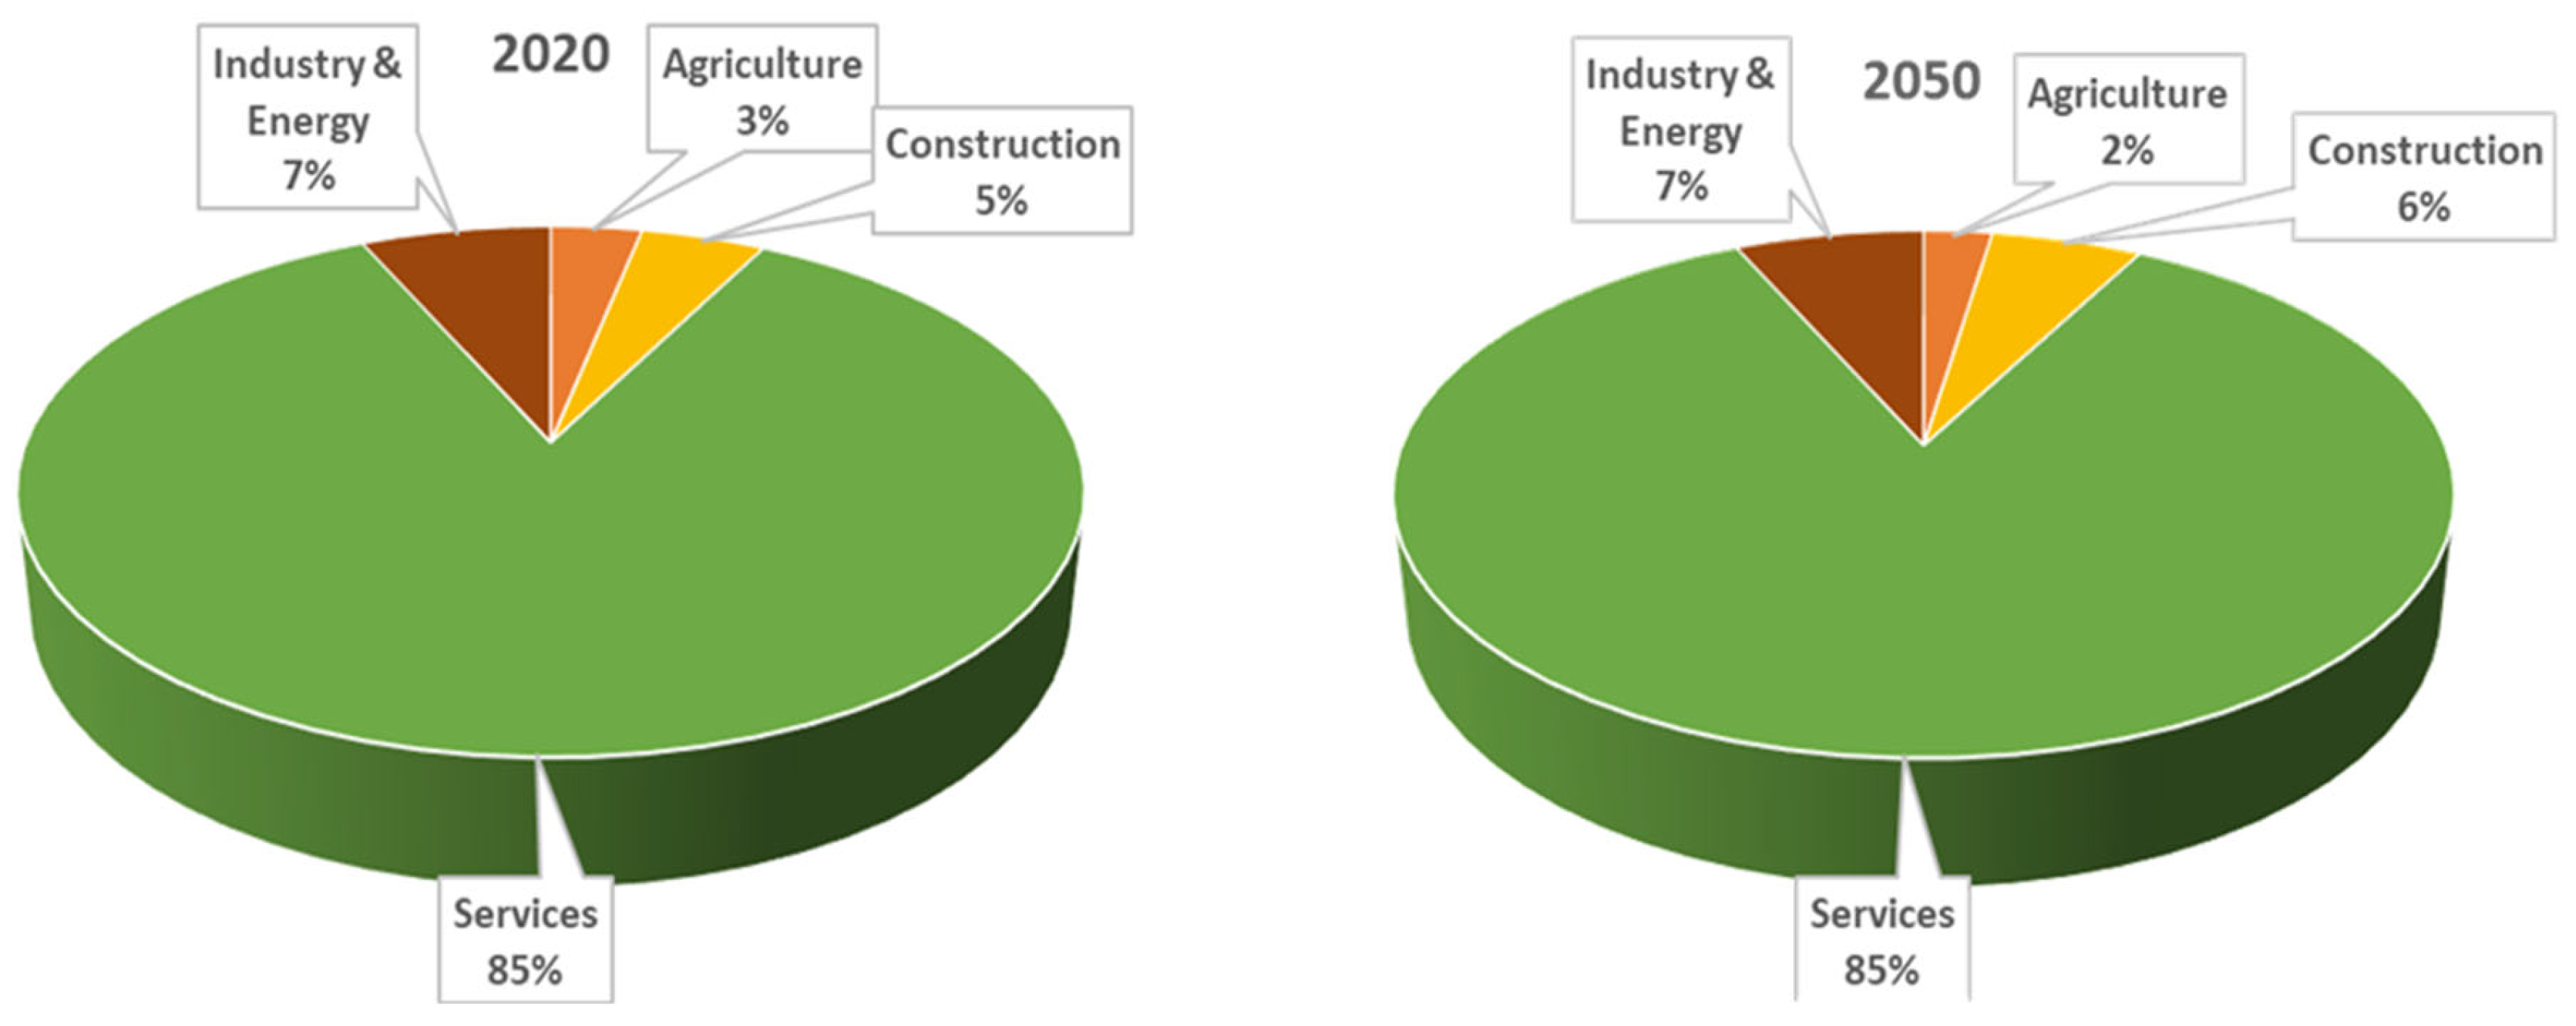
The contribution of each sector to the overall economy of Mayotte for 2020 is shown in
Figure 8 and is derived from Eurostat statistics [
68]. The major contributor to this is the services sector (85%) followed by industry and energy (7% jointly), while agriculture and construction sectors represent 3.5% and 4.5% of island’s economic activity, respectively. Non-market services account for the major share of the services sector (63.6%).
The energy and climate policies that exist currently on the island of Mayotte are those related to the policy framework of the EU and France (including those adopted as part of its National Energy and Climate Plan). In the baseline scenario, the EU-wide energy, climate, and transport policies that have recently been legislated are assumed to be implemented in Mayotte, albeit with some delay due to the island’s specificities and implementation barriers (e.g., lack of energy interconnections, electricity access, lower GDP per capita than EU). Regarding the free allocation of emission allowances, E3-ISL allows the user to denote the proportion of CO2 emissions from a sector or activity that is not included in the ETS (Mayotte, as part of the EU, participates in the EU-ETS).
As the E3-ISL model is price-driven, the assumptions on fuel price trajectories as well as the technology costs play a key role in the scenario analysis. The trajectories of the international fossil fuel prices are derived from the “EU Reference Scenario 2020, Energy, transport and GHG emissions—Trends to 2050” [
69] and the Global Energy and Climate Outlook [
70] JRC report. The recent increase in oil and gas prices, a trend it is assumed will continue in the mid-term, was also considered. The price of imported crude oil affects the domestic prices of the various petroleum products used in Mayotte (e.g., diesel, gasoline, LPG). The E3-ISL energy–economy model includes a large variety of technology options, both in the sectors of energy demand and energy supply. The technology cost estimates are provided by the most recent and official source available, i.e., the European Commission, in its assessments for Fit-for-55 package [
71] as well as the ASSET study–technology pathways in decarbonization scenarios [
72].
4.2. Power System and Emission Developments in Mayotte
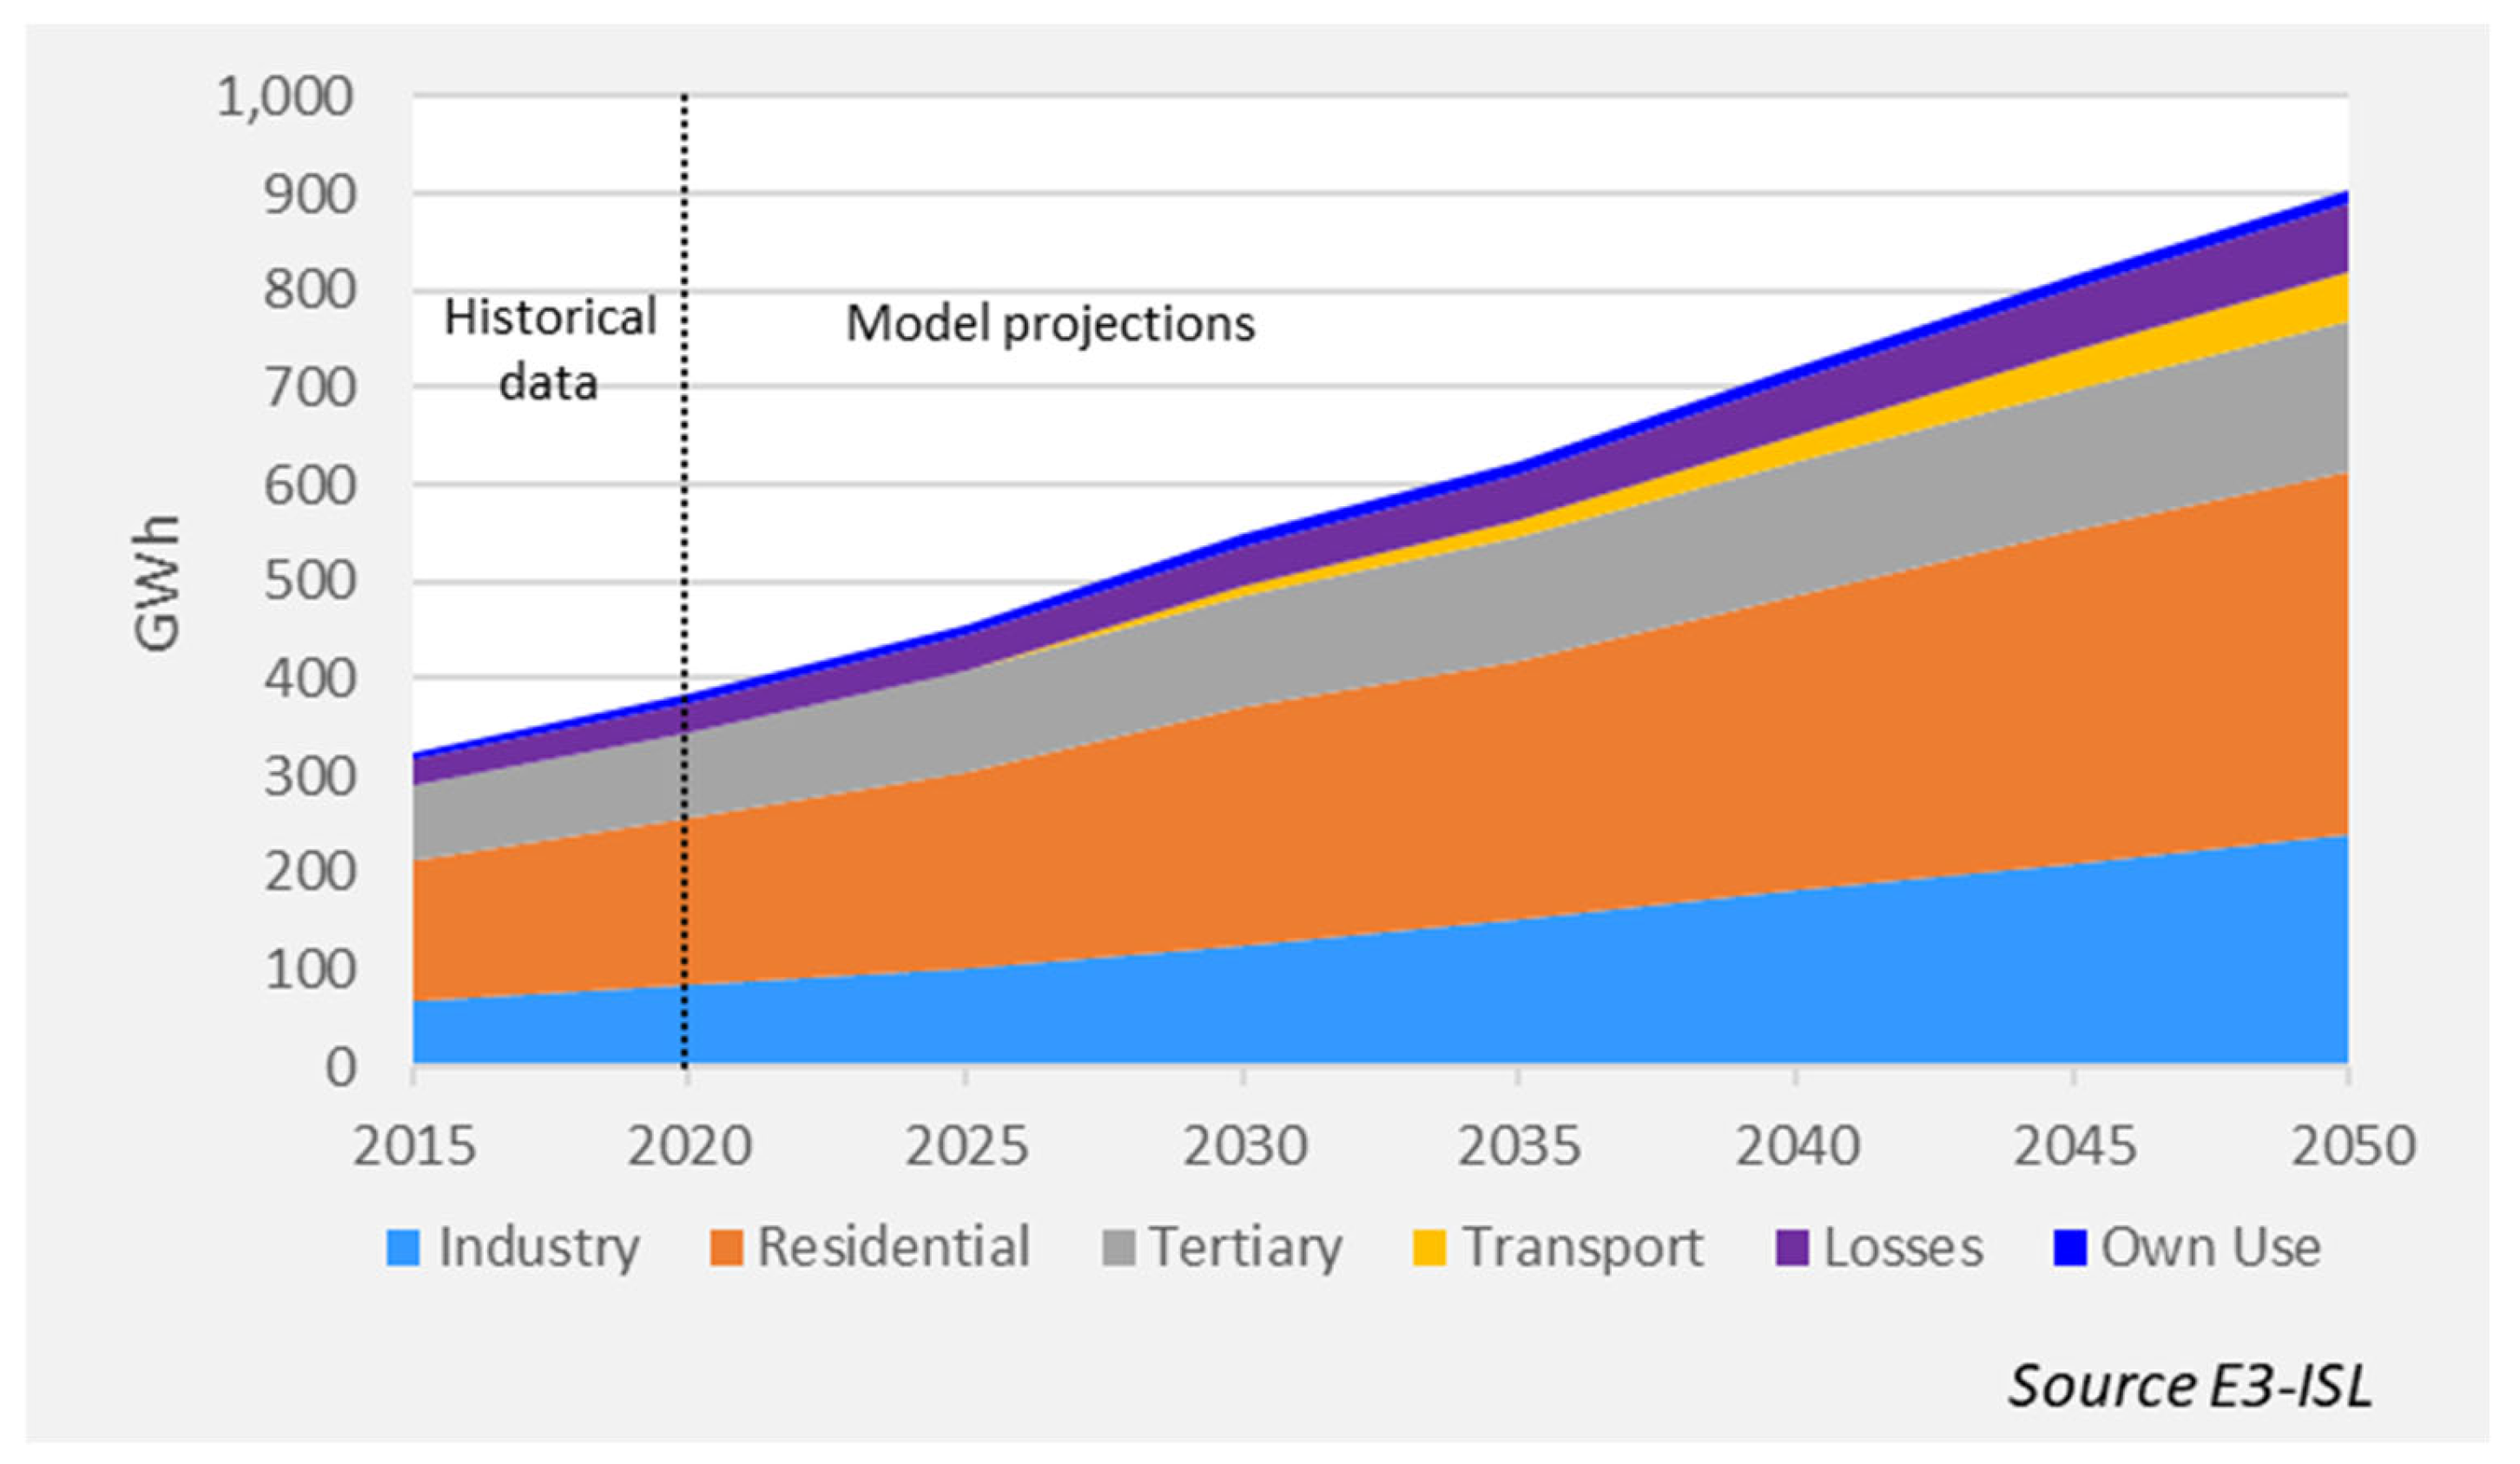
In the baseline scenario, electricity consumption (
Figure 9) is projected to increase by 134% between 2020–2050 in Mayotte with an annual growth rate of 2.9%. This will be driven by high economic growth, increasing standards of living, higher electricity access and EV market uptake. The industrial and buildings sectors are projected to account for about 90% of total electricity needs by 2050. The grid losses sustain their share in the gross electricity demand and, as the utilization rate of thermal ICE plants increases, the self-consumption of these plants increases at the same rate.
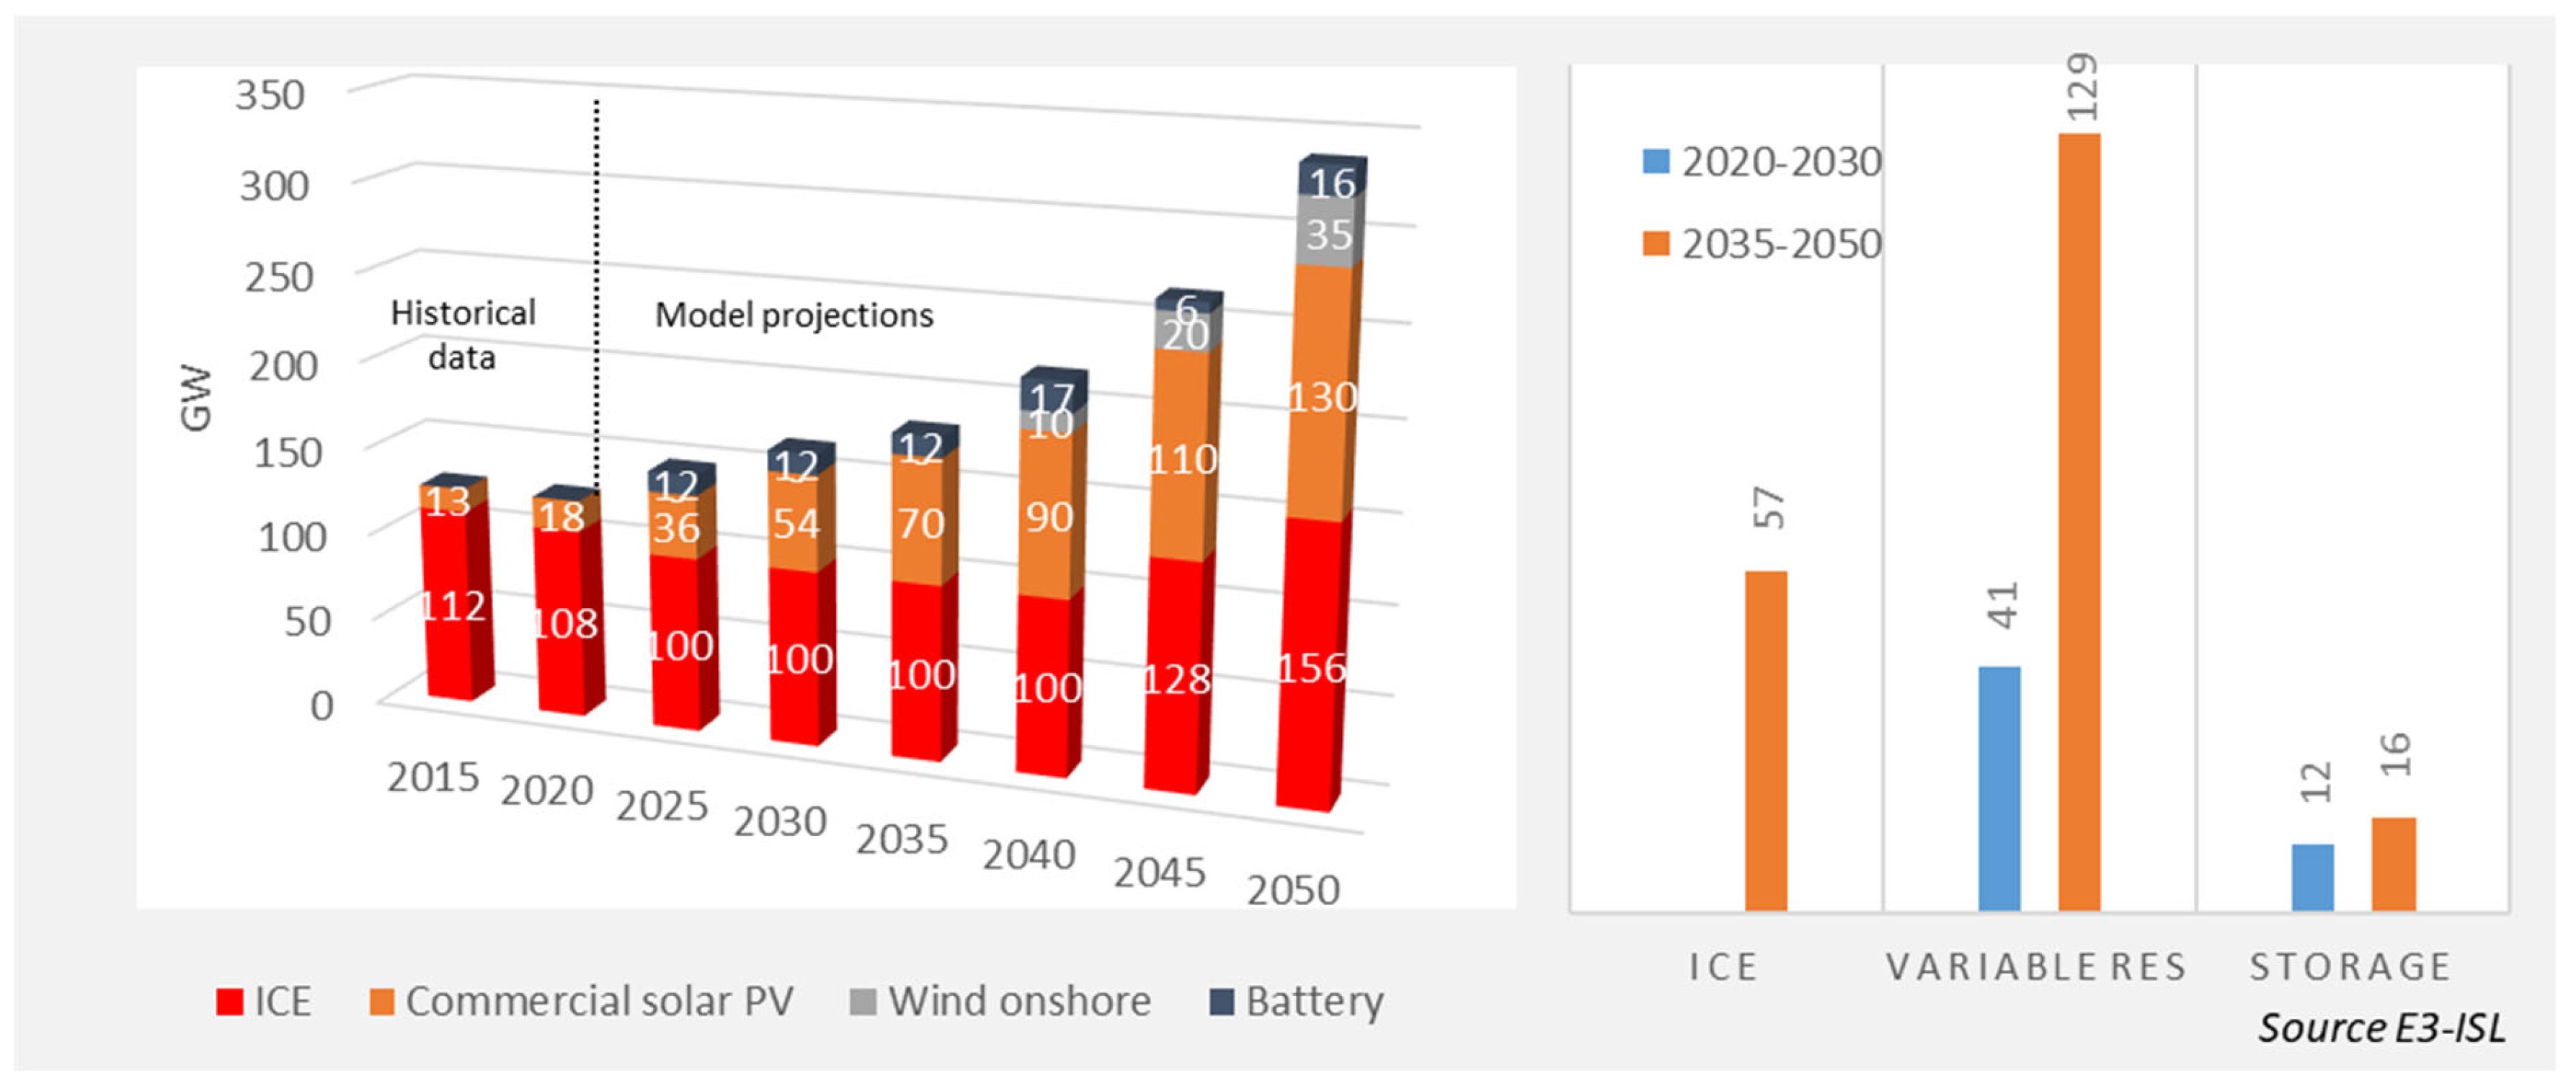
At the same time, the expenditure–competitiveness of solar and wind power improves due to technological progress, leading to their enhanced deployment in Mayotte. The share of renewable energy is projected to grow gradually, driven by the increasing EU-ETS carbon price and the cost reduction of PV and wind technologies through learning-by-doing. By 2050, almost one third of island’s power generation is projected to come from solar PV (23%) and wind (9%). Batteries complement the power mix, albeit to a limited extent, to balance the intermittency of variable RES. The existing thermal plant capacities in Mayotte are currently underutilized. It is assumed that this will change in the future. The capacity of the thermal diesel-fired plants will remain constant by 2040 and the surging electricity demand will be adequately served by the remained thermal diesel-fired plants as well as the new RES capacities. From 2041 onwards, new investments into diesel plants are required, accounting for 57 MW (
Figure 10).
The baseline scenario reflects only the current climate policy settings without additional actions. Over the period 2020–2050, the energy and carbon intensity of Mayotte’s economy is projected to decline by 42% and 48%, respectively. Mayotte currently imports almost all its energy requirements, with a dependency ratio of 98% in 2020. In the baseline scenario, the import dependence is projected to decline gradually to 96% in 2030 and further to 90% in 2050, mainly driven by the decreasing share of imported fossil fuels (oil products), the parallel modest increase in electrification in end-use sectors, as well as the emergence of RES power investments. Hence, Mayotte is projected to rely less on imported liquids and more on domestic renewable energy resources by 2050.
The overall RES dividend of energy consumption in Mayotte is projected to grow from 2% in 2015 to 14% in 2050, stimulated by the wider use of solar PV installations and the introduction of wind power into the electricity supply, as well as the increasing use of solar thermal water heaters in buildings. The increasing energy requirements and the continued dominance of fossil fuels will contribute to increasing CO
2 emissions until 2050. Electricity production (
Figure 11) is projected to remain the highest carbon emitting sector in the island, but its share in CO
2 emissions is projected to decline from 58% in 2015 to 54% in 2050 due to the commissioning of new RES capacities. The emissions of transport are growing, driven by the large increases in passenger and freight transport activity and the limited uptake of low-carbon vehicles across all transport areas (except for private cars). The emissions of the other sectors are very low compared to power supply and transport, since electricity—which does not emit CO
2 at the point of end-use—is the dominant energy carrier used for providing energy services to the residential, tertiary, and manufacturing sectors.
5. Discussion
Islands are vulnerable to climate change threats. Their remoteness, lack of interconnections with the mainland and limited primary energy resources leave them dependent on imported fossil fuels from the mainland. Islands often have access to rich renewable energy resources (especially solar and wind) which should be exploited to ensure cost-efficient and feasible clean energy transition tailored to specific islands’ characteristics.
Energy system models for non-interconnected islands have already provided useful insights into potential transition strategies, focusing specifically on the electricity sector and on specific energy and climate–economic questions rather than designing a holistic sustainable future (
Appendix A). Much research [
73,
74,
75,
76,
77,
78,
79] focuses on systems that rely totally on renewable energy technologies to support the island’s long-term decarbonization goals. The dynamics of the decarbonization process are often simplified in energy models, preventing them from capturing real-world specificities; for example, models do not capture in-depth the consumer decisions and interactions with long-term transition dynamics [
14]. As decarbonization involves a complete restructuring of the entire economy and the energy system, both in the demand and supply sides, modelling tools should capture the demand and supply interlinkages and integrate socio-economic considerations to support decision-making and investment strategies in islands.
Most of the models applied in non-interconnected islands do not consider future energy technologies such as offshore expansion or tidal energy, heat pumps, electrolyzers, CO2 direct air capture, and proceedings for fuels and chemicals and storage technologies or their combination. Furthermore, maritime transport is not represented by most island-focused models, despite being an important sector for an island’s economy and one of the fundamental sources of emissions and pollution in islands. The real-world representation of transmission and distribution grids is also particularly important for island-scale modelling. This includes projections of potential grid bottlenecks in isolated areas, which have not been appropriately captured until now.
Starting a decarbonization transition phase in islands requires a new energy scheduling agenda that can deal with the interferences in electricity supply, along with the variations in electricity voltage and frequency, to meet the end-use demand. This agenda should neither underestimate nor overestimate the installed capacities along with the new infrastructure investments including energy storage systems, installations of variable renewable energy sources (VRES), and investments in grids (new lines, cable, transformers, etc.). Additionally, decarbonization should include the following parts: the coupling of electricity and heat markets; the integration of new clean energy technologies (clean hydrogen, tidal energy, renewable natural gas (RNG), carbon capture and storage (CCS)) and carbon capture infrastructure needs; the insertion of electric vehicles and the relevant infrastructure for charging spots and other related investment challenges to finance the transition. Although the primary aim of decarbonization is the reduction of carbon emissions, co-benefits from efficient and well-designed transition strategies might materialize, e.g., in the form of reduced energy costs, improved energy security, climate resilience, reduced exposure to price fluctuations and the creation of new job opportunities.
Considering a non-interconnected island’s specificities and its differences from the interconnected stable energy grids of mainland, a new approach is needed, as additional specificities should be considered in energy system modelling when applied to the insular level. These may include the seasonal variation in demand due to increased tourist population and the necessity of modelling the accuracy and dynamics of the power grid due to the lack of interconnection with the mainland. Furthermore, non-interconnected islands, as small-scale and vulnerable regions, should develop integrated energy transition scenarios to support their societies and reduce the uncertainty. These scenarios are often a neglected option for long-term energy system models.
The development of a robust energy system modelling tool that can be used for medium- and long-term energy demand and supply projections on an insular level is a necessity nowadays. The tool should represent: (i) the key elements in energy demand by sector; (ii) the key dynamics shaping up future developments in the energy markets; (iii) energy-related and climate policies and their impacts on the development of energy demand and supply and technology uptake by sector; (iv) the simulation of energy system operation; (v) the behavior of the economic agents; (vi) the interlinkages between energy demand, supply and the formation of energy prices, as well as their relations between the energy system, (vii) economy and CO2 emissions and the ability to adapted and tailor these factors to insular-level specificities, especially to the related decarbonization.
The island-scale modelling framework IntE3-ISL represents adequately the complex interlinkages of the energy system with the economy. It covers in detail island-specific issues, as initially applied for Mayotte, such as the already installed fossil-fired power plants, RES potentials, load seasonality, costs of RES and fossil fuels, energy efficiency potential in industries and households, flexibility services both on demand and supply side (i.e., demand response, rooftop solar PV, V2G, batteries, power-to-X), transportation, ancillary services and storage requirements as a result of the deployment of variable RES coupled with load uncertainty and seasonality. The model also has the capacity to simulate the inertia of the consumer’s attitude to the energy-related options and decisions, as well as the gradual change in their behaviors, habits and practices towards cleaner and environmentally friendly choices paving the way for a clean energy transition. The model additionally considers the impact of energy communities in this process. The modelling suite can analyze the impacts of energy transition plans on RES investments, power generation mix, energy security, electricity prices, energy demand by fuel and sector, interlinkages between electricity, transport and industrial systems, investment requirements, emissions, and energy system planning. The model-based quantitative results can be used to develop a comprehensive island-scale energy and economic assessment, considering in detail the impacts of alternative energy system configurations and exploring the challenges, barriers and opportunities arising from the development of RES and other clean energy solutions.
The baseline scenario in the IntE3-ISL model shows how socio-economic drivers, current policies, world fuel prices and technology trends can shape the transformation of the energy and transport systems, energy-related costs, and the associated CO2 emissions in Mayotte. The model offers a detailed outlook on the energy demand by sector and fuel, energy supply, power generation mix, investment, energy prices, costs, and emissions, with each assessment based on the legislation that is already in force. In essence, the baseline scenario is an inwardly consistent and policy-relevant projection of the future state of an island’s energy system, assuming no additional energy and climate policy and legislation is introduced. This scenario explores energy demand and supply trends and sectoral integration and can be used as benchmark to assess the socio-economic and environmental impacts of energy transition, as well as the relevant transformation barriers, challenges and opportunities in all energy demand and supply sectors of islands.
6. Conclusions
Considering the gap in energy system modelling for non-interconnected islands in transition, the limited scope of other available models and methodological approaches, and the specificities of an island’s energy sector, we adapted and soft-linked two well-established energy modelling suites (CompactPRIMES and GEM-E3) into an integrated, island-scale energy–economy model called IntE3-ISL. The advanced modelling tool captures energy demand and supply by sector, as well as their complex interlinkages through energy prices, heating and mobility requirements, energy efficiency and fuel mix by sector, storage, flexibility services and sectoral integration and can also estimate the socio-economic impacts of decarbonization strategies.
The E3-ISL model contributes to the detailed modelling of the energy systems with a distinct representation of both the energy demand side and supply side, guaranteeing the grid reliability in case of increased variable renewable energy penetration. It explores the synergies and linkages between electricity and other energy vectors (e.g., heat, hydrogen, synthetic fuels), analyzing the alternative energy system configurations towards carbon neutrality.
The IntE3-ISL has been initially applied to provide a baseline case and alternative clean energy transition pathways for Mayotte as part of the EU-funded demonstration project MAESHA. The model has been calibrated with 2015–2020 official data for the island. According to the baseline case and based on assumptions regarding the evolution of socio-economic drivers, the model gave an outlook of how the energy system and the economy of Mayotte will evolve until 2050 if following the current trends and practices. This scenario is a reference point upon which the performance of the alternative decarbonization scenarios can be evaluated.
This study can be expanded in various directions that were not fully captured in this paper and could be the basis of future research. First, the Int-E3-ISL modelling tool can be improved with a detailed representation of distribution grids to capture more accurately grid bottlenecks and storage requirements. The representation of additional consumer types can also enhance the accuracy and relevance of model-based projections for future energy system developments. Finally, the model-based projections crucially depend on the assumptions made, especially of the values of specific elasticities, determining the evolution of energy consumption by sector, and of the assumed technology costs for energy technologies. A sensitivity analysis of the values of these elasticities or of technology costs is required to consistently evaluate the impacts of decarbonization.


