


Data-Driven Evolution Analysis and Trend Prediction of Hotspots in Global PPP Research


Abstract
1. Introduction
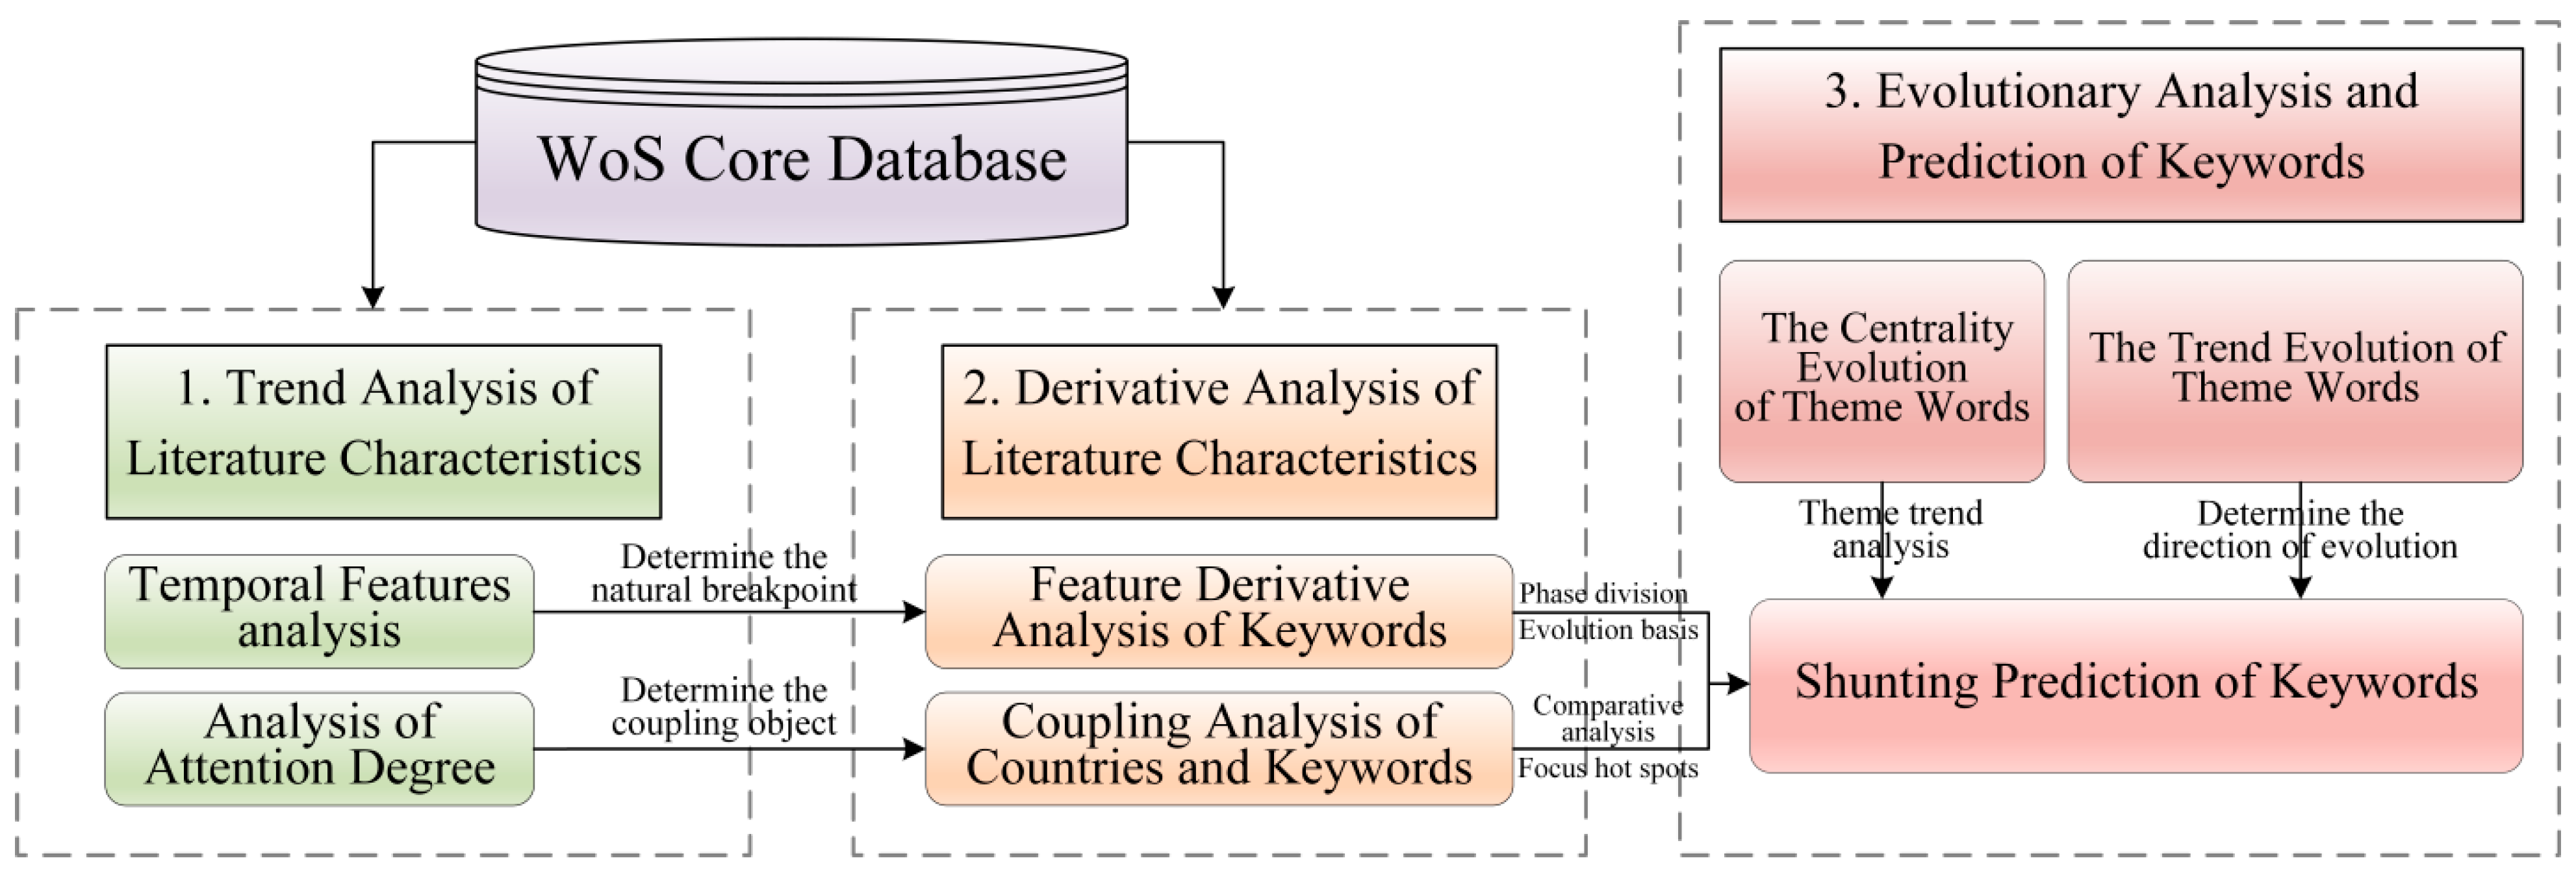
2. Research Design
2.1. Data Processing and Research Methods
2.1.1. Data Processing
2.1.2. Research Method
- (1)
- Natural breakpoint method. Based on the distribution of numerical statistics and the number of pieces of the literature in different periods, this method can set class boundaries on the data values with large differences. K-means, mean shift, KNN, and other clustering methods mainly explore the center of the class. In contrast, the natural breakpoint method mainly explores the class boundary. Therefore, this method is suitable for solving the turning point of the cumulative difference data, especially the value of the cumulative number of pieces of the literature, so as to realize the phase division of the PPP literature from 1989 to 2022 [12,13,14].
- (2)
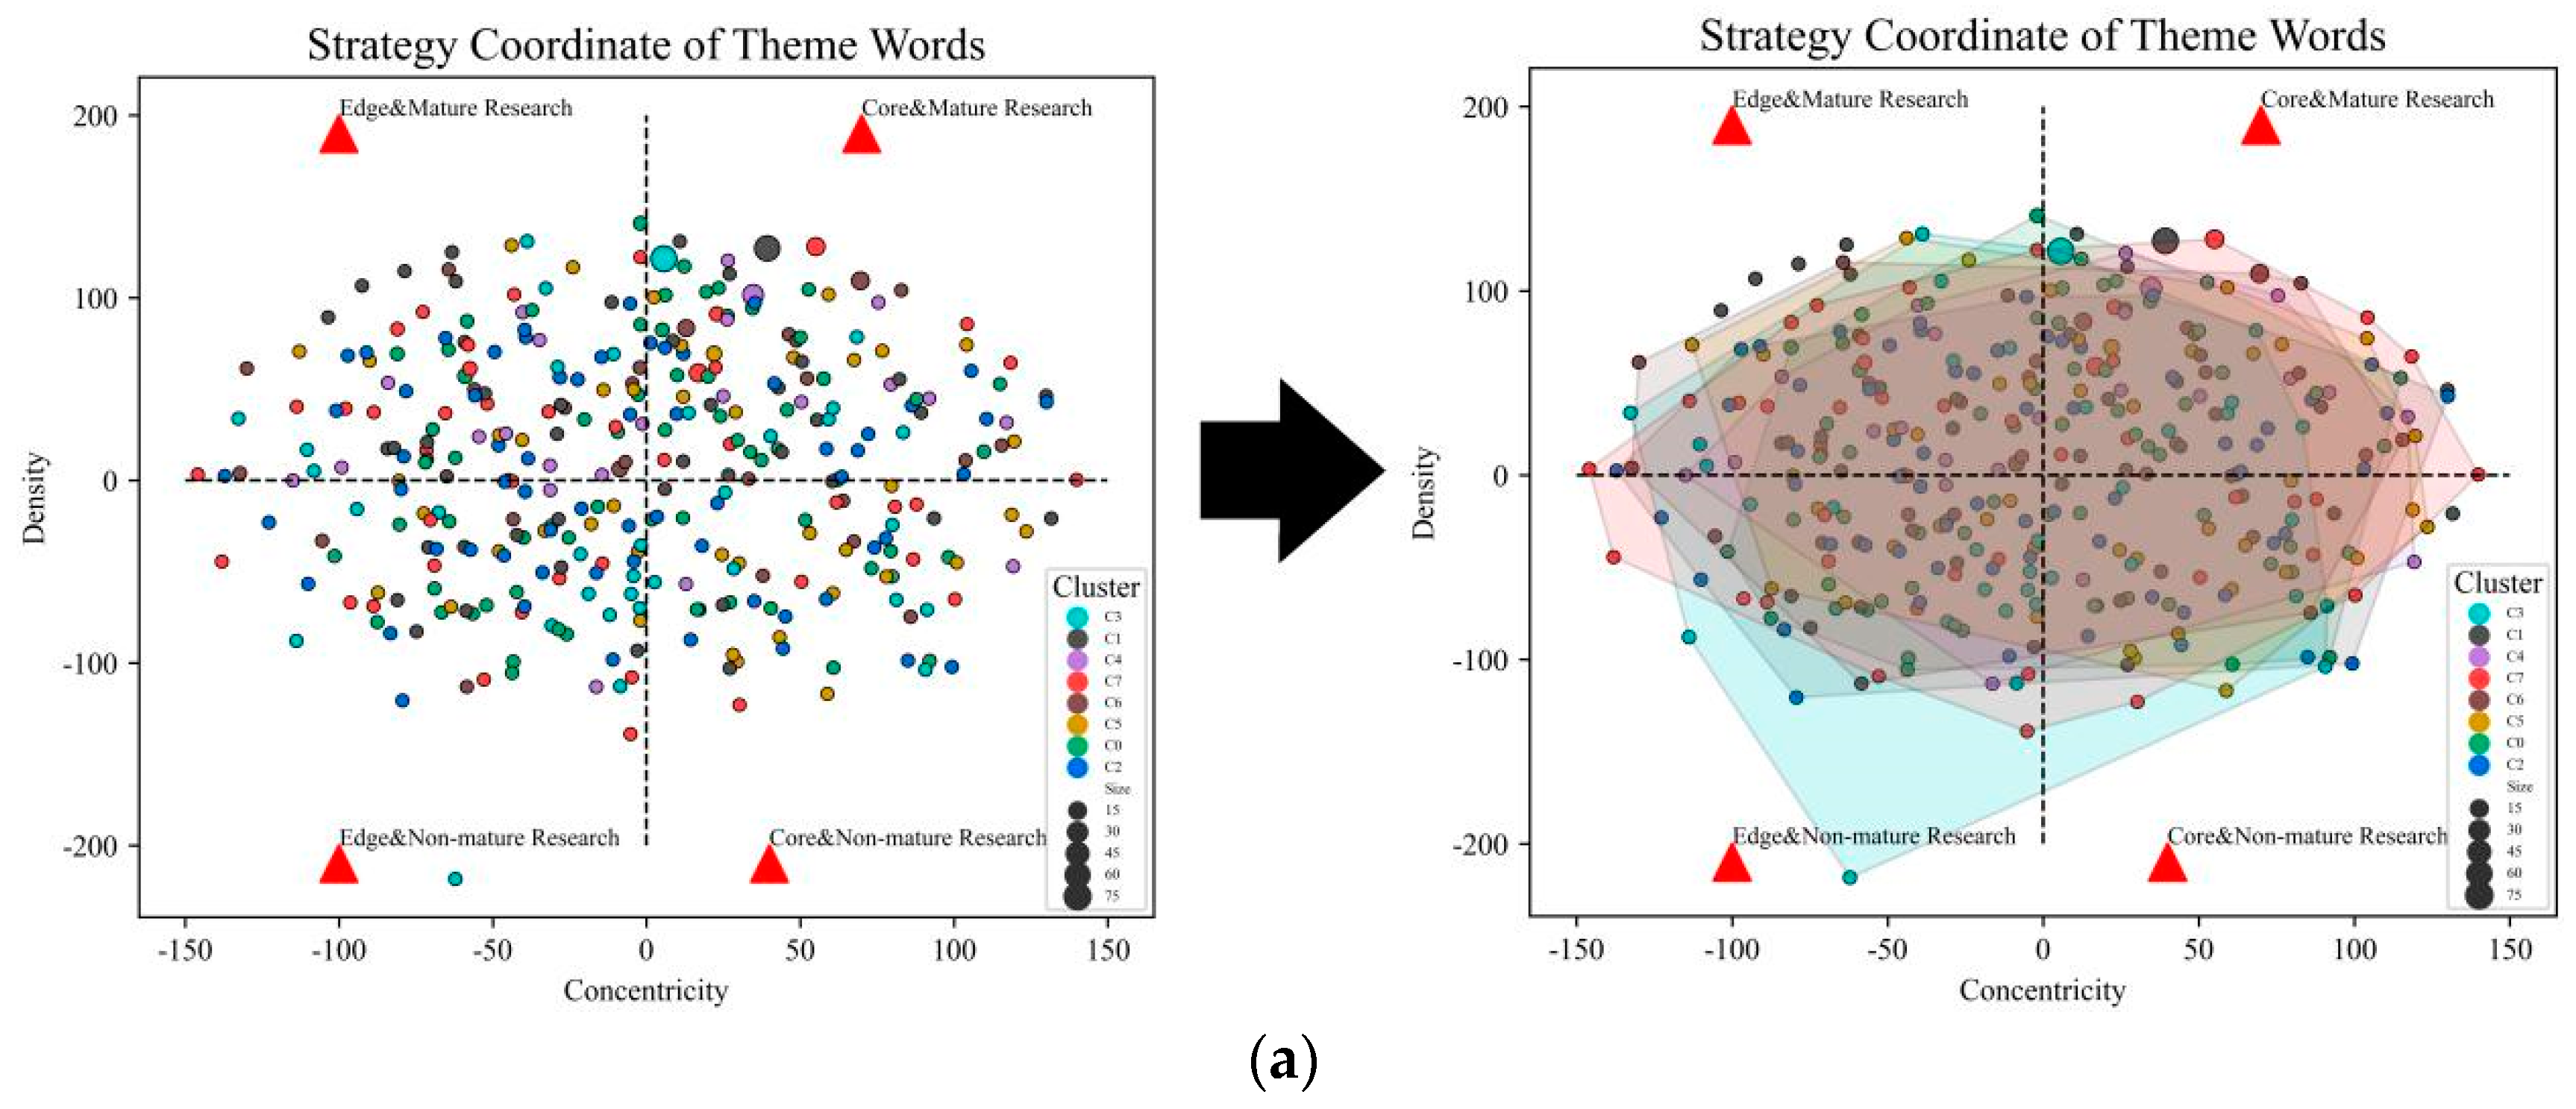
- Co-word analysis. This method can reflect the cascading relationships between objects. Among them, betweenness centrality is the key indicator to measure the importance of nodes in the network [15]. It is generally believed that keywords with betweenness centrality greater than 0.1 occupy a core position in the network [16,17]. This paper used CiteSpace 6.1 R3 to analyze the academic cooperation between countries and determine the intensity of cooperation between countries and the mainstream research countries. Moreover, we also used strategic coordinate analysis to mine the centrality and density of theme words, determining the position of each theme word in the strategic coordinate graph and analyzing the evolution trends [18].
- (3)
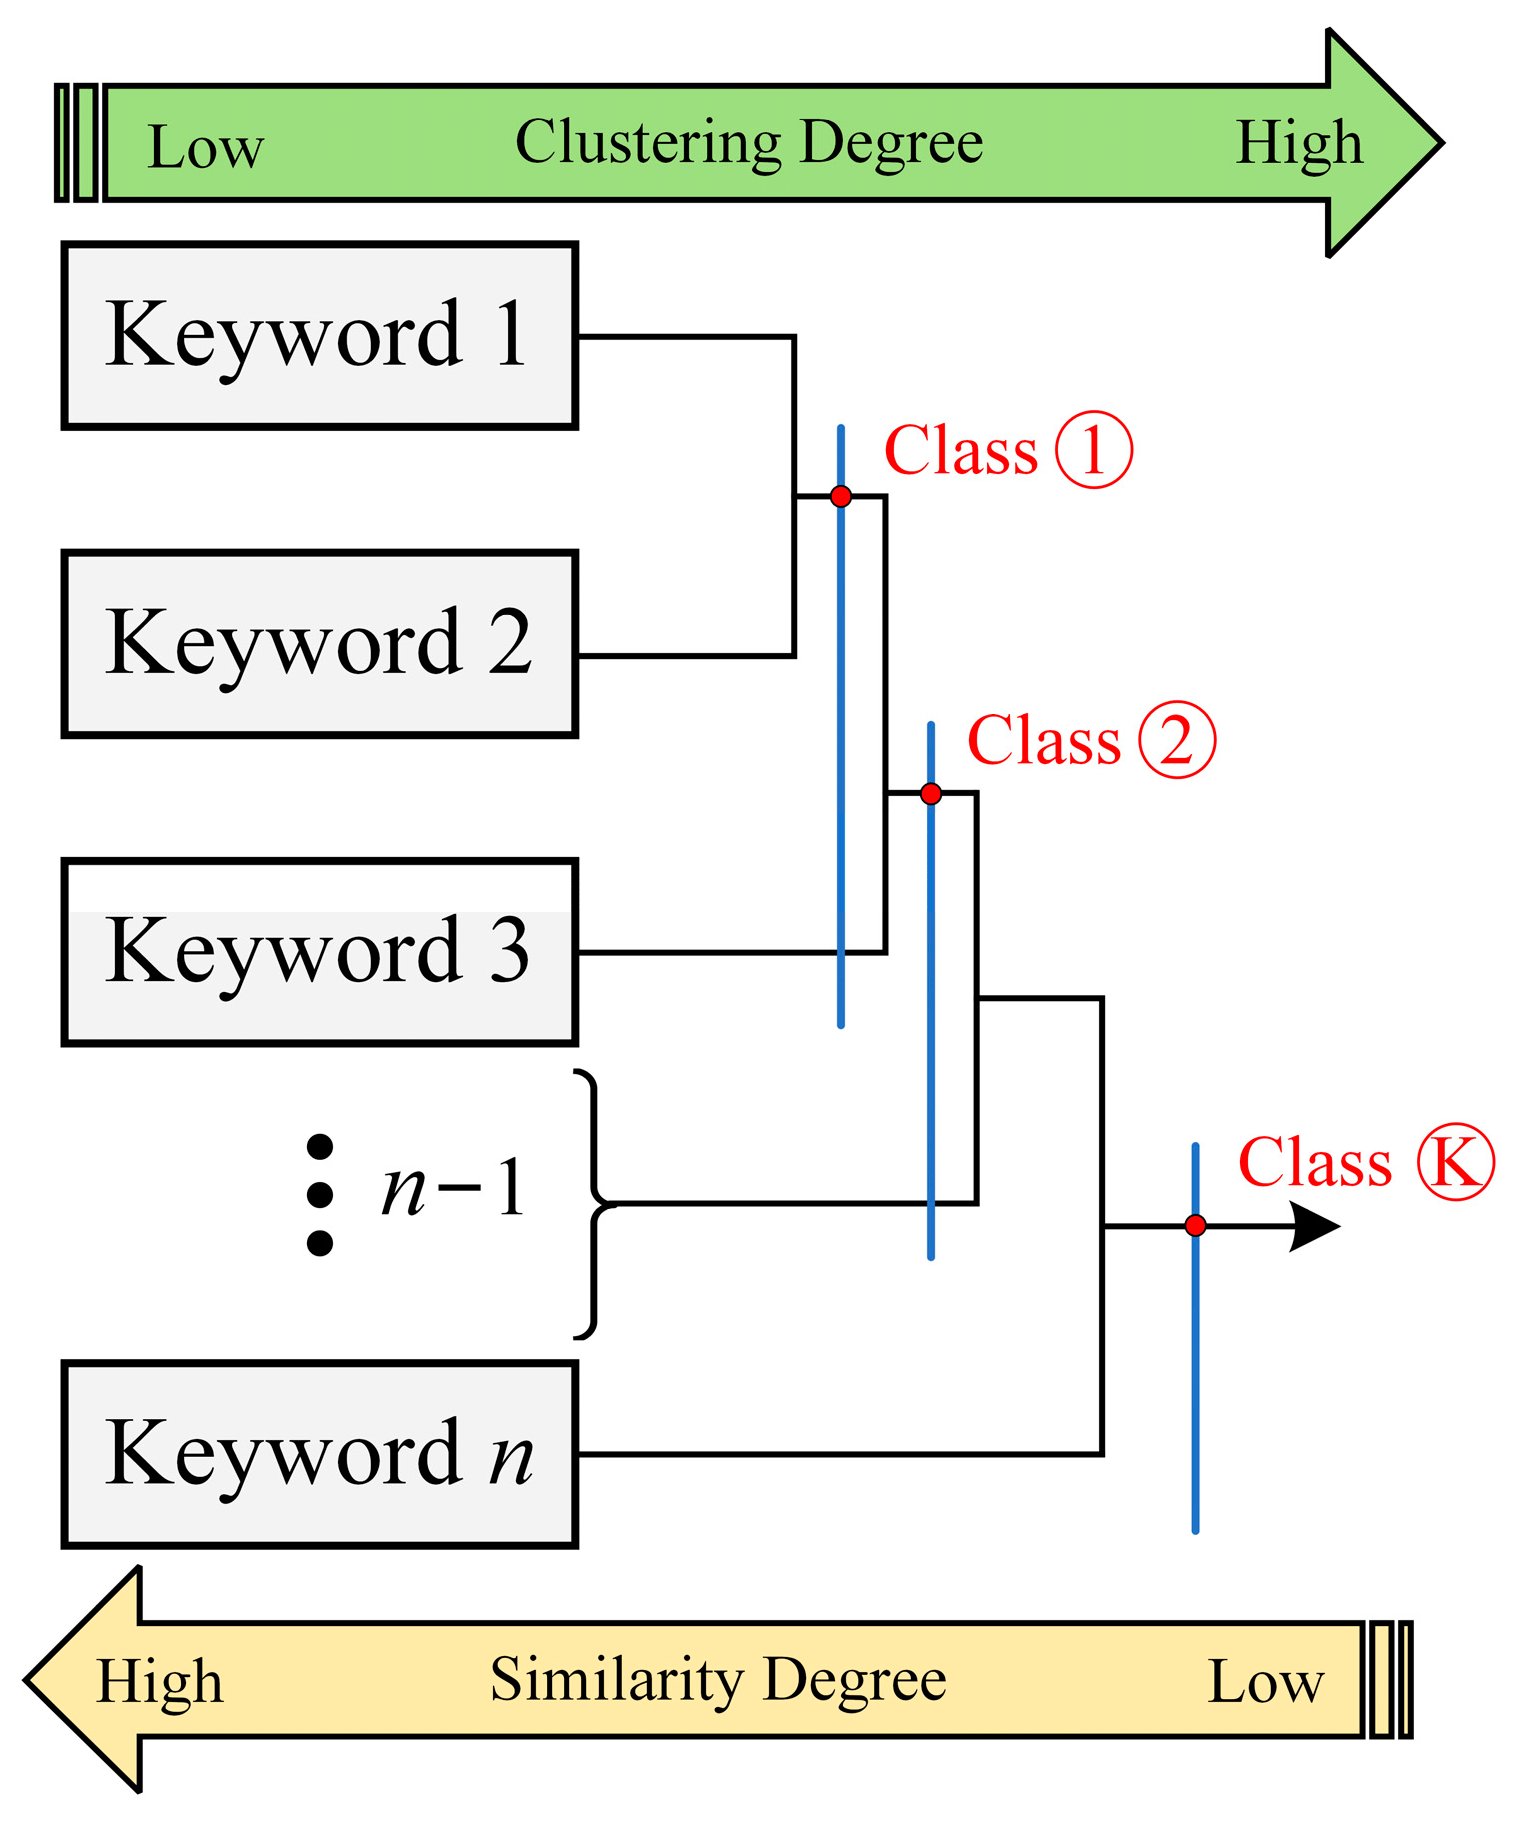
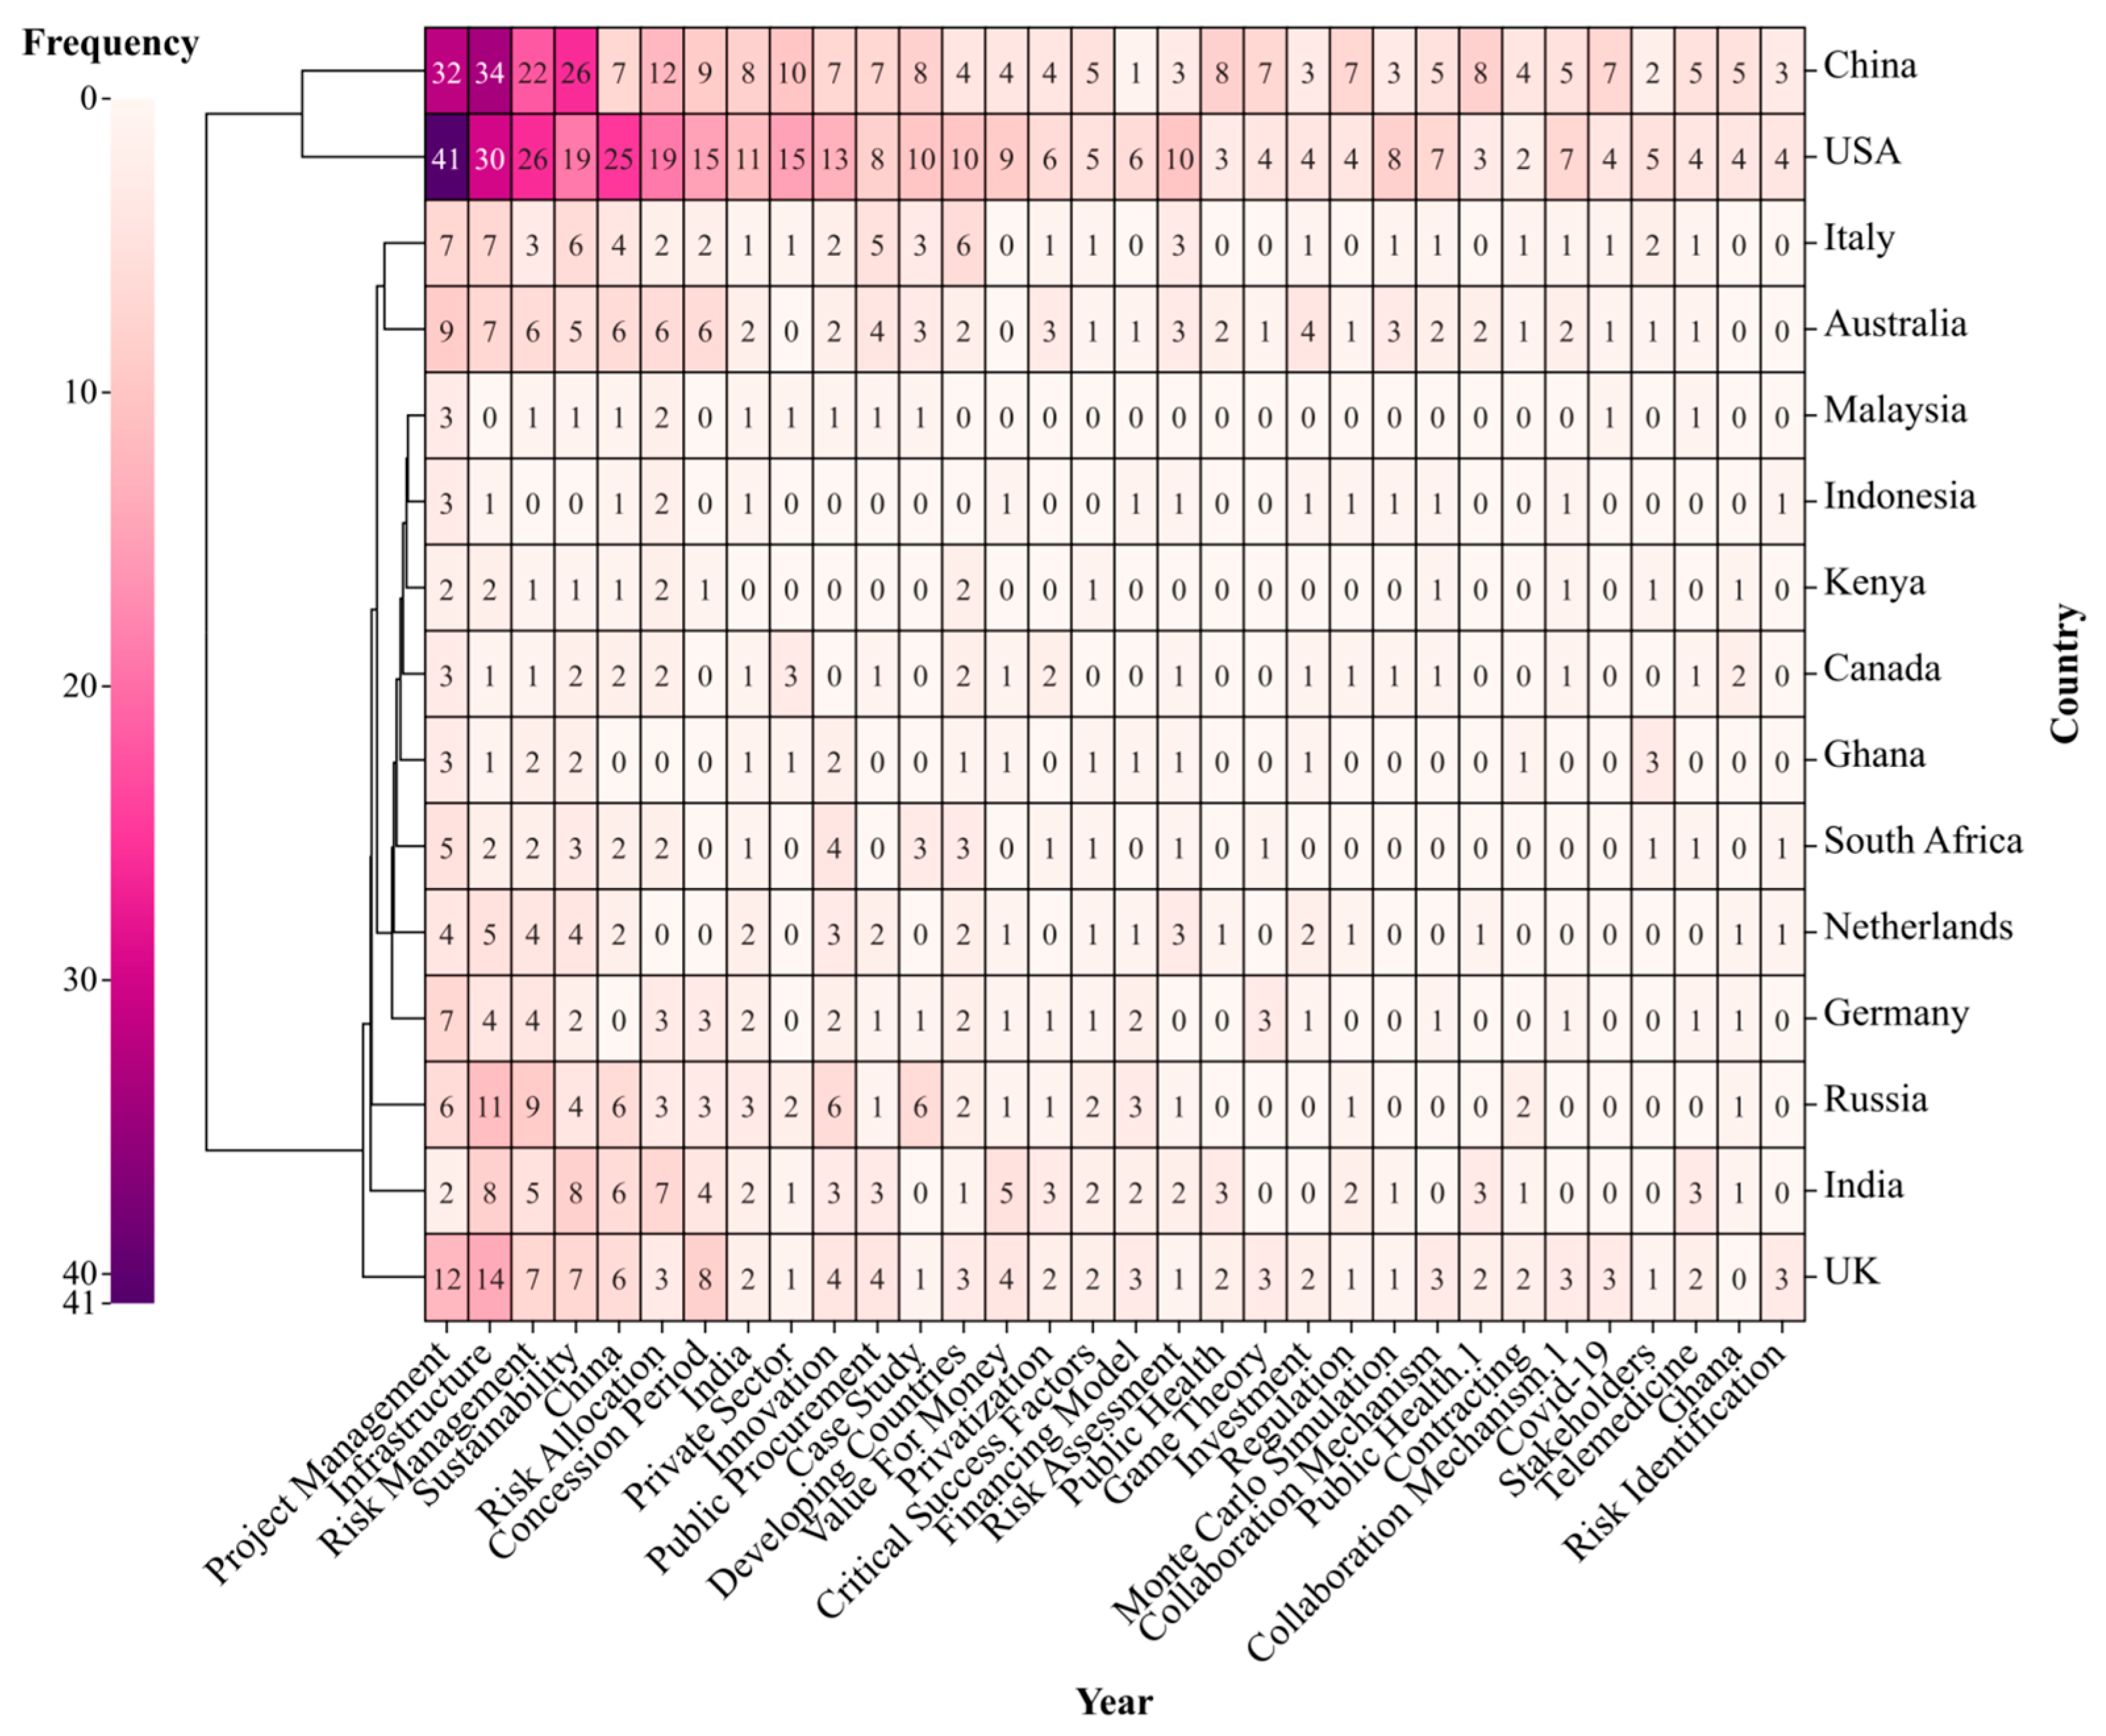
- The 2-mode network clustering algorithm. Through selecting two research objects, this method applied the unweighted pair group method with arithmetic mean (UPGMA) to determine the correlation coefficient between objects [19], and the 2-mode matrix was calculated [20,21]. Furthermore, we applied the R studio to the coupled biclustering graph between two objects. Among them, the connection between objects can determine the strength of correlation. The color depth represents the frequency, showing the heat degree of any keyword [22]. In summary, it identifies research hotspots in different phases and provides the data basis for the evolution and prediction of theme words.
2.2. Evolution Mechanism and Prediction Model Construction
2.3. Trend Analysis of Literature Characteristics
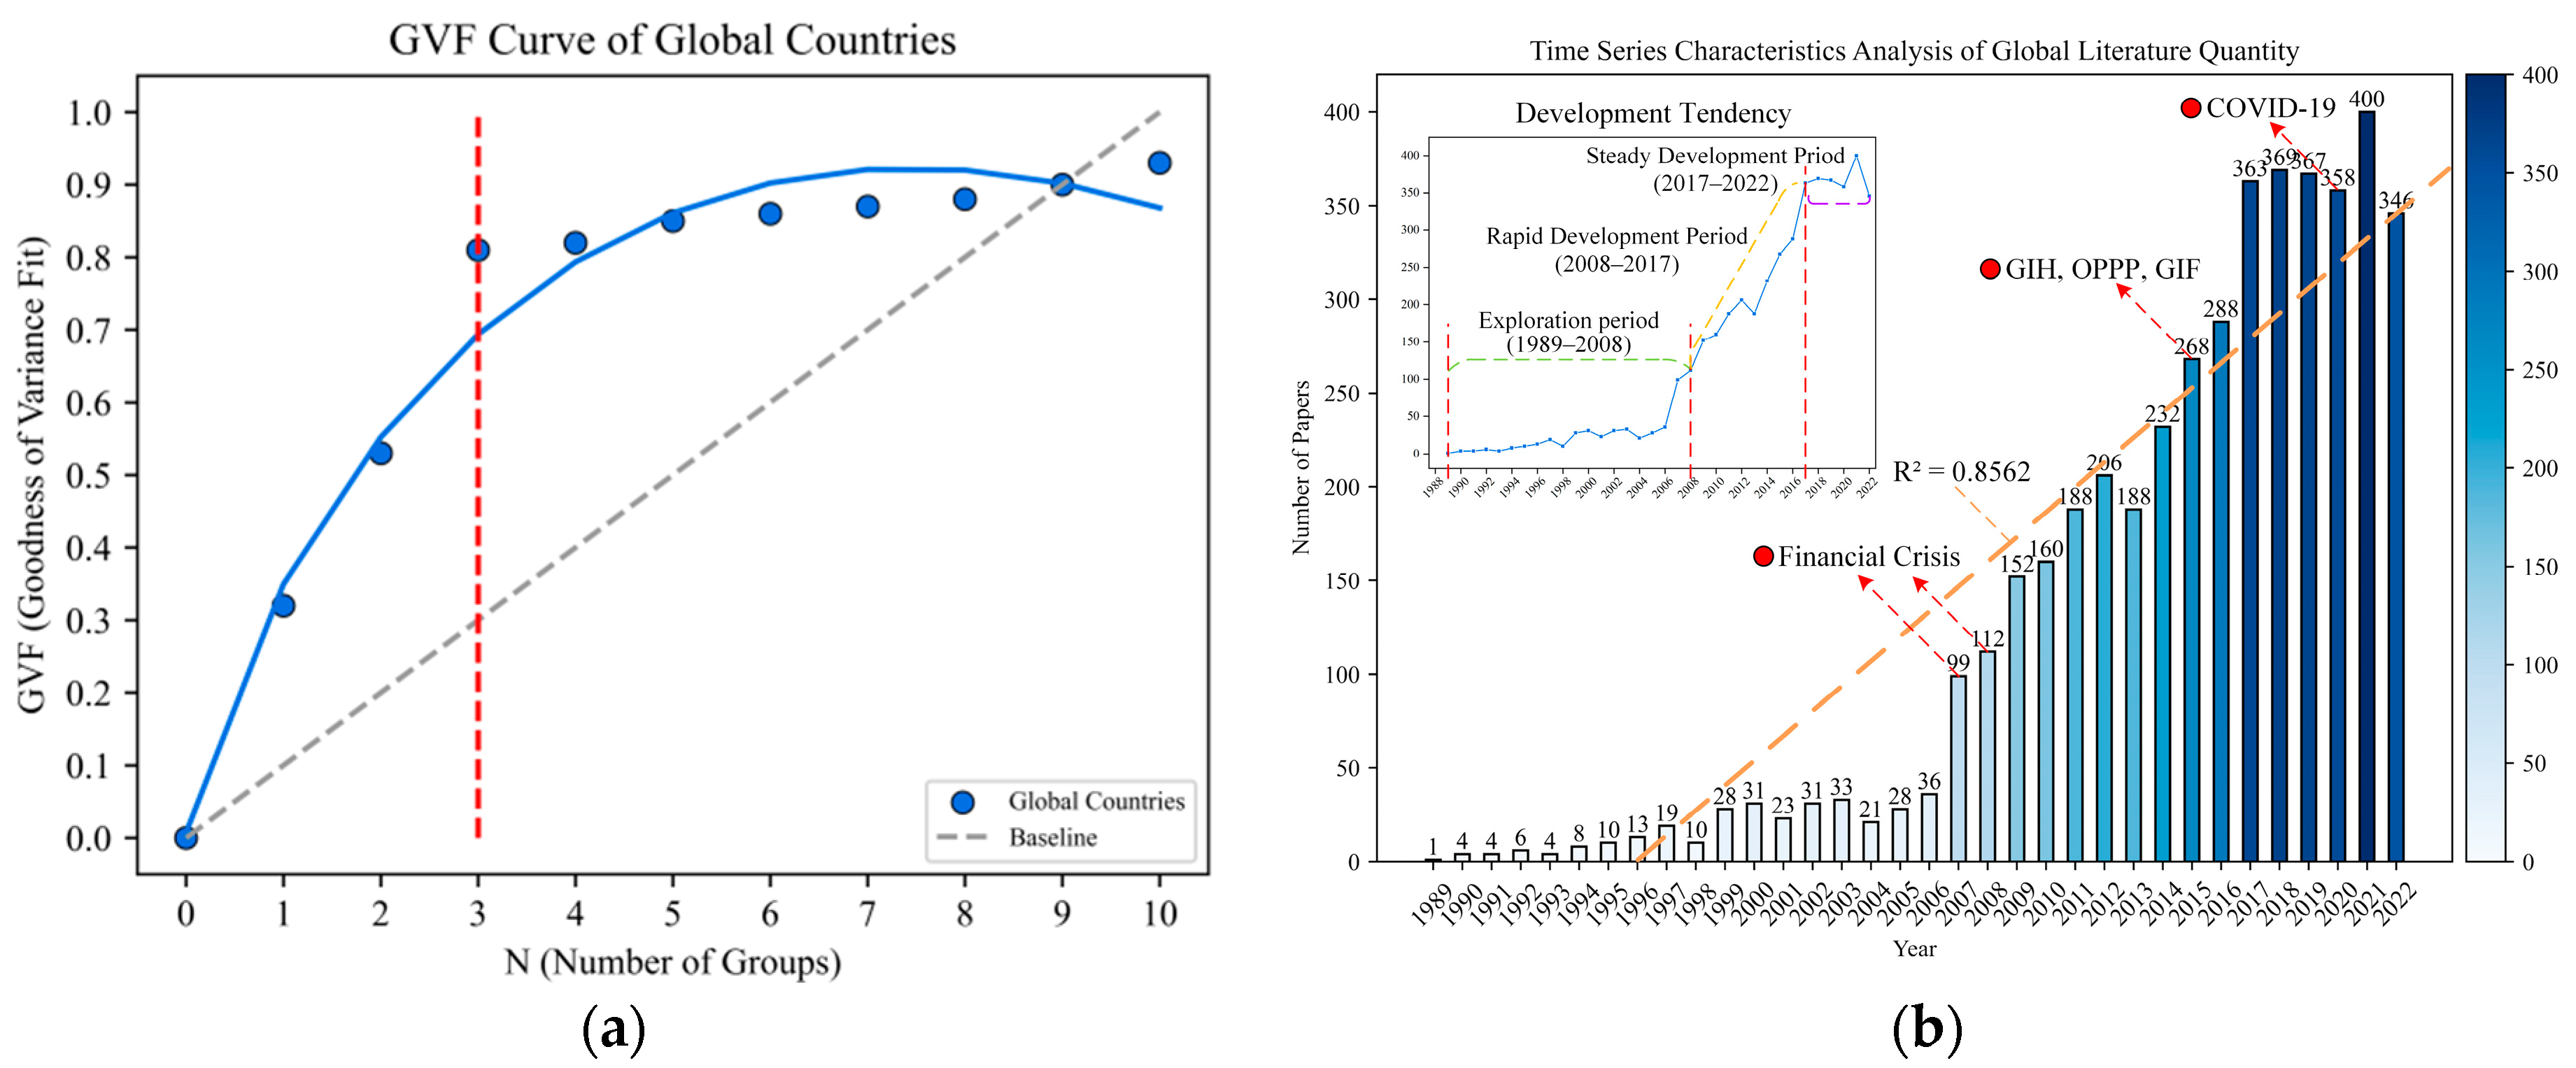
2.3.1. Division of Literature Phases
2.3.2. Analysis of Time Series Characteristics of Literature Quantity
- (1)
- Exploration period (1989–2008): the attention concerning PPP was lower before 2008, and the amount of PPP literature increased year by year.
- (2)
- Rapid development period (2008–2017): with the increasing demand for investment in infrastructure construction, the PPP model has received extensive attention. However, this is due to the influence of the global economic environment, risk, benefit sharing, etc. With 2010 and 2014 as the time nodes, the fluctuation in the PPP literature volume is quite obvious. Moreover, the Global Infrastructure Hub (GIH), Office of Public–Private Partnership (OPPP), and the Global Infrastructure Facility (GIF) were established from 2014 to 2015. These not only promoted the development of global infrastructure [24] but also promoted the academic follow-up. Hence, the global PPP literature volume has rebounded rapidly after 2015 and has continued growing in a straight upward trend.
- (3)
- Steady development period (2017–2022): The growth of the PPP literature volume tends to be stable. Furthermore, the annual publication volume is approximately 360. Isaac et al. [25] believes that with the impact of the COVID-19 era on the global economy, the entire PPP market and construction industry are in deficit, and the economic growth fell by 2.3% last year. Simultaneously, due to the policy uncertainty, it is not difficult to see that the PPP research progress remains stagnant in this period [26].
2.3.3. Attention Analysis of Literature Quantity
- (1)
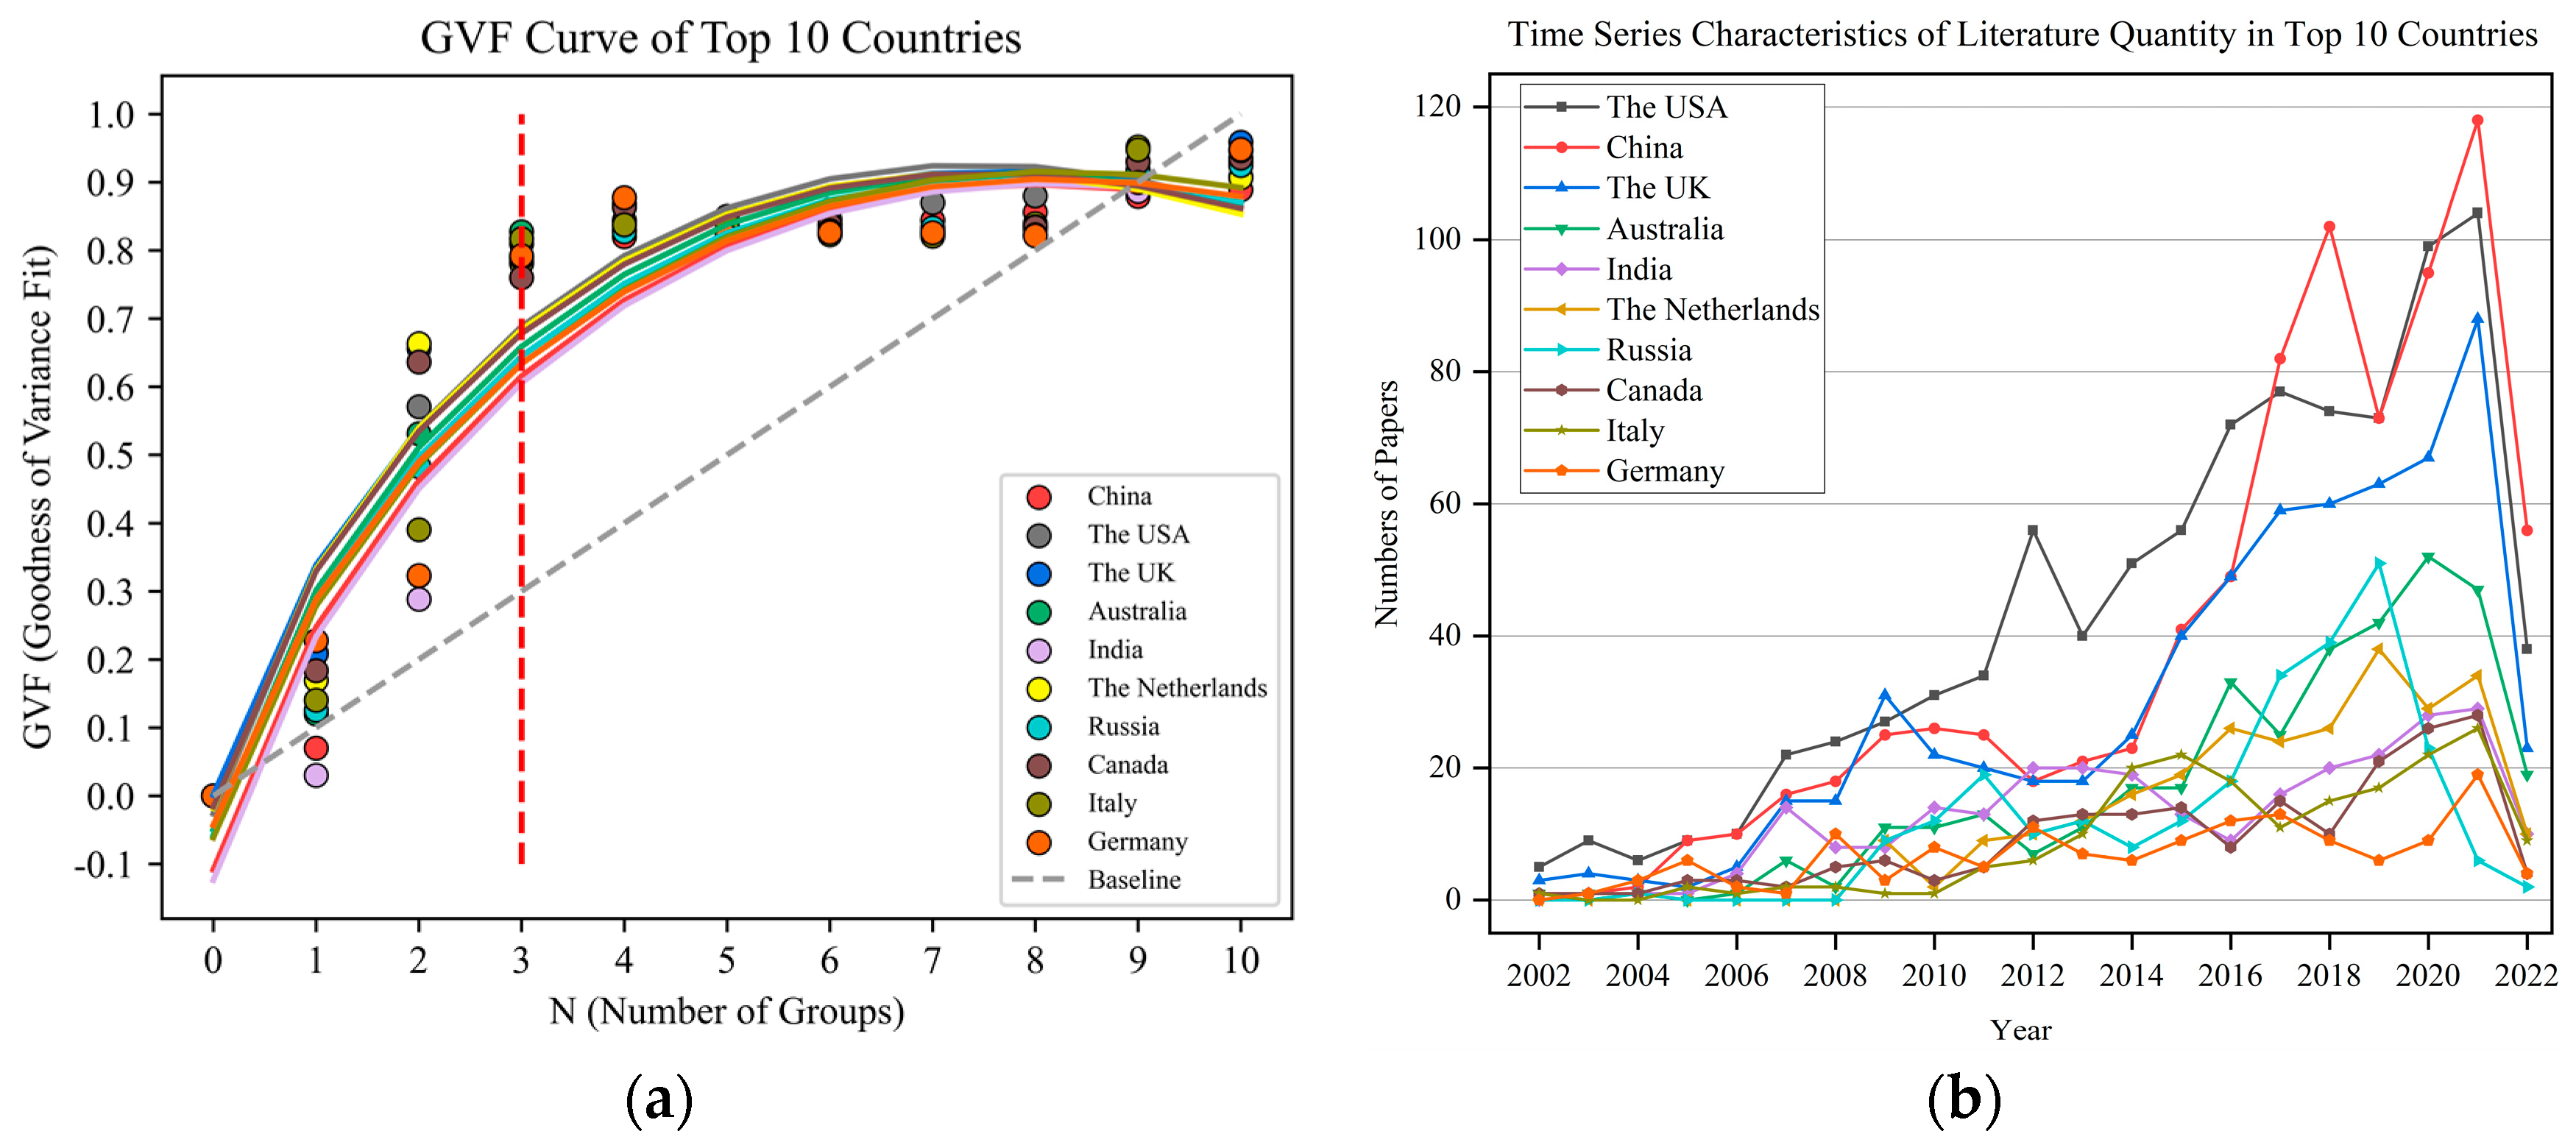
- The graph shows an overall growth state. Since 2006, the volume growth trend in global PPP literature is obvious. Conversely, the USA and the UK perform the most prominently. After 2014, the global PPP literature growth gains momentum, and simultaneously, China and Australia show the greatest increases. Since 2007, the growth of global PPP literature tends to flatten out. However, China still maintains rapid growth and is significantly ahead of other countries. After 2019, except for China, the USA, and the UK, other countries all show slow growth or even a downward trend.
- (2)
- On the contrary, the total number of pieces of literature between China and the USA is similar. PPP literature in the USA has always been significantly ahead of China, and shows a steady growth trend from 2002 to 2017. However, the strong development period of PPP research in China is mainly concentrated in the second half of this period (2017–2022). It can be shown as: the China Public Private Partnerships Center (CPPPC) was officially approved in 2017, and the number of PPP-related policies promulgated also exploded in China. Until 2016, the number of joint policy enactments accounted for 35.6% of the total number of policy enactments [28]. Therefore, under the effective promotion of national policies, Chinese PPP practice and academic research received unprecedented attention [29]. Moreover, the number of PPP publications in China began to surpass that of the USA in 2017 and maintained a relatively stable growth rate.
3. Derivative Analysis of Data Characteristics
3.1. Feature Derivative Analysis of Keywords
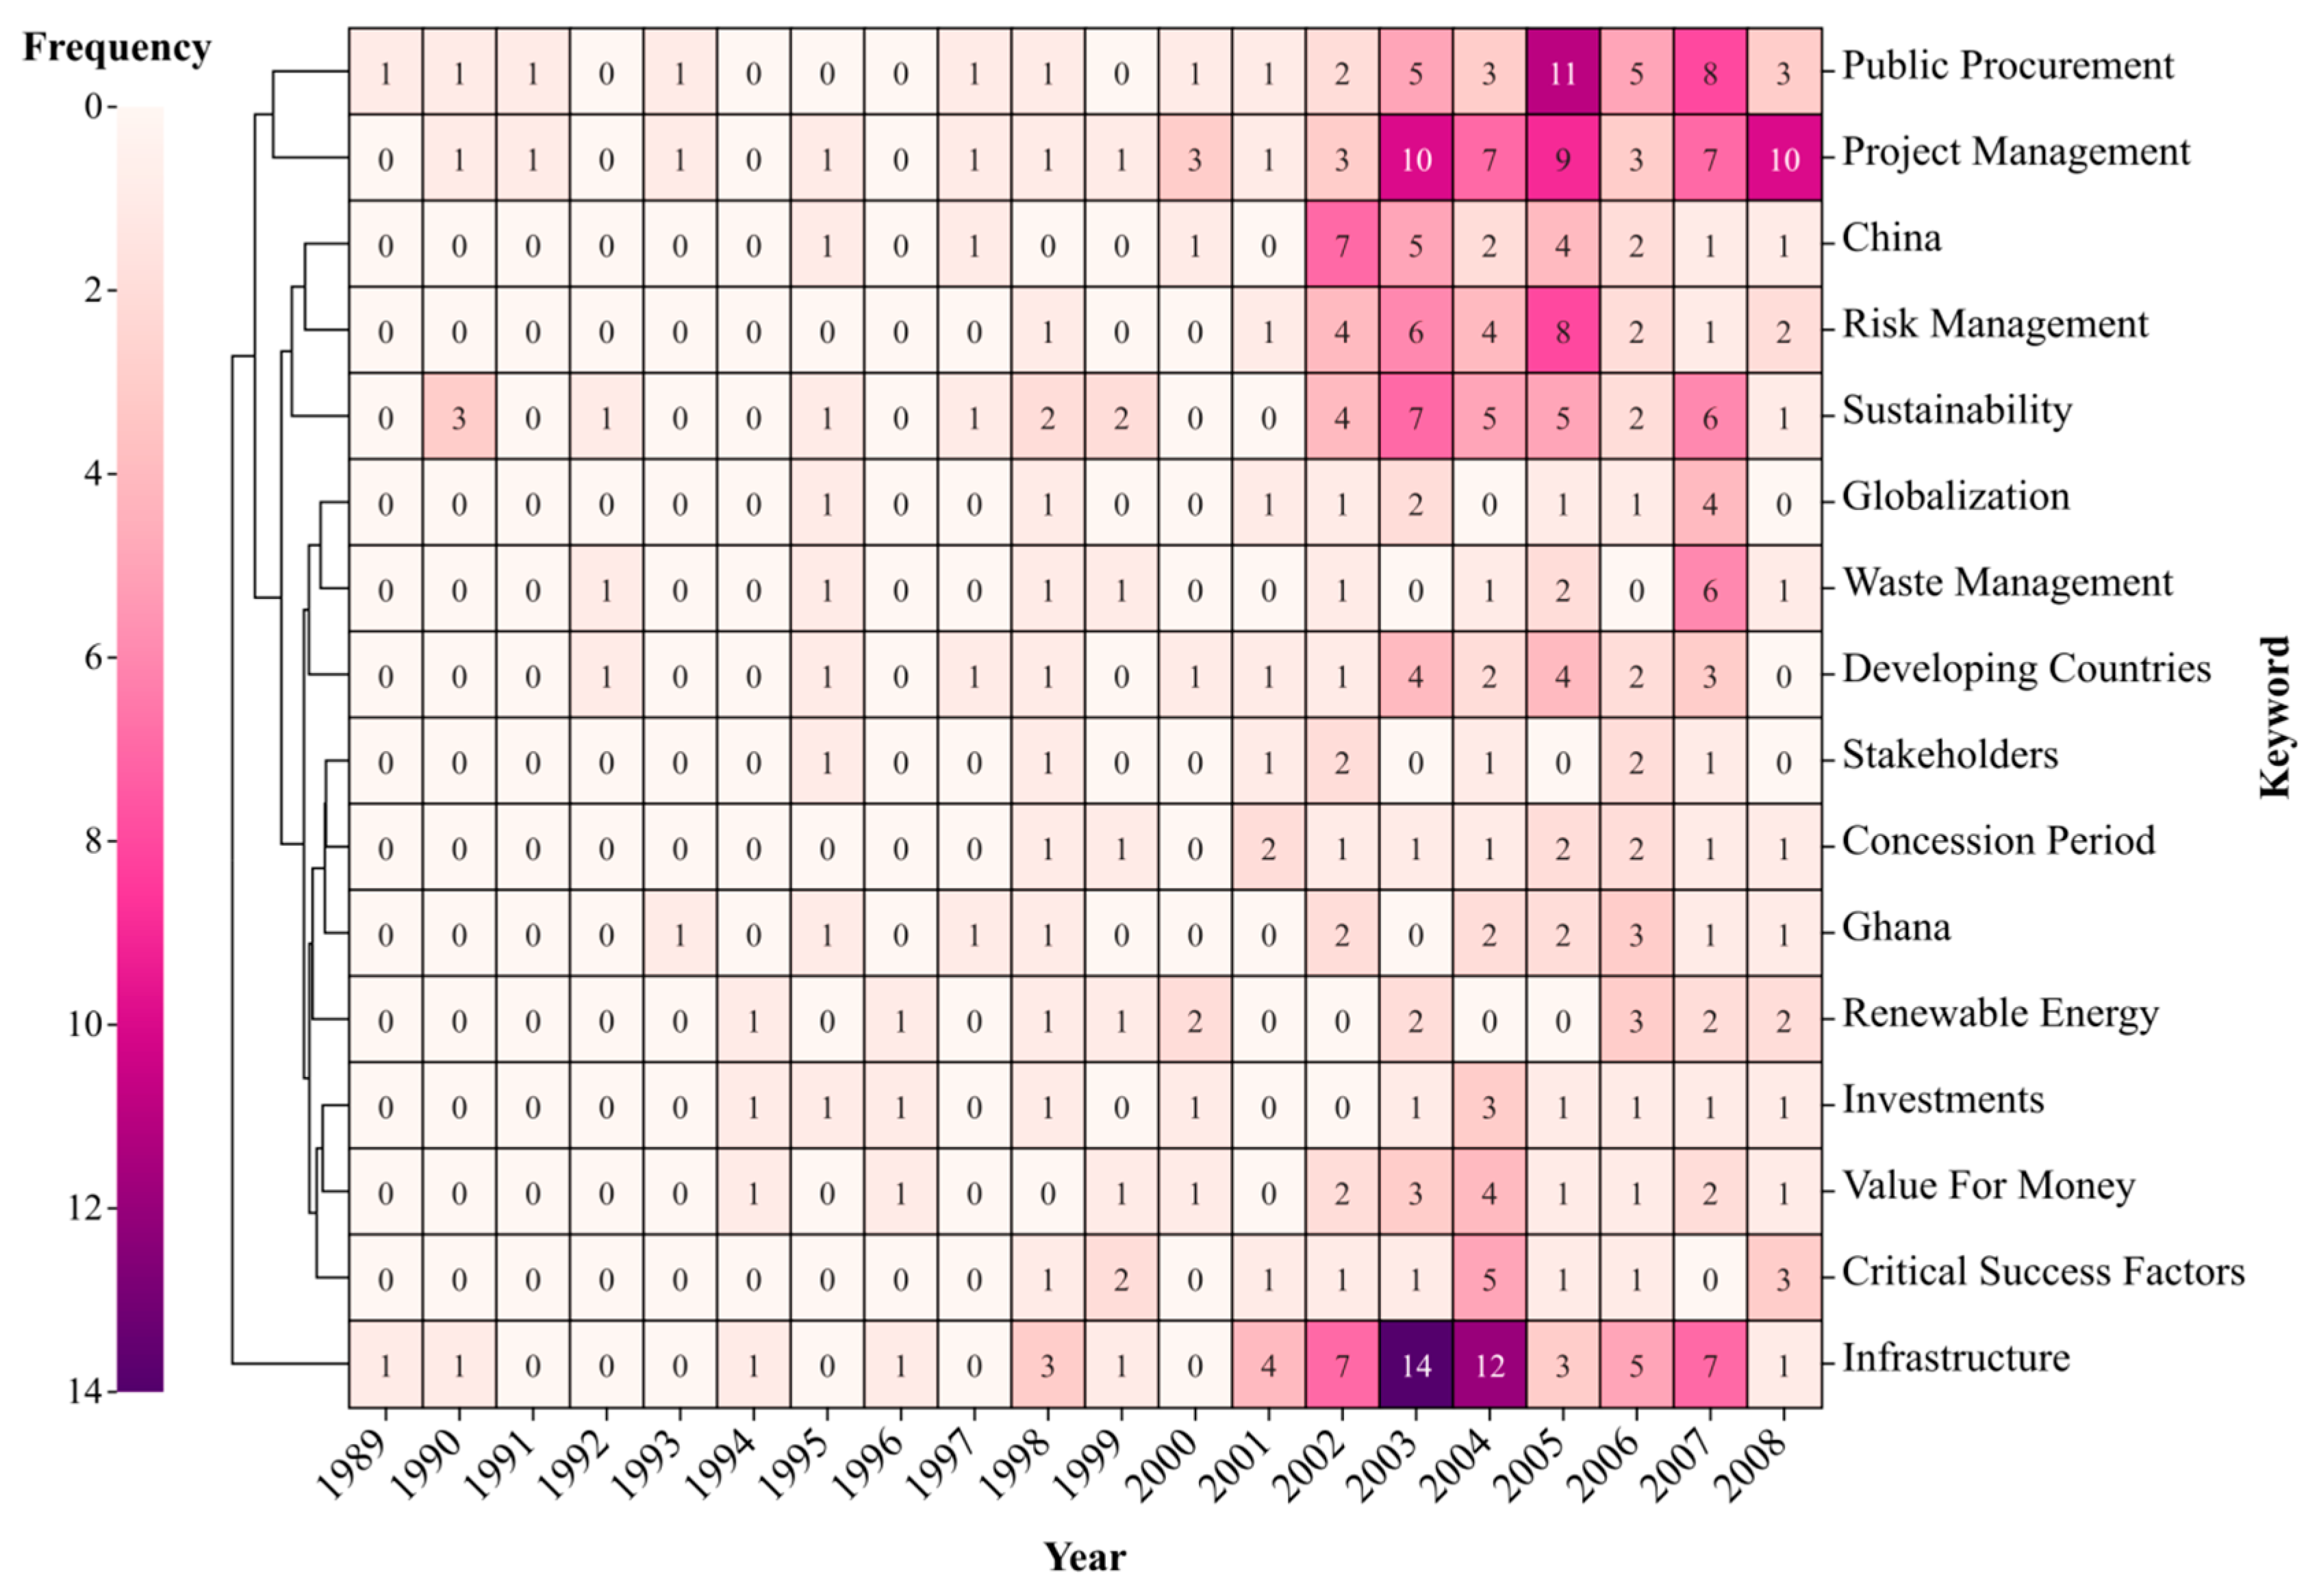
3.1.1. Exploration Period (1989–2008)
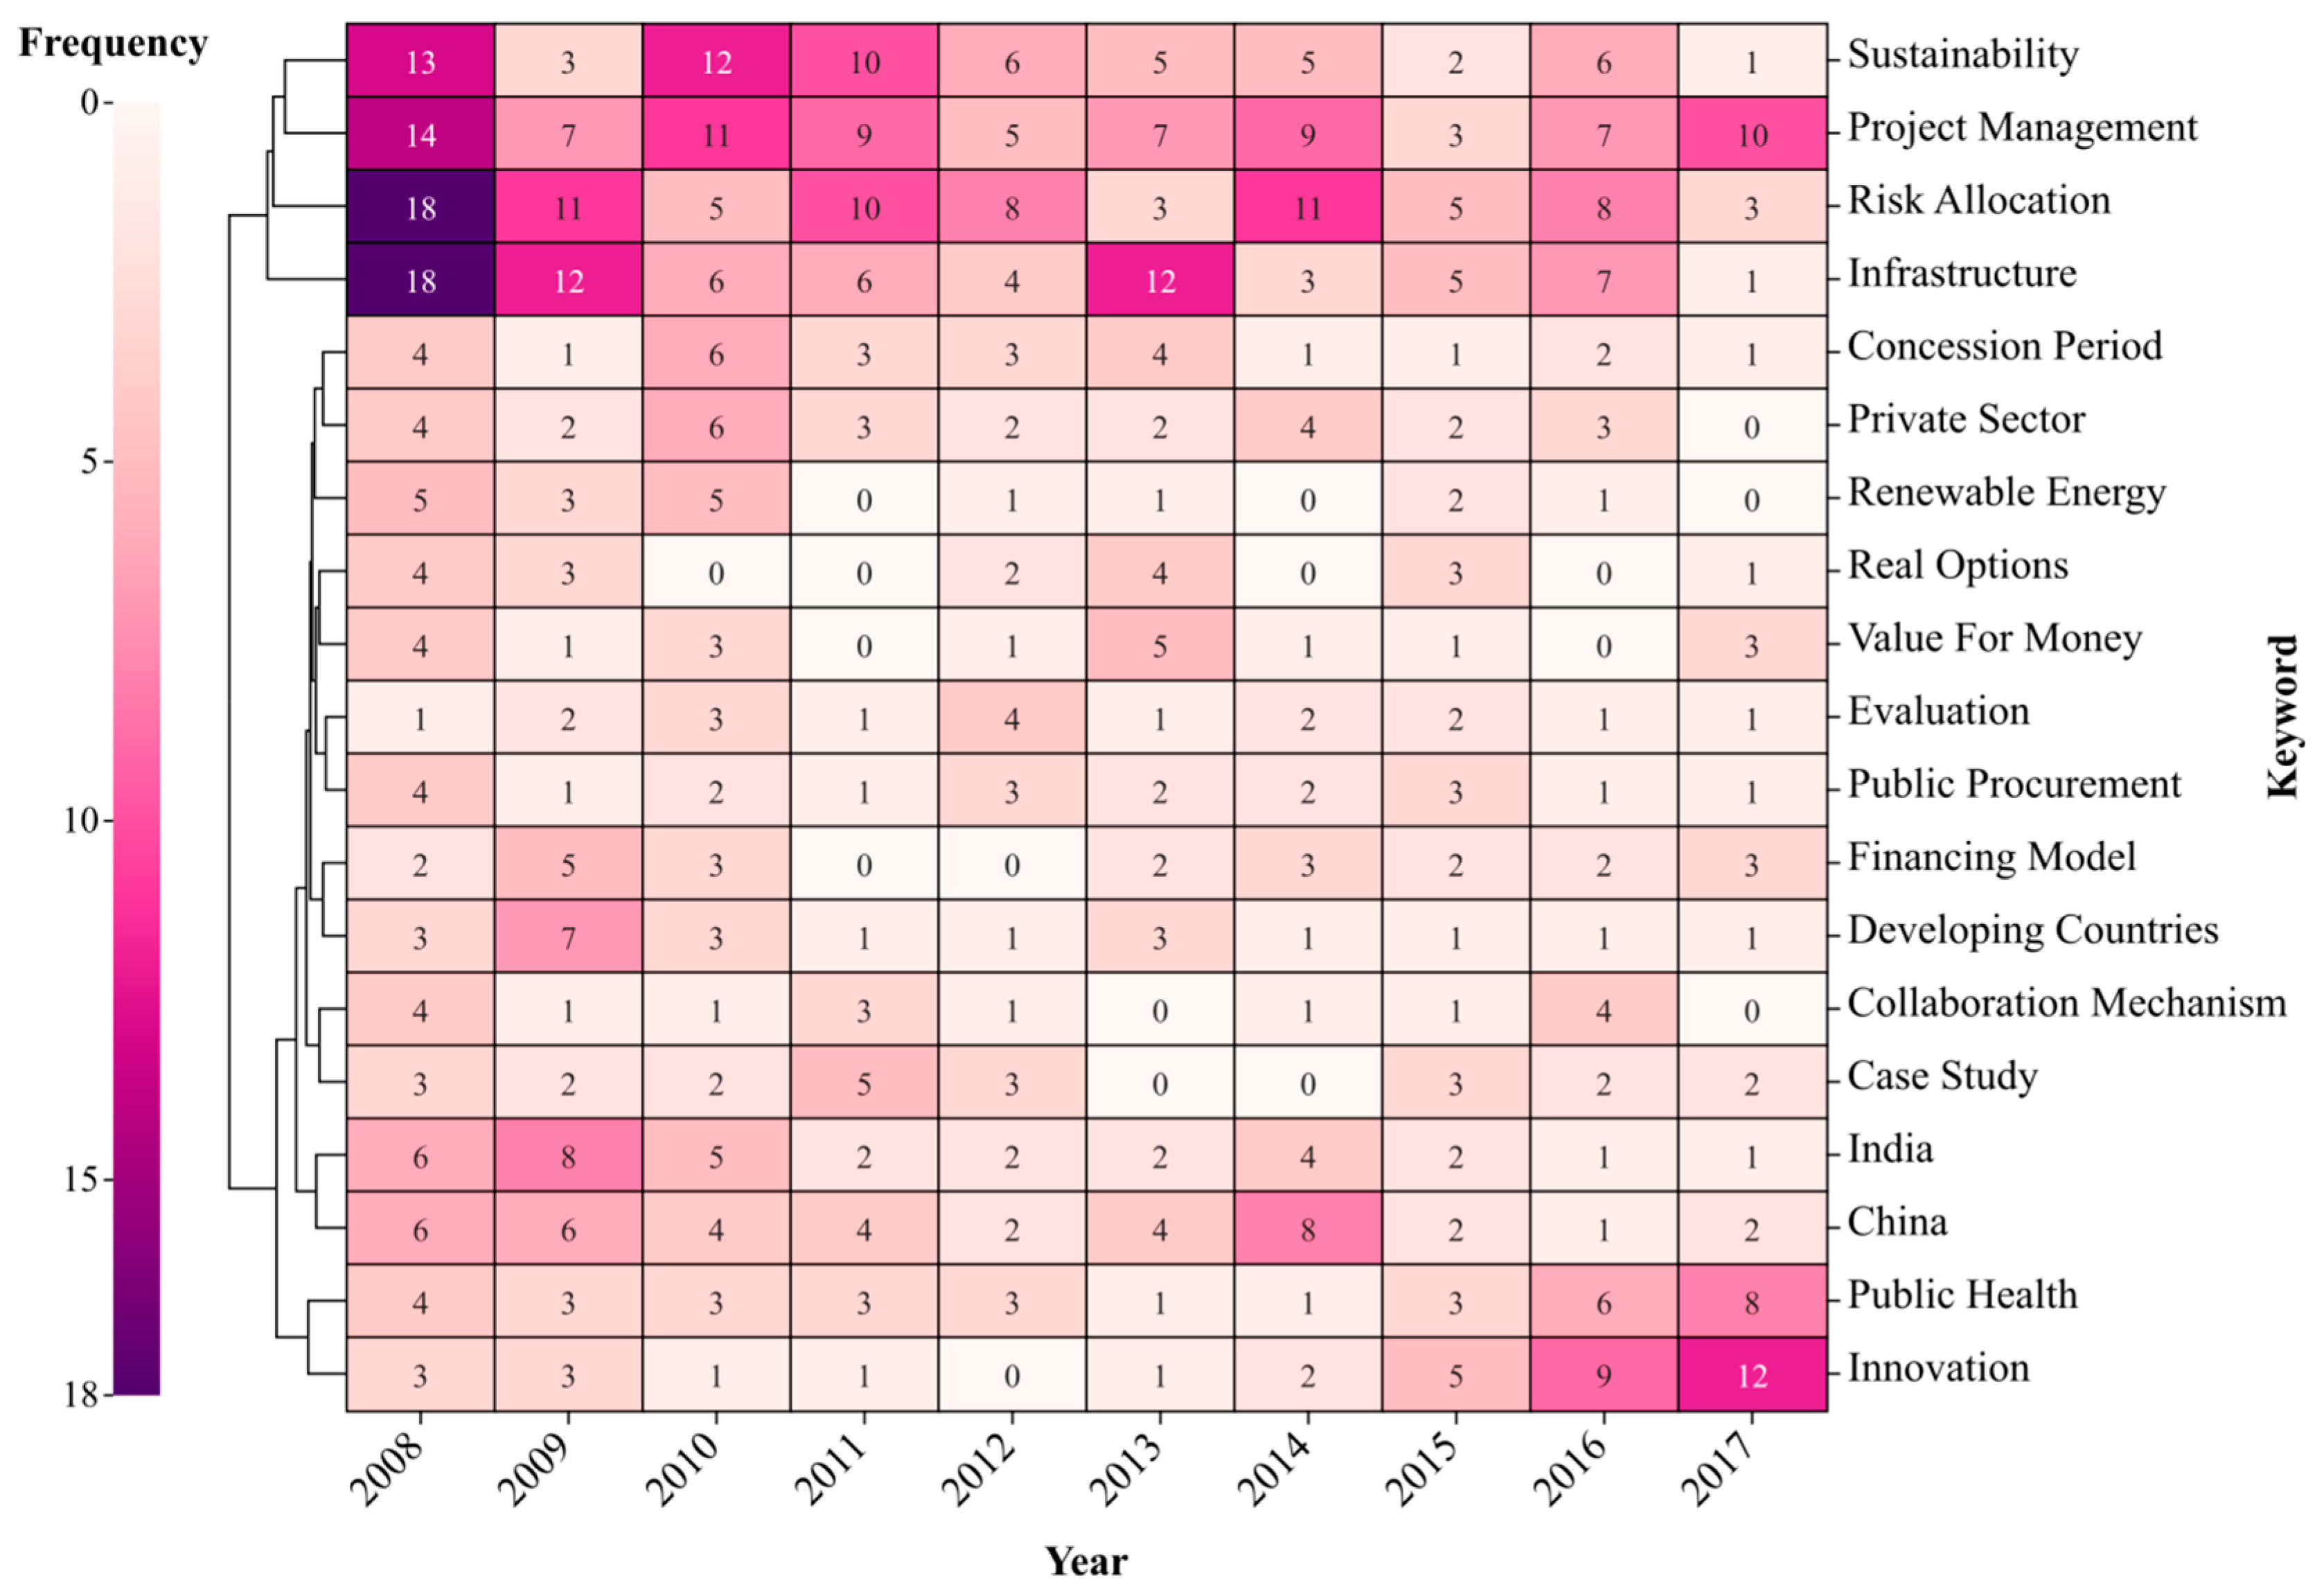
3.1.2. Rapid Development Period (2008–2017)
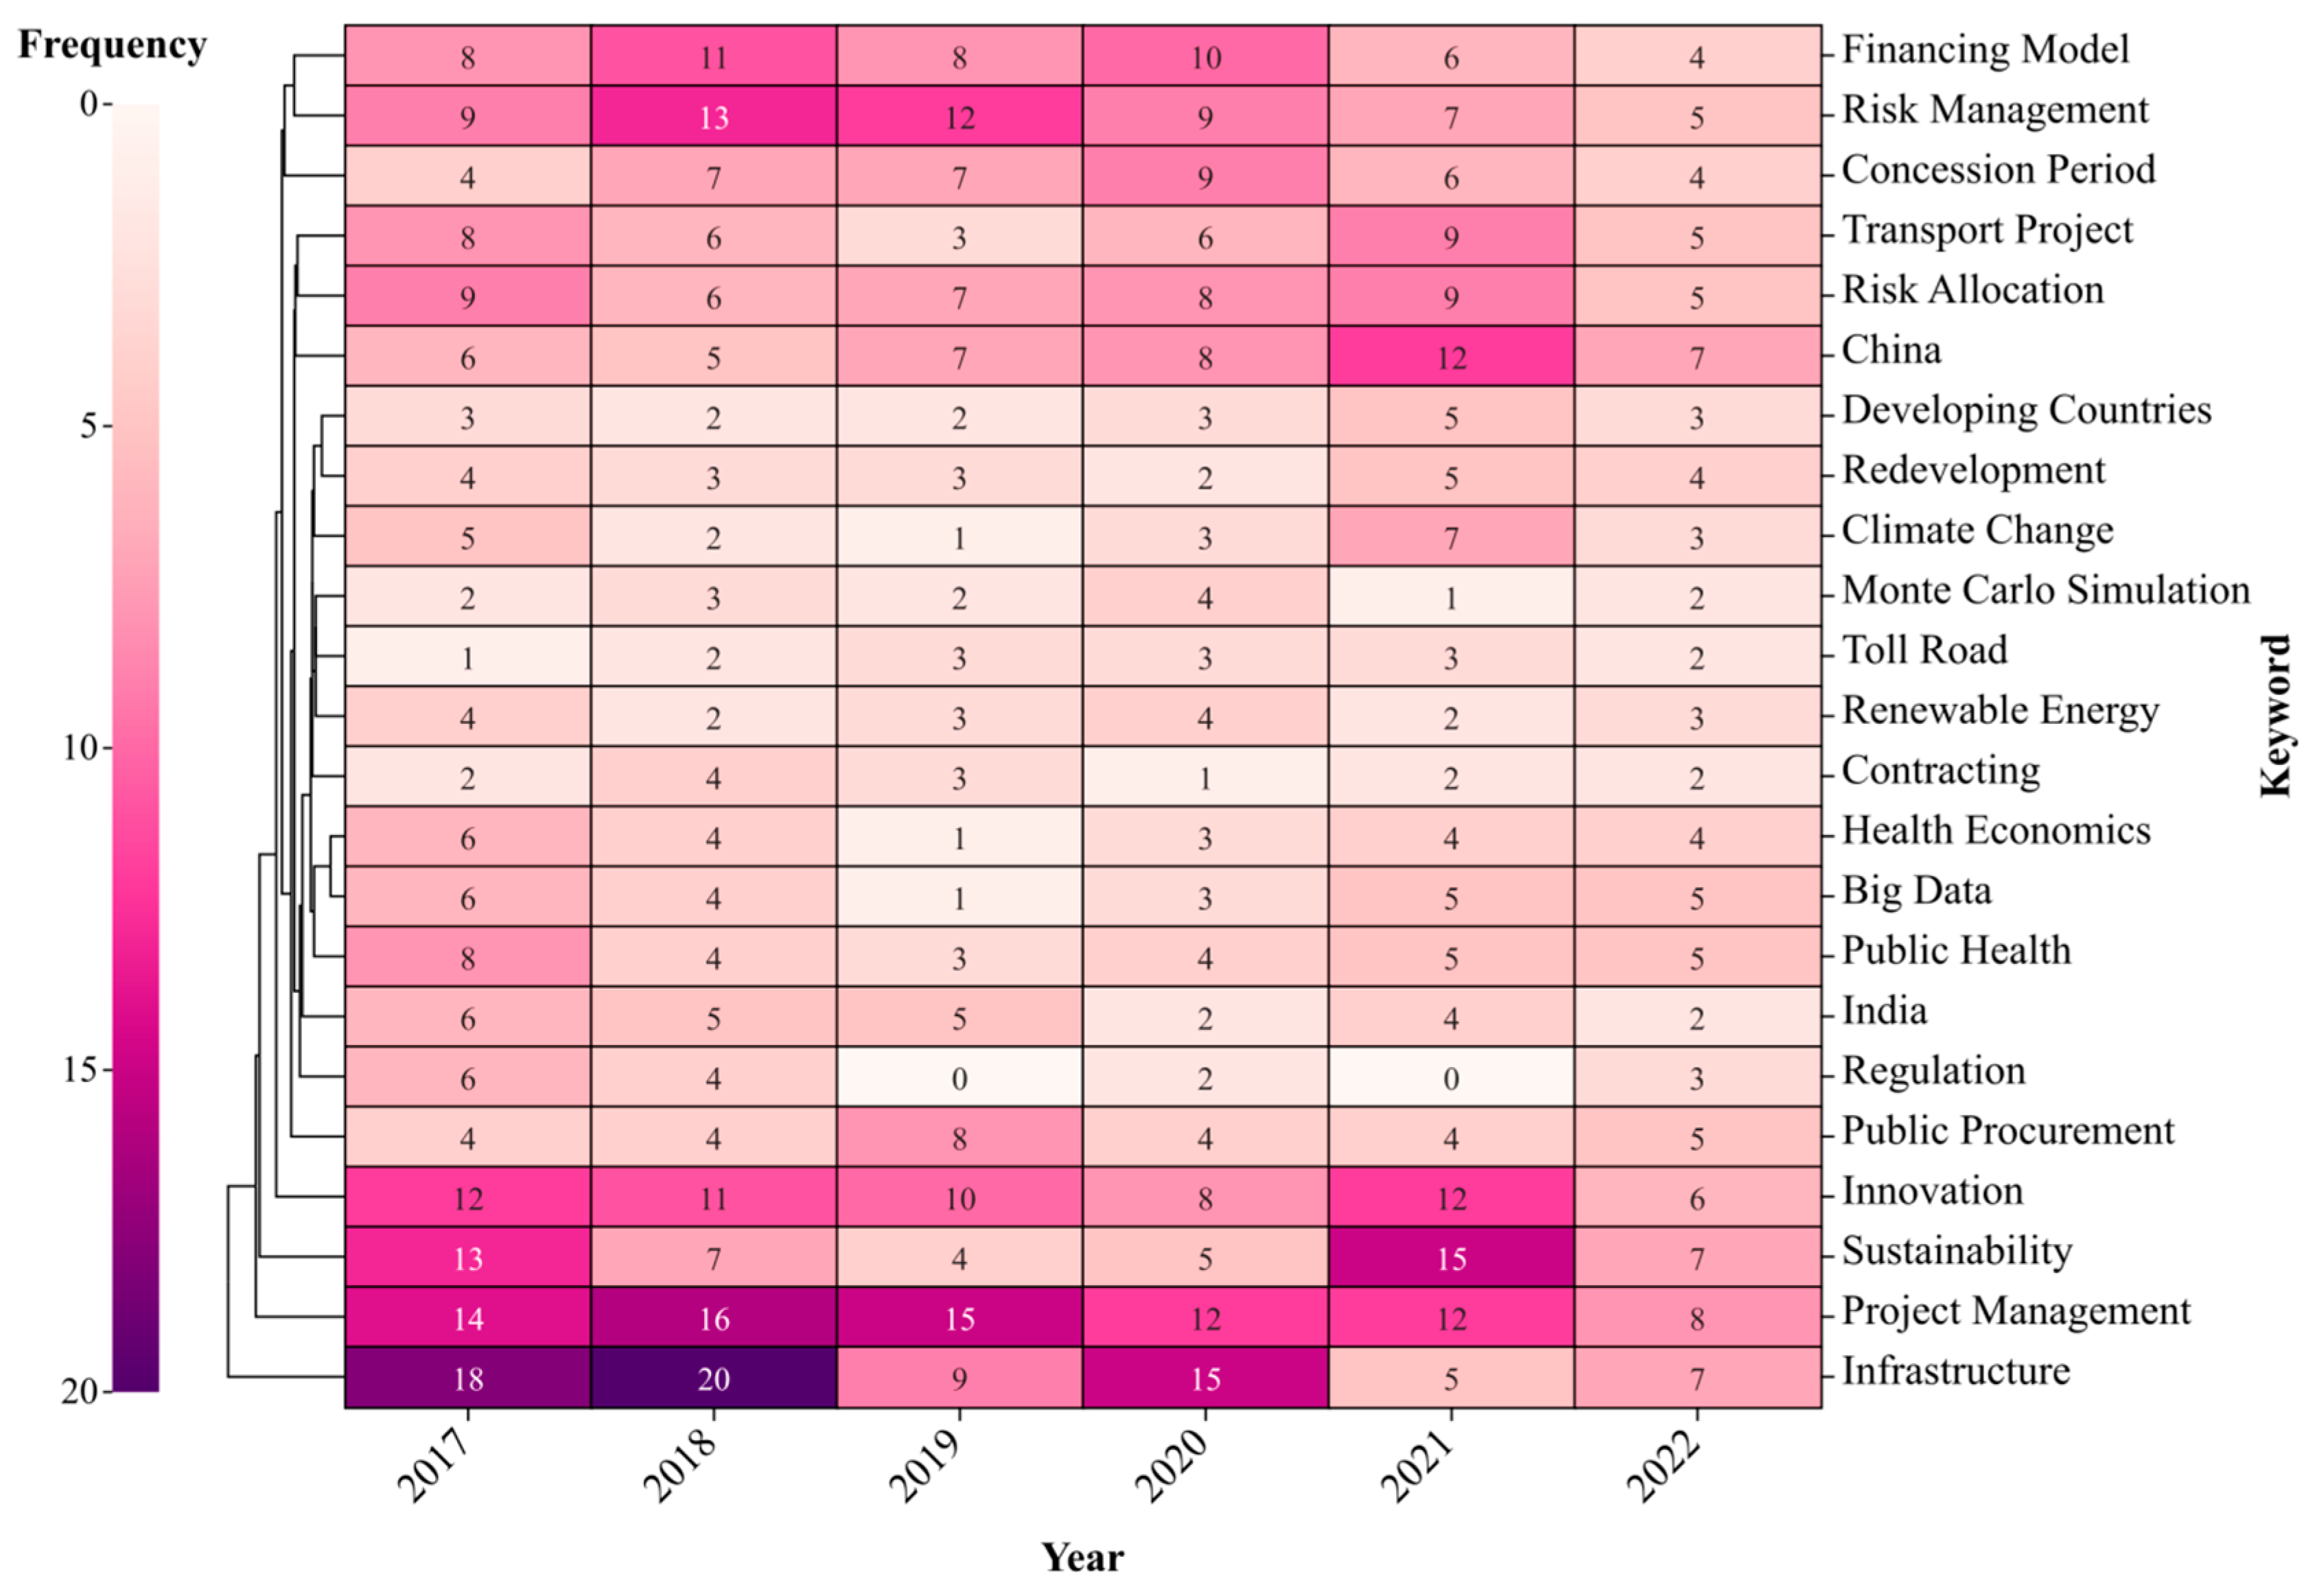
3.1.3. Steady Development Period (2017–2022)
3.2. Coupling Analysis of Countries and Keywords
3.2.1. Analysis of Geographical Heat and Cooperation
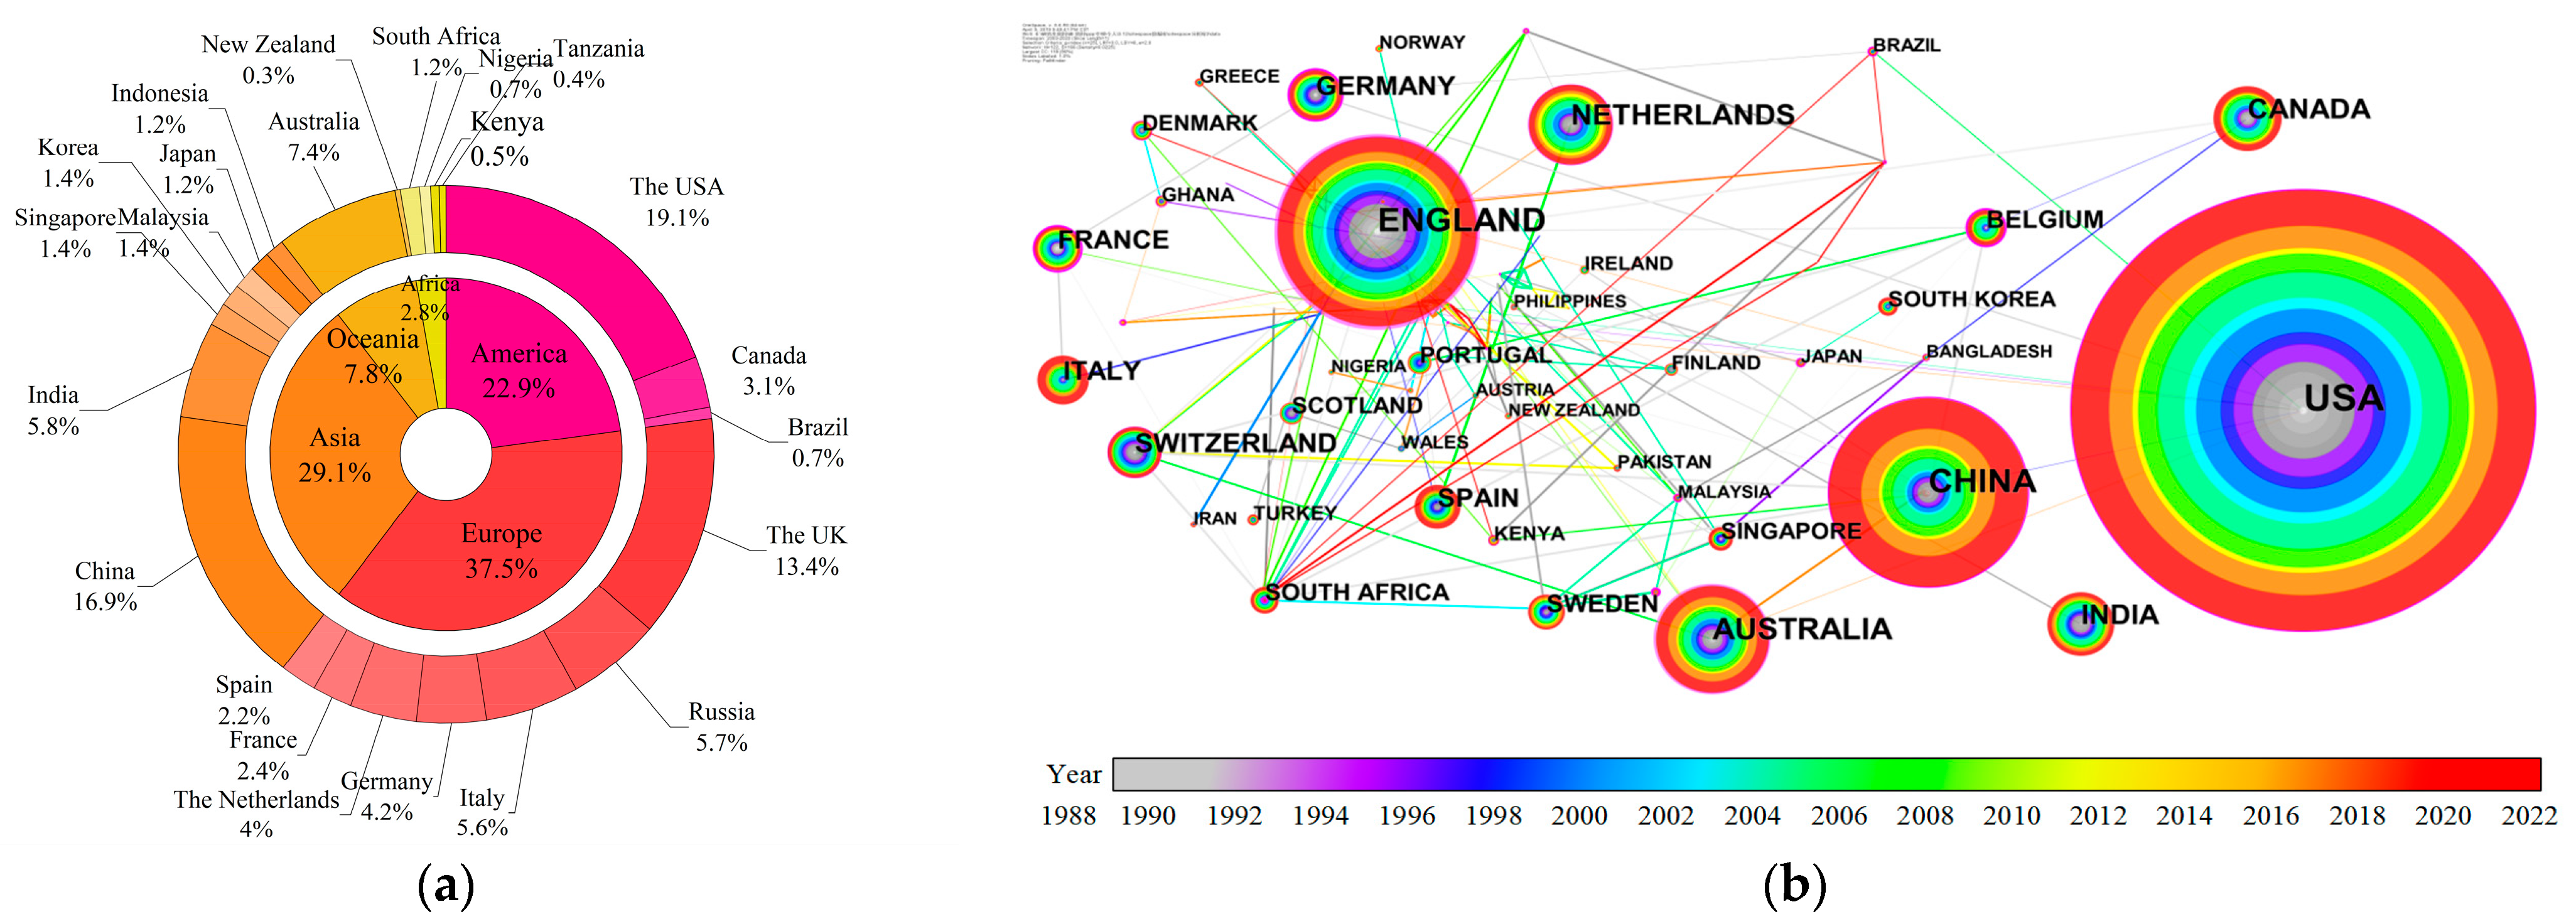
- On the whole, the distribution of global PPP literature is uneven. The top 5 continents in the global PPP literature are the Americas, Europe, Asia, Oceania, and Africa. From a partial perspective, the total number of pieces of literature in the Americas is close to that in Europe, and the total number of publications accounts for approximately 66% of the total global literature. Moreover, the distribution of literature in European countries is also more balanced, and the intensity of academic cooperation is higher. In contrast, the number of pieces of African literature is less than 3%, significantly lower than the average of other continents.
- Country collaboration network analysis can measure the scientific research strength of the country in this field. Among them, the connection color indicates the time of national cooperation, and the node size indicates the number of pieces of literature in each country, as shown in Figure 8b.
3.2.2. Comparison of Betweenness Centrality
- These are the countries where PPP literature first appeared: the USA (1989) and the UK (1992). On the one hand, the Top 5 countries in the total number of pieces of literature are the USA, China, the UK, Australia, and India; On the other hand, the Top 5 countries in terms of betweenness centrality are the USA, the UK, Italy, the Netherlands, and Canada. Additionally, through comparison, it was found that although China and India rank the second and fifth in the world in terms of the number of publications, their betweenness centrality is lower than 0.1. The reason is that China has a unique political background and economic characteristics that restrict the interaction and cooperation with other countries [44]. Overall, there is a large gap between developing and developed countries in academic influence.
- Through the comparative analysis of literature quantity and betweenness centrality, it can be determined that developed countries: the USA and the UK, have a higher academic discourse power in the field of PPP research, and the research direction of these countries is an important evolutionary reference target. In addition, China and India are the most important evolutionary reference targets for the keywords of developing countries. Furthermore, we find that the modernization process of some developing countries (China, India, etc.) are also an important research reference for economically backward countries. In particular, related research in these areas: hydro economy and sustainability [45].
3.2.3. Cluster Analysis of National Coupling
4. Evolution Prediction of Theme Word and Keyword
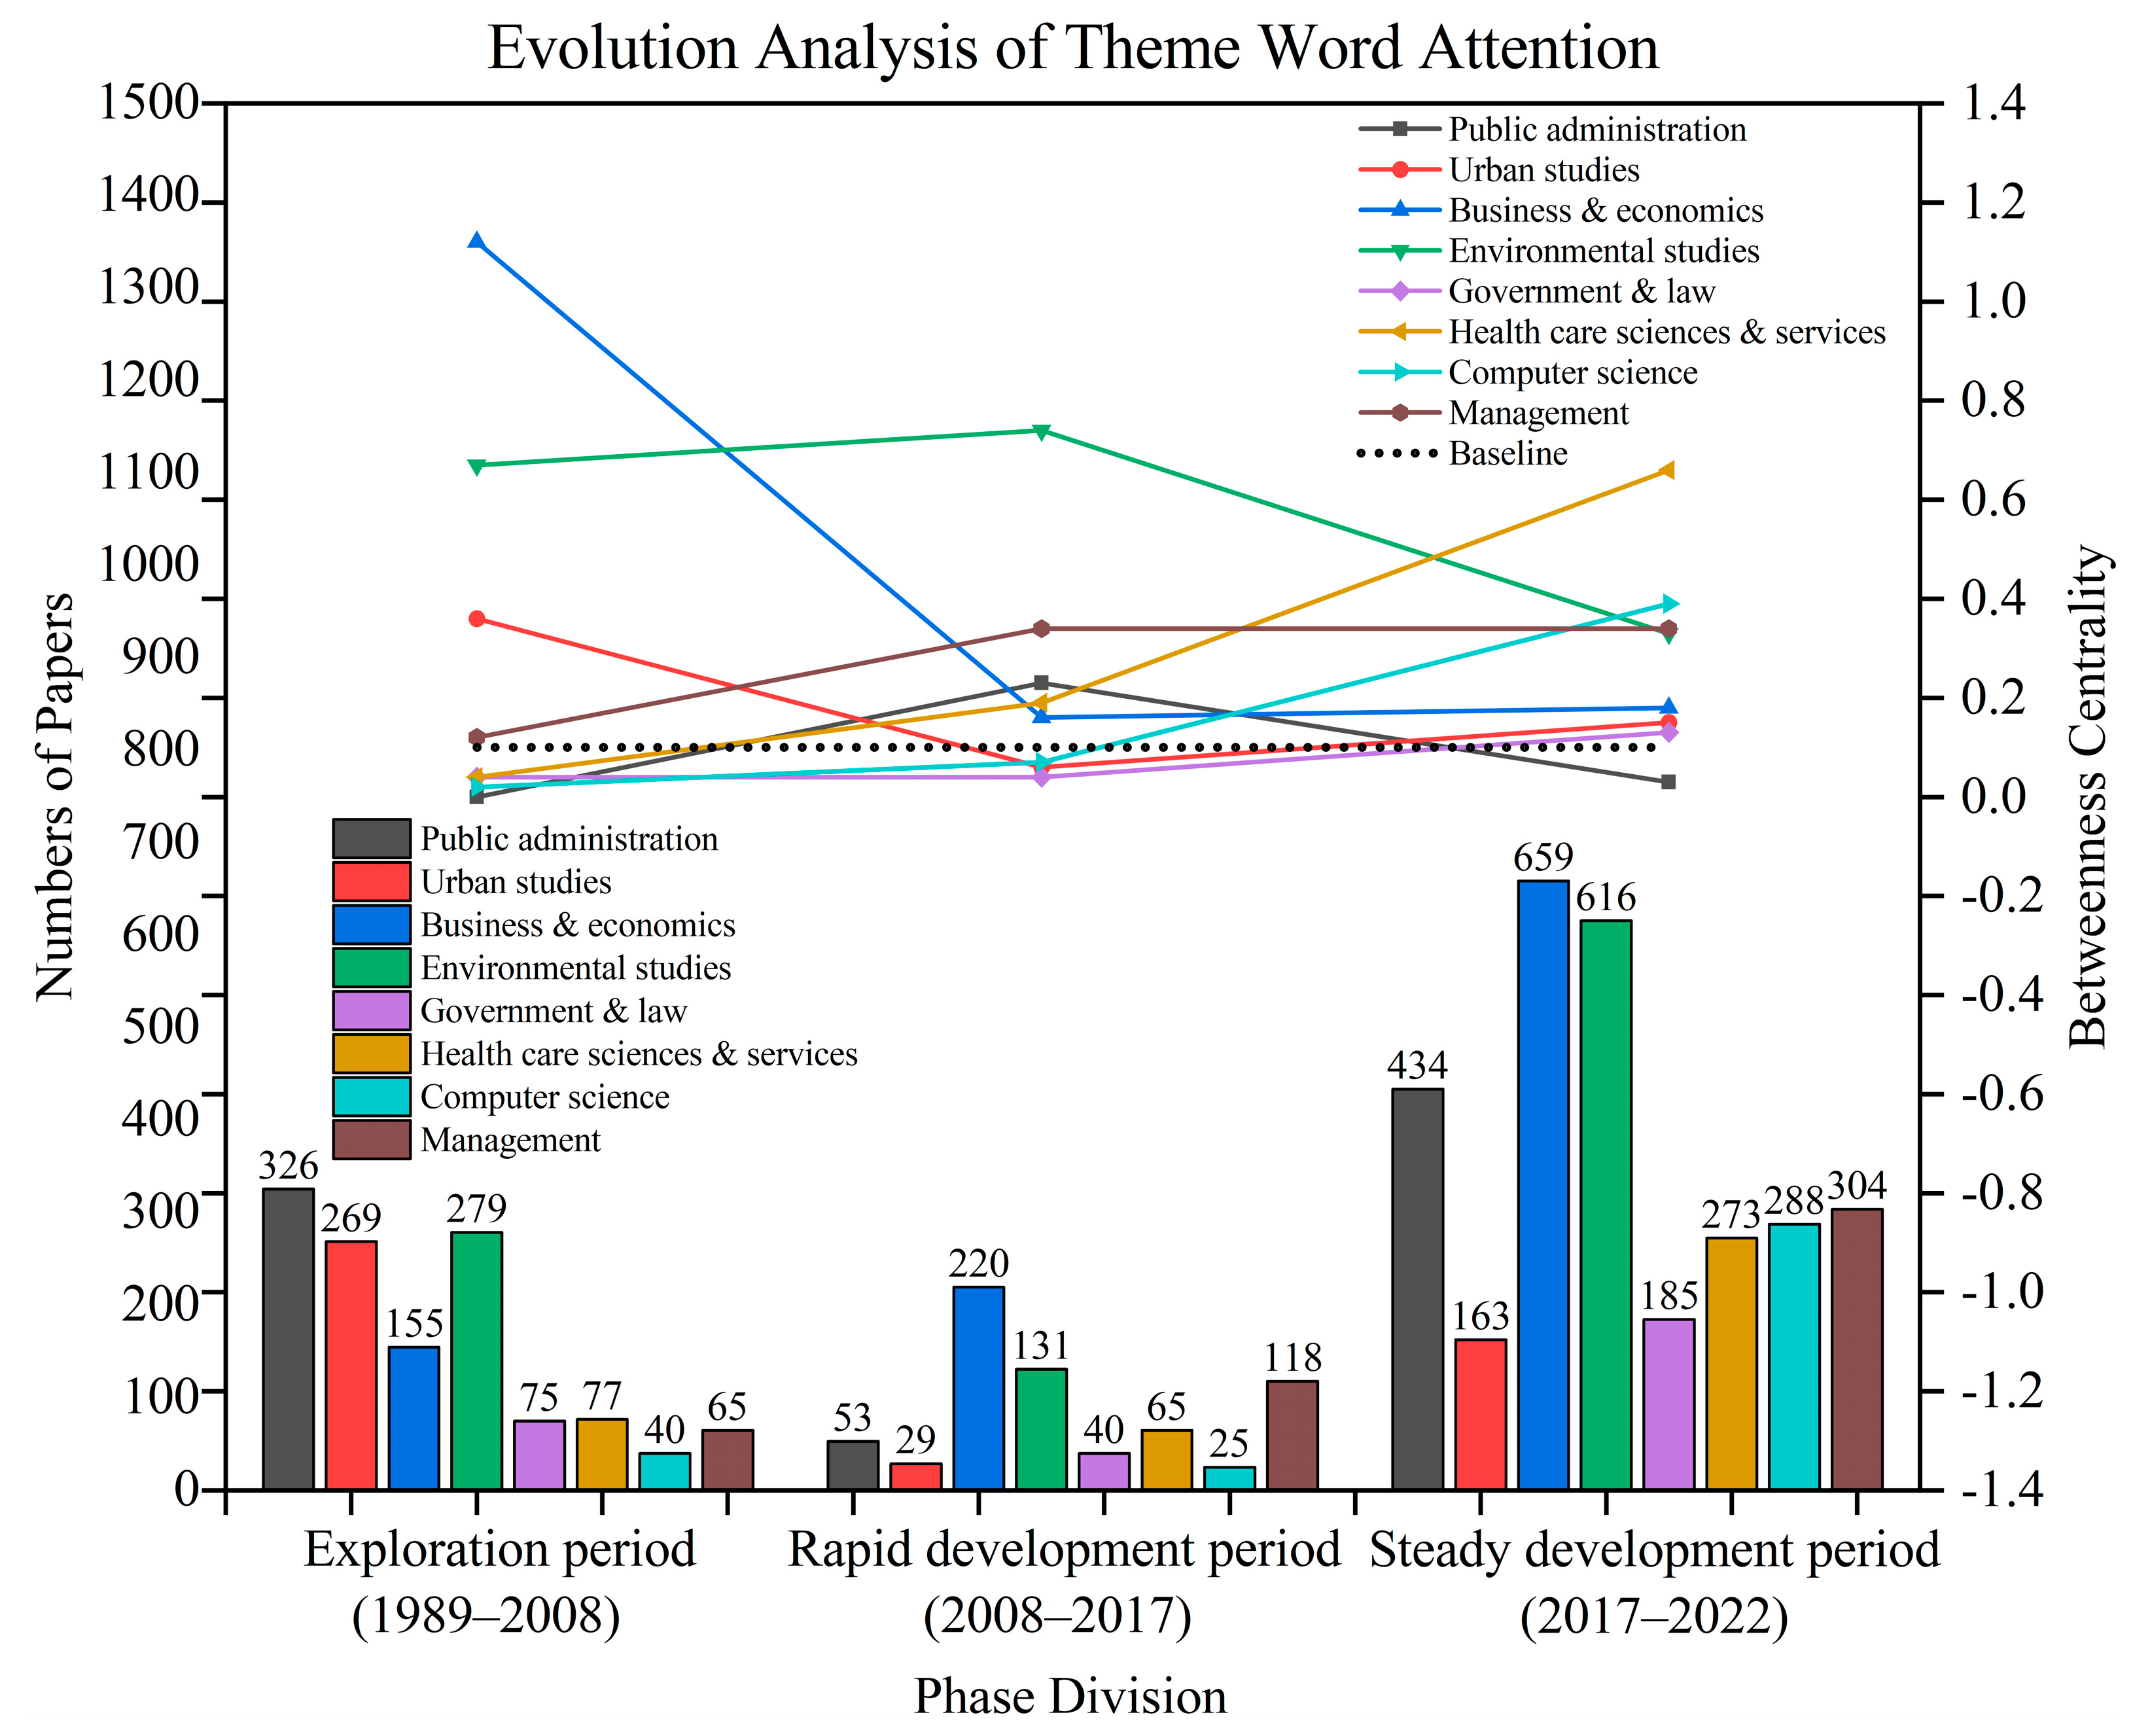
4.1. Attention Evolution of Theme Word
- Standardization and intelligence may become the innovation in future research. The betweenness centrality of government and law, as well as computer science, is greater than 0.1 until the steady development period. In addition, their frequency also increases significantly. It shows that the government will pay increasing amounts of attention to policy formulation and intelligent application of PPP modes in the future. Cheng [50] pointed out that the combination of PPP mode with network and intelligence has application value, which is conducive to improving the efficiency of resource allocation and the management level for government function management. Moreover, the global cloud computing market is also critical to driving the development of digital infrastructure. Simultaneously, the digital economy is expected to grow from approximately USD 500 billion in 2021 to nearly USD 1 trillion in 2026 [51]. Additionally, the emerging infrastructure, such as blockchain applications [52], smart city [53], and data center [54], etc., will increase the willingness to invest in the private sector.
- Compared with business and economics, the frequency of environmental studies is close behind. In contrast, the centrality trend of environmental studies falls sharply after a slight rise. This suggests that there may be a large divergence in environment-related research. This research content (sustainability and renewable energy source) may distract the academic attention from environmental studies [55].
- The literature on business economics is steadily increasing, but it is not innovative enough. Although the frequency of business and economics increases from 186 to 632, the betweenness centrality gradually decreases. This shows that the academic linkage effect of PPP biased towards the financial economy is weakening. However, these research directions (asset securitization, debt-to-equity swap, etc.) still have a good research heat [56].
- Digital informatization, policy support, and health care jointly drive the development of PPP research. On the one hand, health care sciences and services, computer science, and government and law are the most significant keywords in the growth of betweenness centrality, which have attracted more and more attention from the global academia. On the contrary, technological innovation and application is the research focus needing extra attention, especially in this cross-disciplinary integration of research: information digitization [57], national policy support, and health care services [58,59], etc. Despite the frequency in the literature, these keywords are not among the top, but their academic attention is annually increasing, which will promote the progress of relevant research and has considerable potential for development.
4.2. Strategic Trend Evolution of Theme Word
- I quadrant: this quadrant has a high degree of academic influence, indicating that the theme word has close academic links with other theme words. Simultaneously, it has close internal links. To a certain extent, this shows that such theme words are at the core of the research field. Therefore, this quadrant is the highest influence and the most mature research field.
- II quadrant: the centrality of this quadrant is low, and the density is high. Moreover, it is at the edge of the research field. Although its academic development is relatively mature, the research content in this field does not match the current research hotspots.
- III quadrant: the theme of this quadrant has low centrality and low density. Additionally, the development of this theme is not mature. Although there is a potential development trend, the development is not systematic, and the connection with other themes is relatively loose.
- IV quadrant: the centrality of this quadrant is high and the density is low, indicating that this theme is at the center of the research. Although the research in this quadrant is immature, however, there is a high possibility of emerging topics in this field, with higher novelty index and academic development potential.
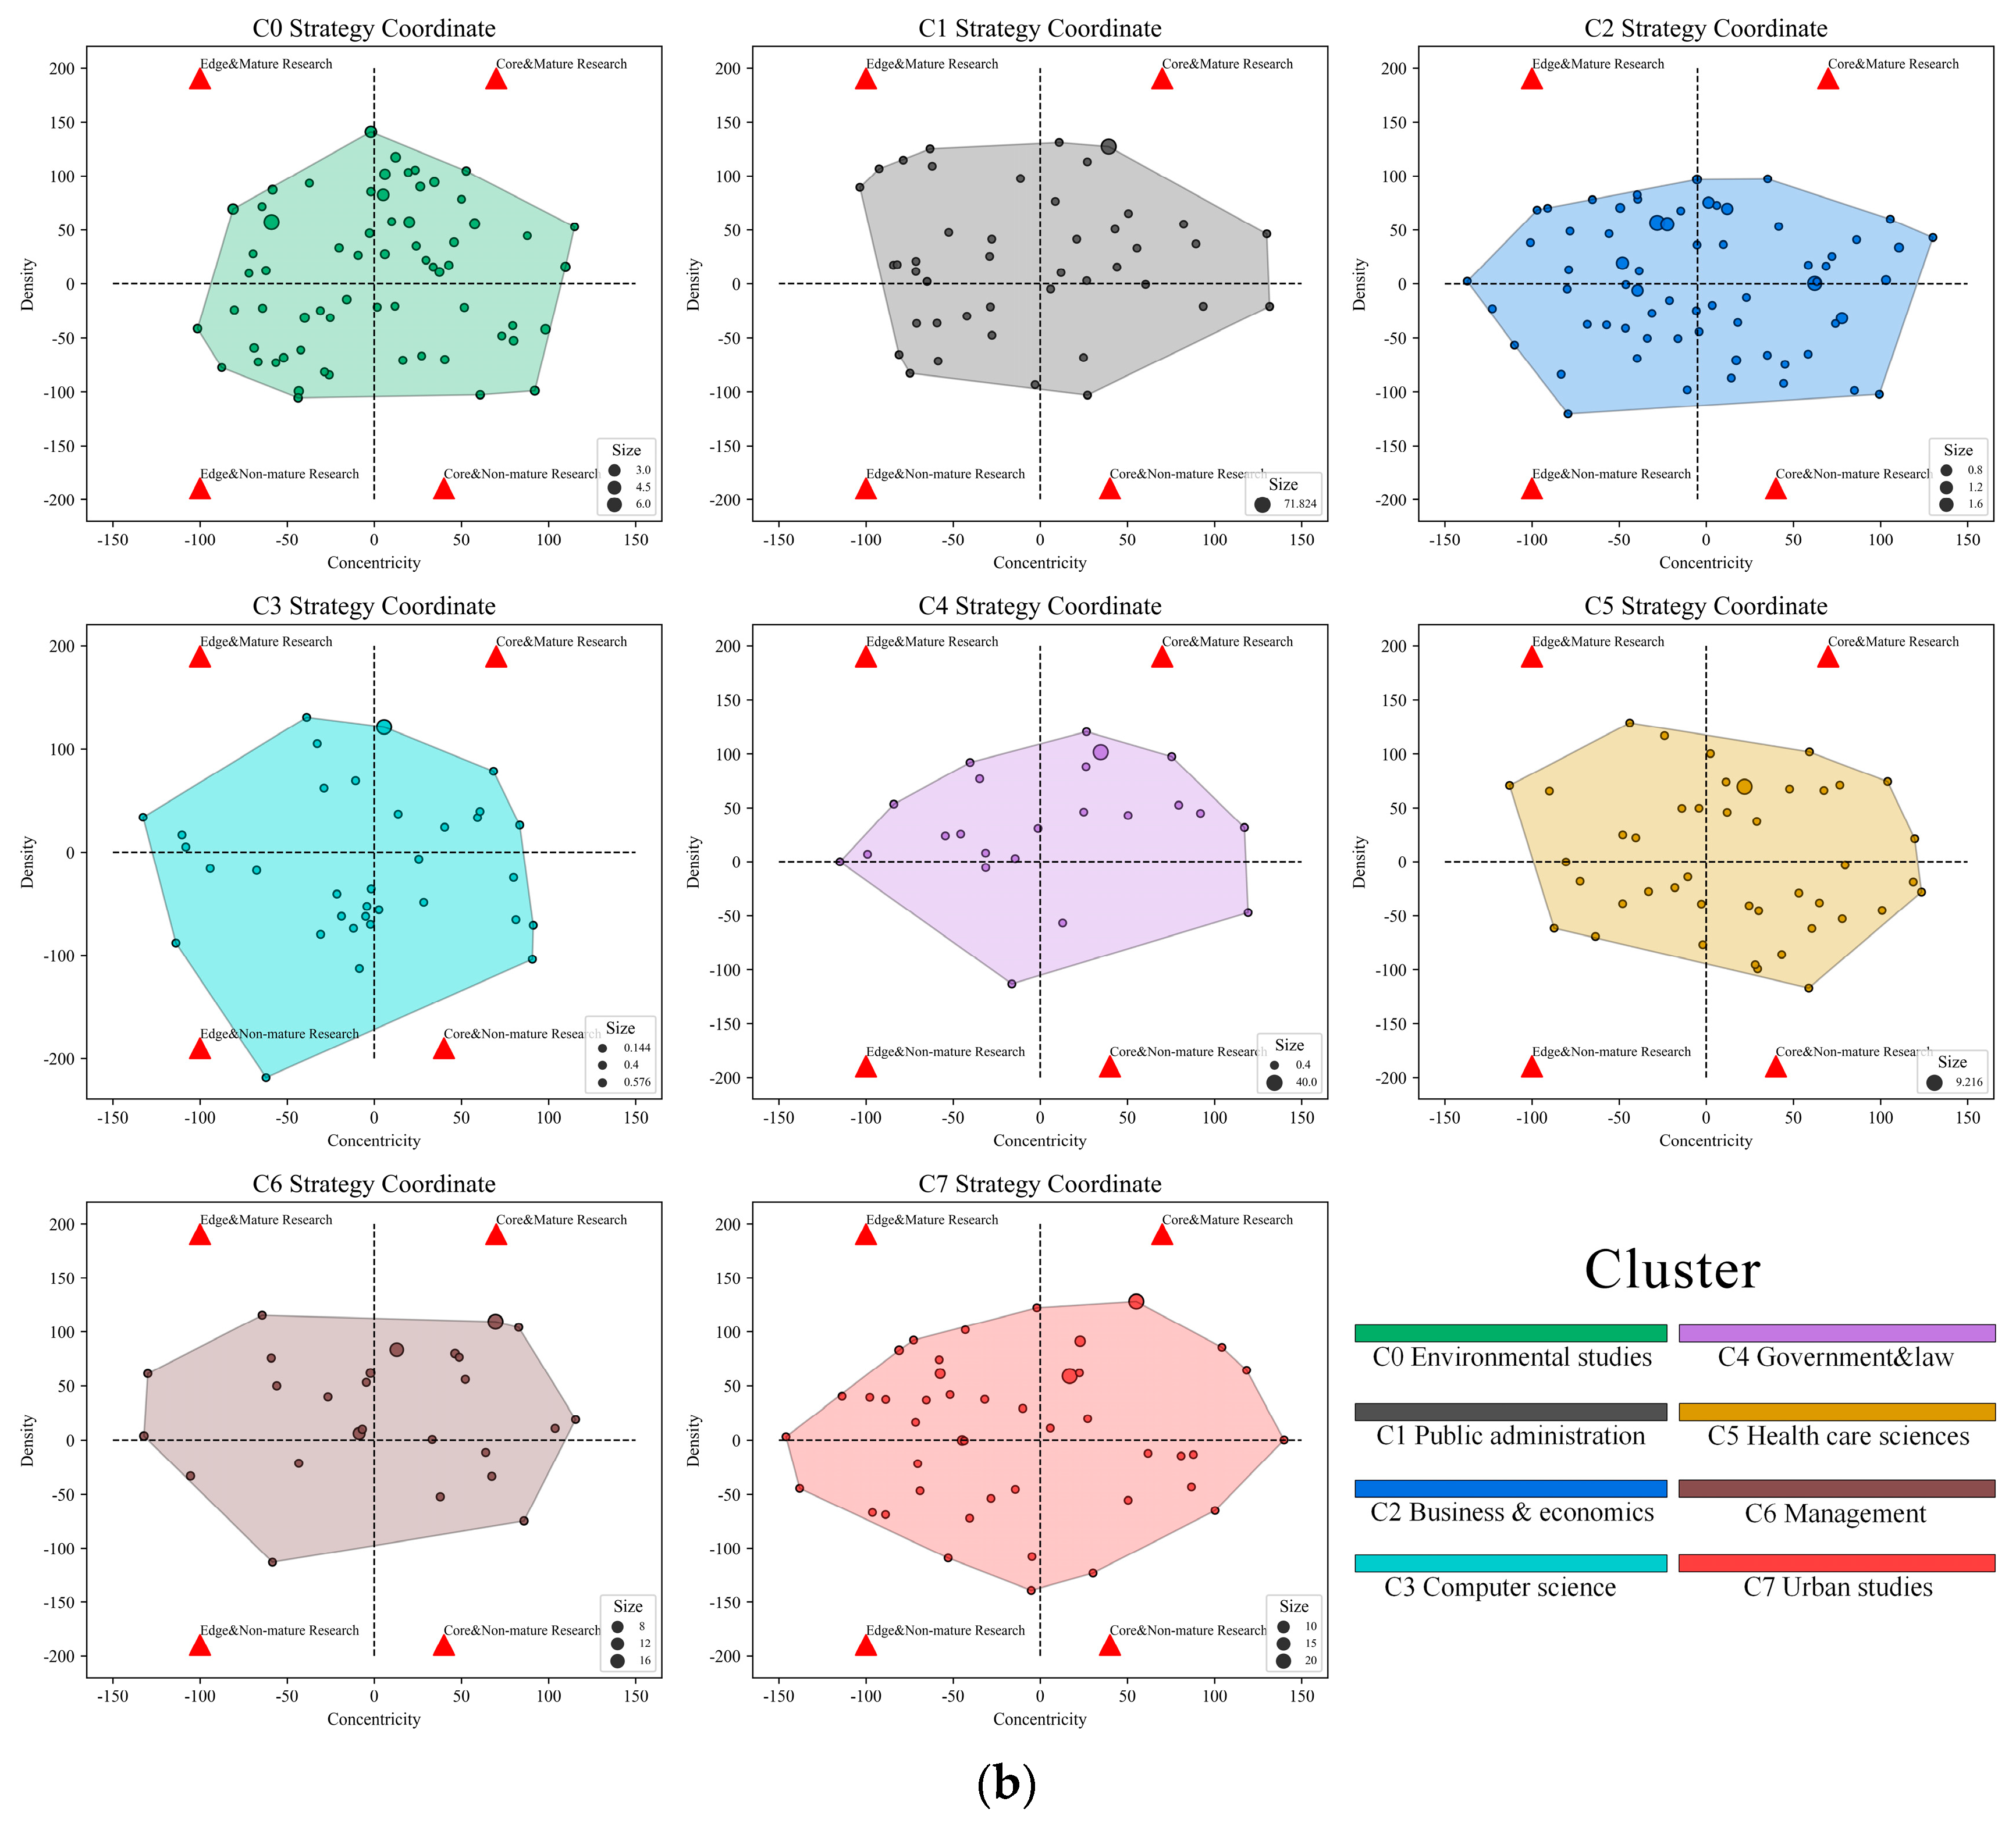
4.2.1. Clustering Division of Theme Words
4.2.2. Core Identification of Theme Words
4.3. Keyword Diversion Prediction
4.3.1. Calculation of Novelty Index
4.3.2. Keyword Prediction
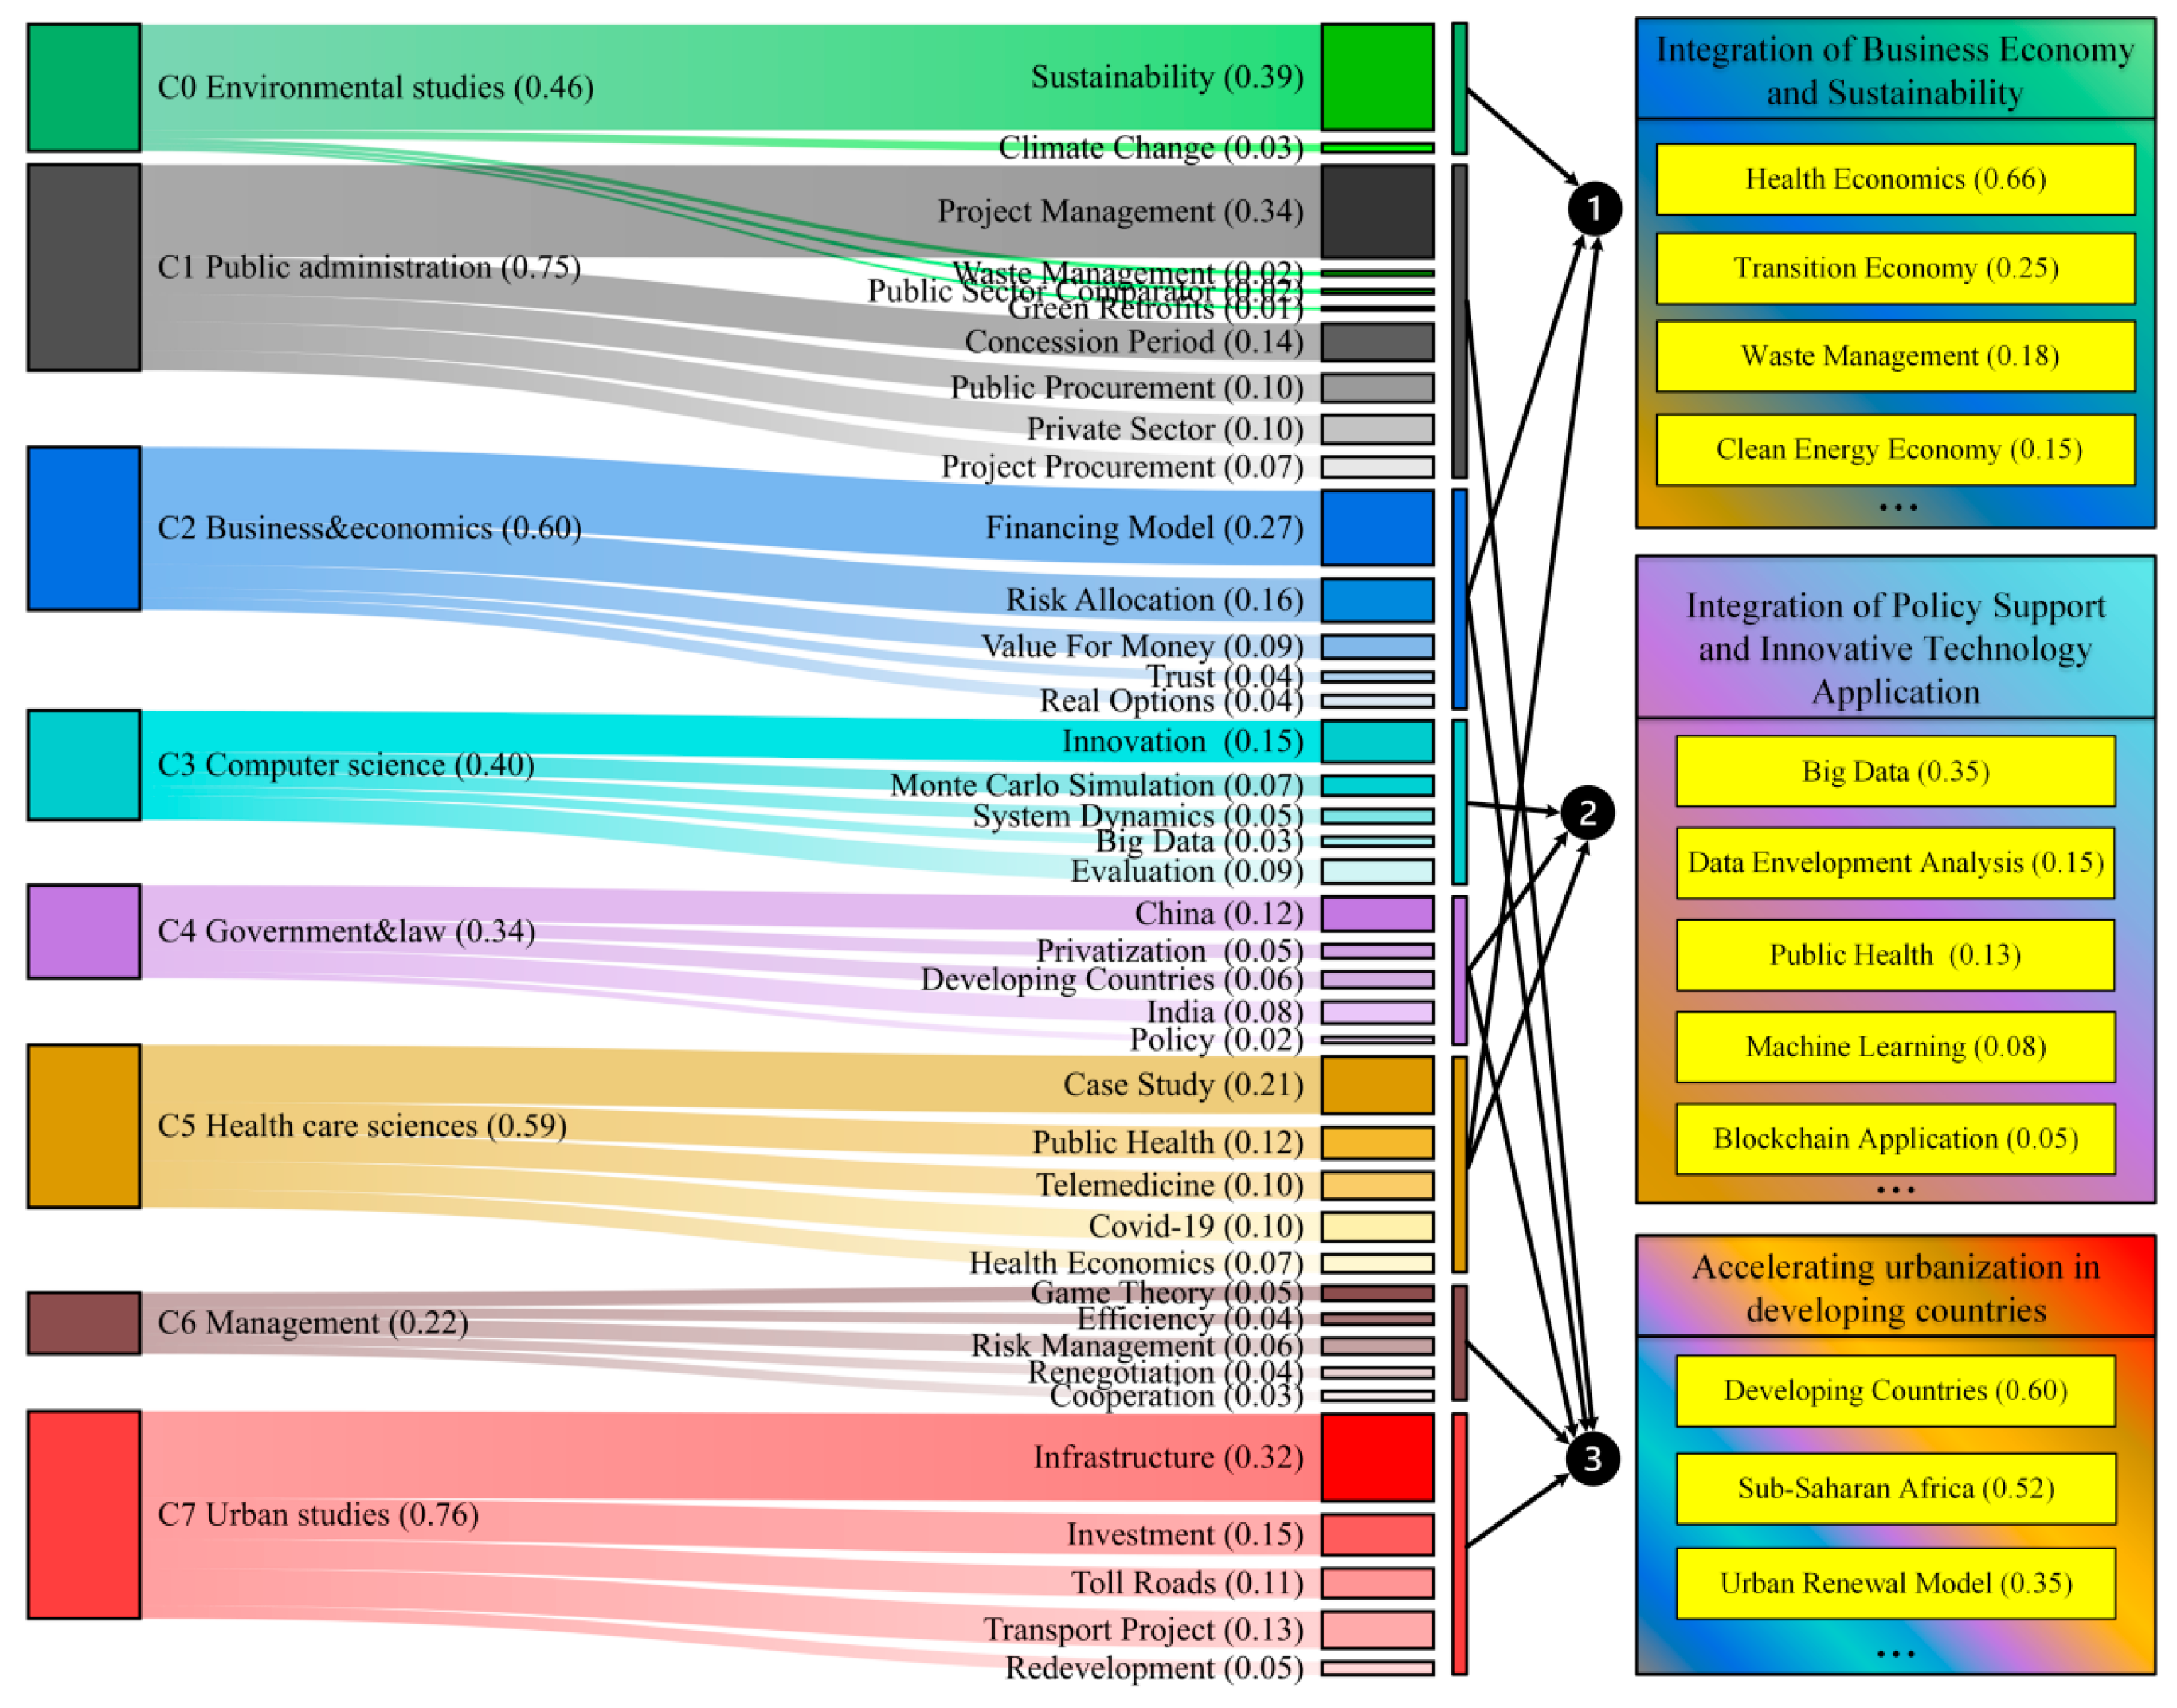
- Integration of business economy and sustainability. A combination of computer science, government and law, and health care sciences. Among them, health economics, transition economy, waste management, and clean energy economy, etc., are the most novel keywords, which indicates the economic sustainability and effective value of the PPP model, and they receive increasing amounts of academic attention from countries and scholars.
- Integration of policy support and innovative technology applications. It is a combination of computer science, government and law, and health care sciences.
- On the one hand, with the progress of the times, scholars’ demand for innovative research is increasing, and the application of advanced technology is more reflected in these aspects: big data, data envelopment analysis, machine learning and blockchain application. Second, the emergence of emerging concepts such as: smart city, data center, etc., also promoted interest in private capital for emerging PPP projects financing. However, policy uncertainty risk is a key influencing factor for many PPP projects. Additionally, the lack of available data analysis will lead to the risk of uncertainty in PPP project evaluation, leading to a reduction in the investment enthusiasm for PPI. Therefore, scientific data analysis and machine learning applications can provide an effective policy guidance for government, so as to realize the intelligent decision-making applications [64].
- On the other hand, the NI of public health also reaches 0.13. The COVID-19 recovery plan has received urgent global attention in recent years [65]. Furthermore, this research also receives extensive academic attention: medical facilities construction, medical service policy, data analysis in medical health, public health management, etc.
- Urbanization in developing countries is a combination of public administration, business and economics, government and law, management, and urban studies. Among them, mainstream PPP research will continue to focus on traditional areas of application in developing countries/regions (Sub-Saharan Africa, China, and India), such as: transport project, urban renewal model, and cooperation mechanism, etc. Moreover, infrastructure will always be the research focus in the field of urban studies. Furthermore, it is still the basic research direction for developing countries and even developed countries in the long-term.
5. Conclusions and Future Work
5.1. Conclusions
- The derivative characteristics of the literature data are explained descriptively. First, we divided global PPP research into three phases: the exploration period, the rapid development, and the steady development period, and verified the rationality. Based on this, more findings were as follows: we identified the main keywords of each period, the mainstream countries for PPP research and research trends, the attention evolution and strategic position of theme words. These provide an important data basis and evolution basis for the prediction of future keywords.
- The evolutionary direction of PPP research can be summarized as economic sustainability, diversity of financing mechanisms, innovation in the application of technology, and the applicability in developing countries. The specific manifestations are, primarily, the integration of business economy and sustainability, as well as transition economy, new energy economy, clean energy economy, and debt-to-equity swap, etc.; and additionally, the integration of policy support and innovative technology applications, such as government intelligent decision-making, big data analysis, smart city, etc.; and ultimately, urbanization in developing countries, such as transportation facilities construction, urban renewal strategy, public sector comparison, etc.
- Moreover, global academic attention to developing countries will become increasingly high, especially in China, India, and Sub-Saharan Africa. In academic cooperation, the willingness of developing countries to cooperate is enhancing. The research direction is more manifested in urban infrastructure construction, cooperation mechanism research, public sector comparison, etc.
5.2. Future Work
Author Contributions
Funding
Institutional Review Board Statement
Informed Consent Statement
Data Availability Statement
Conflicts of Interest
References
- Hernandez-Aguado, I.; Zaragoza, G.A. Support of public–private partnerships in health promotion and conflicts of interest. BMJ Open 2016, 6, e9342. [Google Scholar] [CrossRef] [PubMed]
- Global Infrastructure Hub. InfraCompass 2020. Available online: https://www2.deloitte.com/global/en/pages/public-sector/articles/infracompass-2020.html (accessed on 21 July 2022).
- The World Bank. PPI Database Global Report 2021. Available online: https://ppi.worldbank.org/en/ppi (accessed on 15 August 2022).
- Al-Sharif, F.; Kaka, A. PFI/PPP topic coverage in construction journals. In Proceedings of the 20th Annual ARCOM Conference, Edinburgh, UK, 1–3 September 2004; pp. 711–719. [Google Scholar]
- Ke, Y.; Wang, S.; Chan, A.P.; Cheung, E. Research trend of public-private partnership in construction journals. J. Constr. Eng. Manag. 2009, 135, 1076–1086. [Google Scholar] [CrossRef]
- Song, J.; Zhang, H.; Dong, W. A review of emerging trends in global PPP research: Analysis and visualization. Scientometrics 2016, 107, 1111–1147. [Google Scholar] [CrossRef]
- Zhang, Y.; Luo, W.; Shan, M.; Pan, D.; Mu, W. Systematic analysis of PPP research in construction journals: From 2009 to 2019. Eng. Constr. Archit. Manag. 2020, 27, 3309–3339. [Google Scholar] [CrossRef]
- Sun, Q.; Zhang, S.; Ke, Y.; Ma, X.; Galvin, S. Comparative analysis on the PPP research in Chinese and international journals: A bibliometric perspective. Int. J. Constr. Manag. 2021, 1–21. [Google Scholar] [CrossRef]
- Shi, J.; Duan, K.; Wu, G.; Zhang, R.; Feng, X. Comprehensive metrological and content analysis of the public–private partnerships (PPPs) research field: A new bibliometric journey. Scientometrics 2020, 124, 2145–2184. [Google Scholar] [CrossRef]
- Osei-Kyei, R.; Jin, X.; Nnaji, C.; Akomea-Frimpong, I.; Wuni, I.Y. Review of risk management studies in public-private partnerships: A scientometric analysis. Int. J. Constr. Manag. 2022, 1–12. [Google Scholar] [CrossRef]
- Abdel Aziz, A.M. Successful delivery of public-private partnerships for infrastructure development. J. Constr. Eng. Manag. 2007, 133, 918–931. [Google Scholar] [CrossRef]
- Zhao, L.; Liu, Y.; Chen, L.; Tian, J. Evaluation of Coordination and Coupling Degree of Cross-Regional Influence of the Construction Industry Based on Regional Economic Factors: A Case Study of Beijing, Capital of China. Discret. Dyn. Nat. Soc. 2021, 2021, 6650493. [Google Scholar] [CrossRef]
- Zhao, L.; Liu, Y.; Tian, J. Spatiotemporal evolution law and output prediction of construction waste in the People’s Republic of China. Waste Manag. Res. 2021, 40, 174–184. [Google Scholar] [CrossRef]
- Chen, J.; Yang, S.; Li, H.; Zhang, B.; Lv, J. Research on geographical environment unit division based on the method of natural breaks (Jenks). Int. Arch. Photogramm. Remote Sens. Spat. Inf. Sci. 2013, 3, 47–50. [Google Scholar] [CrossRef]
- Agryzkov, T.; Oliver, J.L.; Tortosa, L.; Vicent, J. A new betweenness centrality measure based on an algorithm for ranking the nodes of a network. Appl. Math. Comput. 2014, 244, 467–478. [Google Scholar] [CrossRef]
- Li, J.; Goerlandt, F.; Reniers, G. An overview of scientometric mapping for the safety science community: Methods, tools, and framework. Saf. Sci. 2021, 134, 105093. [Google Scholar] [CrossRef]
- Abbas, N.N.; Ahmed, T.; Shah, S.H.U.; Omar, M.; Park, H.W. Investigating the applications of artificial intelligence in cyber security. Scientometrics 2019, 121, 1189–1211. [Google Scholar] [CrossRef]
- Bai, X.; Zhang, X.; Li, K.X.; Zhou, Y.; Yuen, K.F. Research topics and trends in the maritime transport: A structural topic model. Transp. Policy 2021, 102, 11–24. [Google Scholar] [CrossRef]
- Guseva, A.; Muraseva, D.; Cheryomushkina, V. Morphological and Genetic Diversity of Scutellaria tuvensis Juz., an Endemic of Desert Steppes. Int. J. Plant Biol. 2022, 13, 473–484. [Google Scholar] [CrossRef]
- Miño, P.; Saffer, A.J. Networks of international public relations production: The case of Latin American organizations’ connections to US agents. Public Relat. Rev. 2021, 47, 102054. [Google Scholar] [CrossRef]
- Broccatelli, C.; Everett, M.; Koskinen, J. Temporal dynamics in covert networks. Methodol. Innov. Online 2016, 9, 1–14. [Google Scholar] [CrossRef]
- Nicholls, K.; Wallace, C. Comparison of sparse biclustering algorithms for gene expression datasets. Brief. Bioinform. 2021, 22, bbab140. [Google Scholar] [CrossRef]
- Pitera, M.; Chechkin, A.; Wyłomańska, A. Goodness-of-fit test for $$\alpha $$ α-stable distribution based on the quantile conditional variance statistics. Stat. Methods Appl. 2022, 31, 387–424. [Google Scholar] [CrossRef]
- Bayliss, K.; Van Waeyenberge, E. Unpacking the public private partnership revival. J. Dev. Stud. 2018, 54, 577–593. [Google Scholar] [CrossRef]
- Akomea-Frimpong, I.; Jin, X.; Osei-Kyei, R.; Tumpa, R.J. A critical review of public–private partnerships in the COVID-19 pandemic: Key themes and future research agenda. Smart Sustain. Built Environ. 2022. ahead-of-print. [Google Scholar] [CrossRef]
- Opara, M.; Rouse, P. The perceived efficacy of public-private partnerships: A study from Canada. Crit. Perspect. Account. 2019, 58, 77–99. [Google Scholar] [CrossRef]
- Wang, Z.; Wang, K.; Liu, J.; Huang, J.; Chen, H. Measuring the innovation of method knowledge elements in scientific literature. Scientometrics 2022, 127, 2803–2827. [Google Scholar] [CrossRef]
- Likun, Z.; Jia, W.; Zhuo, W. Analysis on the Synergy Effectiveness of PPP Policy in China. Proj. Manag. Rev. 2019, 4, 48–53. [Google Scholar]
- Biygautane, M. The institutional context of PPPs: The roles of institutions, organizations, and individual actors. In The Institutional Context of Public–Private Partnerships; Edward Elgar Publishing: Cheltenham, UK, 2022; pp. 21–57. ISBN 1802200142. [Google Scholar]
- Jaslam, P.M.; Bhardwaj, N.; Devi, M.; Singh, V.K.; Anu. Diversity structure analysis based on hierarchical clustering method. In AIP Conference Proceedings; AIP Publishing LLC: Melville, NY, USA, 2022; p. 80003. [Google Scholar]
- Segura-Alabart, N.; Serratosa, F.; Gómez, S.; Fernández, A. Nonunique UPGMA clusterings of microsatellite markers. Brief. Bioinform. 2022, 23, c312. [Google Scholar] [CrossRef]
- Wang, B.; Liang, X.; Gleason, M.L.; Zhang, R.; Sun, G. Genome sequence of the ectophytic fungus Ramichloridium luteum reveals unique evolutionary adaptations to plant surface niche. BMC Genom. 2017, 18, 729. [Google Scholar] [CrossRef]
- Zhang, S.; Gao, Y.; Feng, Z.; Sun, W. PPP application in infrastructure development in China: Institutional analysis and implications. Int. J. Proj. Manag. 2015, 33, 497–509. [Google Scholar] [CrossRef]
- Yurdakul, H.; Kamaşak, R.; öztürk, T.Y. Macroeconomic drivers of Public Private Partnership (PPP) projects in low income and developing countries: A panel data analysis. Borsa Istanb. Rev. 2022, 22, 37–46. [Google Scholar] [CrossRef]
- Henry, R.K.; Yongsheng, Z.; Jun, D. Municipal solid waste management challenges in developing countries–Kenyan case study. Waste Manag. 2006, 26, 92–100. [Google Scholar] [CrossRef]
- Xie, F. Research on Sustainability of Financing Mode and Demand of PPP Project—Based on Chinese PPP and Local Financing Platform Alternative Perspective. Sustainability 2022, 14, 14591. [Google Scholar] [CrossRef]
- Bagui, S.K.; Das, A.; Pandey, Y. Modification of NPV Value Based on Real Option Study. In Proceedings of the Fifth International Conference of Transportation Research Group of India; Springer: Singapore, 2022; pp. 411–420. [Google Scholar]
- Hou, D.; Song, Y.; Zhang, J.; Hou, M.; O’Connor, D.; Harclerode, M. Climate change mitigation potential of contaminated land redevelopment: A city-level assessment method. J. Clean. Prod. 2018, 171, 1396–1406. [Google Scholar] [CrossRef]
- Ballantyne, A.; Stewart, C. Big data and public-private partnerships in healthcare and research. Asian Bioeth. Rev. 2019, 11, 315–326. [Google Scholar] [CrossRef]
- Lund, B.D. Is academic research and publishing still leaving developing countries behind? Account. Res. 2022, 29, 224–231. [Google Scholar] [CrossRef]
- Islam, T.; Kim, K.; Choi, J. Wheat Blast in Bangladesh: The Current Situation and Future Impacts. Plant Pathol. J. 2019, 35, 1–10. [Google Scholar] [CrossRef]
- Wang, M.; Liu, P.; Zhang, R.; Li, Z.; Li, X. A scientometric analysis of global health research. J. Environ. Res. Public Health 2020, 17, 2963. [Google Scholar] [CrossRef]
- Makarenko, I.; Serpeninova, Y.; Pogorila, K. Institutional support for sustainable development financing in the light of the multistakeholder approach. Agric. Resour. Econ. Int. Sci. E-J. 2018, 4, 85–96. [Google Scholar]
- Majeed, M.A.; Yan, C.; Zhong, H. Do firms manipulate earnings after winning public-private partnership bids? Evidence from China. Emerg. Mark. Rev. 2022, 51, 100880. [Google Scholar] [CrossRef]
- Kar, S.; Samal, K. Hydro Economy: Environmental Sustainability of Water and Wastewater Resources and Infrastructure. In Recent Developments in Sustainable Infrastructure (ICRDSI-2020)—GEO-TRA-ENV-WRM; Springer: Berlin/Heidelberg, Germany, 2022; pp. 181–197. [Google Scholar]
- Okoro, C.S.; Musonda, I.; Agumba, J.N. Exploring the underlying structures of sustainability performance measures: A study of transportation projects in South Africa. Int. J. Constr. Manag. 2022, 22, 1550–1558. [Google Scholar] [CrossRef]
- Li, J.; Sun, X.; Dai, X.; Zhang, J.; Liu, B. Knowledge Map Analysis of Industry–University Research Cooperation Policy Research Based on CNKI and WOS Visualization in China. Sustainability 2022, 14, 7862. [Google Scholar] [CrossRef]
- Corell-Almuzara, A.; López-Belmonte, J.; Marín-Marín, J.; Moreno-Guerrero, A. COVID-19 in the Field of Education: State of the Art. Sustainability 2021, 13, 5452. [Google Scholar] [CrossRef]
- Singh, S.K.; Pandey, A.; Bahuguna, A.; Mohapatra, K.K.; Patra, A.; Sathyanarayana, E.; Jatav, H.S.; Jatav, S.S.; Rajput, V.D. Current State of Knowledge in Diagnosis and Mitigation of Micronutrients Deficiency in Crop Production in Indian Prospective; Nova Science Publishers: Hauppauge, NY, USA, 2022; pp. 383–415. ISBN 9781685076146. [Google Scholar]
- Cheng, L. Discussion on the application of PPP model in new infrastructure construction. Open J. Soc. Sci. 2019, 7, 283. [Google Scholar] [CrossRef]
- The Global Infrastructure Hub. In a Post-COVID World, the Future is Digital. Available online: https://www.gihub.org/articles/in-a-post-covid-world-the-future-is-digital (accessed on 21 September 2022).
- Tian, Y.; Minchin, R.E.; Petersen, C.; Moayed, E.; Adriaens, P. Financing Public-Private Partnership Infrastructure Projects through Tokenization-enabled Project Finance on Blockchain. In IOP Conference Series: Materials Science and Engineering; IOP Publishing: Bristol, UK, 2022; p. 12027. [Google Scholar]
- Liu, T.; Mostafa, S.; Mohamed, S.; Nguyen, T.S. Emerging themes of public-private partnership application in developing smart city projects: A conceptual framework. Built Environ. Proj. Asset Manag. 2020, 11, 138–156. [Google Scholar] [CrossRef]
- Saunavaara, J.; Laine, A.; Salo, M. The Nordic societies and the development of the data centre industry: Digital transformation meets infrastructural and industrial inheritance. Technol. Soc. 2022, 69, 101931. [Google Scholar] [CrossRef]
- Wang, Y. Credit Risk Evaluation of Asset Securitization of PPP Project of Sports Public Service Venues Based on Random Forest Algorithm. Comput. Intell. Neurosci. 2022, 2022, 5177015. [Google Scholar] [CrossRef]
- Xu, N.; Kasimov, I.; Wang, Y. Unlocking private investment as a new determinants of green finance for renewable development in China. Renew. Energy 2022, 198, 1121–1130. [Google Scholar] [CrossRef]
- Wang, Y.; Xiao, Z.; Tiong, R.L.; Zhang, L. Data-driven quantification of public–private partnership experience levels under uncertainty with Bayesian hierarchical model. Appl. Soft Comput. 2021, 103, 107176. [Google Scholar] [CrossRef]
- Ho, M.K. Total joint replacement surgeries: Making the case for a public–private partnership in Hong Kong. World Med. Health Policy 2022, 14, 600–608. [Google Scholar] [CrossRef]
- Ganapathy, K.; Das, S.; Reddy, S.; Thaploo, V.; Nazneen, A.; Kosuru, A.; Shankar Nag, U. Digital health care in public private partnership mode. Telemed. E-Health 2021, 27, 1363–1371. [Google Scholar] [CrossRef]
- Kwayu, K.M.; Kwigizile, V.; Lee, K.; Oh, J.; Nelson, T. Automatic topics extraction from crowdsourced cyclists near-miss and collision reports using text mining and Artificial Neural Networks. Int. J. Transp. Sci. Technol. 2022, 11, 767–779. [Google Scholar] [CrossRef]
- Shen, Z.; Ji, W.; Yu, S.; Cheng, G.; Yuan, Q.; Han, Z.; Liu, H.; Yang, T. Mapping the knowledge of traffic collision Reconstruction: A scientometric analysis in CiteSpace, VOSviewer, and SciMAT. Sci. Justice 2022, 63, 19–37. [Google Scholar] [CrossRef]
- Yang, J.; Lu, W.; Hu, J.; Huang, S. A novel emerging topic detection method: A knowledge ecology perspective. Inform. Process. Manag. 2022, 59, 102843. [Google Scholar] [CrossRef]
- Chen, X.; Cheng, G.; Wang, F.L.; Tao, X.; Xie, H.; Xu, L. Machine and cognitive intelligence for human health: Systematic review. Brain Inform. 2022, 9, 1–20. [Google Scholar] [CrossRef]
- Zhao, L.; Yang, S.; Wang, S.; Shen, J. Research on PPP Enterprise Credit Dynamic Prediction Model. Appl. Sci. 2022, 12, 10362. [Google Scholar] [CrossRef]
- Karakosta, C.; Mylona, Z.; Karásek, J.; Papapostolou, A.; Geiseler, E. Tackling covid-19 crisis through energy efficiency investments: Decision support tools for economic recovery. Energy Strategy Rev. 2021, 38, 100764. [Google Scholar] [CrossRef]


| Comparison of Literature Quantity | Comparison of Betweenness Centrality | |||||
|---|---|---|---|---|---|---|
| Rank | Numbers | Centrality | Year | Country | Centrality | Country |
| 1 | 902 | 0.55 | 1989 | The USA | 0.55 | The USA |
| 2 | 815 | 0.05 | 2000 | China | 0.36 | The UK |
| 3 | 630 | 0.36 | 1992 | The UK | 0.13 | Italy |
| 4 | 355 | 0.11 | 1998 | Australia | 0.12 | The Netherlands |
| 5 | 270 | 0.02 | 2003 | India | 0.12 | Canada |
| 6 | 265 | 0.12 | 1999 | The Netherlands | 0.11 | Australia |
| 7 | 256 | 0.06 | 2002 | Russia | 0.10 | Germany |
| 8 | 194 | 0.12 | 2003 | Canada | 0.06 | Russia |
| 9 | 191 | 0.13 | 1996 | Italy | 0.05 | China |
| 10 | 144 | 0.10 | 1998 | Germany | 0.02 | India |
| Total Count (2017–2022) = 2922 | |||||
|---|---|---|---|---|---|
| Cluster | Theme Words | Keywords (Top 5) | Frequency | Rate | Rank |
| C0 | Environmental studies | Sustainability, Climate Change, Waste Management, Public Sector Comparator, Green Retrofits | 616 | 0.211 | 2 |
| C1 | Public administration | Project Management, Concession Period, Public Procurement, Private Sector, Project Procurement | 434 | 0.149 | 3 |
| C2 | Business and economics | Financing Model, Risk Allocation, Value For Money, Trust, Real Options | 659 | 0.226 | 1 |
| C3 | Computer science | Innovation, Monte Carlo Simulation, System Dynamics, Big Data, Evaluation | 288 | 0.099 | 5 |
| C4 | Government and law | China, Privatization, Developing Countries, India, Policy | 185 | 0.063 | 7 |
| C5 | Health care sciences | Case Study, Public Health, Telemedicine, COVID-19, Health Economics | 273 | 0.093 | 6 |
| C6 | Management | Game Theory, Efficiency, Risk Management, Renegotiation, Cooperation | 304 | 0.104 | 4 |
| C7 | Urban studies | Infrastructure, Investment, Toll Road, Transport Project, Redevelopment | 163 | 0.056 | 8 |
Disclaimer/Publisher’s Note: The statements, opinions and data contained in all publications are solely those of the individual author(s) and contributor(s) and not of MDPI and/or the editor(s). MDPI and/or the editor(s) disclaim responsibility for any injury to people or property resulting from any ideas, methods, instructions or products referred to in the content. |
© 2023 by the authors. Licensee MDPI, Basel, Switzerland. This article is an open access article distributed under the terms and conditions of the Creative Commons Attribution (CC BY) license (https://creativecommons.org/licenses/by/4.0/).
Share and Cite
Zhao, L.; Yang, S.; Wang, S. Data-Driven Evolution Analysis and Trend Prediction of Hotspots in Global PPP Research. Buildings 2023, 13, 206. https://doi.org/10.3390/buildings13010206
Zhao L, Yang S, Wang S. Data-Driven Evolution Analysis and Trend Prediction of Hotspots in Global PPP Research. Buildings. 2023; 13(1):206. https://doi.org/10.3390/buildings13010206
Chicago/Turabian StyleZhao, Likun, Shaotang Yang, and Shouqing Wang. 2023. "Data-Driven Evolution Analysis and Trend Prediction of Hotspots in Global PPP Research" Buildings 13, no. 1: 206. https://doi.org/10.3390/buildings13010206
APA StyleZhao, L., Yang, S., & Wang, S. (2023). Data-Driven Evolution Analysis and Trend Prediction of Hotspots in Global PPP Research. Buildings, 13(1), 206. https://doi.org/10.3390/buildings13010206