1. Introduction
One of the most important industries worldwide is the power sector. Nowadays, electricity is a necessity for all economic, health, educational, and industrial development. Electricity is involved in everyday human activity, either directly or indirectly. Blackouts are caused by a variety of factors such as transmission line overloads, high demand levels with low energy production, mistakes in load forecast, meteorological events, maintenance problems, cyber-attacks, terrorist or criminal actions, and dispatching mistakes [
1]. Given the increased reliance on electricity, in the event of a blackout, a great number of everyday human activities are affected. For instance, the traffic control in big cities will stop working, leading to street chaos, while industries will stop their operation, and telecommunications may be disrupted. Crucial electrical equipment at hospitals will not work, such as artificial respirators, while people will be locked in elevators or inside transportation means [
2]. The economic impact will be enormous since there will be production and financial losses [
3].
Blackouts happen frequently every day all around the world [
4]. Most are brief, concerning a small area and have little impact on consumers who lack access to electricity [
5]. However, significant blackouts have occurred throughout the past 20 years [
6,
7] around the globe, with a significant impact. Since this work is focused on the European Transmission System,
Table 1 includes all major blackouts of the past 20 years in the European interconnected system.
Although the major concern is to prevent blackouts, the causes of them are frequently highly complex and may even result in a complete system shutdown. If this occurs, a prompt and safe restoration procedure must be followed. The electrical interconnections between European countries have helped to stabilize the system of each country participating in it. Therefore, cases in which a possible large deviation in production would lead to a frequency disturbance (under-frequency or over-frequency) [
26] and to blackouts, these deviations can now be addressed through the interconnections and in a second phase with the units that are in regulation [
27].
Although the power system of almost every European country is interconnected with other countries and there are directions from the European Network of Transmission System Operators for Electricity (ENTSO–E) [
28,
29,
30,
31,
32,
33,
34,
35] for the most reliable operation of the European grid, there is always the possibility of a major disturbance or, even worse, a total blackout. The operation of the European TSOs within the framework of ENTSO-E is presented in this work, demonstrating the benefits to the security and reliability of the system. The war in Ukraine and the problem in natural gas supply [
36] increased the possibility that such an event may soon occur, since Europe is not energy self-sufficient. Additionally, the scenario of a cyber-attack or a terrorist action is always a parameter that can cause a blackout [
21,
22,
23,
24]. These rare and unpredictable scenarios that may cause a major blackout are identified and analyzed, to an extent, in this paper. The remedial actions that the European TSOs should follow to prevent the catastrophic event of the blackout are also presented. At the end of this work a new restoration strategy is proposed, using the A* Algorithm. The proposed strategy has been validated both in the IEEE-39 and IEEE-68 bus systems.
The objectives of restoration are to reduce losses and restoration time, minimize negative effects on society, and enable the power system to return to normal conditions safely and quickly. To achieve the aforementioned objectives, numerous non-structured approaches, technologies, and object-oriented expert systems have been used in the creation of restoration schemes [
37]. Some heuristic algorithms, such as genetic algorithms [
38], artificial neutral networks [
39], and fuzzy logic [
40], are used for system restoration with the growth of computational intelligence. Multi-agent technologies [
41,
42,
43,
44] have been developed based on the regional distribution features in space. Decision support systems [
45] have been successfully proven as an extension of expert systems and heuristic rules.
The backbone network must be built step by step, and each step’s restoration path optimization must reduce the cost of forming the target network while taking limits into account. Each study has a distinct element in this area. In [
46], the weight coefficient is modeled and evaluated with respect to each transmission line, using the data envelopment analysis method that incorporates preference information. Two reliable optimization models are proposed in [
47] to reduce overall line restoration risk, while considering the risk of transmission line failure. These models are applied to the series and parallel restoration stages, respectively. A network reconfiguration technique based on the weighted complex network model is suggested in [
48]. At the same time, the ideal skeleton network and restoration path sequence can be achieved. According to the characteristics of hierarchical scheduling in the power system, Ref. [
49] provides a hierarchical collaborative optimization approach. The goals are described as total power generation and network reconfiguration level. It combines overall searching of the feed point index value with hierarchical optimization, greatly reducing the size scale of the problem. According to their expected performance characteristics, all feasible restoration paths are ranked in [
50], using two different forms of restoration performance parameters. In case these remedial actions do not prevent the blackout event, each TSO must have a restoration plan to supply the power consumers quickly and safely. Therefore, since there is always a great possibility for a blackout to occur, this work focuses on the development of a new restoration strategy, implementing the efficient A* Algorithm. The restoration procedure varies for transmission lines and non-black start (NBS) units. There have been numerous local and international studies conducted, and every Transmission System Operator (TSO) employs a unique restoration process [
51,
52]. In Australia, the goal of the Australian Energy Market Operator (AEMO) is to restart major generators within 90 min after a total blackout and to reach 40% of the system’s peak load within four hours [
53,
54,
55]. The Pennsylvania New Jersey Maryland (PJM) TSO in the USA plans to undertake the system restoration with a priority on system stability and to restore 80% of the total system load in 16 h [
56,
57].
This study begins with a brief presentation of ENTSO-E and the advantages it provides to all participating countries to ensure the European Union’s energy policy objectives of affordability, sustainability, and security of supply. Moreover, it describes the safety criteria of the European Transmission System, the defense plans, and the remedial actions that every TSO must have prepared to prevent a major blackout. A blackout analysis follows, and the phase-by-phase progression of a blackout is presented. Then, a careful examination of the event on 8 January 2021, when the European electrical system split into two separate electrical systems [
26], is given. Different initial power system states and how the European system would be affected are investigated. This work tries to find similarities between past blackouts and the state of the European power grid in 2022 and to present possible scenarios that could lead to a blackout in a wide area in Europe (e.g., one or more countries) or the whole Europe. Finally, a system restoration methodology is presented. It considers the minimization of the restoration time, using both black start (BS) units and tie lines from neighboring TSOs, creating separate islands which will finally be synchronized. A three-stage restoration strategy is proposed to manage this process: start-up of main units (with priority in the BS units), restoration of interconnection transmission lines, and restoration of important loads (less important load will be restored afterwards). The proposed algorithm is fast enough, and it succeeds in using all available sources to start the NBS units, supplying the first critical loads and then the rest of the power that consumers need.
3. Operation of the European Transmission System
3.1. Stability of the Power System
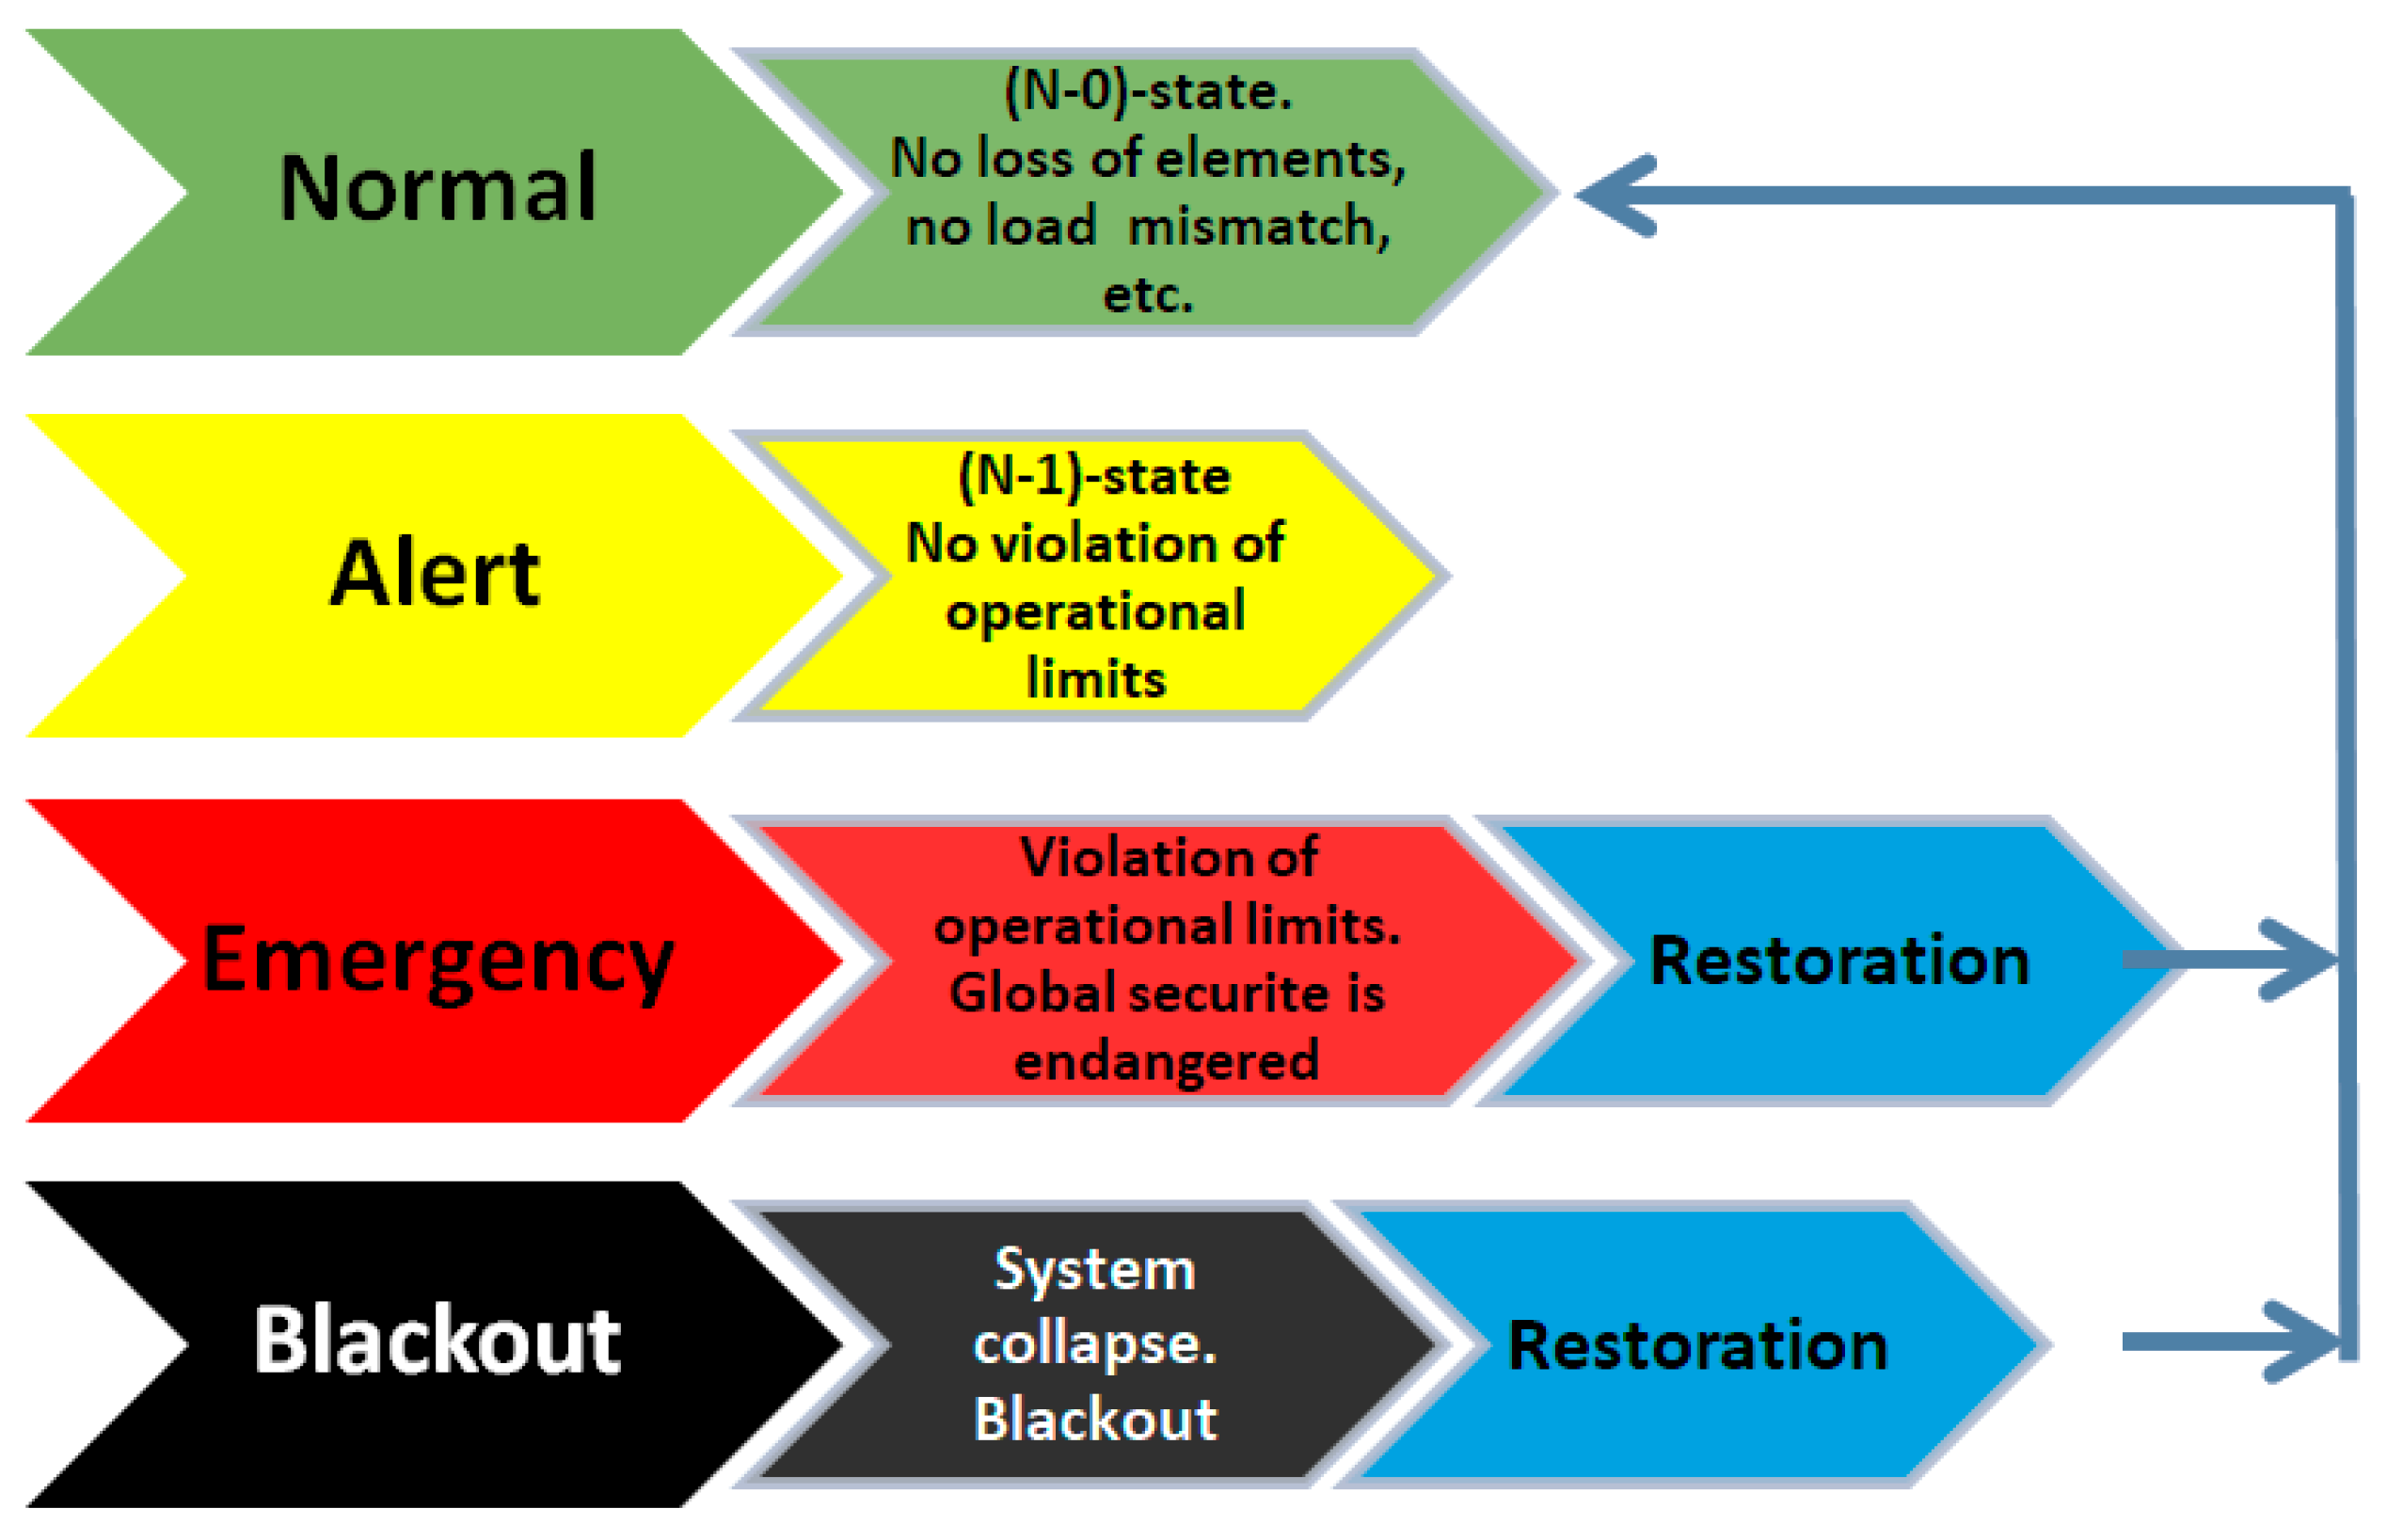
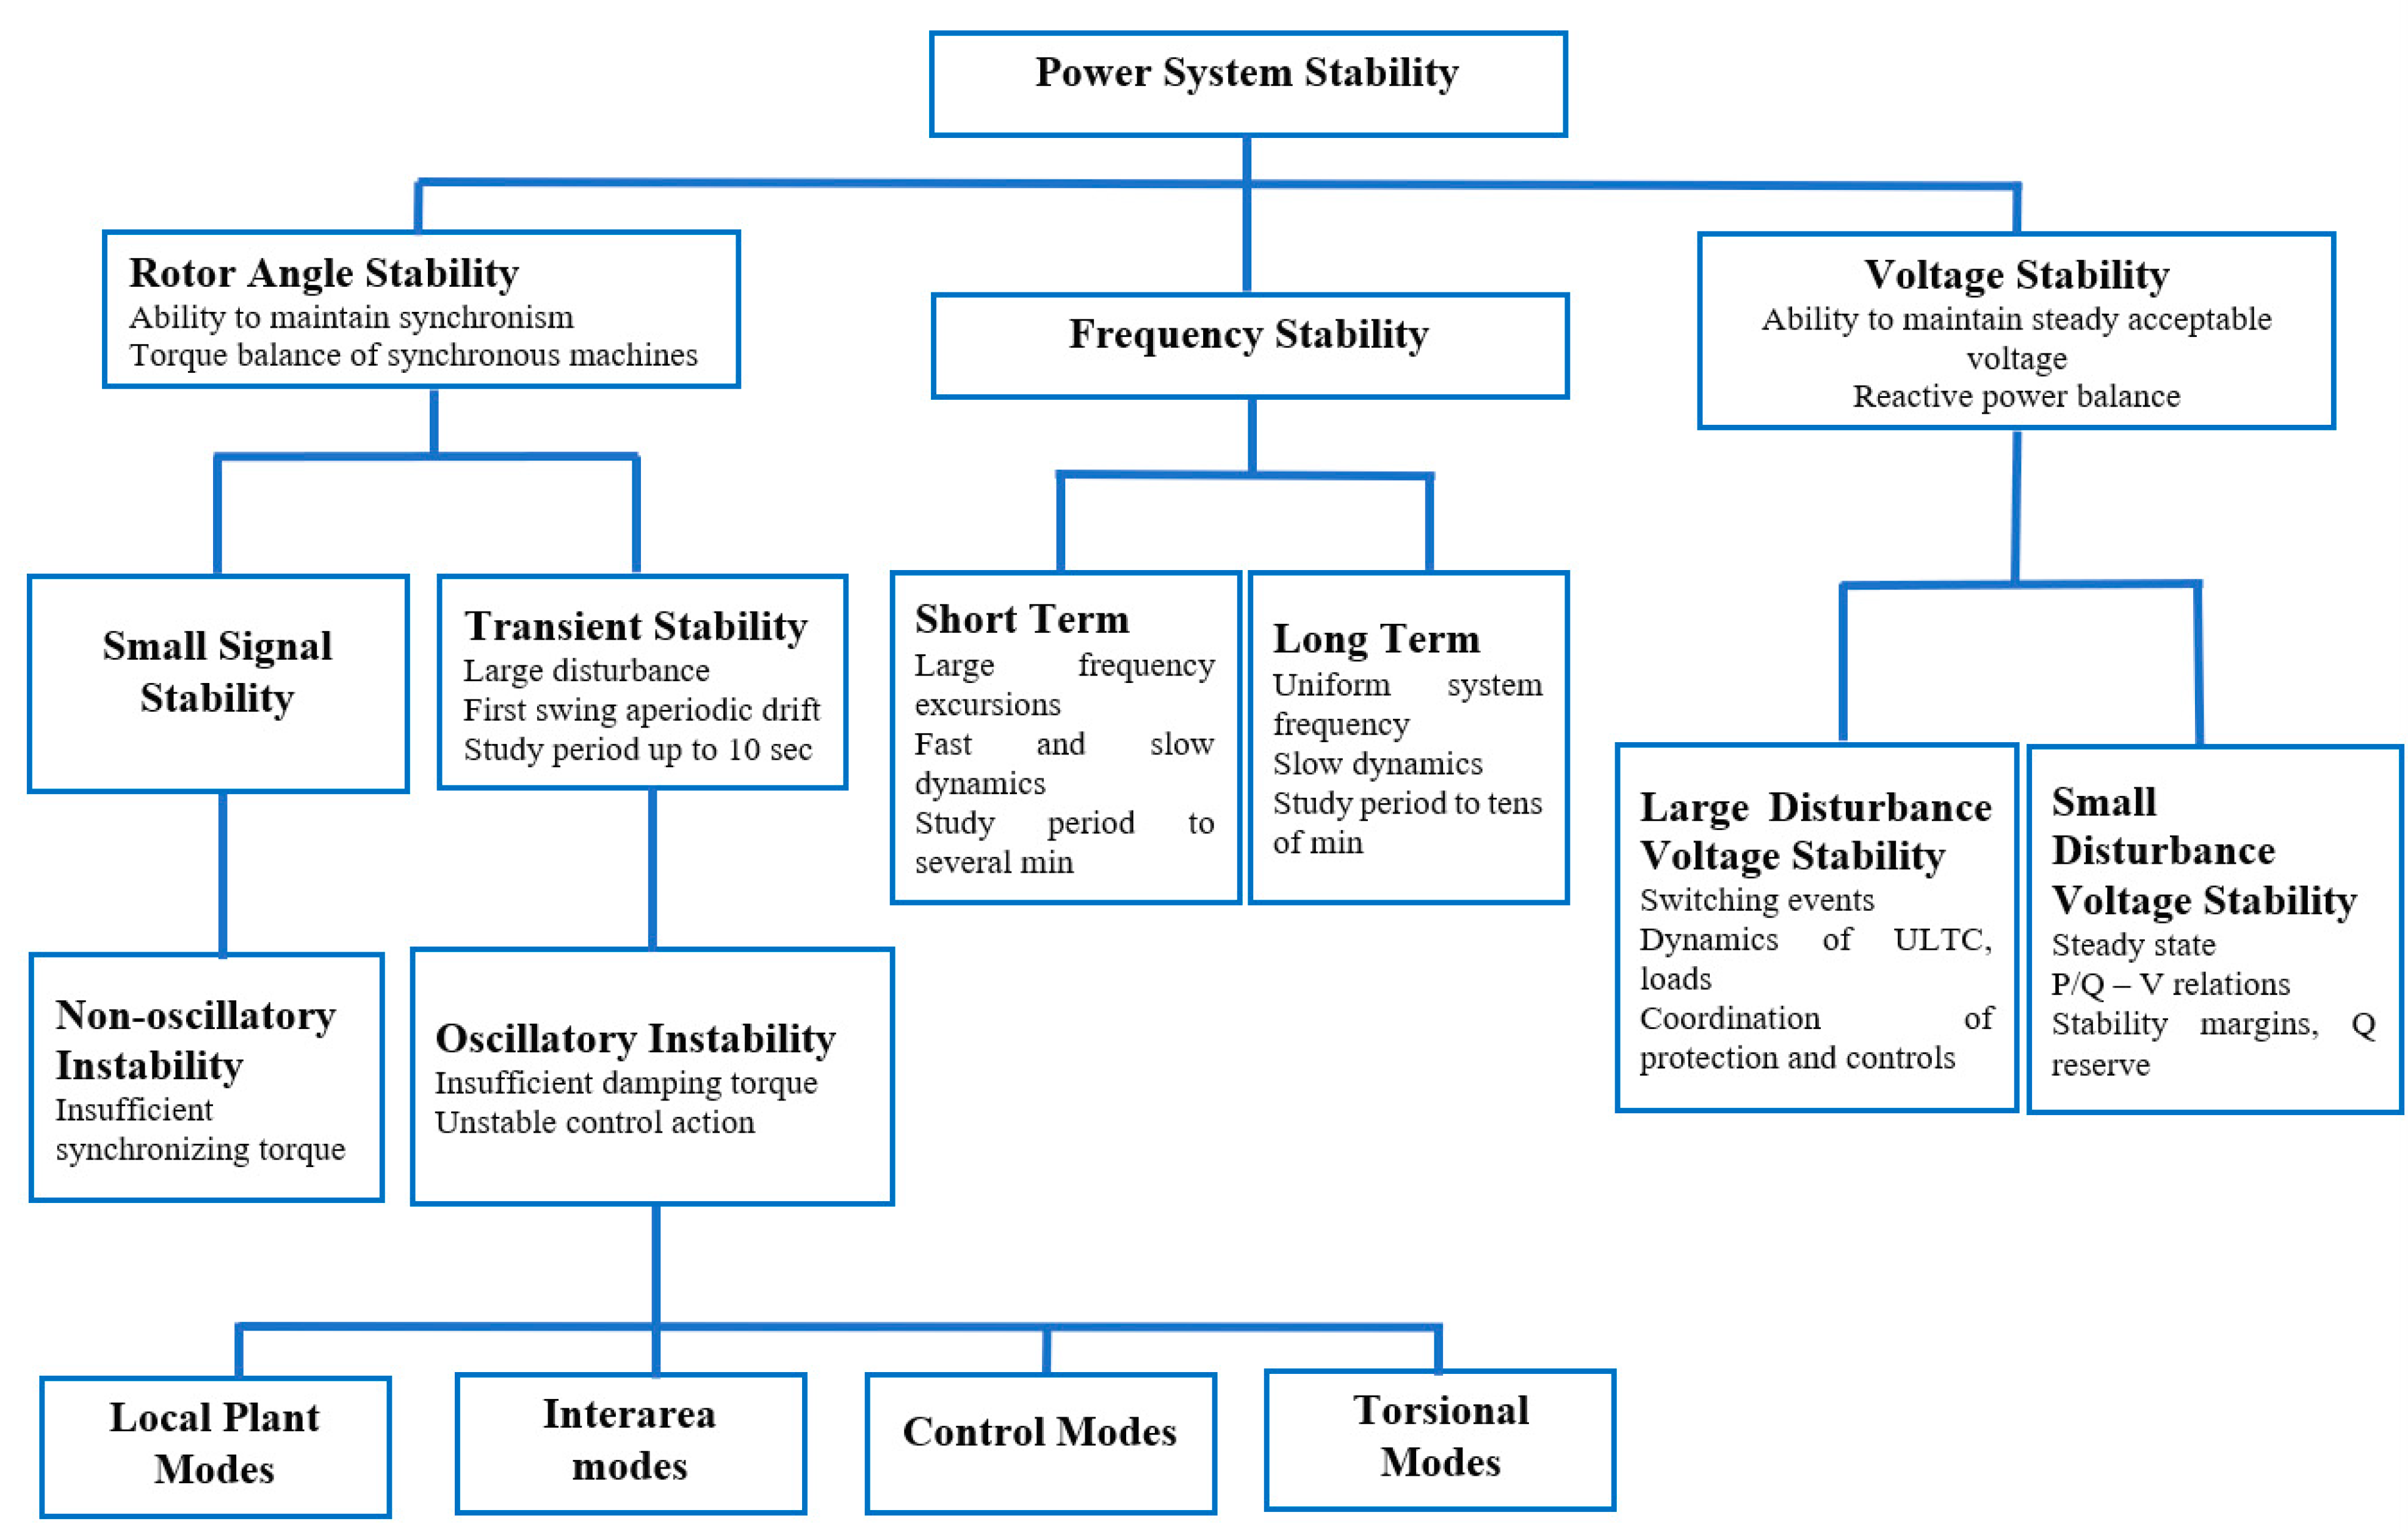
Figure 1 depicts the main conditions which may lead a power system to an emergency state and finally to a blackout, according to CIGRE definitions [
69]. In order to build suitable design and operating techniques, it is essential to categorize the problem to comprehend its underlying causes. All these unstable state phenomena can occur sequentially or simultaneously during significant disruptions in a complicated way. This is valid in cases where systems are operating at their limits.
Rotor angle stability in an interconnected power system is the ability of synchronous machines to maintain synchronism in the face of a disruption. The ability of each synchronous machine to maintain or restore mechanical and electromagnetic torque equilibrium will determine how well the system works. One type of instability that may happen is when some generators’ angular swings increase to the point where they no longer synchronize with other generators. The ability of the power system to retain synchronism under minor disruptions is addressed by rotor angle stability. Both the system’s initial operating state and the magnitude of the disruption affect transient stability.
Frequency stability is the capacity of a power system to retain consistent frequency after a major system upset leading to a considerable imbalance between generation and load. With the least degree of inadvertent load loss, it depends on the capacity to maintain or restore equilibrium between system generation and load. Sustained frequency fluctuations can cause unit generators and/or loads to trip, which can lead to instability.
The capacity of a power system to maintain constant voltages across all buses following a disturbance from a specific starting operating condition is referred to as voltage stability. It depends on the power system’s capacity to preserve or restore the balance between load supply and demand. A gradual decrease or increase in some buses’ voltages may cause instability. Instability of the voltage can result in cascading outages by causing a loss of load in a particular area or tripping of transmission lines and other elements by their protective mechanisms. Due to these interruptions or operating conditions that exceed the field current limit, some generators may lose synchronism.
3.2. Awareness of System States
For any power system, knowing its status is of primary importance. The different states of a power system depend on the size of the network, the levels of load/frequency risk, as well as the necessary actions to limit the propagation of faults in the network [
32]. There are four system state situations:
Normal State: It is the operating state in which the system is within the limits of its safe operation, in steady state and after the occurrence of any emergency, considering the effect of remedial actions that are available [
30].
Alert State: It is the operating state in which the system is within its safe operating limits, but an emergency has been identified for which the remedial actions are not enough to maintain the normal operating state.
Emergency State: It is the operating condition in which the safe operating limits of the system have been violated and at least one of the operating parameters is outside its limit.
Blackout State: It is the system’s condition where part or all of the transmission system is out of service.
In
Figure 2, all the above system states are illustrated.
Finally, the Restoration State is defined as the system state in which all actions are aimed at restoring operation of the transmission system and maintaining the safe operation of the system after a blackout or emergency state.
3.3. N-1 and N-2 Criteria
The basic security criterion N-1 in network design states that network security must be ensured if an element may fail or is about to fail in a network operating at maximum intended transmission and power supply levels [
30]. This means that in this case, there should be no supply interruptions or fault spread. In addition, the voltage must remain within the permitted limits and the remaining components must not be overloaded. This constraint criterion is generally accepted at all levels of the network. However, supply interruptions are tolerable to some extent in the distribution network depending on the customer profile and if they can be rectified within a specified period. On the other hand, there are more vulnerable areas of the transmission network, where another measure is applied in addition to the N-1 criteria, when particularly sensitive customers such as plants in the chemical industry or steel industry must be supplied, or when a fault can lead to a larger-scale disorder or a dangerous situation. In this case, the network is designed in such a way in order to guarantee the network’s security even if one element shuts down for operational reasons and another fails at the same time (case N-2).
3.4. The European Awareness System (EAS)
The exchange of real-time data between Transmission System Operators is made possible by the EAS technology platform [
70]. Various measurements, including frequency and cross-border exchange, are entered by all operators. Their results are then provided to show the status of each TSO on the platform across all Europe. EAS is required to:
Foresee the consequences of developments in the systems of neighboring TSOs that must be considered.
Prevent the extension of the phenomenon and restrict the extension of an unsettling scenario.
Request the use countermeasures between TSOs to reduce the effects of a disturbance.
Plan defense, recovery, resynchronization, and reactivation procedures.
Transfer the required data through a fast, reliable, and unambiguous means of communication.
3.5. Regional Coordination Centers
Communication between TSOs is in English [
71]. Article 37 of the Electricity Regulation [
72] established Regional Coordination Centers (RCCs), which replaced the regional security coordinators (RSCs) described by the System Operation Guideline [
73] on 1 July 2022. RCCs cover RSC tasks and they are responsible for:
Assisting in the consistency evaluation of the defense and recovery strategies of the TSOs.
Coordinating regional outage planning.
Conducting post-operation and post-disturbance analyses.
Training and certifying the personnel of the RCC.
3.6. Defense Plan
The RG CE Defense Plan consists of the defense plans of every TSO, based on their regulations. Defense plans are a collection of coordinated actions designed to preserve system safe operation in the case of unexpected operating conditions brought on by severe disturbances, which will be developed under the supervision of the National Control Centers of each TSO. The system is in unsafe operating conditions, when the backup means (in the event of a production shortage) and the predetermined corrective actions might not be sufficient for safe operation of the system (e.g., following malfunction of a power system element or multiple contingencies events). As a result, critical magnitudes (e.g., frequency or voltage) may be beyond limits. To prevent the loss of stability of the RG CE system or any of its parts, a unified defense plan for RG CE must be developed. Technical suggestions and guidelines for automatic steps to handle critical system operating circumstances will both be part of this plan. The set of regulations must be created in accordance with a variety of natural events that affect every TSO or have a broad impact on the RG CE system. A comprehensive strategy that will be applied in transmission, distribution, and generation must be established.
The following
Table 3 includes the remedial actions for a power system in case of an emergency.
4. Blackout Analysis
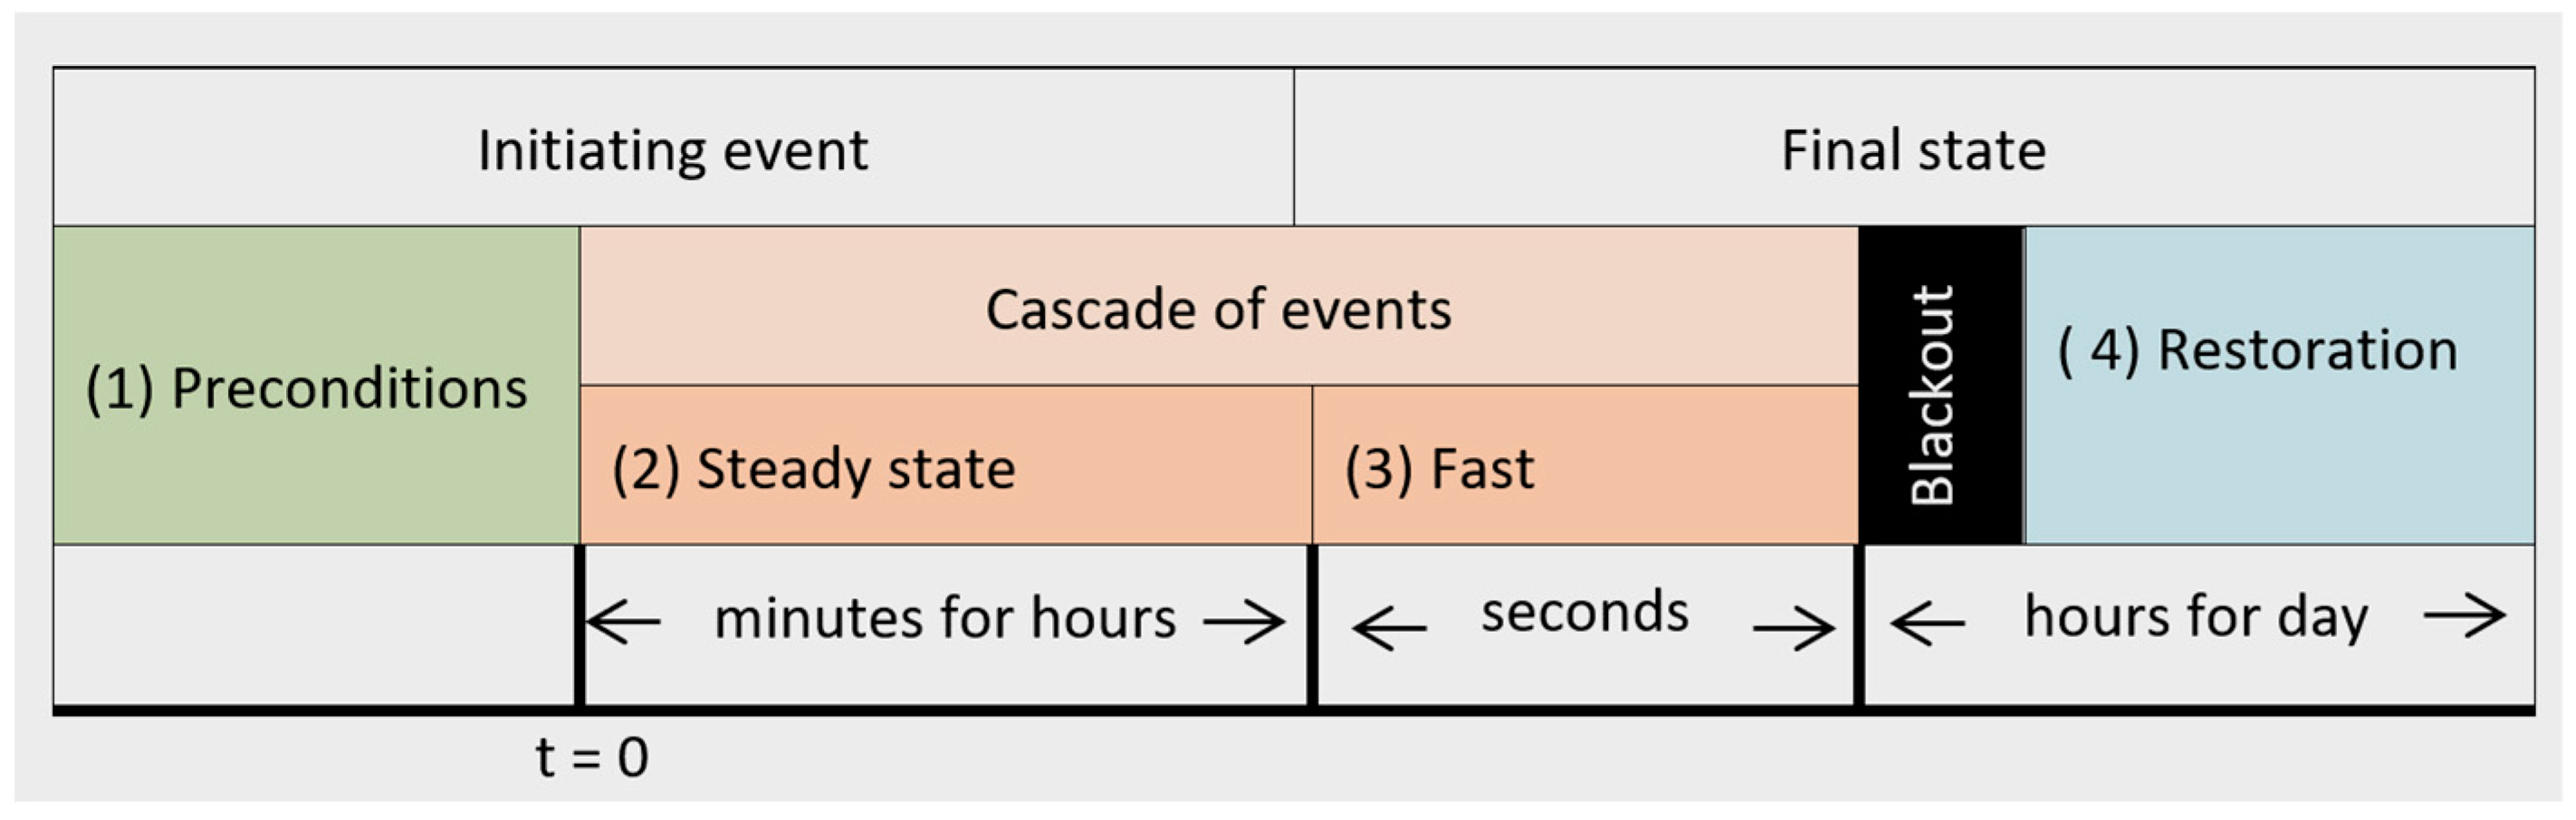
The real process leading to a blackout entails a complicated series of actions.
Figure 3 illustrates the four phases of the cascade events until a blackout occurs, according to [
74,
75,
76]. The first period before any significant disruption is referred to as (1) preconditions. A series of triggering events that destabilize and unbalance the electricity grid cause the blackout to occur. This initial disturbance spreads through a series of actions that might last anywhere from seconds to hours. Typically, the cascade can be split into (2) steady state (slow) and (3) fast. Unserved loads, power generation shedding, and the number of affected persons can be assessed after the ultimate stage of the blackout. From this point on, the system begins (4) restoration, which might take from minutes to many days.
4.1. Preconditions
In the following paragraphs is an analysis of the preconditions that may exist before the initiation of a severe event in the power system. Each precondition has a unique abbreviation that will be used in this work.
4.1.1. Peak Demand and Errors in Renewable Energy Sources (RES) Forecast (PREC_1)
In the past, blackouts typically occurred at times of high demand (typically in the winter or summer), when the system is stressed from the heavy load and operates near its operating and stability limits. That was the cause of the Greek blackout in July 2004, referred to in
Table 1. During the past few years, the great penetration of RES in the European system has increased the jeopardy of a blackout because RES have high variability in their forecast. Therefore, there are times that the European TSOs face a major challenge of a lack or excess of energy deriving from RES. This affects the transmission lines with other TSOs of other countries, disturbing the energy exchange of the energy market. This is depicted in the Area Control Error (ACE) [
28] as it is expressed in the following equation:
where:
ΔP: The Power Control Error of a control area. ΔP = P − P0, where P is the active power flow and P0 is the control program (sum of all related exchange schedules and the compensation programs).
Δf: The frequency deviation from 50 Hz.
K: A control area factor.
ACE with a positive value means that more power is flowing out of an area than scheduled, which informs the TSO that generation should be ramped down because there is more supply than demand in that area. ACE with a negative value, on the other hand, indicates that more power is entering the area than anticipated and that local production needs to be increased to keep up with demand.
4.1.2. Malfunction or Maintenance of Important Equipment (PREC_2)
Equipment may not be functional owing to technical issues or because of maintenance and upgrade projects. One unique characteristic of planned outages is that they are typically carried out during normal or low loading hours (i.e., spring and autumn). Many of the presented blackouts in
Table 1 were mostly affected by the absence of critical equipment caused by outages (often intentional). The blackout on 31 March 2015 occurred because the deliberate outages of lines for maintenance affected the Turkish electricity system. The blackout in Greece on 8 February 2021 happened due to a fire of an autotransformer 400/150 kV.
4.1.3. Dependencies between Regions (PREC_3)
The extent and speed of the blackout can be significantly affected by supply dependencies between regions of a connected network. To put it another way, when a significant disruption occurs, regions are frequently unplugged to stop its spread. Power generation shortages or surpluses, however, may result in a collapse in areas with high reliance on the supply of electricity, leaving those areas in an unrecoverable state. If imported power exceeds 20% of total consumption in the region or is dangerously equal to the import capacity limitation, we consider the region to have high dependency, and thus, it is at risk. For example, before the blackout on 31 March 2015, the Eastern part of Turkey exported a great amount of hydroelectricity (42% of its total production), with the majority to be transferred to the Western region, which imported 21% of its load demand.
4.1.4. Inadequate Reserves in Reactive Power (PREC_4)
The system is unable to stabilize the voltage due to a shortage of reactive power reserves, which could cause voltage instability or even collapse. This shortage may be due to a lack of power generators or capacitors that cannot provide reactive power to the system. Inadequate reactive power reserves are mentioned as preconditions for the blackout of the 12 July 2004 in Greece.
4.1.5. Natural Phenomena (PREC_5)
Natural disasters consist of a broad category that includes a variety of tragic occurrences, such as earthquakes, lightning strokes, hurricanes, tornadoes, avalanches, forest fires, volcanic eruptions, landslides, floods, etc., that can cause short circuits and can play a significant role in blackouts. An earthquake, for instance, may cause trips to transformers in the region it hits due to the Buchholz relay operation. In a forest through which transmission lines cross, during a fire, the transmission line circuit breakers may be tripped due to arcing between phases or between phases and earth due to the reduction in the dielectric strength of the air caused by the smoke.
4.1.6. Difference between Planned and Actual Power Flows (PREC_6)
A difference between actual and scheduled power flows along interconnections lines is extremely dangerous since TSOs cannot take the best precautions in these emergency situations. Such dangerous situations occurred on 8 January 2021, as will be presented later.
4.1.7. Lack of N-k Operating Reliability Criteria (PREC_7)
The N-k security criteria have been used for many years to assess power system reliability. The power system is secure (N-k security) if a cascade is not started by the loss of any group of k elements at the same time. The majority of the TSOs are required to have at least N-1 security [
77]. However, there are situations when the system cannot be kept within the N-1 boundaries due to unforeseen circumstances or faults. This criterion was not fulfilled in the case of the blackout on 31 March 2015 in Turkey. It is interesting to note that in Turkey, both Eastern and Western regions were independently N-1-secure, not N-1-compliant, emphasizing the need for close collaboration between operators of interconnected networks.
4.2. Initiating Events
4.2.1. Short Circuits (INIT_1)
Natural phenomena, flashovers caused by animals (often mice or birds), human errors, or wire insulation breakdowns can result in short circuits. For instance, as referred to in
Table 1, the blackout in The Netherlands on 12 December 2007 happened due to a short circuit on the high voltage power lines when an army helicopter crashed on them. On 17 August 1999, there was a blackout in the Turkish power system after a large-scale earthquake [
78] that caused short circuits in power equipment.
4.2.2. Overloads (INIT_2)
A power device’s protections may disconnect it when it is loaded above its capacity, to prevent line lag or device damage. On 31 March 2015, a blackout occurred in Turkey due to the failure of a line on the main corridor connecting the Eastern and Western regions.
4.2.3. Protection Hidden Failures (INIT_3)
A protective device that malfunctions by tripping when it should not have, or vice versa, by failing to trip when it should have, is known as a protection hidden failure.
4.2.4. Human Factor (INIT_4)
Human error is another possible cause which can lead to the initiation of a blackout. Even though these incidents are uncommon, they have a major impact on the safety of the power system. The cause of the blackout in Europe in 2006 was a dispatcher’s mistake [
13]. The momentary disconnection of the European interconnected power grid was caused by the switching off of a power line over the Ems River in western Germany to allow a cruise ship to pass through. Unfortunately, the dispatcher in the regional control center had not taken into consideration the N-1 operating reliability criterion, which overloaded the neighboring power line and caused the trip of its circuit breakers. The result was Europe to be divided into three separate regions, as depicted in
Figure 4.
Human error, as described before, is generally unintentional. However, there have been human intentions that caused blackouts with terrorist actions, such as the cyber-attack from Russia that caused the Ukrainian blackout in December 2015.
In
Table 4, the preconditions and the initiating events for all the major blackouts that occurred in Europe during the past 20 years are presented in detail.
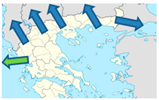
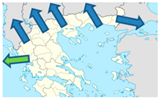
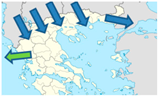
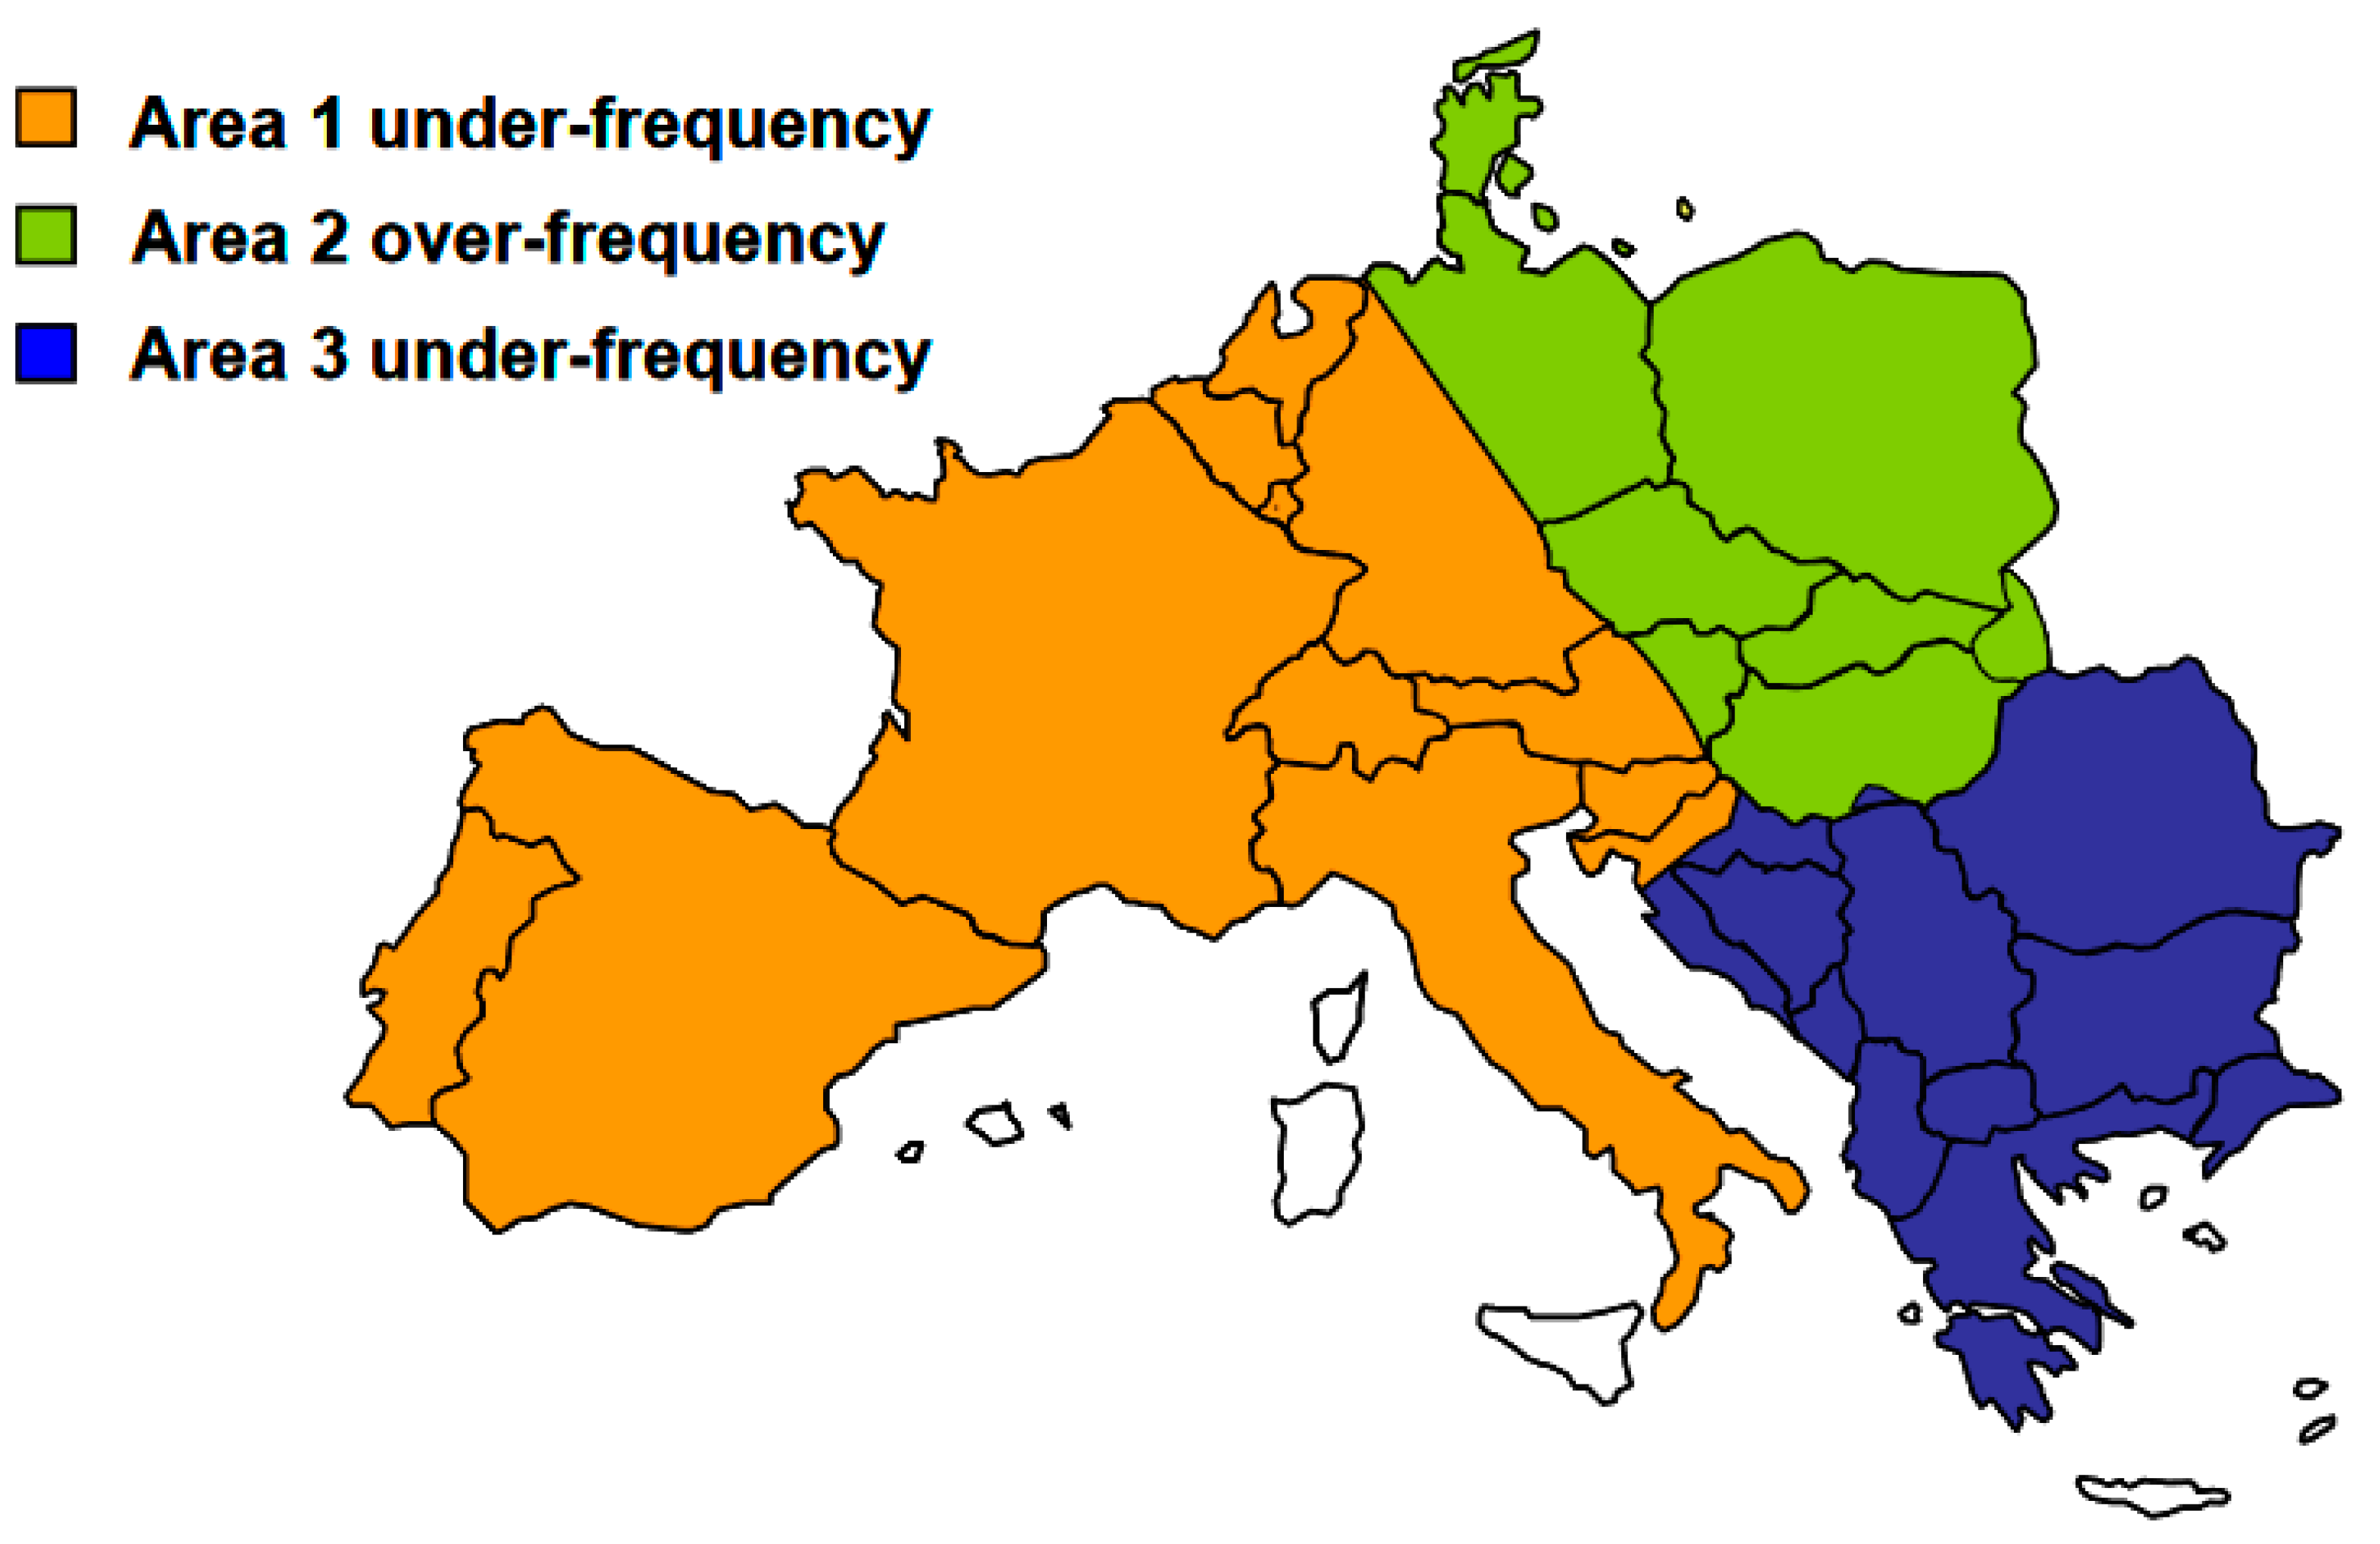
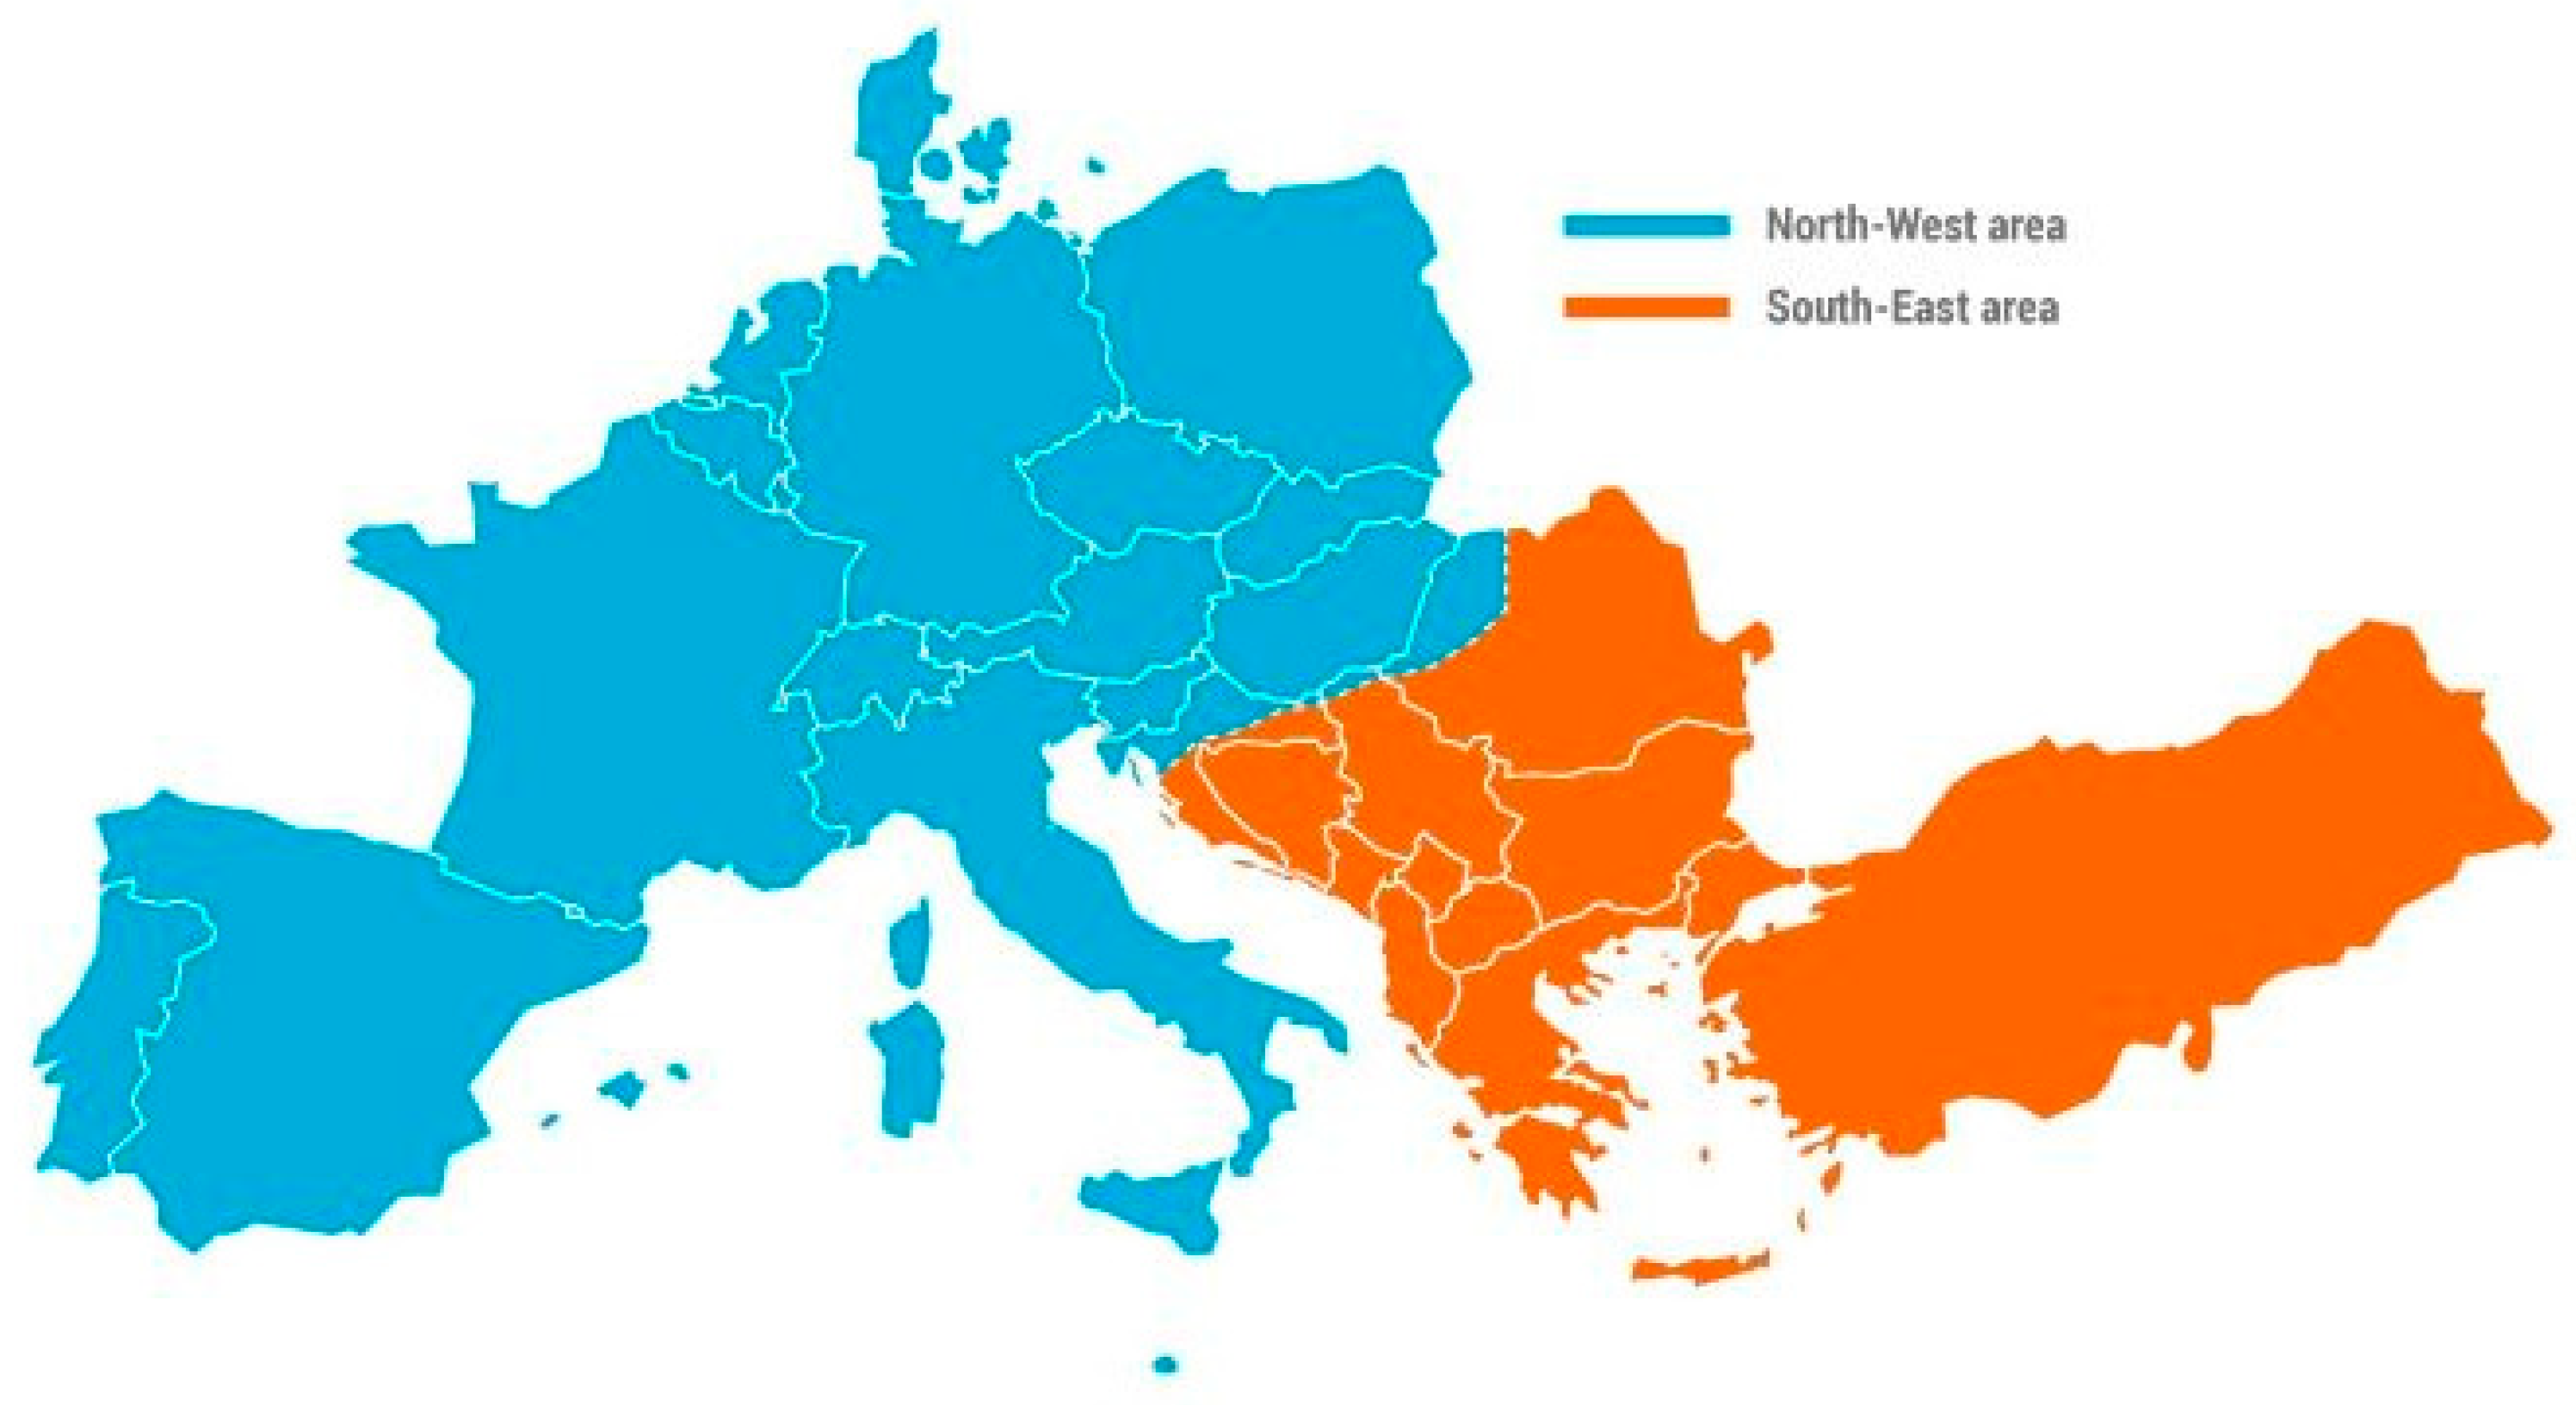
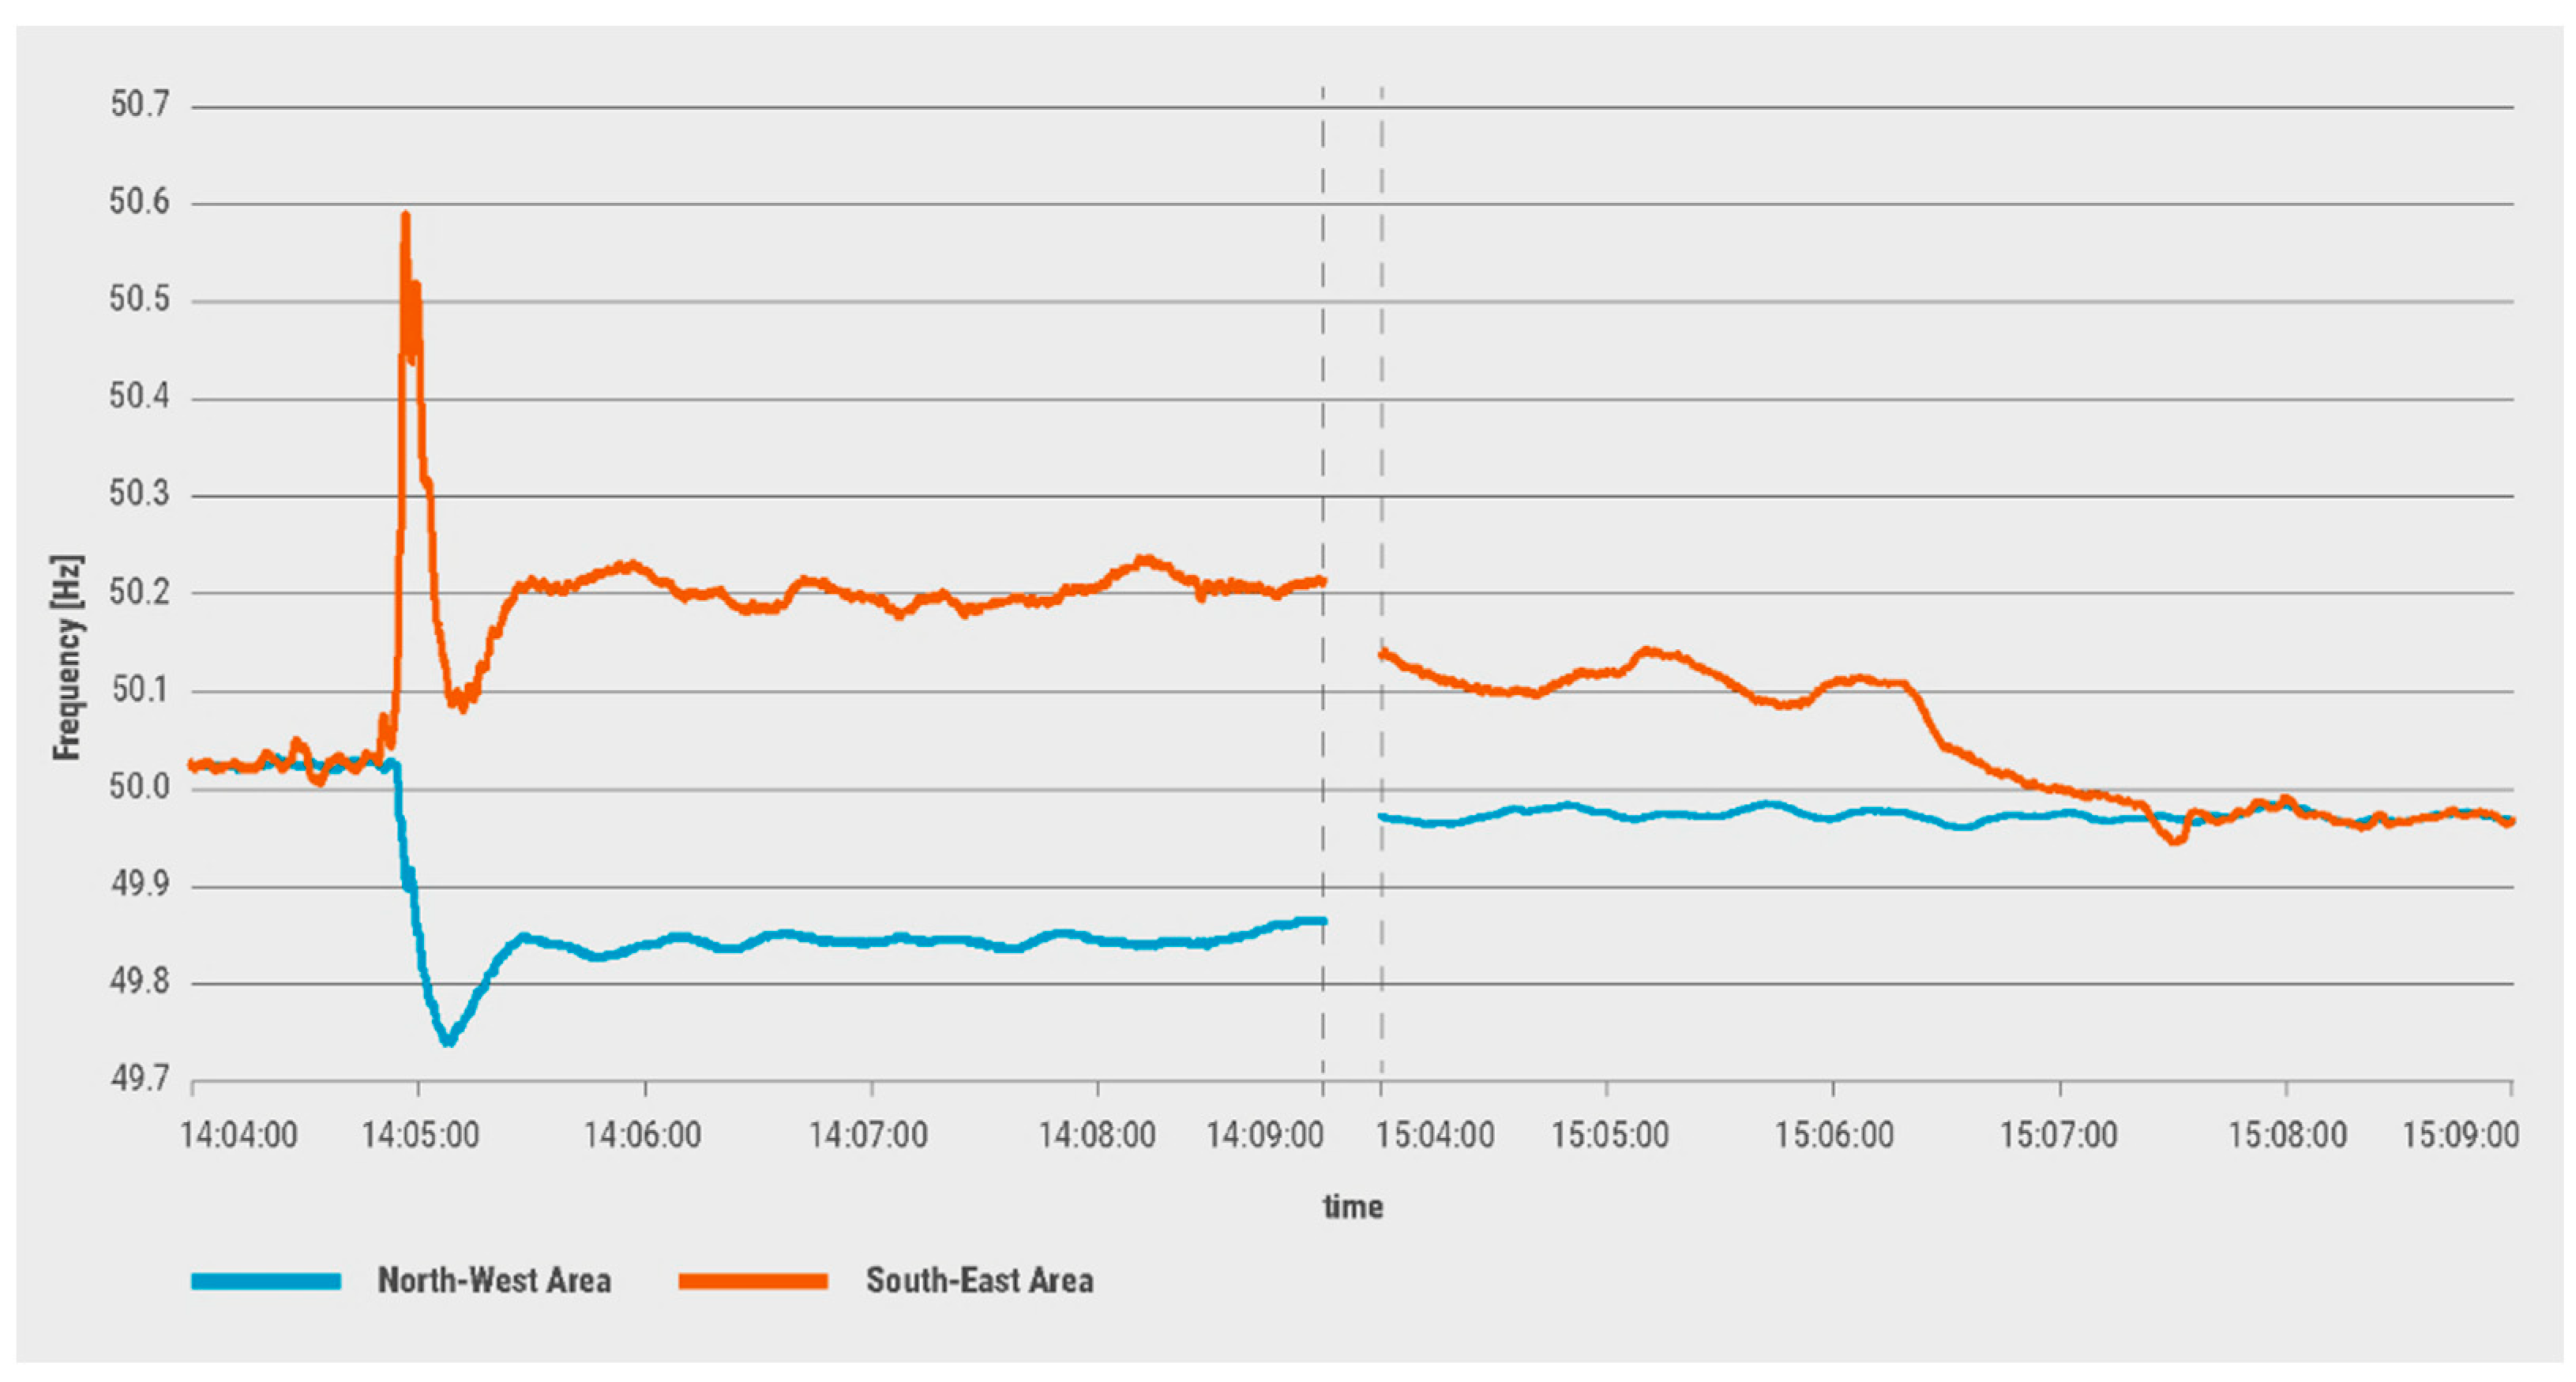
4.3. The Almost Pan European Blackout on 8 January 2021
An event like the one in November 2006 occurred in January 2021. The European electrical system narrowly avoided a widespread collapse on 8 January 2021, when a major frequency disturbance occurred that may have paralyzed Europe. Several transmission network components were out of order in a short period of time, causing the synchronous European power system to be split into two different regions [
79], as shown in
Figure 5. The system separation caused a total power imbalance of about 6.3 GW, with a power shortage in the northwest and a surplus in the southeast. Within roughly 15 s, the frequency in Northwestern Europe dropped to 49.74 Hz. After that, the frequency settled at 49.84 Hz. Southeastern Europe’s frequency first rose to a maximum of 50.6 Hz and then stabilized at 50.2–50.3 Hz (see
Figure 6).
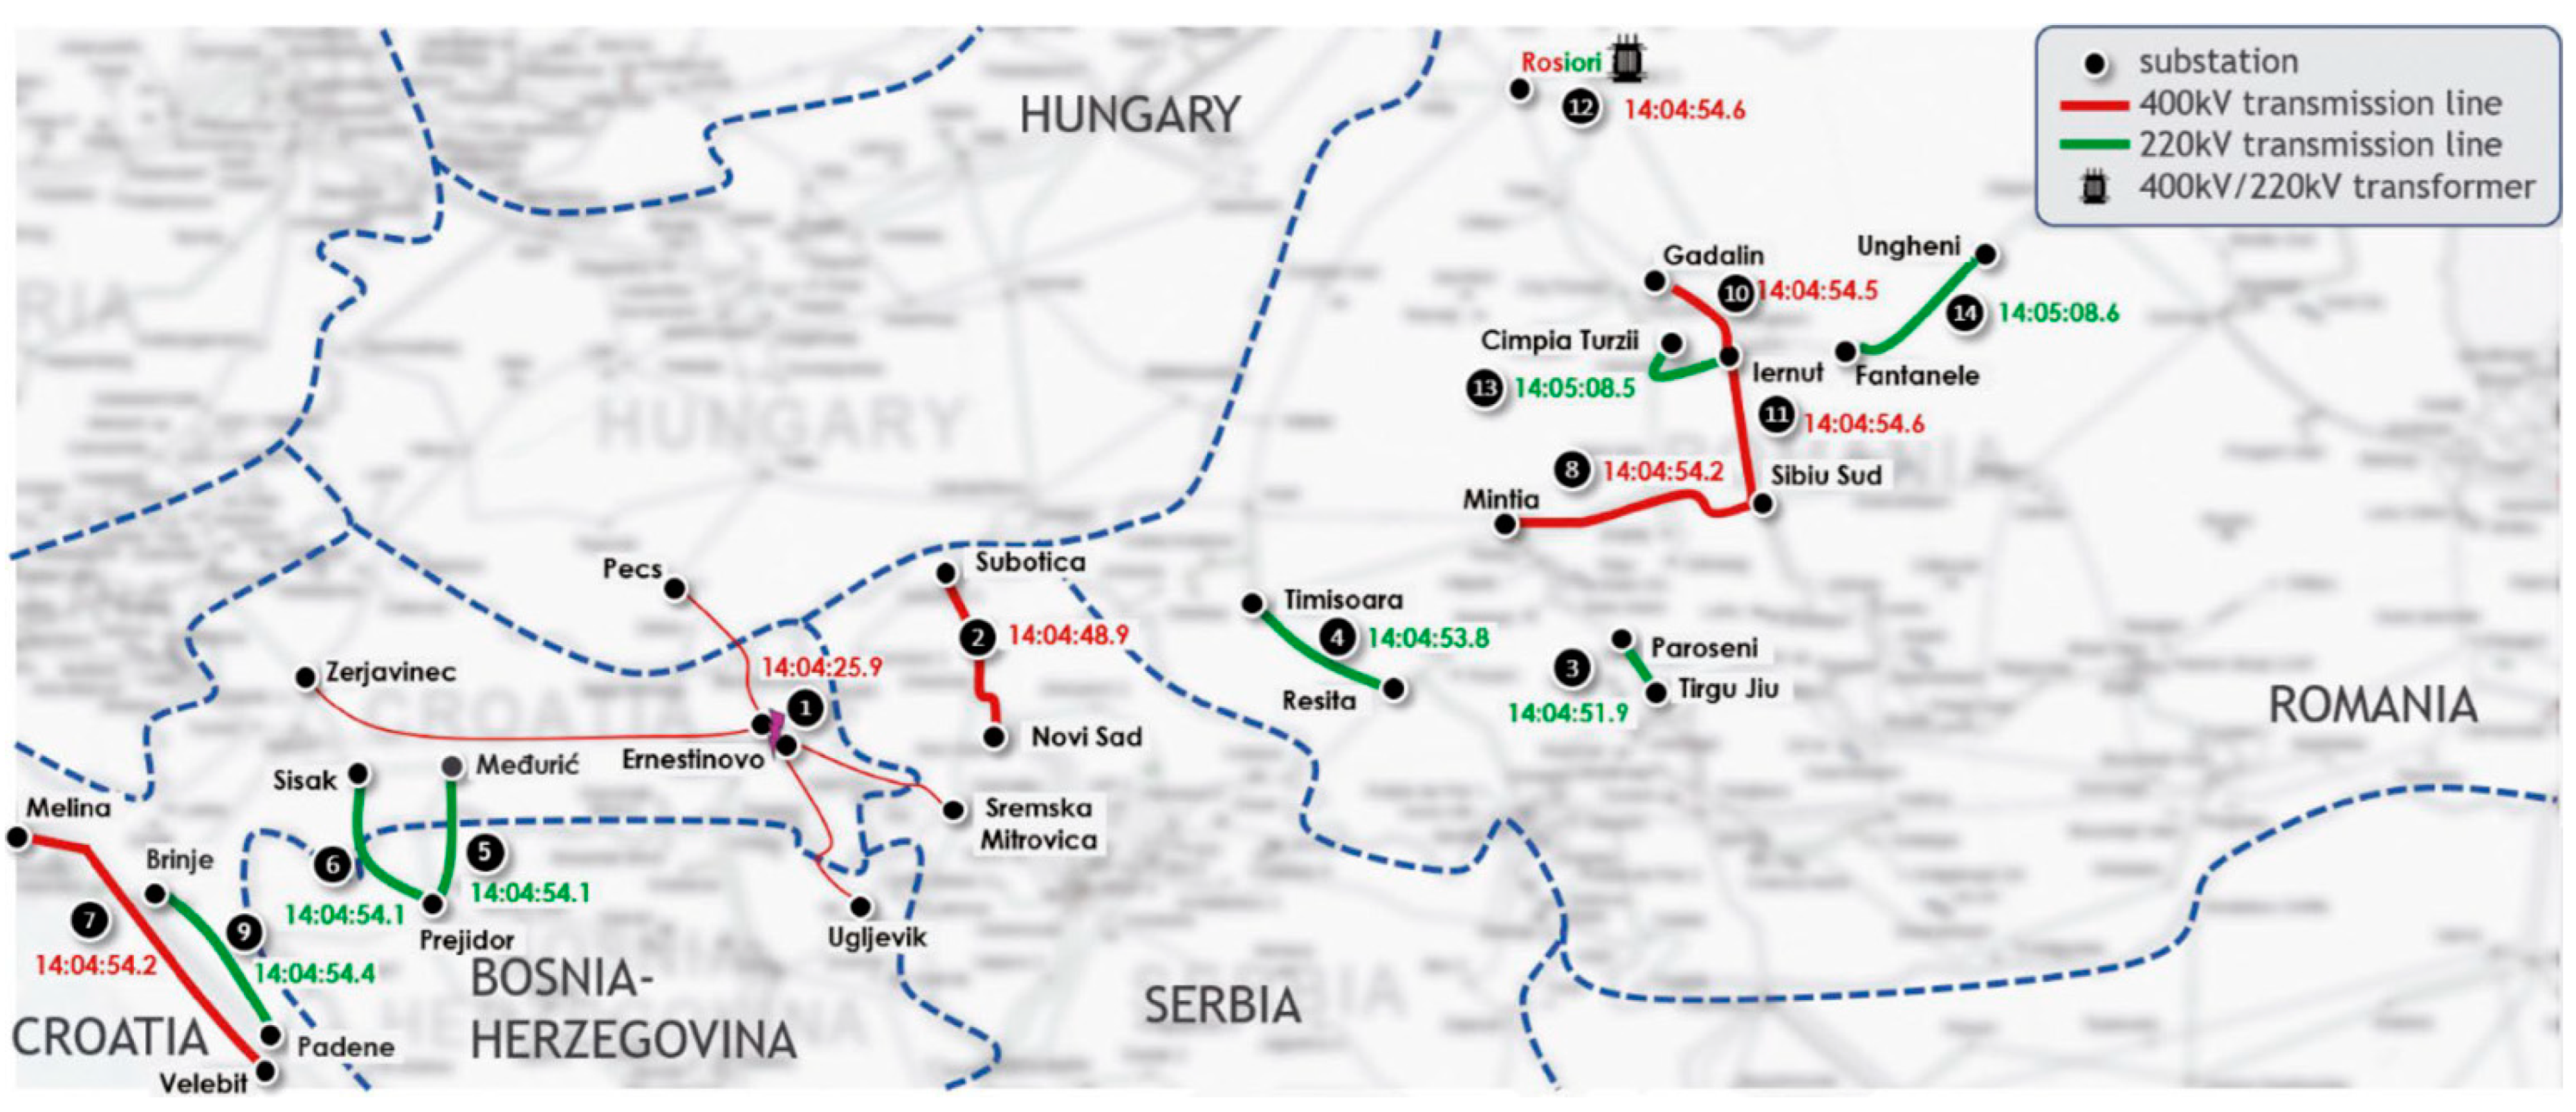
Following a short period of time, the frequency deviation was contained to a variation of about 0.1 Hz in Northwestern Europe thanks to the quick cooperation of interruptible services in the French and Italian TSOs. The 400 kV bus bar coupler trip in the Croatian network (Ernestinovo Substation) was the initial event, according to the analysis carried out by the Expert Investigation Panel of ENTSO-E [
79]. Electric power flows were diverted to nearby lines, which were then overloaded because of the Ernestinovo substation’s separation of flows. Due to overcurrent protection, the transmission line Novi Sad-Subotica tripped at 14:04:48.9. Following this, lines continued to trip due to distance protection, which ultimately caused the system to separate into two parts at 14:05:08.6.
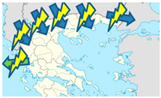
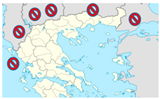
Figure 7 shows the precise positions of the components that tripped in the transmission system.
Elements in generation, transmission, or distribution must be able to operate in a range of frequencies, without disconnecting from the network, for the minimum time periods listed in
Table 5, according to [
80]. During this event, there were several automatic disconnections that should not have occurred. Due to over-frequency (more than 300 mHz), in SE Europe, 3292 MW of generation tripped (187 MW in Bulgaria, 1350 MW in Greece, 600 MW in Serbia, and 1155 MW in Turkey). The 3292 MW total includes 587 MW in the distribution system. Additionally, a 50 MW load disruption was reported in Bulgaria. The southeastern region had a sizable generation disconnection, especially in Turkey and Greece. Since both countries were exporting energy before the incident but quickly turned into substantially energy importing regions after it, those two systems were on the verge of becoming the third or fourth islands of Europe.
4.4. Scenarios with Different Initial Condition before the Event on 8 January 2021
Several scenarios for the European system could be written and analyzed using power flows, such as if there were different productions from the thermal units, if renewables participated to a greater extent, if the event had occurred during the evening peak, etc. However, the results of these power flows may be inaccurate because there were unwanted operations that happened during the event, as discussed earlier, and which are not taken into consideration during the execution of these flows. These unwanted operations (e.g., power trip units in frequencies in which they should not trip) need further investigation.
Trips of power units may have helped the areas that were in over-frequency and made it more difficult to restore in the other part with the under-frequency. The question that can be reasonably asked is why this happened, what would have happened if the frequency had been disturbed even more, and whether the TSOs have the necessary oversight of the way the generating units are operating and whether they should step up efforts to their better and more reliable operation.
From this, we can conclude that if the transfer of energy was greater than 6.3 GW from one side of Europe to the other, we would have (1) probably a greater number of units that would have tripped and (2) possibly internally in the regions with a different frequency, cascading on transmission lines, creating more areas with different frequencies or, in the worst-case scenario, a general blackout in half or all of Europe.
Another aspect that needs further investigation is what would have happened if there were different power flows between countries due to the European electricity market. For example, on the day of the event, Greece was exporting energy to neighboring countries, when usually in this period, Greece was importing. Therefore, on 8 January 2021 and after the event due to the over-frequency, the power flow with other countries changed direction and the power flew to Greece, increasing ACE to 1300 MW. What would have happened in the same incident if Greece was importing energy, and due to the over-frequency, another amount of energy was added to the interconnections? Could it cause these power transmission lines to overload and trip after some time? Could this situation have caused a general blackout in Greece? In
Table 6, an outcome of this scenario is depicted. These questions need further investigation and we can conclude that a blackout can happen at any time in a country or a wider European region. Due to the fact that there is always this possibility, every TSO must be prepared to face such an event, as we analyze in the next section.
5. Restoration Plan Strategy after a Blackout in a Wide Area or a Country
The restoration process for reactivating the power system in the event of a blackout is based on two main principles across Europe:
Bottom-up: The affected areas are restored by self-reactivating the area in sections, ready for resynchronization with another area, using BS units. BS units are isolated power stations with the ability to start individually, and by adding local area loads, they can perform islands.
Top-down: A generally isolated system with a severe disturbance is reactivated using external voltage sources, using interconnection lines to transfer the energy from a safe system. In this case, the disrupted TSO must guarantee that it will respect the limits of active and reactive power flows on the interconnection lines agreed in bilateral agreements.
In the following restoration plan strategy, both these principles are combined.
5.1. Parallel Restoration Model
The goal of power system restoration is to supply all the loads that have been cut off as quickly and securely as possible. Therefore, more active power must be generated as quickly as possible. This study constructs a multi-objective function that incorporates the total restoration time F1 and the minimization of load shedding F2.
5.1.1. Modeling of the Restoration Time
The model for the restoration time aims to reduce the amount of time (τ
ℓ,b,t) that the load (ℓ) of the bus (b) is not supplied. F
1 is the objective function and is the total of all the hours that any load was not in service, as can be seen in (2). The number of hours will be calculated starting from the moment the blackout occurs. Additionally, the model makes a distinction between the higher importance loads (ℓ ∈ HI), such as government buildings or military facilities, and the less significant loads (ℓ ∈ LI).
where:
F1: The first objective function.
T: The programming horizon.
t: The time period set (set in 1 h).
τℓ,b,t: Time that the load (ℓ) of the bus (b) is not supplied.
B: Total number of buses.
b: Bus number.
L: Total number of loads.
ℓ: Number of load.
ℓ ∈ HI: Higher importance loads.
ℓ ∈ LI: Lower importance loads.
Constraint (3) relates the value of variable τ with the value of the binary variable u
ℓ,b,t. The relative position of the set t is indicated by the operator ord(t). If we consider a one-day programming horizon, then the values of ord(t) are [1, 2, 3, …, and 24]. The last variable represents the status of restoration of the load (ℓ), which is equal to 1 when the supply of this load is restored. M is a significant enough number.
In relation to load relevance, constraint (4) specifies that a certain number of high importance loads (X) must be restored before beginning to restore the first low importance load. Additionally, when the load is successfully served again, the restoration status variable
is set to 1.
5.1.2. Modeling of the load shedding
Equation (5) is the second objective function of the problem determining the minimization of load shedding (LS
ℓ,b,t). The objective of the second function F
2 is to eliminate any electrical load that is not served due to the blackout.
5.2. Constraints
5.2.1. Subsystems Number
At least a BS unit or an external transmission line (tie line from neighboring transmission system or a transmission line from a neighboring energized subsystem) must be contained in each subsystem:
where
W is the subsystem number and
M is the BS unit number and the tie lines. Accomplishing the subsystem’s maximum number, the parallel restoration speeds up.
5.2.2. The Active Power Balance
To maintain the steady operation of the units, there should be enough loads in each subsystem [
81].
where:
: The maximum output active power of unit m.
: The active load on bus b.
: The total number of the restored units.
B: The total number of the restored buses.
o
m: The coefficient of the minimum technical output of the unit m. Its value varies from 0.25 to 0.35 for thermal power units, whereas for hydropower units, it equals 0 [
82].
5.2.3. The Observability Constraint
Each bus must be observable by at least one of its neighbors or by itself, according to the observability constraint [
83]:
where V
b is determined by how many buses are present next to bus b. The bus b and bus j relation is represented by the binary decision variable z
bj. Buses b and j must be in the same subsystem and be nearby for z
bj to equal 1. Otherwise, z
bj is equal to 0. If there is a PMU at bus b, it is indicated by variable r
b. The generation of new partitioning plans is necessary. Based on the new method of looking at this limitation, z
bj is modified.
5.2.4. Units Startup Time
There are two states for each generator after blackouts: cold start and hot start, and there are also two restrictions for the start time. The NBS unit should be restarted within a maximum critical time.
where:
: The maximum hot start time of unit m.
: The minimum cold start time of unit m.
: The startup time of unit m at the t-th step.
Combining Formulas (10) and (11) is not possible. Units must be restarted as soon as possible throughout the restoration process.
5.2.5. Unit Cranking Power
The unrestored NBS units require sufficient cranking power in order to be restarted by the power system. Throughout the restoration process, the following constraint ought to be examined:
where
is the required power for unit m to restart.
5.2.6. Overvoltage
During restoration, overvoltage may occur. Consequently, the following equation must be fulfilled:
where:
: The reactive load of bus m at t-th step.
: The reactive power absorbing capability of the restored unit n.
: The number of the restored transmission lines at t-th step.
: The number of restored buses at t-th step.
5.2.7. Power Flow
Power flow must be calculated and the network should comply with the following equations:
5.3. Generator Start-Up and Tie Lines Sequence Decision Model Based on the A* Algorithm
5.3.1. The A* Algorithm
After a blackout, the restoration procedure should be completed quickly and reliably to reduce damage. Reducing the time needed for generator selection is crucial for quick restoration. The time needed for the selection of transmission lines should also be considered. Prior to generation restoration, an adjacent matrix [
84,
85] should be used to confirm the connectivity between the two buses. We can determine the route from a generator that has already been restored to an energized block that has also been restored. The nearby matrix A(k), which is based on the transformation of the connection matrix, is presented in the following equation [
86]:
where
is a line between buses i and j.
The A* Algorithm [
87] is used to find the shortest route to the generator following the generation of the adjacent matrix. The A* Algorithm is a path search algorithm that, because of its completeness and ideal efficiency, is employed in many computer science domains. To prevent excessive charging currents, we also use the charging current of each transmission line as a weighting factor.
where
is the energized block of grid elements that has been restored.
5.3.2. Implementation of the A* Algorithm in the Restoration Process
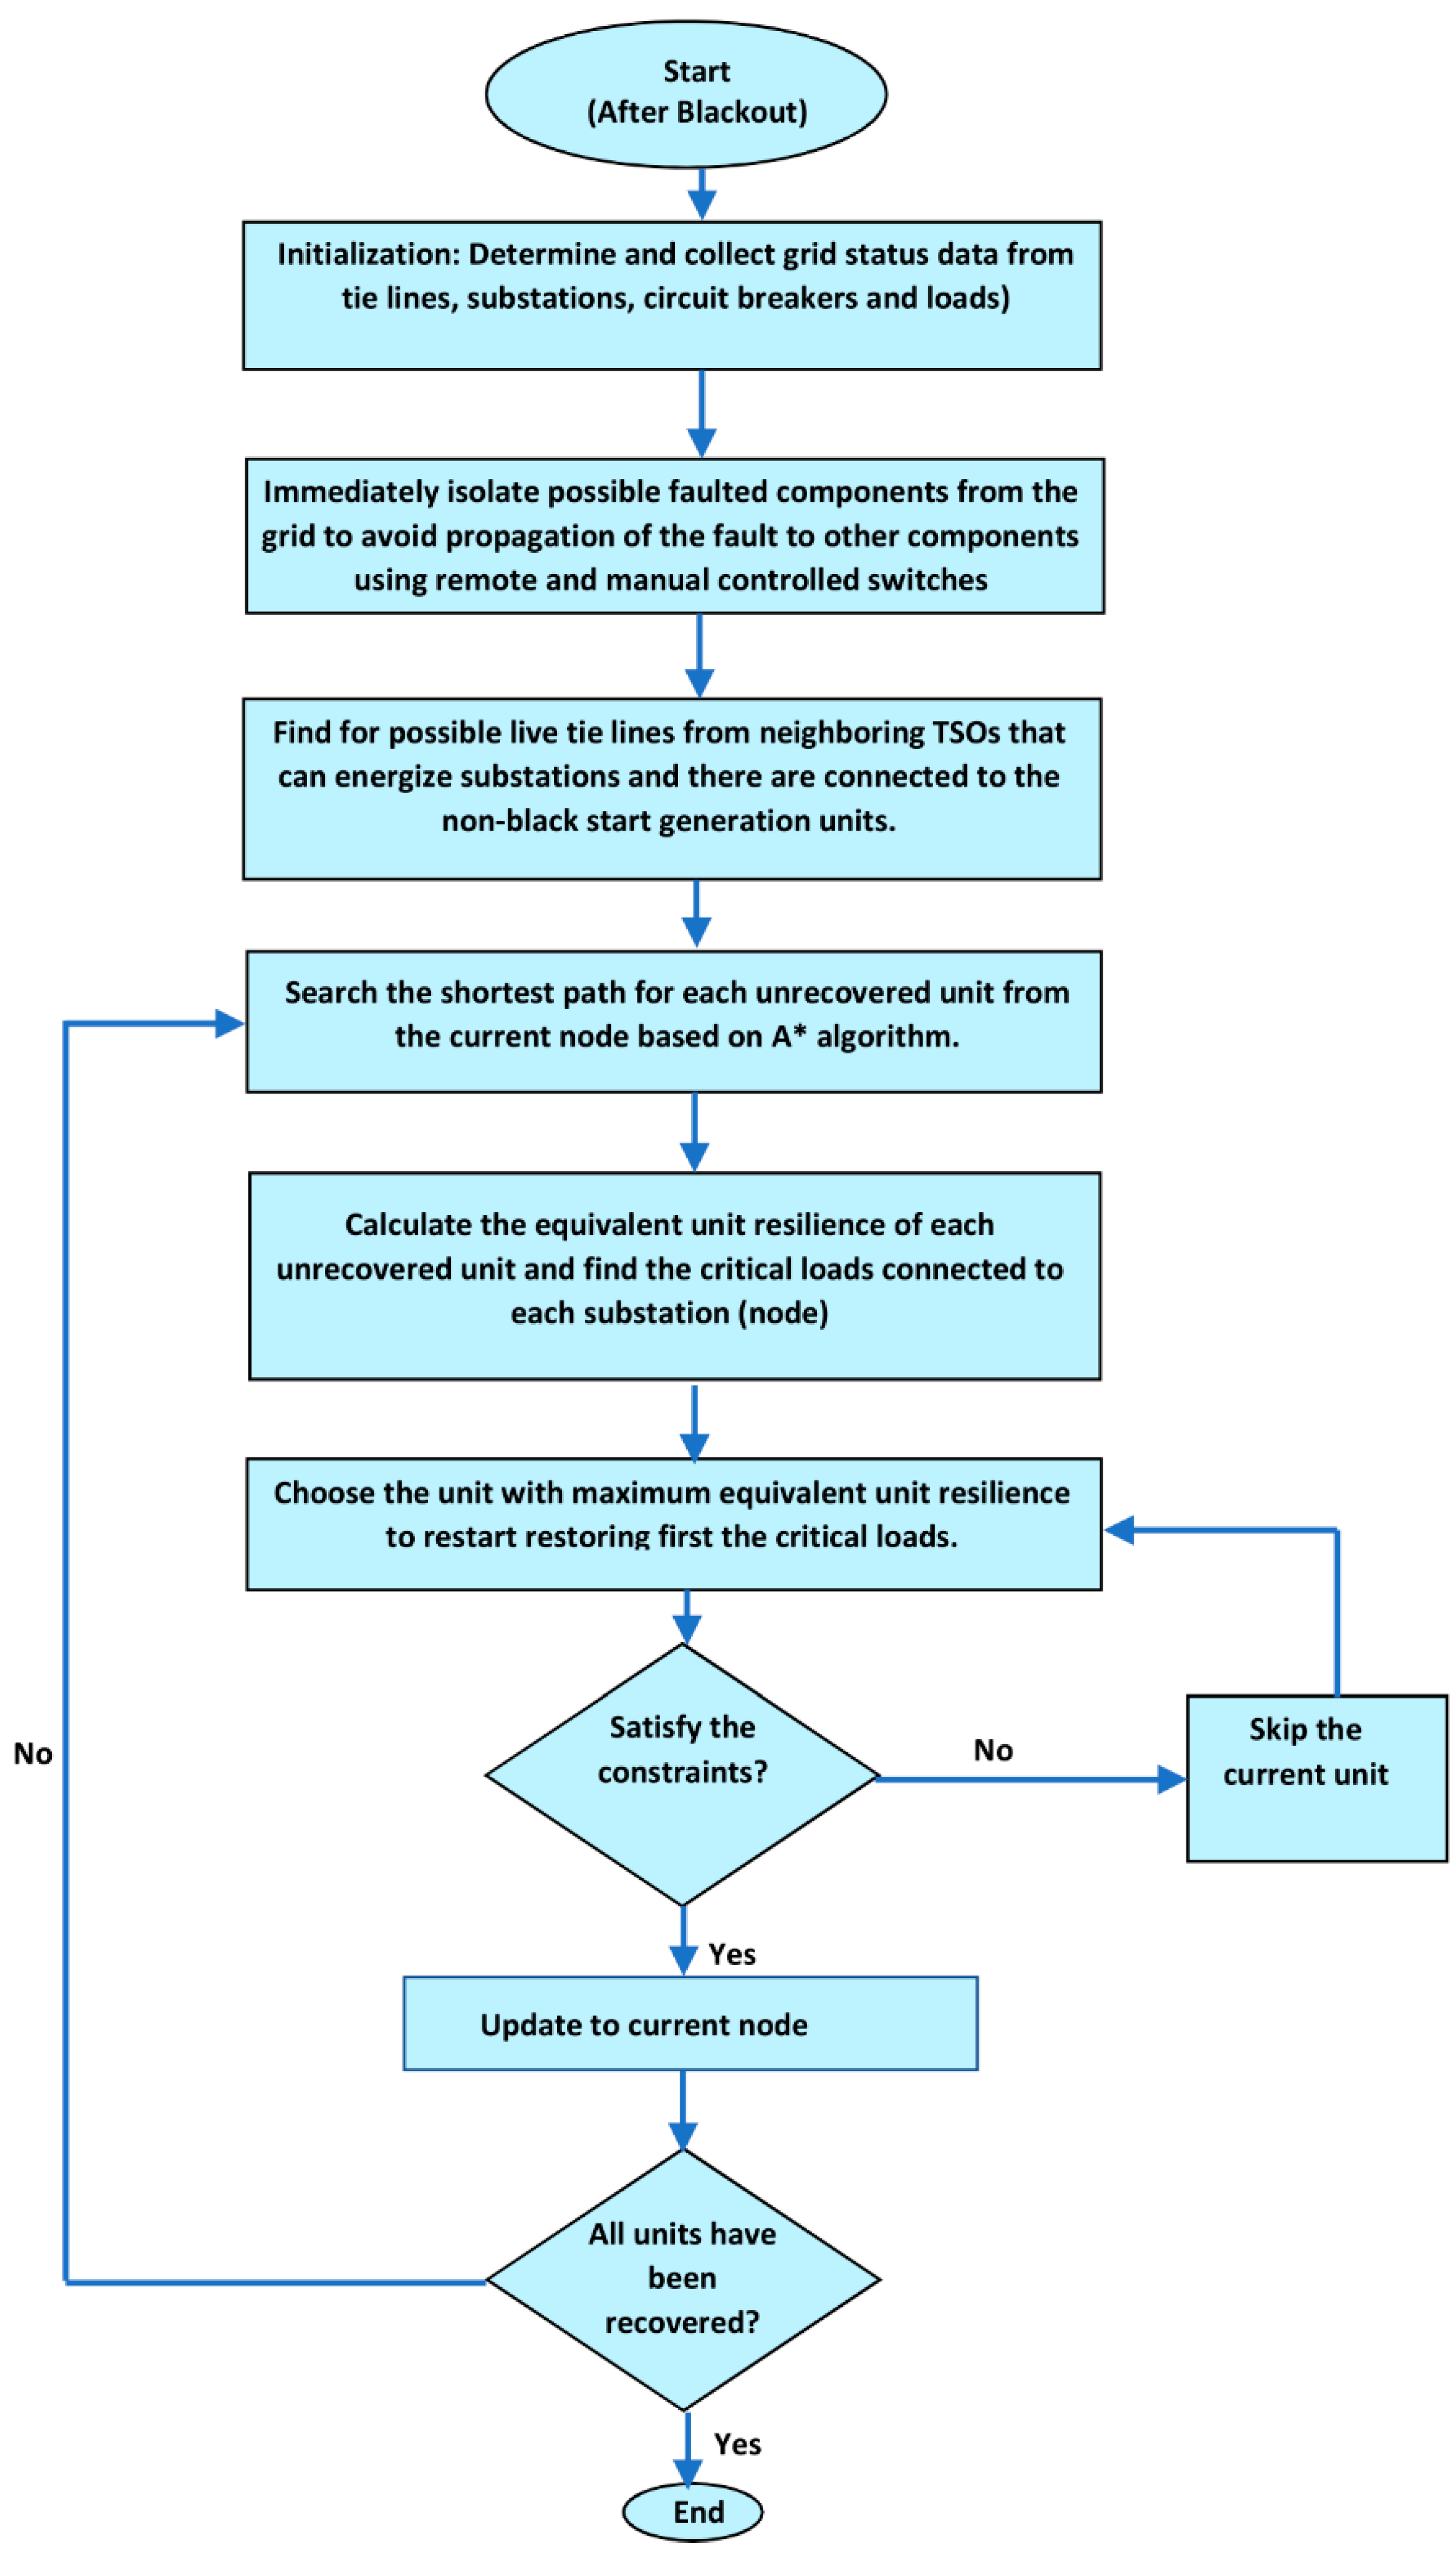
The decision-making process for the selection of the start-up generator and the tie-line succession based on the A* Algorithm is depicted in a flowchart in
Figure 8. Using this algorithm, the best generator (either BS unit or NBS unit) is selected for each phase of the restoration process. In the subsequent step, the objective function value of the remaining generators will be updated, and the highest-valued generator will then start. This procedure is finished when all generators have been recovered.
The procedure is the following:
- (a)
First, the grid’s status data from lines, substations, circuit breakers, and loads must be collected.
- (b)
Faulted components from the network must be isolated to avoid propagation of the fault to other components, using remote and manual controlled switches.
- (c)
Possible live tie lines from neighboring TSOs must be used to energize substations on which there are connected ΝBS units.
- (d)
Using the A* Algorithm, the shortest path for each generator that has not been recovered is found.
- (e)
The objective function for each generator that has not been recovered is calculated.
- (f)
The generator with the maximum value restarts.
- (g)
If the constraints are met, the system operation outcome using the specific generator is verified. The current node is updated if the conditions are satisfied. If not, the subsequent generator in the sequence is chosen and the current generator is skipped.
- (h)
From the present node, the shortest paths for each remaining generator are once again searched and steps e, f, and g are repeated until all generators have been recovered.
5.4. Case Studies
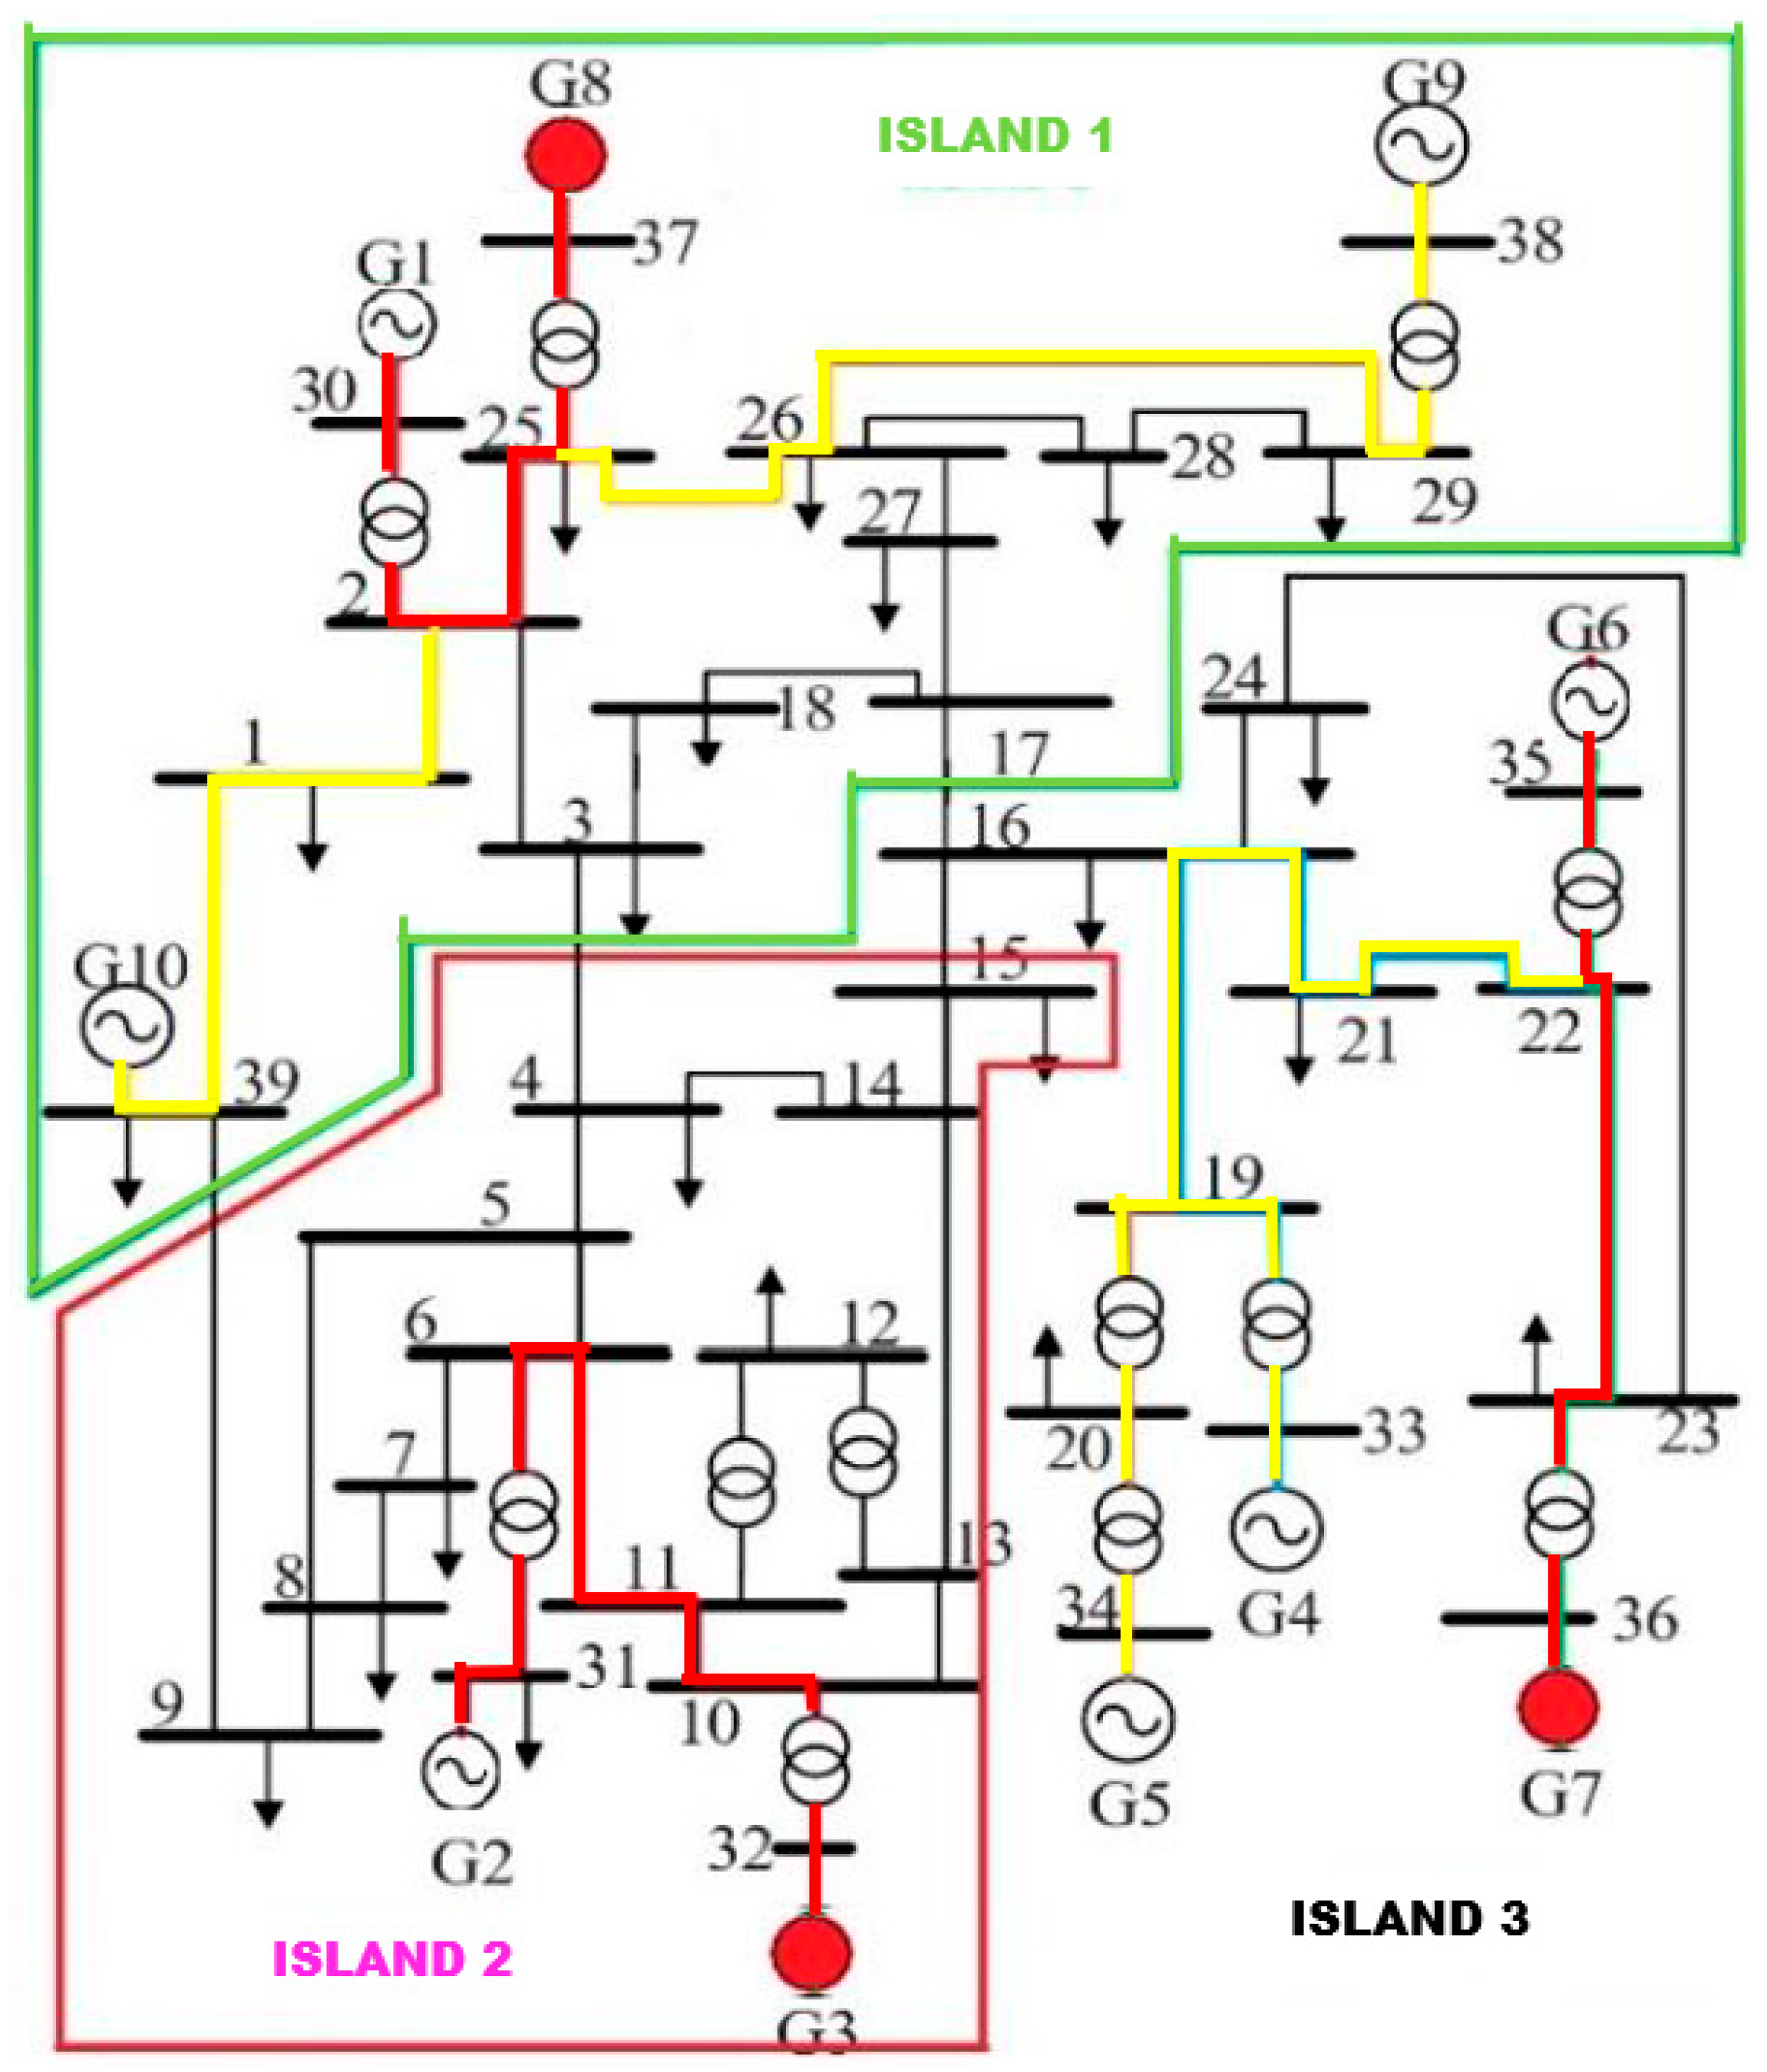
5.4.1. Case Study 1: The IEEE-39 Bus System
The proposed algorithm was implemented by MATLAB and tested with the IEEE-39 bus system. There are three BS units and seven NBS units among the ten generators, the data of which are presented in
Table 7. G8, G3, and G7 are BS units in islands 1, 2, and 3, respectively. All the other units are NBS units. After calculation by the proposed algorithm, the optimal network skeleton for each island is shown in
Figure 9 with colored solid lines.
Table 8 shows the restoration sequence and the corresponding restoration paths. For this scenario, we assume that all thermal units are in hot start time and the system load is 2150 MW. The total available production is 2740 MW, making the system generation rich. The total restoration time is 22.4 min. During that time, all the units and the loads were restored successfully. Comparing the restoration time of the A* Algorithm with other restoration mechanisms, it is proved that the proposed Algorithm is more efficient. For example, the restoration time in [
88] is 36 min where the proposed genetic algorithm was validated also in the IEEE-39 bus system. In [
84], where a Generic Restoration Milestone (GRM) is proposed and has also been validated in the IEEE-39 bus system, the restoration time is about 100 min.
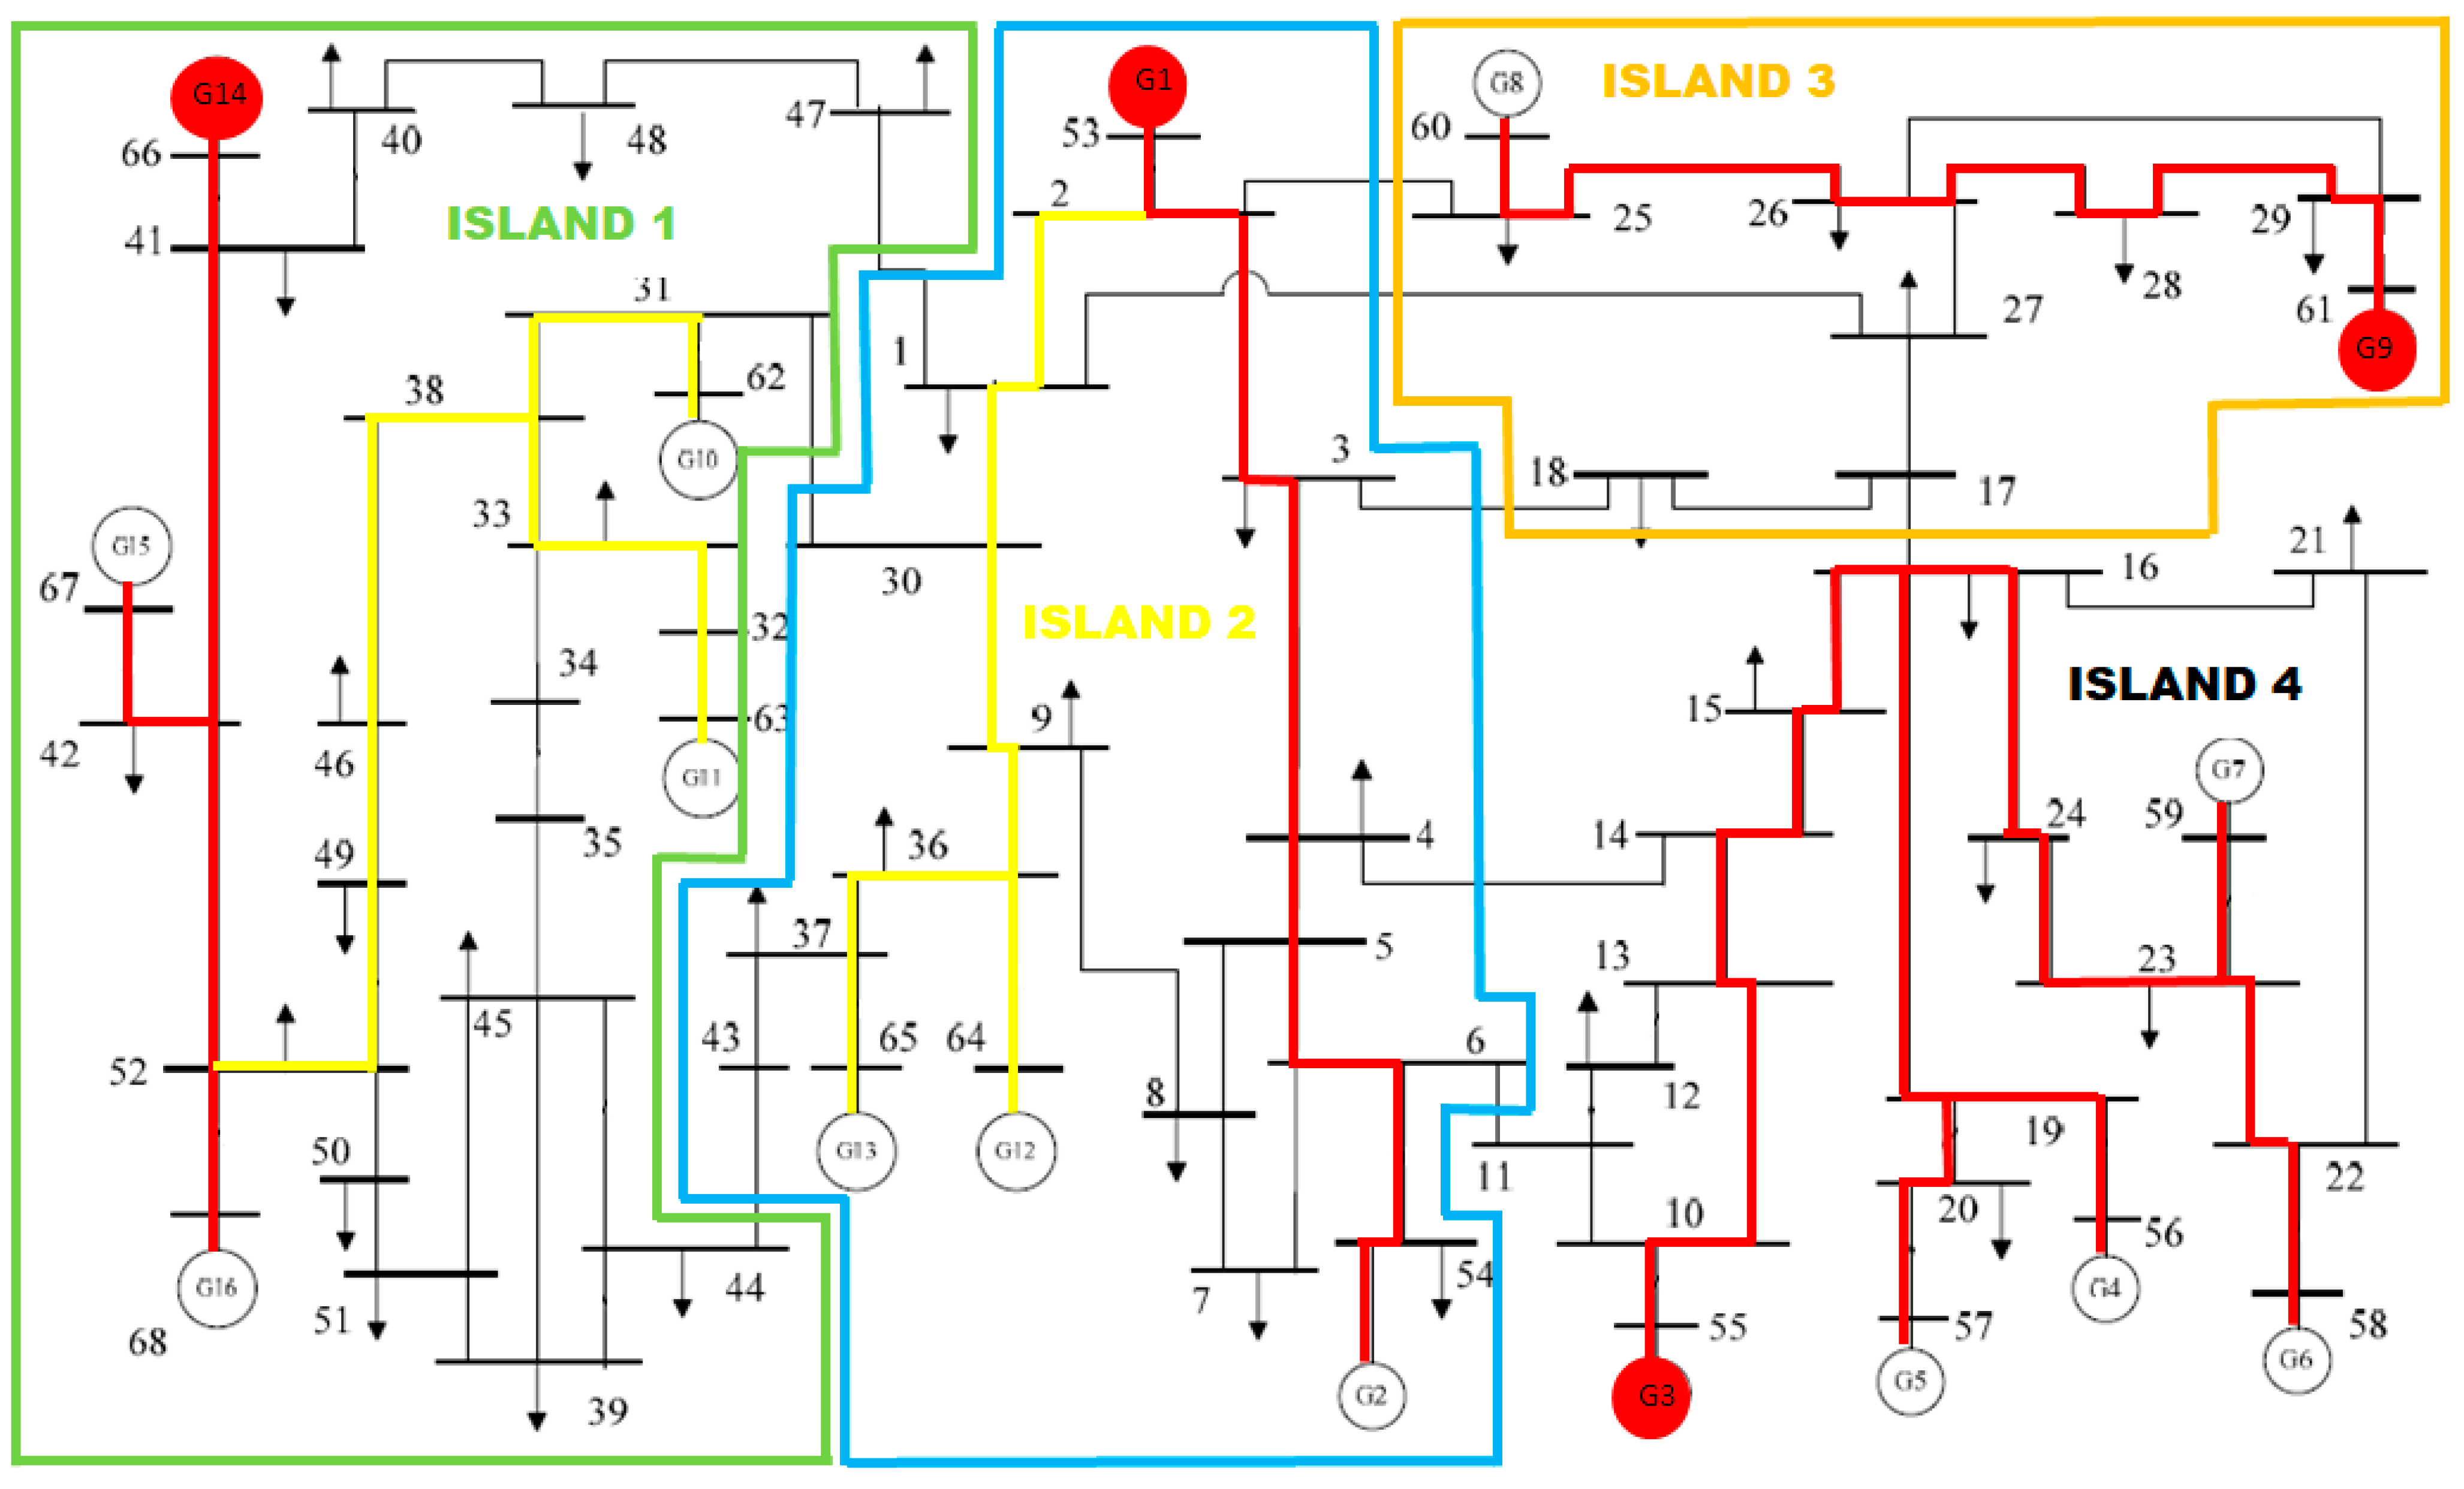
5.4.2. Case Study 2: The IEEE-68 Bus System
In order to further verify the effectiveness of the proposed algorithm, the same work is carried out for the IEEE-68 bus system [
89], which contains 16 generators. There are 4 BS units and 12 NBS units among the 16 generators, the data of which are presented in
Table 9. G14, G1, G9, and G3 are BS units in islands 1, 2, 3, and 4, respectively. All the other units are NBS units. After calculation by the proposed algorithm, the optimal network skeleton for each island is shown in
Figure 10 with colored solid lines.
Table 10 shows the restoration sequence and the corresponding restoration paths. For this scenario, we assume that all thermal units are in hot start time and the system load is 3750 MW. The total available production is 4940 MW, making the system generation high enough. The total restoration time is 57.5 min. During that time, all the units and the loads were restored successfully. Comparing the A* Algorithm with the resilience-oriented service restoration modeling proposed in [
90], it is proved that it is more efficient. In [
90], the proposed technique is validated in the IEEE-69 bus system (comparable to the IEEE-68 bus system of the current work) and the restoration time comes up to hours.
6. Discussion
A profound transformation is taking place in the European transmission and distribution system. The continuous high penetration of RES, the lack of sufficient energy storage mechanisms, the limitations in energy production derived from fossil fuels, unpredictable severe power system failures, and the lack of natural gas due to the war in Ukraine are taking place at once, increasing the risks of major disruptions or even a blackout. In this paper, these important factors that can cause a blackout have been analyzed in detail.
Since the possibility of such a severe event is always present, in the previous section, a restoration plan strategy is presented. The proposed strategy combines the bottom-up and step-down principles. Using the BS units and the live tie lines, separate islands are formed and then they can be connected, restoring the whole power system. The proposed restoration plan is implemented using the A* Algorithm. This algorithm gives priority to loads of high importance to be supplied first, minimizing the load shedding and the total restoration time. In order to further verify the effectiveness of the proposed algorithm, it has been tested for two different case studies: the IEEE-39 and IEEE-68 bus systems. The results proved the efficiency of the algorithm, since the total restoration time was short enough, depending on the complexity of each system, and the critical loads were supplied with priority.
The defense and restoration plans of the TSOs must be created through the cooperation of all the TSO’s departments and always with the cooperation of the dispatchers, who will implement it when necessary. These plans need to be revised at regular intervals because both the distribution system and the transmission system are dynamic and change topologically and qualitatively over time. The proposed restoration strategy can be adopted by the European TSOs and it can be used in their unique and more complicated power systems. However, each TSO must be well prepared for every undesired state that may occur, and certainly for a blackout. These events must be efficiently handled and the system must be restored as quickly and safely as possible. Below are procedures and proposals that should be followed by all TSOs.
6.1. Personnel—Dispatchers (Operators)
In any event in the transmission system, the dispatchers are responsible for immediately intervening. Dispatchers are engineers who work 24/7 in rolling shifts to keep the system balanced, and they will be called to face difficult system events or even a blackout. Their work is extremely crucial, and therefore, they should be healthy, qualified, and well trained. As mentioned before, the EUR_2006 blackout happened during the night shift due to a mistake by the dispatchers. The human mistake is something that should worry us.
Dispatchers working in energy control centers are strained due to both the increased responsibility and pressure they experience during their work. Fatigue can affect an operator not taking the right decision (and often without being particularly stressed by the event) [
91]. The worst nuclear accident in Europe in Chernobyl happened during the night shift. Over time, people working in rolling shifts for many years develop various diseases which in turn affect their performance and how well they manage situations [
92,
93].
For this reason, dispatchers should be physically capable of doing such work and their physical and mental health must be regularly checked. They should not work too many hours and should rest satisfactorily. Finally, they should not work for many years in the same job position, and they must be replaced by younger and well-trained employees.
6.2. Training—DTS
A dispatcher, besides having the physical and mental capability, must be well trained for his or her job. The Portuguese TSO working on this direction developed an Intelligent Tutoring approach for training Portuguese Control Center operators in tasks such as incident analysis and diagnosis and service restoration of power systems [
94]. The Italian TSO performed training to check its restoration plan after a massive blackout [
95]. A TSO’s Dispatcher Training Simulator (DTS) is typically created to closely resemble the transmission power system. Its goal is to recreate as closely as possible the environment in which the dispatcher (trainee) must deal with changes in operating conditions or system events by simulating the behavior of the power system as it is seen from the same SCADA environment used in the control room [
35,
96,
97]. The simulator will react by changing power system parameters in the same way the real power system would, in response to the operator, changing the conventional networks’ controls in response to an event or system condition. Operators can be trained in the normal, emergency, and restoration phases of operations using the DTS. The simulation enables operators to be exposed more frequently to important scenarios that come seldom during their daily work [
33]. In fact, it is feasible to have system operators with a lot of experience who have not had a lot of practice using it in emergency or remedial situations. With the use of a simulator, it can be possible to repeatedly expose operators to these dangerous situations, giving them practice and expertise in managing the power system under pressure.
6.3. Monitoring the Condition of the Grid’s Cyber Systems to Achieve Both Physical and Cyber Resilience
The parts of the power grid must be monitored, analyzed, and controlled by a cyber-system for the grid in order to function effectively and consistently. The resilience of these cyber systems has received little focus. In addition, the numerous control systems of an interconnected power grid operate under a variety of jurisdictions, necessitating close coordination for design and operation to ensure seamless and prompt information transmission in real time and coordinated response actions.
To share data on the health of both physical and cyber systems, TSOs must create standardized data definitions, communication protocols, and industrial control system designs. Standardizing data definitions and communication protocols would help all concerned transmission operators and distribution operators to better understand the operational state of all connected power systems.
6.4. Collaboration between TSOs, DSOs and Other Government Agencies
An important issue during the restoration process is the TSO collaboration especially among the neighboring ones. Usually, when a blackout occurs in a country during the top-down restoration procedure, the neighboring TSOs need to energize the interconnection power lines. The European Awareness System (EAS) is a useful tool between the TSOs, and it proved its value during the great disturbance on 8 January 2021. Certainly, organizing meetings between dispatchers of different TSOs will help in exchanging views and improving know-how, making it more effective in such unexpected events.
Before a major blackout and during the TSO’s effort to avoid it, DSOs are usually urged to cut down loads. If a blackout occurs, the DSO’s “strategy” until now was to wait until the restoration from the TSO and to add loads during the restoration process. However, nowadays, the electricity system has continued to develop its black-start procedures and grid-control methods as the Distributed Energy Resources (DER) [
98,
99,
100,
101]. DER units make up a larger portion of the system and they can aid in the restoration of the distribution island and the transmission system [
102,
103]. Having quick control over inverter-based generation for supporting frequency and voltage as well as balancing active and reactive power are the most crucial features to support a stable restoration procedure.
For minimizing the restoration time in a blackout, and especially if it has been caused by a natural disaster such as a fire, earthquake, flood, etc., cooperation between TSO, DSO, and government agencies such as the Army, the Fire Brigade, and the Police should be ensured. The development of an information system that will integrate information from meteorological data and areas controlled by the Police, Army, and Fire Brigade will give an optimal result. For example, there is often no coordination between the Fire Brigade and TSOs during forest fires, with the result that while the TSO is trying to electrify lines that are cut, water is thrown from airplanes and the lines’ circuit breakers trip again.
6.5. Flexibility in Power Systems
A highly flexible and interconnected pan-European transmission network is required due to the high penetration of RES in Europe. By hosting a larger proportion of RES, the transition of the current energy production mix will be helped. The European electricity system will become more flexible and reliable thanks to the development, installation, demonstration, and testing of novel smart grid technology, control, storage, and market approaches [
104,
105,
106].


