Article

Experimental Study on the Influence of Delay Time on Rock Fragmentation in Bench Blasting

1
State Key Laboratory of Explosion Science and Technology, Beijing Institute of Technology, Beijing 100081, China
2
School of Mining Engineering, University of Science and Technology Liaoning, Anshan 114051, China
3
China Safety Technology Research Academy of Ordnance Industry, Beijing 100053, China
*
Authors to whom correspondence should be addressed.
Appl. Sci. 2023, 13(1), 85; https://doi.org/10.3390/app13010085
Submission received: 17 November 2022 / Revised: 8 December 2022 / Accepted: 19 December 2022 / Published: 21 December 2022

Abstract

:
Delay time is an important factor in the quality of bench blasting. The development and application of electronic detonators make it possible to control the timing of detonation by a highly precise delay time. It is an easily achievable way to seek a better blast fragmentation by controlling the delay time. In order to investigate the influence of delay time on rock fragmentation, eight experiments on bench blasting models with double holes were carried out. The average weight of 4.59 g of pentaerythritol tetranitrate (PETN) was charged into each blast hole with a diameter of 10 mm. Delay times between the double holes were set as: 13.69, 27.36, 54.72, 60, 90, 120, 180, and 339.6 µs. During blast loading, the breakage processes of specimens were captured in detail by high-speed cameras. Full-field strains on the bench slope were analyzed by the three-dimensional digital image correlation (3D-DIC) technique. After each experiment, the coarse fragments were backfilled into the post-blast specimen to observe and record the bench slope’s final breakage pattern. The experimental results showed that the fragmentation of the bench slope transformed from horizontal crack dominance to vertical crack dominance as the delay time increased. In addition, post-blast fragments were collected and sieved, including fine materials. In the premise of approximate excavation, the optimum delay time was 180 µs. Compared to short delay times such as 27.36 µs, x50 was improved by approximately 25% at the delay time of 180 µs. The results showed a significant difference and great improvement in fragmentation when the delay times were in the time range of no-shock-wave interaction compared to interactions. When determining the optimum delay time in multi-hole blasting, except for the stress wave interaction, factors such as crack propagation should also be considered. The results of experiments could contribute to references for relevant research.

1. Introduction

As a common method of rock excavation, the borehole blasting technique is widely used in mining engineering. However, inappropriate blasting designs depending on experience may result in high ground vibration, poor fragmentation, and even safety risks [1,2]. In bench blasting, poor fragmentation will directly increase downstream costs and reduce ore utilization [3,4,5]. Many studies have been carried out by relevant practitioners and researchers on bench blasting to obtain better fragmentation [6,7,8,9,10].
It was found that delay time is one of the important factors affecting the fragmentation of rock [8]. With the development of electronic detonators with a highly precise delay time, controlling stress wave interactions to improve blasting fragmentation has become a hot topic. Rossmanith [11,12] studied the stress wave interaction between two adjacent blast holes by the Lagrange diagram based on stress wave theory, and he suggested that the superposition of stress waves induced by short delay times has a positive effect on rock fragmentation. Vanbrabant and Espinosa [13] carried out a series of short-delay blasting experiments by using electronic detonators to enhance the tensile effect of the stress wave tail. Field experiments showed that the mean size of fragments was improved by 45.6% than that with a long delay time. Chiappetta [14] believed that the optimum delay time should be short enough to make the stress waves generated by adjacent holes interact between blast holes and validated this conclusion based on image analysis and fragment size statistics. Mckinstry [15] suggested a delay time of 3 ms between the blast holes of the same row, which can ensure the superposition of stress waves and improve rock fragmentation.
Unfortunately, the view of stress wave superposition improving fragmentation cannot be widely accepted. Blair [16,17] stated that the potential of stress wave interactions was overestimated by adopting the simplified two-dimensional analysis. Specifically, the stress wave interaction was uncertain in realistic three-dimensional models, and the superimposed region had a limited effect on the fragment size distribution. Katsabanis et al. [18] carried out small-scale blasting experiments with granite. The results showed that the blasting fragmentation of simultaneous initiation was the worst. When the delay time between adjacent blast holes was longer than 1 ms, corresponding to 11 ms/m of burden, the fragmentation was improved. Johansson and Ouchterlony [7] used bench models with a single free surface to conduct a series of delay blasting experiments. The statistical results of fragments indicated that the stress wave superposition had no significant improvement for fragmentation. By comparing experiments with simultaneous initiation, short delay time, and long delay time, Schimek [19] found that the fragment size distribution with long delay time is better than that with short delay time. Omidi [20] screened fragments under different delay times and found that the relatively long delay time would improve fragmentation. In the numerical study of Schill and Sjöberg [21], the stress wave interactions were not significant enough to improve fragmentation, which was contradictory to the views of Rossmanith [11,12]. Therefore, it is necessary to study the influence of delay time on rock fragmentation.
The evolution of the strain fields and the dynamic breakage process can assist the study of rock fragmentation [22,23,24]. Many techniques have been developed to detect surface deformation and crack growth in brittle materials under different loading [25,26]. With the development of high-speed cameras and the DIC technique, a non-contact measurement method successfully captured the full-field on the specimen before fracture occurred [27,28,29,30,31,32,33,34,35]. In the experimental study of blast loading, Yang et al. [36] obtained the strain evolution process of rock blasting under a high-ground stress state using the 2D-DIC technique in model tests. Chi et al. [37] analyzed the surface deformation of granite specimens under single-hole explosion by using the 2D-DIC technique. In the study, the crack initiation time on the free surface was determined by DIC analysis and strain gauge measurements. Yang et al. [38] studied full-field strain characterization of the bench slope surface under simultaneous detonation. The DIC analysis showed that the distribution of strain fields in the vertical direction correlates with the propagation direction of the dominant horizontal crack. He and Yang [39] obtained the strain fields of single-hole and double-hole rock specimens under blast loading from the 3D-DIC technique. The results showed that the stress waves superposition caused by symmetrical loading made the radial crack between the two holes easily and fully fractured. The application of the DIC technique for measuring deformation is ideal for obtaining information on the dynamic deformation of rock materials because of its accuracy, applicability, and operability [40].
Fragment size distribution is an important indicator for evaluating the fragmentation of rock. Zhang et al. [41,42] studied the effects of different boundary and stemming conditions on the fragmentation with cylindrical granite specimens by analyzing the particle size of fragments. Many empirical models were proposed to describe and predict the fragment size distribution [43]. The Swebrec function proposed by Ouchterlony [44] can effectively characterize the size distribution of post-blast fragments, including fine and coarse particles. Sanchidrián et al. [45] analyzed 448 groups of sieving data for blasting fragments and compared the fitted results of the Weibull, Swebrec, Gilvary, Grady, and Lognormal models and their two-component versions. The results indicated that the Swebrec function was one of the most suitable functions to describe the fragment size distribution of rock blasting. Yi et al. [46,47] used Wipfrag software to process the numerical damage contours and used the Swebrec function to obtain the overall fragment size distribution. In this paper, the Swebrec function was used to fit and analyze the experimental data about fragment size, and the blasting quality was evaluated by the fragment size distribution.
The aim of this study was to investigate the influence of delay time on fragmentation. Eight experiments of bench blasting models with double holes were carried out to provide the experimental data. In Section 2, the size of the bench specimen, the charge structure, the experimental device, and the monitoring system are introduced in detail. In Section 3, the full-field strains of three typical specimens are calculated by the 3D-DIC technique. The progressive breakage process captured by two high-speed cameras and the post-blast pattern with fragments backfilled under different delay times are compared and analyzed. Furthermore, the fragment size distribution of excavated rock is fitted by the extended Swebrec function. In Section 4, the influence of the delay time on fragmentation is discussed based on the full-field strains, high-speed images, post-blast pictures, and fragment size distributions. Finally, the conclusions of this study are provided in Section 5.

2. Experiments

Eight experiments of double-hole bench blasting models with different delay times were carried out in the Beijing Institute of Technology.

2.1. Specimen Design and Explosive

The granite used for the bench specimens was quarried from an intact rock mass in Shandong, China. The size of the bench model was designed as 1/50 of the real bench size in the field. The bench model was elaborately machined from a rock block with a size of 667 mm × 509 mm × 400 mm. Every bench model had double holes and a 70° sloping surface. Two vertical through-holes with a diameter of 16 mm were drilled, and their distance was 120 mm. The detailed dimensions of the bench model are shown in Figure 1. The material properties of the granite were determined by static strength tests, as mentioned by Yang et al. [40]. The density of the granite was 2.578 g/cm3, Poisson’s ratio was 0.15, Young’s modulus was 35.43 GPa, the P-wave velocity was 4386 m/s, the static tensile strength was 3.26 MPa, and the static compressive strength was 70.65 MPa. There were no visible joints and geological structures on the surface of the bench specimens.
The powdered PETN was filled in a transparent plastic tube with a length of 240 mm and a diameter of 5.5 mm. The average charge weight was 4.59 g in each blast hole with a density of 0.81 g/cm3, corresponding to a velocity of detonation (VOD) of 4818 m/s. Referring to Johnson’s experiments [7], the delay time of detonation between the blast holes was controlled by two detonating cords with different lengths. The linear density of the detonating cord was 4.25 g/m, and the velocity of detonation was 6850 m/s. The segment of the detonating cord located in the blast hole was placed inside the steel tube to weaken its blasting effect on the rock. Black tape was wrapped around both ends of the plastic tube to ensure that the charge was equipped in the center of the blast hole. The assembled explosive device is shown in Figure 2. The details of the experiments, including the experimental number, the delay time, and the charge weight, are listed in Table 1.
The delay times in Table 1 were mainly selected from short delays with stress wave superposition to long delays without stress wave superposition. The delay of 13.69 μs was to make the P-wave superpose between the blast holes. A delay of 27.36 μs was selected to make the P-wave from borehole-B interact with the tensile wave formed by the P-wave from borehole-A reflected at the free surface. A delay time of 54.72 μs was chosen to investigate the effect of weakened stress wave interactions on fragmentation. The delays of 60 μs, 90 μs, and 120 μs were chosen to study the influence of the further increase in delay time on rock fragmentation. Delay times of 180 μs and 339.6 μs were designed to correspond to 9 ms and 17 ms, respectively, which are two commonly used delay segments of highly precise detonators in field bench blasting.

2.2. Experiment Setup

Before experiments, a steel rod with a 10 mm diameter and 300 mm length was assembled into the blast hole. Then, the gap between the rod and the blast hole wall was filled with cement mortar. The steel rod was pulled out after the cement mortar solidified, and the diameter of the blast hole was reduced to 10 mm. The cross-section of the bench specimen with charge is shown in Figure 3.
An assembled blasting model before detonation is shown in Figure 4. In order to match the boundary conditions in a practical bench blasting, several steel plates with a thickness of 20 mm were welded to a device to constrain the displacement of the back, right, and bottom of the bench specimen. During the assembling process, rubber mats with a thickness of 10 mm were filled in the gap between the specimen and the steel plate. Four steel sticks were bolted to the constraining device at the front and left of the specimen.
A schematic of the experimental layouts is shown in Figure 5. After two detonating cords with different lengths were initiated simultaneously by a detonator, the PETN charges in the double blast holes were detonated with a delay time. In addition, while the detonator was being initiated by an electrical pulse signal, the electrical pulse signal was captured by a trigger box to start high-speed cameras.
After each blasting experiment, the fragments of the bench specimen were collected, weighed, and sieved. Moreover, the coarse fragments were backfilled into the post-blast specimen for photographic recording.

2.3. High-Speed Camera and DIC

In experiments, two high-speed cameras (Fastcam SA5, Photron Inc., Tokyo, Japan) were used to record the breakage process of the area of interest (AOI) on the specimen. The projections of the AOI on the cross-section of bench specimens are shown in Figure 6. Three different camera settings were used. In the experiment of DT1, the high-speed cameras were set at a frame rate of 70,000 frames per second (fps) with an image resolution of 320 × 280 pixels. In the experiment of DT2, the high-speed cameras were set at a frame rate of 30,000 fps with an image resolution of 512 × 416 pixels. In the experiments of DT3-DT8, the high-speed cameras were set at a frame rate of 35,000 fps with an image resolution of 512 × 392 pixels.
The DIC obtains the speckle pattern of the specimen before and after deformation by high-speed cameras, calculates the surface displacement field by matching pixel subsets, and uses the displacement field information to obtain the strain field of the surface [37]. The two high-speed cameras used in the experimental program were designed to facilitate the analysis of 3D-DIC. For 3D-DIC analysis, the DIC software named Match ID was used. In this paper, the DIC software calculated the deformation of the bench surface based on the natural speckle pattern of the granite material. The reference subset was 27 × 27 pixels in the DIC computation, and the subset step was 4 pixels.

3. Experimental Results

The delay time and charge weights of the eight bench models (DT1-DT8) are listed in Table 1. All specimens had the same decoupling ratio of 1.82. Full-field strains of three typical specimens were calculated by the 3D-DIC technique. The dynamic breakage process and post-blast pattern with fragments backfilled of specimens were analyzed and summarized. The extended Swebrec function was used to obtain the fitted curves of fragment size distribution. Finally, the fragmentation of all specimens was analyzed quantitatively by the particle size at different accumulated mass passing.

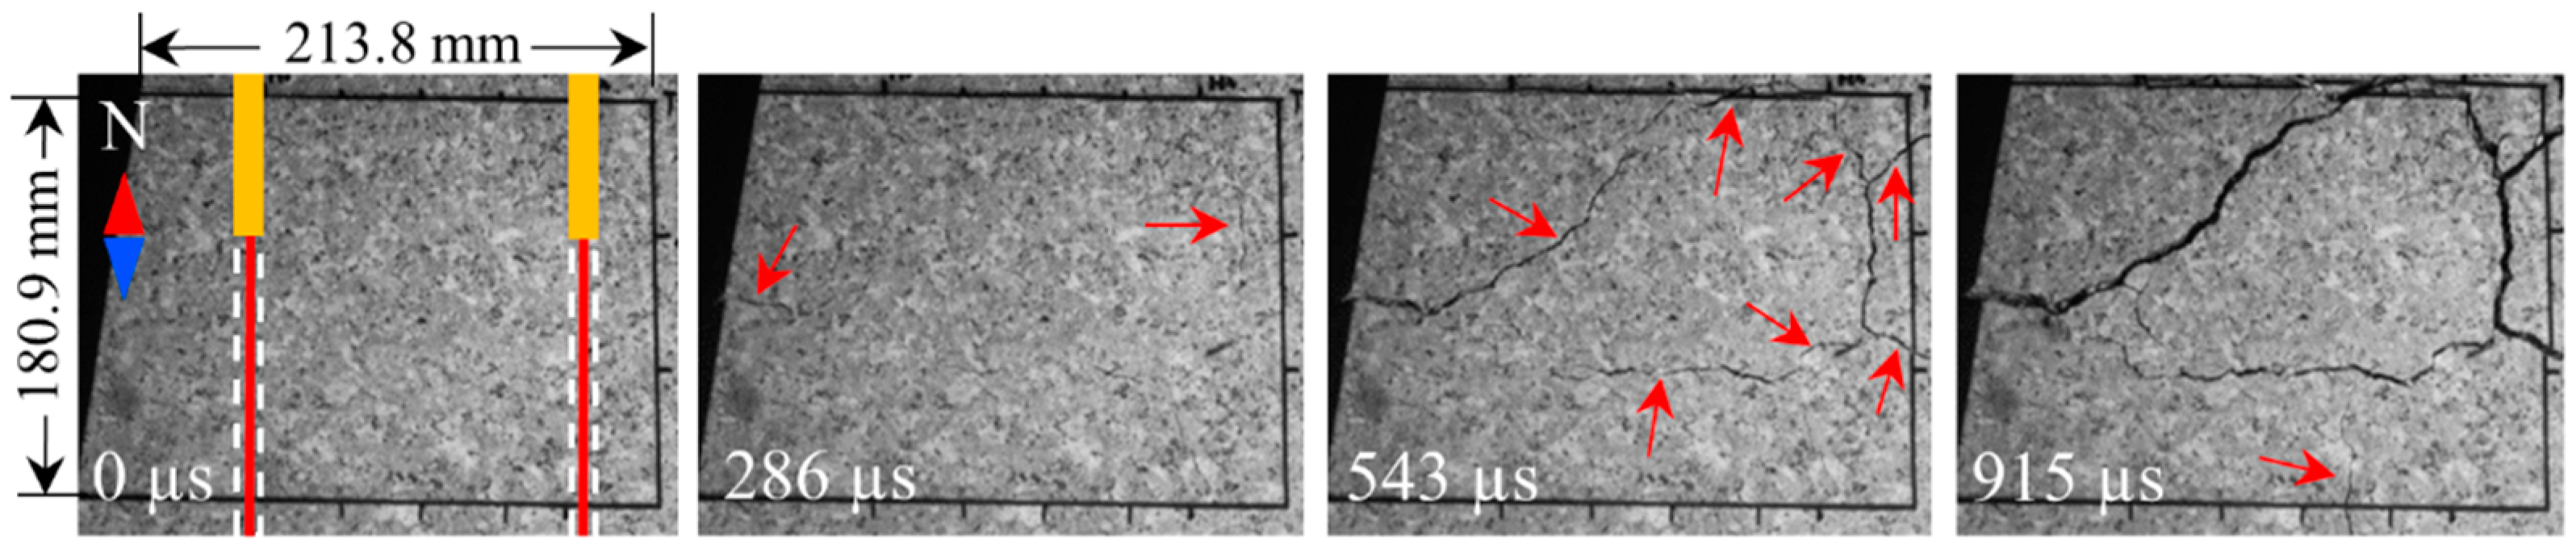
3.1. Full-Field Strain of Typical Specimens

Full-field strains of three bench models, including DT2, DT4, and DT7 specimens, were calculated by the 3D-DIC technique. The von Mises strain was used to quantitate the dynamic deformation of the AOI.
For DT2, the delay time between the boreholes was 27.36 μs, the high-speed image resolution was 512 × 416 pixels, and the frame rate was 30,000 fps, i.e., 33.3 μs between frames. Figure 7 shows the von Mises strain contours of the DT2 specimen. As shown in Figure 7, strain concentrations were first observed at 67 µs. The plots from 133 to 333 µs show that there were two significant horizontal strain concentrations at the strain field. As the time increased, the strain concentration zones became wider to predict the formation of macroscopic cracks.
The image resolution of 512 × 392 pixels and the frame rate of 35,000 fps were set for DT4, corresponding to a time resolution of 28.6 μs between frames. Figure 8 shows the surface strain field of the DT4 specimen from the 3D-DIC analysis. The plots from 0 to 171 µs show that the strain concentrations first appeared on the left side of the AOI. It can be seen from the von Mises strain contours that as the time increased, the significant strain concentration was located in the left central position of the strain field. At 257 µs, the significant strain concentration extended and branched in two directions. Two strain concentration zones propagated upward at 286 µs, while two strain concentration zones propagated downward. Until 257 µs, a horizontal strain concentration appeared in the middle of the strain field.
The same camera setting of DT4 was selected for DT7. The von Mises strain contours of DT7 are shown in Figure 9. It can be seen that the strain concentrations of DT7 were similar to those of DT4 until 171 µs and mainly occurred on the left side of the strain field. From 143 to 286 µs, the vertical strain concentration zone extended and branched in multiple directions. At 314 µs, a horizontal strain concentration zone formed at the edge of the AOI. By comparing Figure 7, Figure 8 and Figure 9, DT7 did not have a horizontal strain concentration zone at the middle position of the AOI. The strain field of the DT7 specimen was dominated by vertical strain concentration zones.
The von Mises strain evolution process on the specimen surface can be obtained from the 3D-DIC analysis. The development of the strain concentration zone presented in the contours above is a good way to fill the observation gap before macroscopic cracks emerge. These contours indicate that the location and development of the strain concentration zone changed as the delay time increases.

3.2. Progressive Breakage Process

In the description of the dynamic breakage process of rock, the characteristics of crack initiation, propagation, and formation are essential [34]. The dynamic breakage processes of the AOI after the moment of detonation are summarized in Figure 10, Figure 11, Figure 12 and Figure 13. Unfortunately, the experiment of DT6 missed its high-speed images due to failure of triggering the cameras. In the images of breakage processes, some arrows are set to indicate the location of the cracks. It should be noted that the rupture of the AOI was completed before 915 μs. The photographs after 915 μs are mainly the motion of fragments and were quickly obscured due to the escaped explosive gas, so these are not presented. A compass is set at the top-left of the 0 µs plot to describe the direction of the crack extension. The borehole is indicated by dashed lines in frame 0 µs, the explosive charge is indicated by the red solid line, and stemming is indicated by the orange rectangle.
Figure 10 shows the AOI breakage process of DT1. A main horizontal crack appeared in the middle of the AOI at 286 µs. At 543 µs, the main horizontal crack expanded to the southeast with two branching cracks, horizontal and vertical, at the crack tip. At the same time, a horizontal crack appeared at the top edge of the AOI, and a vertical crack appeared on the right edge of the AOI. Then, a vertical crack located at the left of the AOI penetrated the main horizontal crack and the top horizontal crack. At 915 µs, the right vertical crack appearing at 543 µs opened up and intersected with the horizontal branching crack of the main horizontal crack.
In the breakage process of DT2 and DT3, shown in Figure 11, horizontal cracks first appeared in the middle of the AOI. Then, many vertical cracks appeared in the AOI, but these vertical cracks did not affect the expansion of horizontal cracks. As time increased, the horizontal cracks crossed through the AOI with numerous vertical cracks on both sides. This indicated that horizontal cracks appeared faster than vertical cracks in the two experiments and dominated the fragmentation of the bench models.
Figure 12 shows the breakage process of the bench slope in DT4, DT5, and DT7. These three experiments had similar breakage patterns. Specifically, vertical cracks first appeared at the minimum burden of the first borehole and extended faster than horizontal cracks. The horizontal and vertical cracks intersected at 286 µs. Then, the vertical cracks continued to expand, powered by explosive columns, and prevented the expansion of the horizontal cracks at 543 µs. Simultaneously, new cracks appeared on the right of the AOI. Finally, a crack network formed at the bench slope, and the specimen was fragmented. The results indicate that as the delay time increased, no horizontal cracks passing through the AOI as with DT2 and DT3 appeared in the middle region.
Horizontal cracks appeared on the left of the AOI of DT8, shown as the 286 µs in Figure 13. Simultaneously, vertical cracks appeared on the right of the AOI, which is the minimum burden of the second blast hole. At 543 µs, the horizontal crack on the left developed gradually in the northeast direction. At the same time, the vertical crack on the right of the AOI branched at its crack tips, and one of the branching cracks intersected with a new horizontal crack on the bottom of the AOI. At 915 µs, the opening width of the cracks increased with the bench slope bulging.
As the delay time increased, the independent action time of the stress wave from borehole-A (shown in Figure 1) was increased before detonating borehole-B. The crack gradually appeared preferentially as the minimum burden of borehole-A. In addition, the direction of the main crack extension on the slope changed from horizontal to vertical. When a longer delay time was used, the breakage patterns of the bench slope are consistent with the studies of Chi et al. [37,48]. In their single-hole blasting experimental results, the opening velocity of vertical cracks was faster than the horizontal cracks. The results agree with the observation in this paper that as the delay time increases, the slope breakage process increasingly tends to be single-hole blasting, leading to an increase in the opening velocity of vertical cracks. The progressive breakage processes presented the effect of delay time on the fragmentation of bench specimens. As the delay time increased, the breakage pattern of the bench slope transformed from horizontal cracks dominated to vertical cracks dominated.

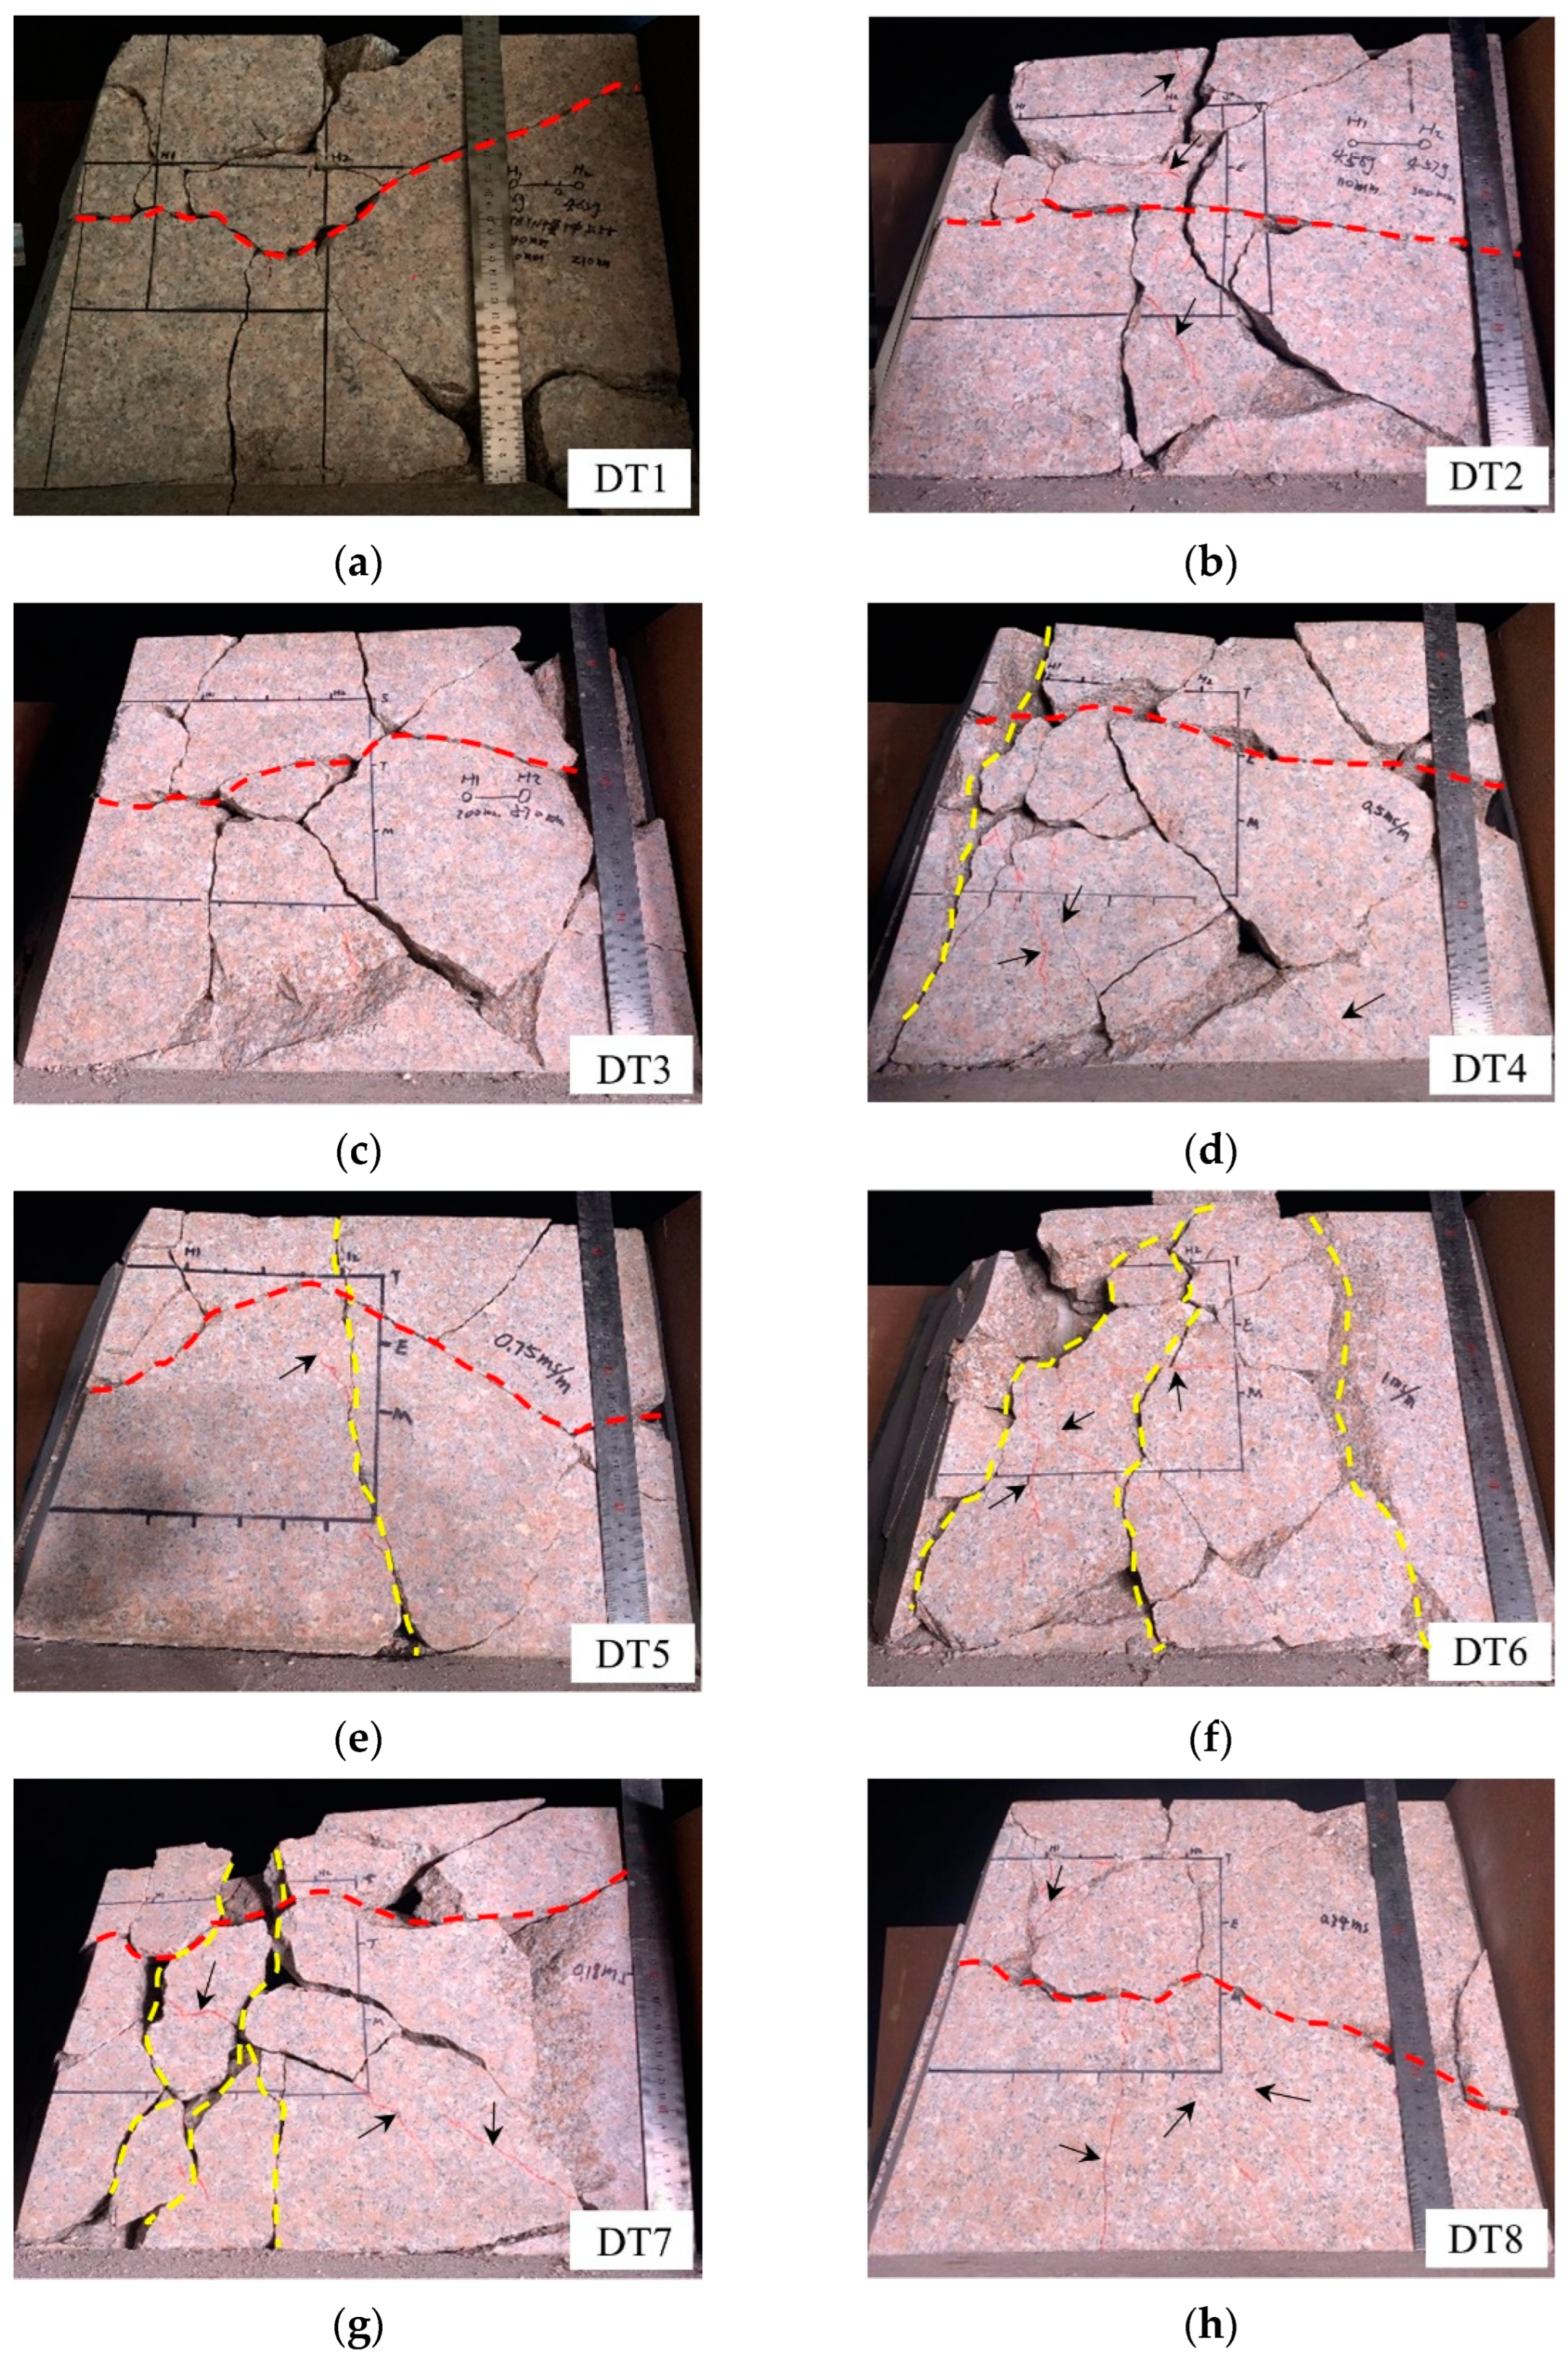
3.3. Post-Blast Pattern with Fragments Backfilled

The post-blast pattern of the bench specimens is shown in Figure 14.
To further evaluate the influence of delay time on the blasting excavation quality, all fragments produced in experiments were collected, and the coarse ones were spliced and backfilled into the post-blast bench specimens. The eight blast experiments’ post-blast models with fragments backfilled are summarized in Figure 15.
Figure 15 illustrates the crack network of the post-blast bench slope. All specimens had horizontal-penetrating cracks on bench slopes except DT6. In the DT1-DT3 experiments, the vertical cracks were distributed on both sides of the horizontal-penetrating crack, and most of them were independent of each other without a co-fracture plane. This post-blast pattern indicates that the horizontal cracks on the bench slope initiated in preference to the vertical cracks and dominated the fragmentation. As the delay time increased, a vertical-penetrating crack appeared on the slopes of DT4 and DT5, respectively. Until the DT6 and DT7 experiments, the number of vertical-penetrating cracks gradually increased. Even the DT6 experiment lost its horizontal-penetrating crack within a co-fracture plane, which indicates that the horizontal-crack-dominated fragmentation transformed to a vertical-crack-dominated fragmentation. In the experiment of DT7, the number of fragments formed on the slope reached the maximum among all experiments. However, only one horizontal-penetrating crack appeared on the bench slope of the DT8 experiment with the longest delay time.

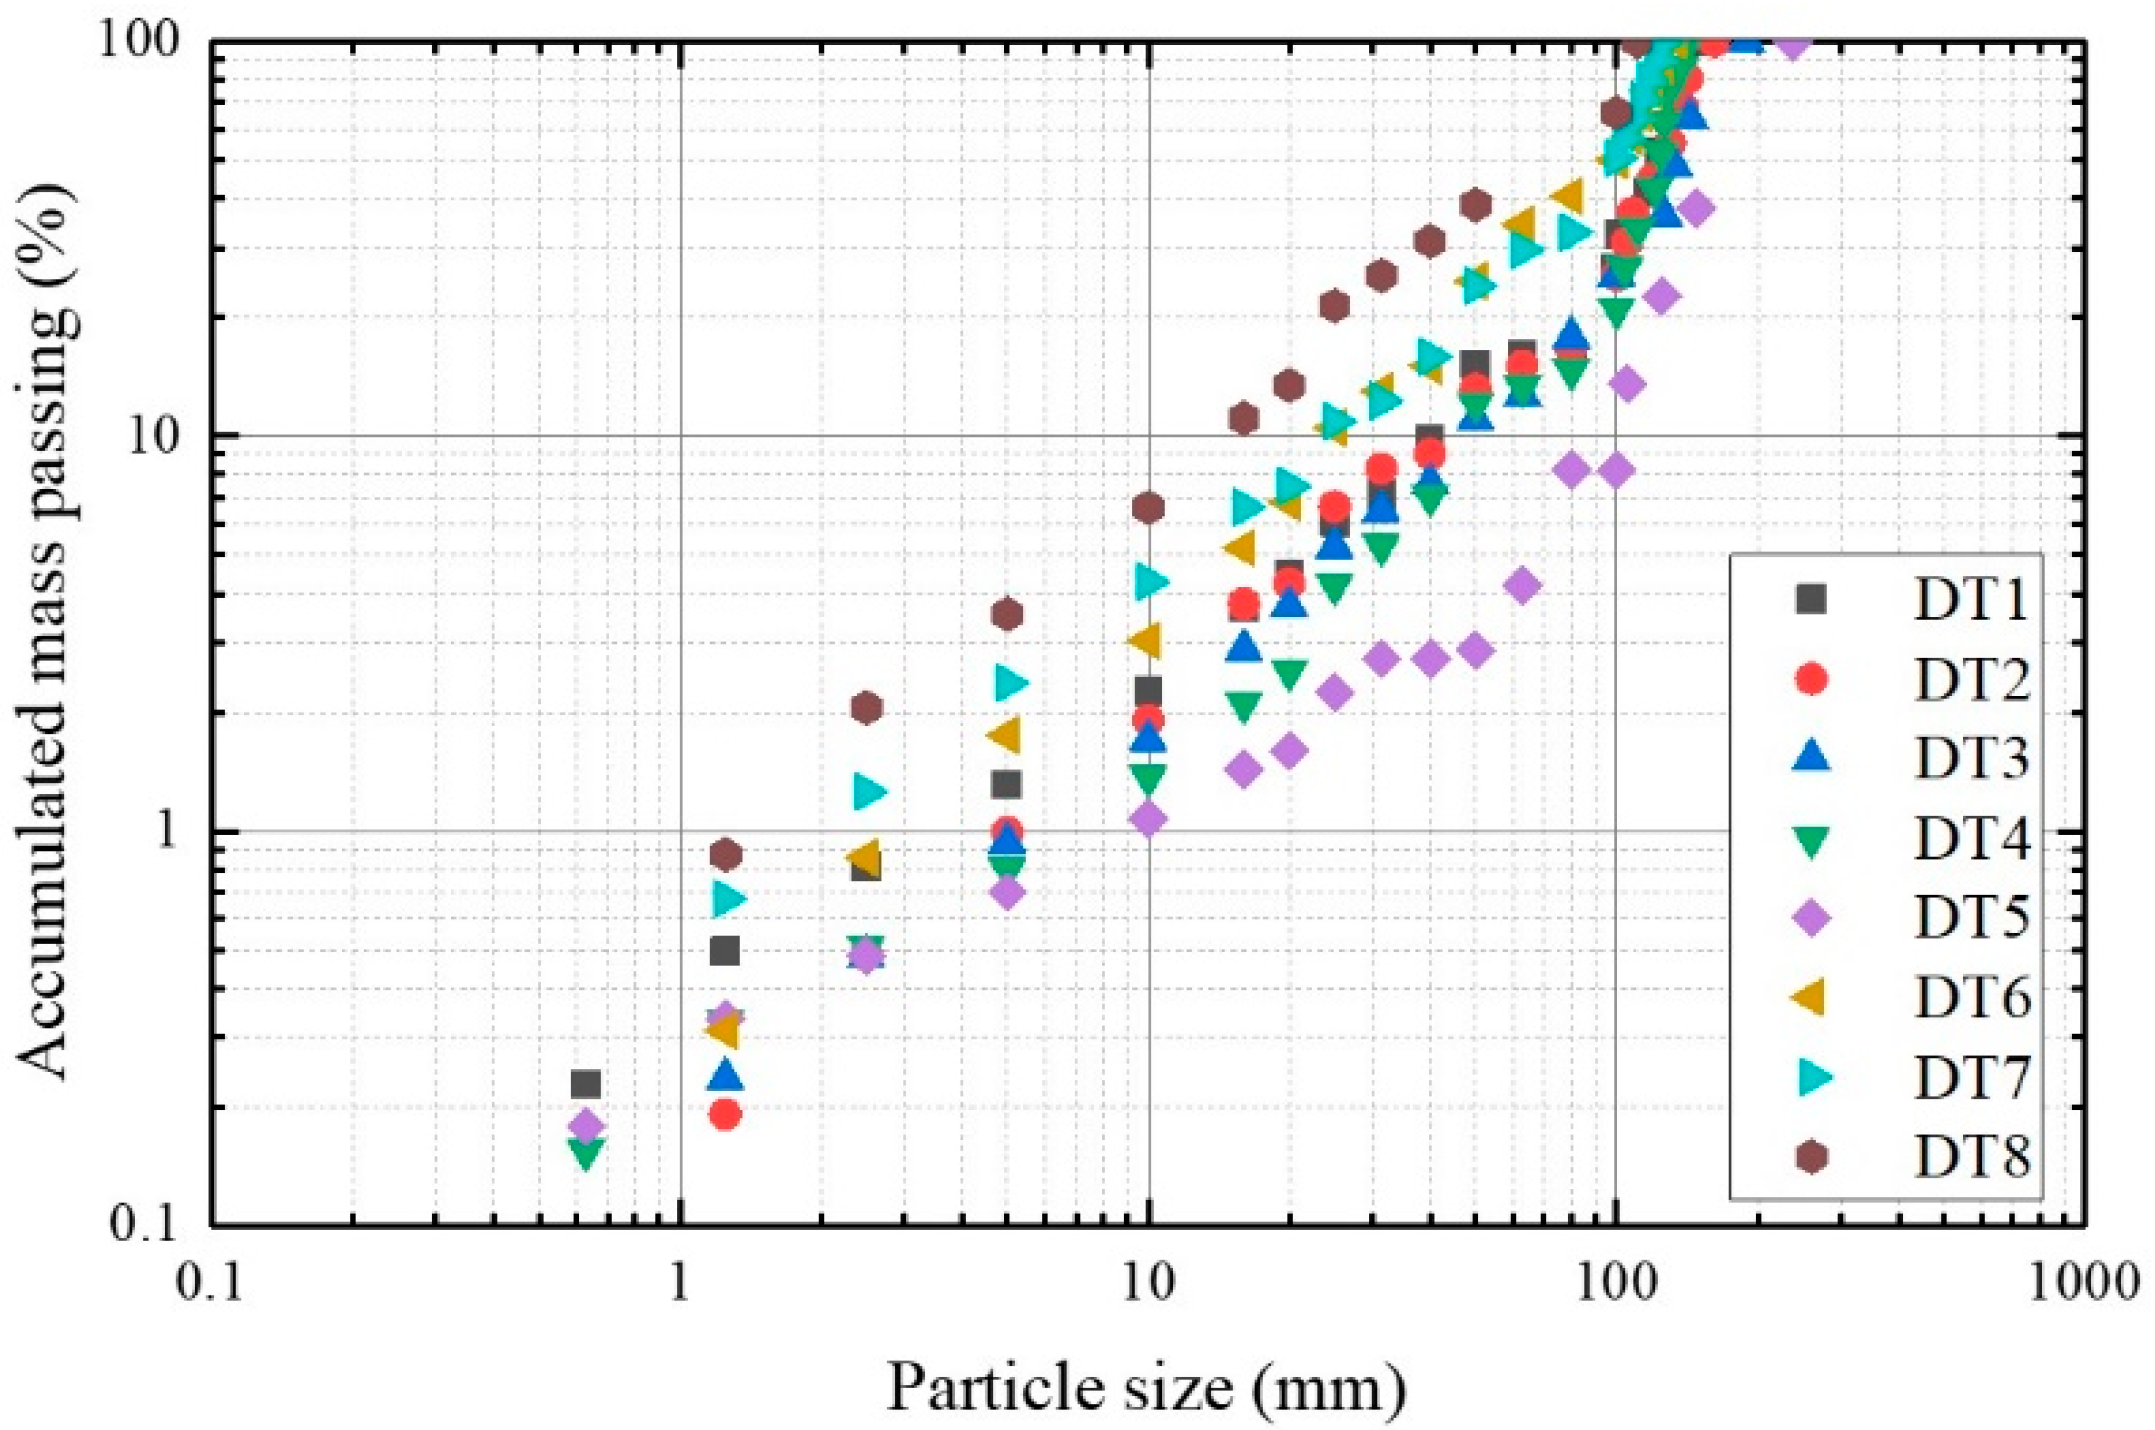
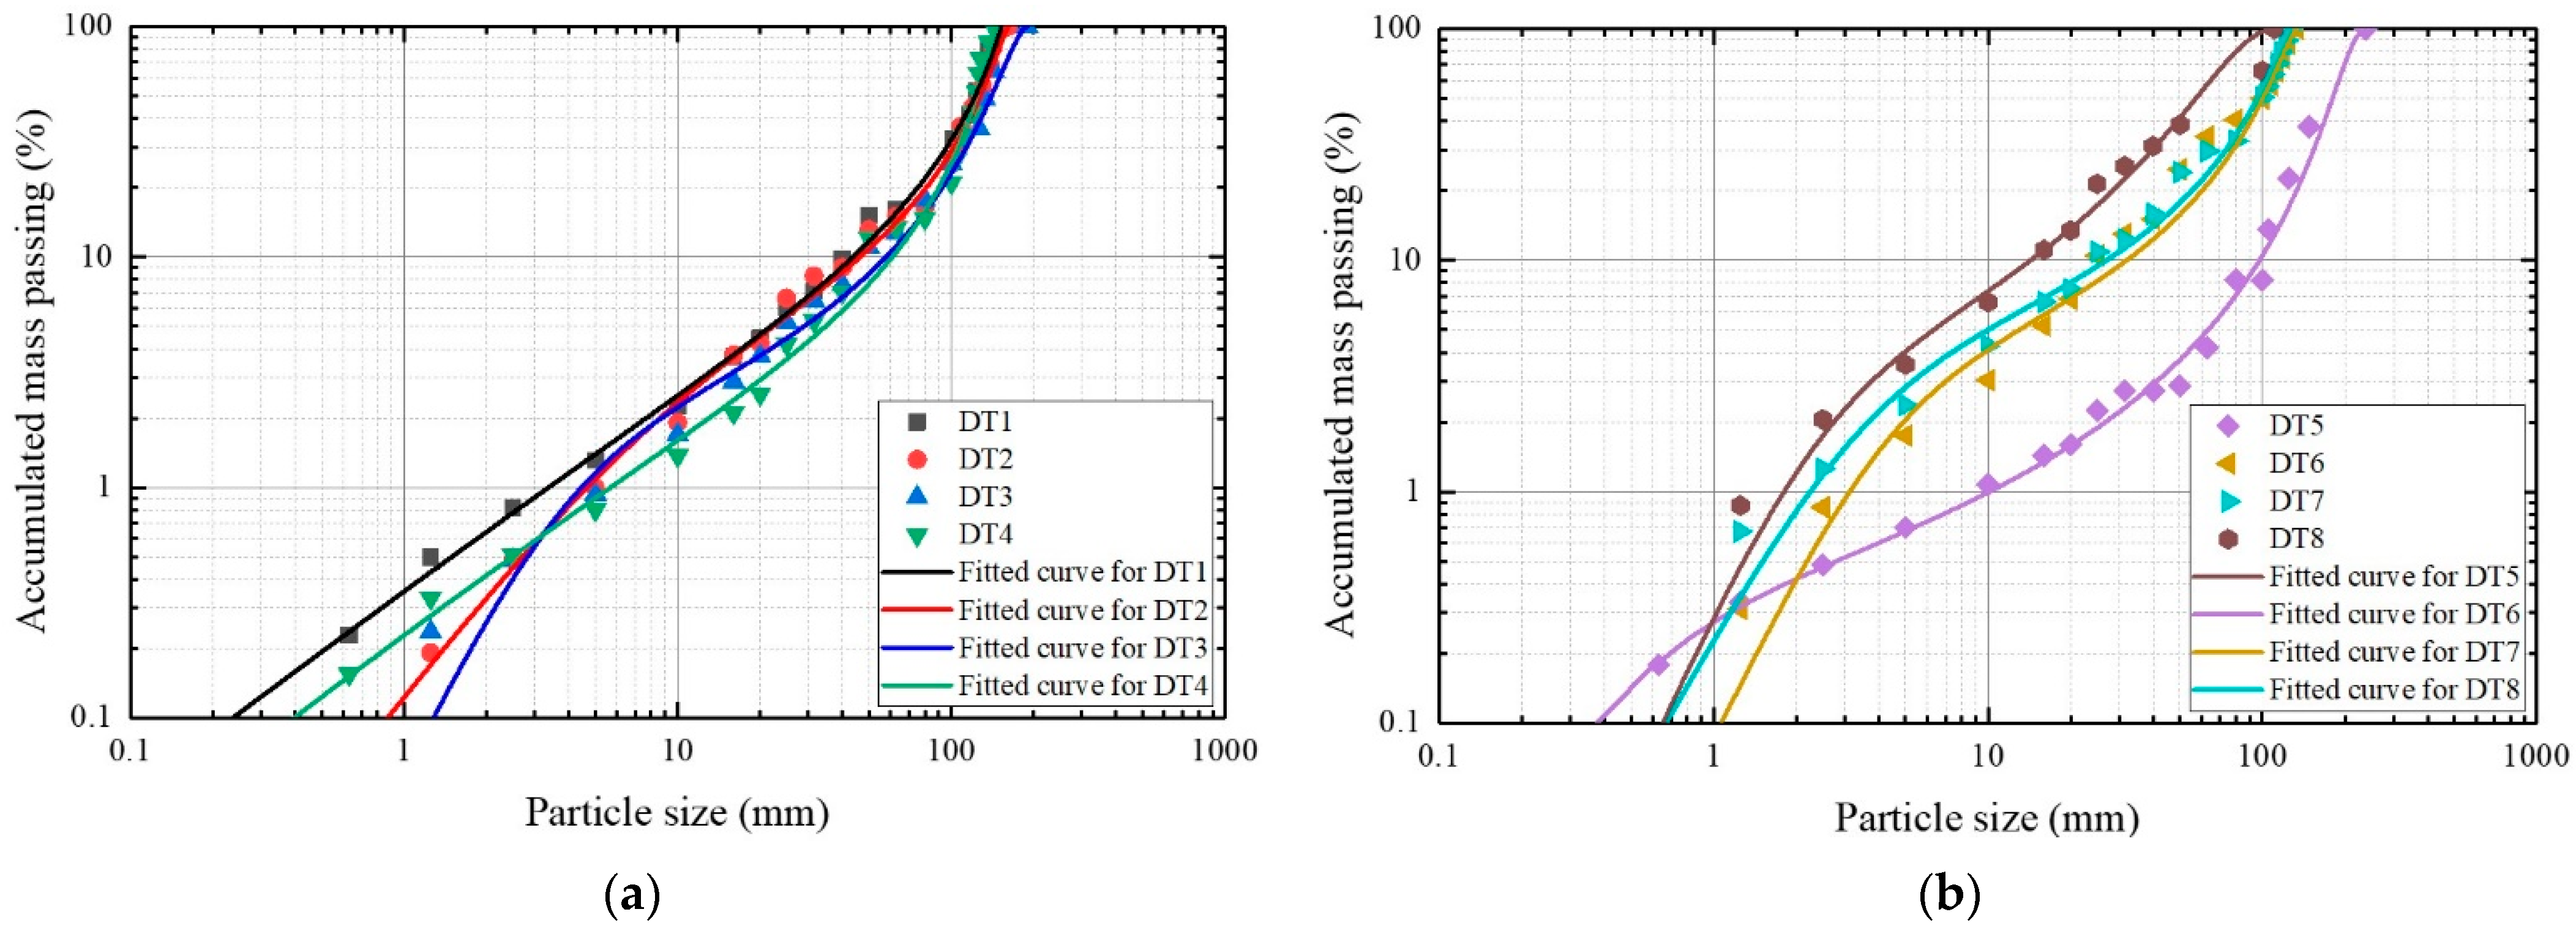
3.4. Fragment Size Distribution

A series of standard sieves with 17 sizes from 0.08 mm to 100 mm were used to screen the post-blast fragments. The fragments with sizes larger than 100 mm were weighted individually. The weights of fragments are listed in Table A1 Appendix A. The summarized sieving results are shown by scatterplots in Figure 16.
The extended Swebrec function P(x) was used to fit the sieving data. Its expression is [45]:
P ( x ) = 1 1 + a [ ln ( x max / x ) / ln ( x max / x 50 ) ] b + ( 1 a ) [ ( x max x 1 ) / ( x max x 50 1 ) ] c
The extended Swebrec function with five parameters can fit most fragment size distributions with extreme accuracy [44], where xmax is the maximum size, x50 is the mean size, and a (0 ≤ a ≤ 1) is the partition coefficient. b and c are the undulation exponents. The least-squares method was used to fit the curve. The function (1/P2) was used as the weighting function [49]. The fitted parameters of each specimen are listed in Table 2.
The fitted curves and sieving data are shown in Figure 17. The accumulated mass passing is usually classified as very fine (<2%), fine (2–20%), central (20–80%), and coarse (>80%) [50]. At the same accumulated mass passing, smaller particle sizes mean finer fragments. Four percentages were selected as the given accumulated mass passing, i.e., 0.1%, 1%, 50%, and 100%. The fragment sizes of all experiments at the four percentages of mass passing are listed in Table 3.
In Figure 17a, the fitted curves of DT1-DT3 experiments moved down with the delay time increasing in the 10–100% mass passing. The movement indicates that the fragment size increased with the delay time (in the range of 13.69–54.72 μs) at the same accumulated mass passing. When the delay time was increased to 60 μs in the DT4 experiment, the fitted curve did not continue to move down. Table 3 shows that the particle size of DT4 was smaller than that of DT3 in the 50–100% mass passing. It suggests that the further delay time increase did not make the fragments coarser. Taking 100% mass passing as an example, the particle size of DT3 was 189.4 mm, but that of DT4 was 142.3 mm. The 100% passing size of DT3 was 1.3 times greater than that of DT4. Meanwhile, the x100 of DT4 was also smaller than those of DT1 and DT2.
Figure 17b shows the fitted curves of DT5-DT8 experiments. The fitted curve and particle size of DT5 showed that fragments presented extremely at both ends of the accumulated mass passing. In the 100% mass passing, the fragment size of DT5 reached 237.7 mm. However, in the 0.1% mass passing, the fragment size of DT5 was only 0.37 mm, which was significantly smaller than those of other experiments except DT1. DT5 produced more coarse fragments and more fine materials. Obviously, DT5 obtained the worst fragment size distribution. The fitted curves of DT6-DT8 presented a gradual upward trend in the logarithmic space at the range of 10–100% mass passing. Within the range, DT8 had the smallest particle size in the same accumulated mass passing.
Table 3 shows that DT1 had the smallest x0.1 with a particle size of 0.24 mm among the eight experiments, and DT8 had the smallest x1, x50, and x100 with particle sizes of 1.8 mm, 57.1 mm, and 111 mm, respectively. x50 is commonly used in engineering to evaluate the blasting quality [51]. The histogram of x50 and delay time is shown in Figure 18.
In these bench blasting experiments, the minimum value of x50 appeared in DT8. The post-blast picture shows that the DT8 specimen, with the longest delay time, had the smallest excavation. Thus, DT8 had the worst blasting quality. Among the other seven blasting experiments, DT7 had the smallest mean fragment size of 98.7 mm. Zhang [1] pointed out that good fragmentation requires as many small fragments as possible, and fewer boulders and fine particles are also important. The fragment size distribution of DT7 is consistent with the option. In summary, the DT7 model with 180 μs delay time obtained the best blasting excavation quality.

4. Discussion

To briefly explain the mechanism of delay time on blasting fragmentation, the stress wave was analyzed in a two-dimensional horizontal plane. The propagation of the P-wave generated from borehole-A is shown in Figure 19. The solid line represents the front of the P-wave and the dashed line represents the tail of the P-wave.
Stress waves propagate in the specimen after the detonation of borehole-A. The P-wave in both intersections has not reached the free surface at 13.69 μs. If the borehole-B is detonated at this time, the P-wave of borehole-A and borehole-B will superpose between the two holes. Similarly, if the delay time between boreholes is 27.36 μs, the P-wave from borehole-A will propagate to the center of borehole-B. It can be seen from Figure 18b that the P-wave from borehole-B will interact with the tensile wave formed by the P-wave from borehole-A reflected at the free surface. When the delay time increases to 54.72 μs, the superposition of the stress waves between the two holes is relatively weak compared to the above two short delay times. The above three cases represent the stress wave propagation in the DT1-DT3 experiments. The same method of stress wave analysis can be used in the remaining experiments.
In the first three experiments, the particle size gradually coarsened with the weakened stress wave superposition. This weakening did not consistently increase the particle size of fragments. In the experiment of DT4 (60 μs), the fragment size was significantly reduced in the coarse zone, and fragmentation was improved. When the delay time was increased to 90 μs, the maximum x100 was obtained. In the experiments of DT5-DT8, the stress wave interaction disappeared, but the particle size decreased with the increase in delay time. DT1, with P-wave superposition between the blast holes, did not achieve the smallest particle size of x50. The x50 of DT7 improved by 19% compared to that of DT1. Although there was no superposition of stress waves, the DT7 specimen achieved the best fragment size distribution. This suggests that as the delay time increased, there were factors other than stress wave interaction that improved rock fragmentation. In particular, the improvement in the coarse zone was significant when a longer delay time was used.
As the above description, stress wave superposition is not the only important factor in affecting the fragment size distribution in multi-hole bench blasting. During rock blasting, the crack velocity is slower than the P-wave velocity. Bergmann et al. [52] studied the crack velocity of granite and measured the coefficient between crack velocity and P-wave velocity as 0.33. When the delay time increases, the crack formed by the first blast hole obtains enough time to extend and is influenced by the stress wave from the neighboring blast hole during blasting. The full-field strains, progressive breakage processes, and post-blast patterns with fragments backfilled showed that with the increase in delay time, vertical cracks gradually dominated in rock fragmentation. For the column charge in the borehole, the vertical crack extension of the bench slope seemed more favorable to rock fragmentation. In particular, for the radial cracks extending from the blast hole to the free surface, the increase in delay time made the extension distance gradually increase. This crack extension provides new boundary conditions for the neighboring borehole. Thus, the crack propagation needs to be considered in addition to stress distribution to determine the optimal delay time in multi-hole bench blasting.

5. Conclusions

Eight blasting experiments of the double-hole bench specimens were carried out. The experimental results can provide a reference for the practical bench blasting design.
The following conclusions are yielded:
  • The 3D-DIC technique is successfully applied to analyze the strain field before visible cracks appear on the bench slope. The results indicate that the development direction of the strain concentration zone changes from horizontal to vertical as the delay time increases.
  • The fracture pattern on the bench slope shows that with the delay time increased, the breakage pattern of the bench slope transforms from horizontal cracks dominated to vertical cracks dominated.
  • The extended Swebrec function is used to fit the curve of fragment size distribution. As the delay time increases, the difference in fragment size at the same percentage of mass passing becomes progressively significant. While maintaining the excavated rock mass, DT7 can be considered to have the optimal delay time of 180 µs by the average fragment size, ×50, as an evaluation parameter.
  • Delay time affects the fragmentation of rock. Fragmentation improves when the delay time is long without the stress wave interaction, especially in the coarse zone.

Author Contributions

Conceptualization, J.Y. and X.L.; methodology, H.-L.T. and Q.Y.; software, Q.Y.; validation, J.Y.; formal analysis, H.-L.T.; investigation, H.-L.T.; resources, J.Y.; data curation, H.-L.T. and X.L.; writing—original draft preparation, H.-L.T.; writing—review and editing, H.-L.T. and X.L.; visualization, H.-L.T. and Q.Y.; supervision, J.Y. and Q.Y.; project administration, J.Y.; funding acquisition, J.Y. All authors have read and agreed to the published version of the manuscript.

Funding

This research was funded by the National Natural Science Foundation of China, grant numbers 12002047 and 51774043.

Institutional Review Board Statement

Not applicable.

Informed Consent Statement

Not applicable.

Data Availability Statement

Not applicable.

Conflicts of Interest

The authors declare no conflict of interest.

Appendix A

Table A1. Weight of all fragments (g).
Size (mm)DT1DT2DT3DT4DT5DT6DT7DT8
0.083.5001.13.101.00
0.1511.401.36.917.404.01.3
0.31540.03.52.533.631.65.613.82.3
0.6364.952.656.647.245.167.3152.243.5
1.2576.185.662.747.743.5127.1148.063.9
2.5118.6148.1116.278.563.1208.4281.680.6
5227.3268.7196.1153.4108.6300.6483.8164.3
10345.6540.0300.8197.7104.7505.5592.5243
16184.9137.7212.1118.147.8377.4218.5127.5
20333.8699.9390.8443.9187.9852.4868.0428.4
25306.2481.3315.1288.3141.7578.9355.8225.3
31.5650.5212.9279.1476.10488.9907.6303.9
401274.51202.2875.51360.541.02244.22066.0397.0
50223.7567.5430.5329.3384.32227.71431.0152.3
630462.61300.1369.81169.01467.0800.10
802530.92600.11985.01681.502194.04503.21321.3
>1001421.71577.92715.01524.51572.41682.31512.61847.1
>1002172.11711.13134.41831.02631.61930.71730.1
>1002563.32333.63968.32385.14375.92256.11957.0
>1003233.62975.49162.22578.418,122.72596.22146.6
>1003501.83625.3 2731.8 3214.12474.9
>1004761.43831.7 2814.2 2710.4
>100 5681.1 3454.6
>100 3884.3

References

  1. Zhang, Z.-X. Rock Fracture and Blasting: Theory and Applications; Butterworth-Heinemann: Oxford, UK, 2016; ISBN 0128027045. [Google Scholar]
  2. Fernández, P.R.; Rodríguez, R.; Bascompta, M. Holistic Approach to Define the Blast Design in Quarrying. Minerals 2022, 12, 191. [Google Scholar] [CrossRef]
  3. Ylitalo, R.M.; Zhang, Z.X.; Bergström, P. Effect of detonator position on rock fragmentation: Full-scale field tests at Kevitsa open pit mine. Int. J. Rock Mech. Min. Sci. 2021, 147, 104918. [Google Scholar] [CrossRef]
  4. Zhang, Z.X.; Ouchterlony, F. Energy Requirement for Rock Breakage in Laboratory Experiments and Engineering Operations: A Review. Rock Mech. Rock Eng. 2022, 55, 629–667. [Google Scholar] [CrossRef]
  5. Nikkhah, A.; Vakylabad, A.B.; Hassanzadeh, A.; Niedoba, T.; Surowiak, A. An Evaluation on the Impact of Ore Fragmented by Blasting on Mining Performance. Minerals 2022, 12, 258. [Google Scholar] [CrossRef]
  6. Wilson, W.H.; Holloway, D.C. Fragmentation studies in instrumented concrete models. In Proceedings of the 6th ISRM Congress, Montreal, Canada, 30 August–3 September 1987; OnePetro: Richardson, TX, USA, 1987. [Google Scholar]
  7. Johansson, D.; Ouchterlony, F. Shock Wave Interactions in Rock Blasting: The Use of Short Delays to Improve Fragmentation in Model-Scale. Rock Mech. Rock Eng. 2013, 46, 18. [Google Scholar] [CrossRef]
  8. Hashemi, A.S.; Katsabanis, P. The Effect of Stress Wave Interaction and Delay Timing on Blast-Induced Rock Damage and Fragmentation. Rock Mech. Rock Eng. 2020, 53, 2327–2346. [Google Scholar] [CrossRef]
  9. Yin, Z.; Wang, D.; Wang, X.; Dang, Z.; Li, W. Optimization and application of spacing parameter for loosening blasting with 24-m-high bench in barun open-pit mine. Shock Vib. 2021, 2021, 6670276. [Google Scholar] [CrossRef]
  10. Sanchidrián, J.A.; Segarra, P.; Ouchterlony, F.; Gómez, S. The Influential Role of Powder Factor vs. Delay in Full-Scale Blasting: A Perspective Through the Fragment Size-Energy Fan. Rock Mech. Rock Eng. 2022, 55, 4209–4236. [Google Scholar] [CrossRef]
  11. Rossmanith, H.P.; Kouzniak, N. Supersonic Detonation in Rock Mass—Part 2: Particle Displacements and Velocity Fields for Single and Multiple Non-Delayed and Delayed Detonating Blastholes. Fragblast 2004, 8, 95–117. [Google Scholar] [CrossRef]
  12. Rossmanith, H.P. The Use of Lagrange Diagrams in Precise Initiation Blasting. Part I: Two Interacting Blastholes. Fragblast 2002, 6, 104–136. [Google Scholar] [CrossRef]
  13. Vanbrabant, F.; Espinosa, A. Impact of short delays sequence on fragmentation by means of electronic detonators: Theoretical concepts and field validation. Fragblast 2006, 8, 326–331. [Google Scholar]
  14. Chiappetta, F. Combining electronic detonators with stem charges and air decks. In Proceedings of the Drill and Blast 2010 Conference, Brisbane, QLD, Australia, 12–14 October 2010. [Google Scholar]
  15. Mckinstry, R. Implementation of Electronic Detonators at Barrick Goldstrike Mines, Inc. In Proceedings of the Annual Conference on Explosives and Blasting Technique, New Orleans, LA, USA, 1–4 February 2004; Volume 1, pp. 349–360. [Google Scholar]
  16. Blair, D. Blast vibration control in the presence of delay scatter and random fluctuations between blastholes. Int. J. Numer. Anal. Methods Geomech. 1993, 17, 95–118. [Google Scholar] [CrossRef]
  17. Blair, D. A comparison of Heelan and exact solutions for seismic radiation from a short cylindrical charge. Geophysics 2007, 72, E33–E41. [Google Scholar] [CrossRef]
  18. Katsabanis, P.D.; Tawadrous, A.; Braun, C.; Kennedy, C. Timing effects on the fragmentation of small scale blocks of granodiorite. Fragblast 2006, 10, 83–93. [Google Scholar] [CrossRef]
  19. Schimek, P. Improvement of Fragmentation by Blasting-Investigation of the Influence of Delay-Times on the Crack Development in the Surrounding Rock, the Characteristics of the Blasted Bench Face and the Fragmentation of the Further Rows. Ph.D. Thesis, University of Leoben, Leoben, Austria, 2015. [Google Scholar]
  20. Omidi, O. Timing Effects on Fragmentation by Blasting. Ph.D. Thesis, Queen’s University, Kingston, ON, Canada, 2015. [Google Scholar]
  21. Schill, M.; Sjöberg, J. Finite Element simulations of blasting and fragmentation with precise initiation. In Proceedings of the 12th International LS-DYNA Users Conference, Detroit, MI, USA, 3–5 June 2012; pp. 1–10. [Google Scholar]
  22. Rathore, S.S.; Bhandari, S. Controlled fracture growth by blasting while protecting damages to remaining rock. Rock Mech. Rock Eng. 2007, 40, 317–326. [Google Scholar] [CrossRef]
  23. Wu, B.; Xia, K.; Guo, Y. Influence of hydrostatic confining pressure on the dynamic tensile failure of rock material. In Proceedings of the 50th US Rock Mechanics/Geomechanics Symposium, Houston, TX, USA, 26–29 June 2016; OnePetro: Richardson, TX, USA, 2016. [Google Scholar]
  24. Zhao, J.; Zhou, Y.X.; Hefny, A.M.; Cai, J.G.; Chen, S.G.; Li, H.B.; Liu, J.F.; Jain, M.; Foo, S.T.; Seah, C.C. Rock dynamics research related to cavern development for ammunition storage. Tunn. Undergr. Space Technol. 1999, 14, 513–526. [Google Scholar] [CrossRef]
  25. Zhang, Q.B.; Zhao, J. A review of dynamic experimental techniques and mechanical behaviour of rock materials. Rock Mech. Rock Eng. 2014, 47, 1411–1478. [Google Scholar] [CrossRef] [Green Version]
  26. Zhang, Q.B.; Zhao, J. Determination of mechanical properties and full-field strain measurements of rock material under dynamic loads. Int. J. Rock Mech. Min. Sci. 2013, 60, 423–439. [Google Scholar] [CrossRef]
  27. Lenoir, N.; Bornert, M.; Desrues, J.; Bésuelle, P.; Viggiani, G. Volumetric digital image correlation applied to X-ray microtomography images from triaxial compression tests on argillaceous rock. Strain 2007, 43, 193–205. [Google Scholar] [CrossRef]
  28. Bornert, M.; Vales, F.; Gharbi, H.; Nguyen Minh, D. Multiscale full-field strain measurements for micromechanical investigations of the hydromechanical behaviour of clayey rocks. Strain 2010, 46, 33–46. [Google Scholar] [CrossRef]
  29. Hedan, S.; Cosenza, P.; Valle, V.; Dudoignon, P.; Fauchille, A.-L.; Cabrera, J. Investigation of the damage induced by desiccation and heating of Tournemire argillite using digital image correlation. Int. J. Rock Mech. Min. Sci. 2012, 51, 64–75. [Google Scholar] [CrossRef]
  30. Cheng, J.-L.; Yang, S.-Q.; Chen, K.; Ma, D.; Li, F.-Y.; Wang, L.-M. Uniaxial experimental study of the acoustic emission and deformation behavior of composite rock based on 3D digital image correlation (DIC). Acta Mech. Sin. 2017, 33, 999–1021. [Google Scholar] [CrossRef]
  31. Munoz, H.; Taheri, A. Local damage and progressive localisation in porous sandstone during cyclic loading. Rock Mech. Rock Eng. 2017, 50, 3253–3259. [Google Scholar] [CrossRef]
  32. Xing, H.Z.; Zhang, Q.B.; Ruan, D.; Dehkhoda, S.; Lu, G.X.; Zhao, J. Full-field measurement and fracture characterisations of rocks under dynamic loads using high-speed three-dimensional digital image correlation. Int. J. Impact Eng. 2018, 113, 61–72. [Google Scholar] [CrossRef]
  33. Zhou, Z.; Yuan, Z.; Jiang, Y.; Yang, Z.O.U.; Xin, C.A.I.; Li, D. Dynamic behavior of rock during its post failure stage in SHPB tests. Trans. Nonferrous Met. Soc. China 2017, 27, 184–196. [Google Scholar] [CrossRef]
  34. Xu, X.; Chi, L.-Y.; Yang, J.; Yu, Q. Experimental Study on the Temporal and Morphological Characteristics of Dynamic Tensile Fractures in Igneous Rocks. Appl. Sci. 2021, 11, 11230. [Google Scholar] [CrossRef]
  35. Xu, X.; Chi, L.-Y.; Yang, J.; Lv, N. Investigation on the Deformation and Failure Characteristics of Concrete in Dynamic Splitting Tests. Materials 2022, 15, 1681. [Google Scholar] [CrossRef]
  36. Yang, L.; Ding, C.; Yang, R.; Lei, Z.; Wang, J. Full field strain analysis of blasting under high stress condition based on digital image correlation method. Shock Vib. 2018, 2018, 4894078. [Google Scholar] [CrossRef]
  37. Chi, L.Y.; Zhang, Z.X.; Aalberg, A.; Yang, J.; Li, C.C. Fracture Processes in Granite Blocks Under Blast Loading. Rock Mech. Rock Eng. 2019, 52, 853–868. [Google Scholar] [CrossRef]
  38. Yang, J.; Liu, X.; Xu, Z.; Tang, H.; Yu, Q. Full-Field Strain Characterizations and Fracture Process of Rock Blasting Using a Small-Scale Double-Hole Bench Model. Adv. Civ. Eng. 2020, 2020, 8649258. [Google Scholar] [CrossRef]
  39. He, C.; Yang, J. Experimental and numerical investigations of dynamic failure process in rock under blast loading. Tunn. Undergr. Space Technol. 2019, 83, 552–564. [Google Scholar] [CrossRef]
  40. Yang, J.; Liu, X.; Xu, Z.; Tang, H.; Yu, Q. Study of Rock Blasting Failure Pattern with One Free Boundary. Adv. Civ. Eng. 2020, 2020, 1926824. [Google Scholar] [CrossRef]
  41. Zhang, Z.-X.; Hou, D.-F.; Guo, Z.; He, Z.; Zhang, Q. Experimental study of surface constraint effect on rock fragmentation by blasting. Int. J. Rock Mech. Min. Sci. 2020, 128, 104278. [Google Scholar] [CrossRef]
  42. Zhang, Z.-X.; Hou, D.-F.; Guo, Z.; He, Z. Laboratory experiment of stemming impact on rock fragmentation by a high explosive. Tunn. Undergr. Space Technol. 2020, 97, 103257. [Google Scholar] [CrossRef]
  43. Liu, M.; Liu, J.; Zhen, M.; Zhao, F.; Xiao, Z.; Shan, P.; Wang, Y.; Ou, C.; Zheng, H.; Liu, Z. A comprehensive evaluation method of bench blast performance in open-pit mine. Appl. Sci. 2020, 10, 5398. [Google Scholar] [CrossRef]
  44. Ouchterlony, F. The Swebrec function: Linking fragmentation by blasting and crushing. Min. Technol. 2005, 114, 29–44. [Google Scholar] [CrossRef] [Green Version]
  45. Sanchidrián, J.A.; Ouchterlony, F.; Moser, P.; Segarra, P.; López, L.M. Performance of some distributions to describe rock fragmentation data. Int. J. Rock Mech. Min. Sci. 2012, 53, 18–31. [Google Scholar] [CrossRef]
  46. Yi, C.; Sjöberg, J.; Johansson, D.; Petropoulos, N. A numerical study of the impact of short delays on rock fragmentation. Int. J. Rock Mech. Min. Sci. 2017, 100, 250–254. [Google Scholar] [CrossRef]
  47. Yi, C.; Sjöberg, J.; Johansson, D. Numerical modelling for blast-induced fragmentation in sublevel caving mines. Tunn. Undergr. Space Technol. 2017, 68, 167–173. [Google Scholar] [CrossRef]
  48. Chi, L.Y.; Zhang, Z.-X.; Aalberg, A.; Li, C.C. Experimental Investigation of Blast-Induced Fractures in Rock Cylinders. Rock Mech. Rock Eng. 2019, 52, 2569–2584. [Google Scholar] [CrossRef]
  49. Sanchidrián, J.A.; Segarra, P.; López, L.M.; Ouchterlony, F.; Moser, P. Evaluation of some distribution functions for describing rock fragmentation data. In Proceedings of the 9th International Symposium on Rock Fragmentation by Blasting, FRAGBLAST 9, Granada, Spain, 13–17 August 2009; pp. 239–248. [Google Scholar]
  50. Sanchidrián, J.A.; Ouchterlony, F.; Segarra, P.; Moser, P. Size distribution functions for rock fragments. Int. J. Rock Mech. Min. Sci. 2014, 71, 381–394. [Google Scholar] [CrossRef]
  51. Ouchterlony, F. Reply to Discussion of “The Case for the Median Fragment Size as a Better Fragment Size Descriptor than the Mean” by Finn Ouchterlony, Rock Mech. Rock Eng., published online 15 March 2015. Rock Mech. Rock Eng. 2016, 49, 339–342. [Google Scholar] [CrossRef]
  52. Bergmann, O.R.; Riggle, J.W.; Wu, F.C. Model rock blasting—Effect of explosives properties and other variables on blasting results. Int. J. Rock Mech. Min. Sci. Geomech. Abstr. 1973, 10, 585–612. [Google Scholar] [CrossRef]
Figure 1. Details dimensions of the double-hole bench model: (a) three-dimensional view; (b) top surface.
Applsci 13 00085 g001
Figure 2. The PETN charge structure.
Applsci 13 00085 g002
Figure 3. The cross-section of the bench specimen with filled charge structure and detonating cord.
Applsci 13 00085 g003
Figure 4. The assembled DT2 bench blasting model.
Applsci 13 00085 g004
Figure 5. Schematic of the experimental layouts.
Applsci 13 00085 g005
Figure 6. The projections of AOI on the cross-section of bench specimens.
Applsci 13 00085 g006
Figure 7. Surface strain field of DT2.
Applsci 13 00085 g007
Figure 8. Surface strain field of DT4.
Applsci 13 00085 g008
Figure 9. Surface strain field of DT7.
Applsci 13 00085 g009
Figure 10. The dynamic breakage process of DT1.
Applsci 13 00085 g010
Figure 11. The dynamic breakage processes of the AOI: (a) the AOI of DT2; (b) the AOI of DT3.
Applsci 13 00085 g011
Figure 12. The dynamic breakage processes of the AOI: (a) the AOI of DT4; (b) the AOI of DT5; (c) the AOI of DT7.
Applsci 13 00085 g012
Figure 13. The dynamic breakage process of DT8.
Applsci 13 00085 g013
Figure 14. Post-blast bench specimens: (a) post-blast bench specimen of DT2; (b) post-blast bench specimen of DT3; (c) post-blast bench specimen of DT5; (d) post-blast bench specimen of DT6.
Applsci 13 00085 g014
Figure 15. Post-blast patterns with fragments backfilled: (a) post-blast pattern of DT1; (b) post-blast pattern of DT2; (c) post-blast pattern of DT3; (d) post-blast pattern of DT4; (e) post-blast pattern of DT5; (f) post-blast pattern of DT6; (g) post-blast pattern of DT7; (h) post-blast pattern of DT8.
Applsci 13 00085 g015
Figure 16. Accumulated mass passing vs. particle size.
Applsci 13 00085 g016
Figure 17. Fitted curves by using the extended Swebrec function: (a) fitted curves of DT1-DT4; (b) fitted curves of DT5-DT8.
Applsci 13 00085 g017
Figure 18. Particle size at 50% mass passing vs. delay time.
Applsci 13 00085 g018
Figure 19. P-wave propagation at two intersections of a bench blasting model with three kinds of delays: (a) the bottom intersection of the bench slope; (b) the top intersection of charge column.
Applsci 13 00085 g019
Table 1. Delay times and charge weights for eight granite bench specimens.
Specimen No.Delay Time (µs)Charge
Weight of A
(g)
Charge
Weight of B
(g)
DT113.694.64.63
DT227.364.584.57
DT354.724.594.61
DT4604.584.59
DT5904.634.58
DT61204.614.57
DT71804.564.62
DT8339.64.574.59
Table 2. Parameters of fitted curves using the extended Swebrec function.
Specimen No. Delay Time
(μs)
xmax
(mm)
x50
(mm)
abcR2
DT113.69152.3122.10.22271.4380.9070.9784
DT227.36161.5127.60.95681.2491.5280.9629
DT354.72189.4140.10.99961.5992.4250.9514
DT460142.3123.30.37091.3570.94280.9631
DT590237.7179.90.99981.8891.9680.9637
DT6120133.6100.10.99951.3652.4430.9654
DT7180126.295.70.99891.2662.1450.9728
DT8339.6111.057.10.99871.9292.6010.9441
Table 3. Results from fitted curves of particle sizes at 0.1%, 1%, 50%, and 100% mass passing.
Specimen No.Delay Time
(μs)
x0.1
(mm)
x1
(mm)
x50
(mm)
x100
(mm)
DT113.690.243.37122.1152.3
DT227.360.874.65127.6161.5
DT354.721.274.44140.1189.4
DT4600.395.67123.3142.3
DT5900.3710.10179.9237.7
DT61201.063.13100.1133.6
DT71800.672.2595.7126.2
DT8339.60.651.8057.1111.0
Disclaimer/Publisher’s Note: The statements, opinions and data contained in all publications are solely those of the individual author(s) and contributor(s) and not of MDPI and/or the editor(s). MDPI and/or the editor(s) disclaim responsibility for any injury to people or property resulting from any ideas, methods, instructions or products referred to in the content.

