Article

Use of Sentinel-1 Multi-Configuration and Multi-Temporal Series for Monitoring Parameters of Winter Wheat

1
Centre d’Etudes Spatiales de la Biosphère, University of Toulouse, CNES/CNRS/IRD/INRA/UPS, 31400 Toulouse, France
2
ACMG, Association Climatologique de la Moyenne Garonne, Aérodrome d’Agen, 47520 Le Passage, France
3
CNRM, University of Toulouse, Meteo-France, CNRS, 31057 Toulouse, France
4
Now at European Space Agency Climate Office, ECSAT, Harwell Campus, Oxfordshire, Didcot OX11 0FD, UK
*
Author to whom correspondence should be addressed.
Remote Sens. 2021, 13(4), 553; https://doi.org/10.3390/rs13040553
Submission received: 2 December 2020 / Revised: 28 January 2021 / Accepted: 30 January 2021 / Published: 4 February 2021

Abstract

:
The present study aims to investigate the potential of multi-configuration Sentinel-1 (S-1) synthetic aperture radar (SAR) images for characterizing four wheat parameters: total fresh mass (TFM), total dry mass (TDM), plant heights (He), and water content (WC). Because they are almost independent on the weather conditions, we have chosen to use only SAR. Samples of wheat parameters were collected over seven fields (three irrigated and four rainfed fields) in Southwestern France. We first analyzed the temporal behaviors of wheat parameters (He, TDM, TFM and WC) between February and June 2016. Then, the temporal profiles of the S-1 backscattering coefficients (VV, VH), the difference (VH − VV), the sum of the polarizations (VH + VV) and their cumulative values are analyzed for two orbits (30 and 132) during the wheat-growing season (from January to July 2016). After that, S-1 signals were statistically compared with all crop parameters considering the impact of pass orbit, irrigation and two vegetative periods in order to identify the best S-1 configuration for estimating crop parameters. Interesting S-1 backscattering behaviors were observed with the various wheat parameters after separating irrigation impacts and vegetative periods. For the orbit 30 (mean incidence angle of 33.6°); results show that the best S-1 configurations (with coefficient of determination (R2) > 0.7) were obtained using the VV and VH + VV as a function of the He, TDM and WC, over irrigated fields and during the second vegetative period. For the orbit 132 (mean incidence angle of 43.4°), the highest dynamic sensitivities (R2 > 0.8) were observed for the VV and VH + VV configurations with He, TDM and TFM over irrigated fields during the first vegetative period. Overall, the sensitivity of S-1 data to wheat variables depended on the radar configuration (orbits and polarizations), the vegetative periods and was often better over irrigated fields in comparison with rainfed ones. Significant improvements of the determination coefficients were obtained when the cumulative (VH + VV) index was considered for He (R² > 0.9), TDM (R² > 0.9) and TFM (R² > 0.75) for irrigated fields, all along the crop cycle. The estimate of WC was more limited (R² > 0.6) and remained limited to the second period of the vegetation cycle (from flowering onwards). Whatever parameters were considered, the relative errors never exceeded 23%. This study has shown the importance of considering the agricultural practices (irrigation) and vegetative periods to effectively monitor some wheat parameters with S-1 data.

Graphical Abstract

1. Introduction

An accurate monitoring of winter wheat (usually named Triticum aestivum) is essential since it is one of the most important crops in the world (with an average production of 762.7 Mt for 2020, according to the Food and Agriculture Organization (FAO)) and is the main crop cultivated in France (with a production of 36.9 Mt for the 2018/19 season, according to the US Department of Agriculture [1]). Wheat biophysical parameters need to be accurately estimated during the growing season for various land surface applications such as dynamic vegetation monitoring, crop growth simulation, energy surface fluxes, and agricultural and natural resource management [2,3,4]. The most commonly considered variables are above ground biomass (fresh and dry), plant height, water content, green area index (GAI) and fraction cover (FC). They play a crucial role for the knowledge of evapotranspiration demands, energy and mass fluxes at the land surface–atmosphere boundary, therefore the management of irrigation scheduling decisions. These parameters strongly vary in space and time, and local in-situ sampling measurements are not sufficient to describe their variabilities well over large areas.
Several studies dealt with the effective use of remote sensing (optical and/or radar) data to effectively understand and estimate crop biophysical parameters, phenological stages and development of vegetation at global, regional or field scales [2,4,5,6,7]. Contrary to images acquired in the optical domain (not treated in this study due to their high sensitivity to cloud cover), synthetic aperture radar (SAR) sensors demonstrated their potential to estimate and monitor biophysical vegetation parameters at any time of the day, regardless of the weather and environmental conditions. The most common used SAR data systems operate at C-band (Sentinel and Radarsat constellations) and offer both high spatial resolution and frequent revisit time [2]. This is particularly promising for the monitoring of land surface heterogeneities (soil and plant properties) at a field scale. Over bare agricultural surfaces or during the early growing season, the backscattered radar signals are mainly affected by soil roughness and soil moisture changes [4,8,9,10]. At a later crop growth stage, the influence of soil parameters decrease and SAR signals are dominated by vegetation properties (biomass, water content, GAI, height etc.), canopy structural changes (orientation, size and density of the stems) and phenological stages [2,6,11,12,13]. In addition to surface soil and vegetation characteristics, the radar backscattering coefficients are affected by the sensors configurations including the frequency, polarization and incidence angle. For example, several studies highlighted the strong sensitivity of radar backscatter to wheat biophysical parameters as a function of incidence angles [11,14,15,16]. In fact, in the 20 to 40° range of incidence angles, the radar backscattering signals are strongly affected by the ground scattering contribution (particularly soil moisture), whereas for higher incidence angles (from about 40°) the dominant mechanism changes to canopy scattering. El Hajj et al. [17] demonstrated the inability of the S-1 signals (39°) to penetrate wheat and grassland when the vegetation index derived from optical data is high (normalized difference vegetation index (NDVI) exceeds 0.7).
Regarding the polarization effect, Veloso et al. [16] have indicated that HH (horizontal-horizontal) is more sensitive to surface scattering, HV (horizontal-vertical) to volume scattering, and VV (vertical-vertical) a combination of both. Brown et al. [14] have indicated that the use of the high frequencies sensors with VV) polarization and large incidence angles around 40° could contribute to an optimal monitoring of wheat (fresh biomass, GAI, shoot number and growth stage). Using multi-frequency and multi-polarization radar backscatter signatures, Fieuzal et al. [15] observed high angular sensitivities at the HH and VV polarizations compared to HV and VH for C band. They added that the angular sensitivity of radar backscatter decreases with the increase of the vegetation index (from 0.4 dB.°−1 over bare soils to 0.05 dB.°−1 for fully vegetated fields). Combining both VV and VH backscattering coefficients into a single index could reduce the polarization effects and consequently the ground and vegetation interaction effects. The ratio of polarization (VH/VV) is the most used and documented index for crop monitoring. Different studies found significant correlations of the VH/VV to crop biophysical parameters [5,7,13,15,16,18,19,20]. They noted that the use of the VH/VV could minimize the sensitivities associated with the acquisition system or environmental conditions and appear more stable over time than VH or VV backscatters. The VH/VV has a high potential for monitoring the phenological stages, biophysical parameters retrieval and detecting some growth stages. For example, the VH/VV might help to identify specific dates for winter wheat such as flowering [18], post-harvest spontaneous regrowth [16], tillering, overwintering, and heading stages [13], shooting and the harvest [20].
Polarimetric indicators derived from S-1 data are not very well investigated over wheat and have shown moderate results for monitoring biophysical parameters compared to VV, VH and the VH/VV [6,7,21]. Nasirzadehdizaji et al. [21] found moderate correlations between polarimetric parameters (entropy, anisotropy and alpha decompositions) and wheat height during the early growth stage. Mercier et al. [6,7] evaluated, for the first time, the potential of polarimetric indicators (Shannon entropy and span) derived from S-1 (with only one orbit) for identifying phenological stages and estimating biophysical crop parameters (GAI, biomass and water content (WC)) of wheat. They found that the Shannon entropy only performed with the WC parameter with R2 = 0.78. They concluded that using Sentinel-2 data were similar or higher to those obtained using S-1 features for estimating crop biophysical parameters of wheat.
To the best of our knowledge, no studies evaluated the potential of using the sum of polarization (VV + VH) over wheat whereas good correlations were found between VH + VV derived from S-1 and biophysical parameters of canola or maize (fresh biomass, plant area index, height and canopy coverage) [21,22].
In this context, the aim of the present study is to identify the best performing S-1 configuration (orbits, polarizations and indexes) and plant condition (vegetation period, irrigation) for accurate wheat parameters monitoring (Fresh and dry total biomass, height and water content) considering different periods of crop development. In this study, all the commonly used SAR indexes are used (VV, VH and VH − VV) completed by one more rare (VH + VV) and one original (temporal cumulative of (VH + VV) indexes). Section 2 describes the study site, satellite images and ground measurement database. Section 3 provides analysis of the temporal evolution of the wheat parameters and of the backscattering S-1 signals. The methodology is detailed in Section 4. Section 5 and Section 6 present our results and discussion, respectively, concerning the sensitivities for the different scenarios. Our conclusions are provided in Section 7.

2. Study Site and Database Description

2.1. Study Site Description

The study site is located in Southwestern France (43.49°N; 0.93°E), over two French regions (Nouvelle-Aquitaine and Occitanie) and covering a footprint of 110 km × 140 km (Figure 1). The climate is temperate and the area is mainly dedicated to the cultivation of seasonal crops which cover 54% of the land. Soils texture are heterogeneous, depending on the relief and the proximity to large rivers, and dominated by silt or clay in the Eastern parts [19].
The temporal wheat growth evolution is represented between the first of January and July. It is expressed in day of year (DOY) as shown in the Figure 2. This period covers the main phenological stage of the wheat (from the leaf development (LD) to ripening (R)) as detailed in Table 1.

2.2. Biophysical Parameters

Between February and June 2016, some wheat parameters (crop height, main phenological stages, biomass, dry matter, and water content) were measured at field scale. Samples were collected over seven fields (three irrigated and four rainfed fields) along the wheat cycle from tillering (Ti) to R. Vegetation measurements were composed of 5 samples of 50 cm randomly collected into a 10 by 10 m² area, from which the above ground biomass (TFM) was directly weighed in situ for each training field. Then, the total aboveground dry mass (TDM) was measured after crop drying (the samples were put in an oven for 48 h at 65 °C). The water content (WC) was finally derived from the TFM and TDM. Field areas are heterogeneous, and range from 1.8 ha to 16.9 ha. Location and main characteristics of studied fields are summarized in Figure 1 (panels a to d) and Table 2, respectively.

2.3. Sentinel-1 Data

From January (DOY = 1) to July (DOY = 210) 2016, 34 S-1 images were acquired (Figure 3). S-1 is an imaging radar mission launched on April 3, 2014. It provides continuous all weather, day-and-night imagery at C-band, and is freely available from the European Copernicus Services Data Hub.
The S-1 images were provided in interferometric wide (IW) swath and ground range detected (GRD) modes (Table 3). Mean incidence angles are θ30 = 33.6° and θ132 = 43.4° in average for the two orbits (30 and 132 respectively) allowing a repetitiveness of six days. The preprocessing of S-1 data was made using the Google Earth Engine website as follows: apply orbit file, GRD border noise removal, thermal noise removal, radiometric calibration, range Doppler terrain correction and resampling at 10 m spacing. Then, the σ 0 (backscattering coefficients) for the two orbits (30 and 132) and the two polarizations (VH and VV) were calculated at each field (noted σ V H 0 and σ V V 0 in the following). Two indexes (ratio and product) are derived from the following equations:
Ratio   [ dB ]   =   σ V H / V V 0   [ dB ]   =   V H   [ dB ]     V V   [ dB ]
Product   [ dB ] = σ V H V V 0   [ dB ]   =   V H   [ dB ]   +   V V   [ dB ]
Cumulative values are also calculated for each polarization and index (VV, VH, VH − VV and VH + VV). They represent the cumulative sum in backscattering signals from the first acquisition to the one performed on the day of interest, with a regular temporal step of 12 days.

3. Data Analysis

3.1. Temporal Evolution of the Wheat Parameters over All Fields (2016)

Figure 4 presents the temporal evolution of different wheat parameters: TFM, TDM, WC and He for irrigated (Figure 4a,b) and rainfed fields (Figure 4c,d) between February and June 2016.
Mean TFM values are higher for irrigated fields (about 9289 g·m−2 against 5788 g·m−2 for rainfed fields) and the considerable discrepancies of TFM values between fields is explained by the difference in the date of sowing and the crop development.
TDM and He parameters increase linearly during the wheat growth cycle for all fields and their values are more homogeneous than those observed for TFM. Nevertheless, higher discrepancies of TDM and He are observed for rainfed fields, especially from the end of the heading (Hg) stage when head starts growing. From this stage, the TDM of irrigated fields continues to increase until H whereas TDM of rainfed fields saturates.
Peak mean heights are about 94 and 84 cm for irrigated and rainfed fields, respectively, during grain heading. For the two kinds of field, similar trends of the WC are observed, they have maximal mean values (about 80%) at the beginning stages then they decrease linearly until the senescence (about 20% a few days before harvest).

3.2. Temporal Evolution of the Backscattering Signals Acquired at Two Polarizations (VV and VH) and Two Orbits (30 and 132) over All Fields

Figure 5a,b present the temporal evolution of the radar backscattering signals: VV, VH, VV + VH and VH − VV from LD to R stage of the wheat, according to the orbit number (30 and 132).
The general trend can be divided into three different periods:
  • During LD to Ti (approximatively until the DOY = 53), the backscattering coefficients show only a few variations whatever the polarization. At these stages, the crop height does not exceed 20 cm for all fields and the total S-1 backscattering signals is dominated by the contribution of bare soil between the crop rows [8,15,16].
  • During stem elongation (SE) to Hg stages (from DOY 53 to 125), VH, VV and VV + VH values linearly decrease with a dynamic of approximately 5 dB for VV and 3 dB for VH at orbit 132 and of 5.3 dB for both VV and VH at orbit 30. By contrast, VH − VV slightly increases during SE (about 2.5 dB). During this period, the soil contribution becomes negligible inducing an increase of the volume scattering mechanisms, which could be justified by the rise in TFM values over all wheat fields (Figure 5). According to Mattia et al. [11] and El Hajj et al. [17], the decrease in SAR signals is due to the high absorption of the incident SAR wave produced by the vertical stems and leaves associated with weak direct ground scattering. This absorption is more pronounced on the VV + VH signal (about 10 dB). Brown et al. [14] and Mercier et al. [7], demonstrated that for a very well developed wheat cover, backscatters at VV polarization were more influenced by wheat growth than VH, especially at a high incidence angle. These results are confirmed with the increase of VH − VV in time. Our result also showed that this difference is attenuated when the incidence angle decreases (orbit 30).
  • Finally, from 50 days before H, the backscattering coefficients increase by approximately 2.2 dB and 3.5 dB for both VV and VH at 132 and 30 orbits, respectively, as observed in [15,20,24]. From the end of June, the backscattering is less absorbed by the vegetation due to the vegetation drying (Figure 5; [19]). The SAR signal penetrates more into the vegetation layer and is more affected by the soil moisture variations. This phenomenon is much more important for VV + VH whereas the signal VH − VV is quite stable until harvest.
Figure 5c,d show the temporal evolution of the cumulative (VV, VH, VH − VV and VH + VV) indexes for orbit 30 and 132, respectively. It can be seen that the cumulative indexes linearly decrease as a function of time with an important slope during the first growing cycle until the DOY = 150. These behaviors could be related to the high absorption of the radar signals by the vegetation canopy for both VV and VH polarizations. We can show clearly that the behaviors of the cumulative (VV, VH, VH − VV and VH + VV) are practically not affected by the wheat phenological stages.

4. Methodology

Our methodology, presented in Figure 6, consists in estimating empirical relationships between radar signals (VH, VV, VV + VH, VV − VH and their cumulative sum) and crop parameters. Consecutive scenarios were proposed: the first one (A) consisted of combining all S-1 data orbits 30 and 132 (O30 and 132) all along the crop-growing period. In the second case (B), we separated the S-1 images into two datasets of orbit 30 (O30) and 132 (O132) to analyze the influence of the orbit pass directions. The third one (C) took into account the irrigation practices, each orbit dataset is further divided into irrigated and rainfed fields. Finally (D), two vegetative periods (P [1] and P [2]) were considered for irrigated and rainfed dataset separately. The range of DOY adopted for the two vegetative periods were defined based on the sampling dates of wheat parameters. They are presented in Figure 7 by blue and yellow colors for irrigated and rainfed fields, respectively.

5. Results

In this section, we present the results of our statistical analysis of radar measurements as a function of the wheat parameters: He (cm), TFM (g·m−2), TDM (g·m−2) and WC (%) for all of the studied fields. Mean backscattering coefficient values (VH, VV), the difference of the polarizations (VH − VV), the sum of the polarizations (VH + VV) and their cumulative values are estimated for each field and their correlations with the wheat parameters were analyzed, according to scenarios A, B, C and D presented in the method.

5.1. Statistical Performances Combining Two Orbits (Scenario A)

Table 4 provides correlations determined for the different backscattering parameters (VV, VH, VH − VV and VH + VV) and their cumulative indexes as a function of the He, TDM, TFM and WC for the two combined orbits (O30 and O132). These relationships are based on 136 measured points. It can be seen that no correlations (R2 < 0.15) are obtained with all the backscattering parameters. Strong improvements are achieved when we use the cumulative indexes for all the crop parameters. For He and TDM, an increase greater than 70% was obtained after considering the cumulative (VV, VH and VH + VV) indexes. Regarding TFM and WC parameters, improvements were lower, at about 40%, using cumulative indexes.
In the following sections, only the best indexes are considered for the scenarios B, C and D: VH + VV and its cumulative values.

5.2. Impact of the Orbit Pass (Scenario B)

Figure 8 shows the correlations and the relative errors of the VH + VV and its cumulative index as a function of He, TDM, TFM and WC before and after taking into account the impact of the orbit pass (30 and 132). As observed in scenario A, no correlation was obtained combining the two orbits with all the crop parameters. Similarly, weak correlations (R2 < 0.2) were observed after separating the data according to orbit pass (O30 and O132). Compared to scenario A, the performances remained better using the cumulative index (VH + VV) with all the crop parameters particularly with TDM and He (R2 > 0.7 and rRMSE < 50%).

5.3. Impact of Irrigation (Scenario C)

Figure 9 represents the results obtained by considering the impact of irrigation on the two-orbit dataset (Irrigated, O132; Rainfed, O132; Irrigated, O30 and Rainfed, O30 respectively). Weak correlations are observed between VH + VV and all wheat parameters for rainfed and irrigated fields (R² < 0.2). The use of the cumulative (VH + VV) index significantly improves the estimate of all parameters, especially the TDM and TFM (for irrigated fields) compared to the scenario A (Figure 8b). In these best cases, the rRMSE are lower than 33% for all the parameters of irrigated fields. Relative errors exceed 50% only for the estimate of TFM of non irrigated fields.

5.4. Impact of Phenological Periods (Scenario D)

According to the SAR signal behavior (Figure 5), the impact of two vegetative periods are considered in the analysis of VH + VV and its cumulative values as a function of crop parameters for two orbits (30 and 132) and irrigation practices (irrigated and rainfed). Figure 10 and Figure 11 illustrate the bar plots of the R2 and rRMSE computed for VH + VV and its cumulative indexes as a function of all the crop parameters for the P [1] and P [2], respectively. Significant performance improvements of the VH + VV are observed by taking into account the impact of the vegetative periods, for all the fields compared to the other scenarios. These improvements depend on the orbit pass otherwise on the incidence angle and they are generally better over irrigated fields than rainfed ones.
During the first vegetative period P [1], relevant relationships are observed between VH + VV and the biophysical parameters (He, TDM and TFM) for the orbit 132 (with θ132 = 43.4°). The coefficients of determinations and relative errors are equal to 0.92 (9.5%), 0.8 (24.2%) and 0.78 (26.5%) with He, TDM and TFM, respectively, over irrigated fields (Figure 10c).
Concerning the second vegetative period P [2], the statistical performances (R2 > 0.65 and rRMSE < 20%) indicate marked correlations of the VH + VV with He, TDM and WC for the orbit 30 (with θ30 = 33.6°) and over irrigated fields. The change in the temporal WC behaviors between the two vegetative periods P [1] and P [2] led to the improvements of the correlation between the VH + VV and the WC parameter during the second wheat period (Figure 4). For the two orbits 30 and 132, the results show that responses of the VH + VV to the wheat TFM are weak (R2 < 0.2) at the P [2]. These relationships could be justified by the high TFM discrepancies observed between fields especially after F stage.
Considering the cumulative (VH + VV) index, stronger correlations are observed during the first period P [1] with R2 equal to 0.93, 0.92 and 0.87 for the He, TDM and TFM respectively at the two orbits (30 and 132). Strong relationships are also obtained with He (R2 about 0.7) and TDM (R2 = 0.9) parameters for the second period P [2], particularly for irrigated fields. Whatever the period, the rRMSE are always lower than 35% when R² exceeds 0.7. The sensitivities of the cumulative (VH + VV) index and the TFM are lower during the P [2] than the P [1]. For WC, we note the considerable impact of the vegetative period with the best correlations obtained for the second period P [2] and for irrigated fields (R2 about 0.73 and 0.62 for the orbit 30 and 132, respectively). Over rainfed fields, we observe important improvements of this parameter during the P [2] with approximately R2 = 0.5 for the two orbits (30 and 132). This behavior could be explained by the linearly decrease of the WC during the last wheat stages.
Finally, Figure 12 shows the scatter plot of the best correlations obtained for irrigated fields with linear sensitivities with all the crop parameters. The relationships between the three parameters (TDM, TFM and He) and the cumulative (VH + VV) index show strong dependence between them with R2 > 0.87 and with rRMSE < 19% whatever the field and the orbit. Lower performances are obtained for the estimate of WC during P [2] (R² = 0.68) despite the low rRMSE of 11%. The sensitivity of the cumulative (VH + VV) index and TDM is approximately −0.16 dB/g·m−2, −3.7 dB·cm−1 with He, −0.03 dB/g·m−2 with TFM and 2.68 dB/% with WC.

6. Discussion

This section presents the discussion of the results obtained using VH + VV and its cumulative index with wheat parameters because these configurations lead to the best performances as demonstrated in Section 5.1. As for the result section, three scenarios are considered: B, C and D.

6.1. Impact of the Orbit Pass (Scenario B) and Irrigation (Scenario C)

Results presented in Section 5.2 (Figure 8) show that performances are not dependent on the orbit pass and the geometrical configuration of the SAR sensor following their incidence angles (θ30 = 33.6° and θ132 = 43.4°), especially when cumulative indexes are considered and performances are high (R2 > 0.7 and rRMSE < 50%). This could be explained by the similar temporal linear trend of TDM, He and cumulative values of VH + VV. This phenomenon is particularly interesting since previous studies demonstrated that the non-cumulated radar backscatters acquired at C band are angular-sensitive over wheat [11,14,25]. According to them, the sensitivities of non-cumulated radar backscatters are affected by the soil scattering, attenuated by the wheat canopy at low incidence angles (θ < 40°). Beyond 40° incidence angle, the dominant mechanism changes to the direct volume scattering from the canopy. The lower angular sensitivity of cumulated VH + VV signals open new perspective for merging radar signal independently of incidence angle or orbit pass.
The interest of using cumulative index is confirmed when plots are spitted into irrigated and rainfed fields. In this case, as observed in Pageot et al. [26] for irrigation mapping, the results of Figure 9 demonstrated that the cumulative indexes derived from S-1 data (VV and VH) are sensitive to the impact of irrigation on vegetation development.

6.2. Impact of Phenological Periods (Scenario D)

The results presented in Section 5.4 (Figure 10) show that performances are strongly dependent on the vegetative period. The good results obtained during the period P [1] could be explained by the linear increase of the He, TDM and TFM parameters especially until the F wheat stage (Figure 4). It confirms and expands those observed by Nasirzadehdizaji et al. [21] who found that the sensitivity of the (VH + VV) derived from S-1 data is relatively good with wheat height (with R2 = 0.61) at the beginning stage (for He < 53) and no significant correlation is observed at the later growing stage (He ≥ 53 cm). Regarding the WC parameter, the correlation is very weak in the P [1], when WC is constant around 80% (Figure 4). The relationships estimated between radar index and WC are strongly improved during the P [2] (Figure 11). This phenomenon could be attributed to the lower radar attenuation in the vegetation layer during senescence when vegetation dries and WC decreases.
The significant correlations of the VH + VV and physical parameters that we obtained during P [1] at the orbit 132 and not at the orbit 30 are mainly related to the influence of the incidence angle (Figure 10). In fact, the orbit 132 is acquired at a higher incidence angle than the orbit 30. The sensitivities of the radar signals to vegetation canopy increase at a high incidence angle, which could explain the best correlations that we observed between backscattering coefficients and crop parameters at orbit 132. Several studies have analyzed the behavior of the backscattering signals of wheat crops as a function of incidence angles and phenological stages [11,14,15,25,27]. They demonstrated that the backscattering signals are mainly affected by the dominance of the direct canopy backscattering after heading stage (DOY = 124) for high incidence angles (θ > 37°). El Hajj et al. [17] explained these behaviors by the inability of the radar signals to penetrate into wheat for the well-developed vegetation cover particularly after heading at a high incidence angle.
To reduce discrepancies between fields during the first vegetative period, the mean signals recorded between DOY = 1 and the LD stage of wheat (DOY = 31) were taken as references σ m e a n 0 to eliminate the effect of surface soil parameters (roughness, moisture, topography) and keep only the vegetation variations on measured signals. Then, the backscattering measurements σ m e a s u r e d 0 were corrected by the mean backscattering ( σ m e a n 0 ) considering the bias between them for each date and field. Figure 13 illustrates temporal evolution of the VH + VV and its cumulative index for each training field at 132 orbit (same results are observed for orbit 30, not shown here). Visually, the differences between fields observed during the first period of the temporal backscattering signals are reduced taking into account the bias correction for the VH + VV and the cumulative index (Figure 13). However, a few improvements are obtained in the statistical coefficients (R2) especially with TDM and He for some cases. Figure 14 represents the enhanced correlations obtained after considering bias for orbit 132. For example, we can note an increase of 22% and 8% over rainfed fields for He and TDM parameters, respectively, after bias correction. Despite these improvements, the best results remain those obtained using the cumulative indexes (for which no gain has been observed after the removal of the influence of surface soil properties).
Despite previous studies having demonstrated high sensitivities of the VH − VV to wheat parameters [7,15,16,17,18,20,21], our results (Table 5) revealed that the VH + VV are clearly better than the VH − VV for almost all wheat parameters. Among all the considered configurations, the VH + VV allowed better estimations of the wheat parameters than those obtained using either ratios [20,21] or polarimetric parameters [7,21]. The new empirical approach proposed in this study, notably the cumulative indexes, provides even better correlations than the VH + VV with all crop parameters.
Despite the lack of recent ground campaign data, our approaches are also discussed according to further S-1 images acquired during 2017, 2018 and 2019 using S1-A data (to be comparable with the year 2016). For each year, we selected eight fields of wheat located closest to the studied fields used in 2016 (<10 km). Figure 15 illustrates the temporal evolution of the VH + VV configuration and its cumulative values from the first of January to the end of July for each year, at orbit 30. The general trends of these behaviors are similar whatever the year to those obtained during 2016 (Figure 5c). The results presented here confirm that our approaches could be reliably extended to other years to accurately estimate wheat parameters using the cumulative indexes.

7. Conclusions

This work has presented new empirical approaches for monitoring some wheat parameters (TFM, TDM, He, WC) from S-1 SAR data. We proposed the use of polarized backscatters (VV, VH, VH − VV and VH + VV) and their cumulative values to assess wheat parameters for two orbits (30 and 132). Various scenarios were considered:
  • Scenario A demonstrated that among all the evaluated radar backscatters (VV, VH, VH − VV and VH + VV), the highest correlations are obtained using the sum of VH and VV backscatters or their cumulative values. The cumulative VH + VV index is more correlated with all crop parameters (0.46 < R² < 0.89), than non-cumulative backscatters (0.01 < R² < 0.13), regardless of their agricultural practices, vegetative periods and even by combining all S-1 data orbits (30 and 132) all along the crop-growing period.
  • The second scenario (B) highlighted the weak influence of the orbit pass (incidence angle) on the crop parameters retrieval all along the crop cycle whatever the considered backscatters.
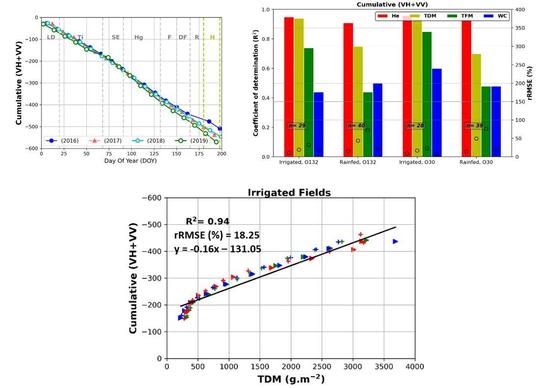
  • The impact of irrigation is particularly visible on scenario C. Whereas the performance are not significantly affected from the previous scenarios (A or B) considering VH + VV backscatters, strong relationships are obtained between cumulative values of VH + VV and two biophysical parameters (TDM and He) (R2 > 0.92 and rRMSE < 20%) whatever the orbit pass.
  • The importance of considering two vegetative periods is shown in scenario D. This is the only scenario where non-cumulated backscatters are significantly correlated with in situ wheat parameters. During the first period (growing period), the highest dynamic sensitivities (R2 > 0.8 and rRMSE < 30%) were observed with (He, TDM and TFM) over irrigated fields for the orbit 132 (with an average incidence angle of 43.4°). The results obtained during the second vegetative period allowed us to estimate He, TDM and WC over irrigated fields with high correlation (R² > 0.7), using data acquired in the orbit 30 (with an average incidence angle of 33.6°). Regarding cumulative index, we also note the relevant effect of considering the vegetative period. The best sensitivities of the cumulative (VH + VV) index and the He, TDM and TFM were obtained during the first vegetative period with R2 > 0.78 and 0.7 for irrigated and rainfed fields, respectively. For WC, the best correlations were obtained for the second period (when vegetation starts drying from flowering) with R2 > 0.6 and 0.5 for irrigated and rainfed fields, respectively. Whatever the considered parameters, the relative errors were low and ranged from 6.2% to 23%.
Results of this paper highlight the strong potential of the cumulative index (VH + VV) for the monitoring of the crop parameters, particularly the TFM, He, TDM and WC. Despite the lack of recent ground campaign data, results presented in the discussion section demonstrated that our approaches could be reliably extended to other years (2016 to 2019). In future studies, it will be interesting to assimilate this index in agricultural crop models. This would certainly improve the accuracy of crop growth simulations and enhance subsequently yield estimations. In addition, it would be recommended to validate our findings with more recent data and to extend our approach to other cereal crops (corn, soybean etc.).

Author Contributions

A.G. and F.B.; analyzed the SAR data and developed methodology to retrieve wheat parameters, F.B. and M.A.; designed and performed the experimental data, A.G. and M.A.; SAR data processing, A.G. and F.B.; writing, F.B.; supervision, C.A. and M.A.; review and editing, C.A.; project administration. All authors have read and agreed to the published version of the manuscript.

Funding

This research was funded by IRT Antoine de Saint-Exupéry Foundation STAE for the POMME-V project (R056).

Acknowledgments

We would like to thank all of the technical teams from the CESBIO and ACMG for their consistent collaboration and support during the implementation of ground measurements. Many thanks to Sylvaine Laburthe for her valuable English proofreading. We are also very grateful to the farmers involved and the project PRECIEL for providing ground measurements.

Conflicts of Interest

The authors declare no conflict of interest.

References

  1. France: Heavy Spring Rains and Summer Drought Negatively Affect 2018/19 Crops. Available online: https://ipad.fas.usda.gov/highlights/2018/09/france/index.pdf (accessed on 18 November 2020).
  2. Liu, C.; Chen, Z.; Shao, Y.; Chen, J.; Hasi, T.; Pan, H. Research advances of SAR remote sensing for agriculture applications: A review. J. Integr. Agric. 2019, 18, 506–525. [Google Scholar] [CrossRef] [Green Version]
  3. Betbeder, J.; Fieuzal, R.; Philippets, Y.; Ferro-Famil, L.; Baup, F. Estimation of Crop Parameters using Multi-Temporal Optical and Radar Polarimetric Satellite Data; Remote Sensing for Agriculture, Ecosystems, and Hydrology XVII; International Society for Optics and Photonics: Toulouse, France, 2015; Volume 9637, p. 9637. [Google Scholar]
  4. Baghdadi, N.; Zribi, M. Land Surface Remote Sensing in Agriculture and Forest; ISTE Press-Elsevier: London, UK, 2017; 496p. [Google Scholar]
  5. Baup, F.; Ameline, M.; Fieuzal, R.; Frappart, F.; Corgne, S.; Berthoumieu, J.-F. Temporal Evolution of Corn Mass Production Based on Agro-Meteorological Modelling Controlled by Satellite Optical and SAR Images. Remote Sens. 2019, 11, 1978. [Google Scholar] [CrossRef] [Green Version]
  6. Mercier, A.; Betbeder, J.; Baudry, J.; Le Roux, V.; Spicher, F.; Lacoux, J.; Roger, D.; Hubert-Moy, L. Evaluation of Sentinel-1 & 2 time series for predicting wheat and rapeseed phenological stages. ISPRS J. Photogramm. Remote Sens. 2020, 163, 231–256. [Google Scholar] [CrossRef]
  7. Mercier, A.; Betbeder, J.; Rapinel, S.; Jegou, N.; Baudry, J.; Hubert-Moy, L. Evaluation of Sentinel-1 and -2 time series for estimating LAI and biomass of wheat and rapeseed crop types. J. Appl. Remote Sens. 2020, 14, 1. [Google Scholar] [CrossRef]
  8. Cookmartin, G.; Saich, P.; Quegan, S.; Cordey, R.; Burgess-Allen, P.; Sowter, A. Modeling microwave interactions with crops and comparison with ERS-2 SAR observations. IEEE Trans. Geosci. Remote Sens. 2000, 38, 658–670. [Google Scholar] [CrossRef]
  9. Baghdadi, N.; Boyer, N.; Todoroff, P.; El Hajj, M.; Bégué, A. Potential of SAR sensors TerraSAR-X, ASAR/ENVISAT and PALSAR/ALOS for monitoring sugarcane crops on Reunion Island. Remote Sens. Environ. 2009, 113, 1724–1738. [Google Scholar] [CrossRef]
  10. Gorrab, A.; Zribi, M.; Baghdadi, N.; Mougenot, B.; Fanise, P.; Chabaane, Z. Retrieval of Both Soil Moisture and Texture Using TerraSAR-X Images. Remote Sens. 2015, 7, 10098–10116. [Google Scholar] [CrossRef] [Green Version]
  11. Mattia, F.; Toan, T.L.; Picard, G.; Posa, F.I.; D’Alessio, A.; Notarnicola, C.; Gatti, A.M.; Rinaldi, M.; Satalino, G.; Pasquariello, G. Multitemporal C-Band Radar Measurements on Wheat Fields. IEEE Trans. Geosci. Remote Sens. 2003, 41, 10. [Google Scholar] [CrossRef]
  12. Steele-Dunne, S.C.; McNairn, H.; Monsivais-Huertero, A.; Judge, J.; Liu, P.-W.; Papathanassiou, K. Radar Remote Sensing of Agricultural Canopies: A Review. IEEE J. Sel. Top. Appl. Earth Obs. Remote Sens. 2017, 10, 2249–2273. [Google Scholar] [CrossRef] [Green Version]
  13. Song, Y.; Wang, J. Mapping Winter Wheat Planting Area and Monitoring Its Phenology Using Sentinel-1 Backscatter Time Series. Remote Sens. 2019, 11, 449. [Google Scholar] [CrossRef] [Green Version]
  14. Brown, S.C.M.; Quegan, S.; Morrison, K.; Bennett, J.C.; Cookmartin, G. High-Resolution Measurements of Scattering in Wheat Canopies—Implications for Crop Parameter Retrieval. IEEE Trans. Geosci. Remote Sens. 2003, 41, 10. [Google Scholar] [CrossRef] [Green Version]
  15. Fieuzal, R.; Baup, F.; Marais-Sicre, C. Monitoring Wheat and Rapeseed by Using Synchronous Optical and Radar Satellite Data—From Temporal Signatures to Crop Parameters Estimation. ARS 2013, 02, 162–180. [Google Scholar] [CrossRef] [Green Version]
  16. Veloso, A.; Mermoz, S.; Bouvet, A.; Le Toan, T.; Planells, M.; Dejoux, J.-F.; Ceschia, E. Understanding the temporal behavior of crops using Sentinel-1 and Sentinel-2-like data for agricultural applications. Remote Sens. Environ. 2017, 199, 415–426. [Google Scholar] [CrossRef]
  17. El Hajj, M.; Baghdadi, N.; Bazzi, H.; Zribi, M. Penetration Analysis of SAR Signals in the C and L Bands for Wheat, Maize, and Grasslands. Remote Sens. 2018, 11, 31. [Google Scholar] [CrossRef] [Green Version]
  18. Vreugdenhil, M.; Wagner, W.; Bauer-Marschallinger, B.; Pfeil, I.; Teubner, I.; Rüdiger, C.; Strauss, P. Sensitivity of Sentinel-1 Backscatter to Vegetation Dynamics: An Austrian Case Study. Remote Sens. 2018, 10, 1396. [Google Scholar] [CrossRef] [Green Version]
  19. Ameline, M.; Fieuzal, R.; Betbeder, J.; Berthoumieu, J.-F.; Baup, F. Estimation of Corn Yield by Assimilating SAR and Optical Time Series Into a Simplified Agro-Meteorological Model: From Diagnostic to Forecast. IEEE J. Sel. Top. Appl. Earth Obs. Remote Sens. 2018, 11, 4747–4760. [Google Scholar] [CrossRef]
  20. Schlund, M. Sentinel-1 time series data for monitoring the phenology of winter wheat. Remote Sens. Environ. 2020, 246, 111814. [Google Scholar] [CrossRef]
  21. Nasirzadehdizaji, R.; Sanli, F.B.; Abdikan, S.; Cakir, Z.; Sekertekin, A.; Ustuner, M. Sensitivity Analysis of Multi-Temporal Sentinel-1 SAR Parameters to Crop Height and Canopy Coverage. Appl. Sci. 2019, 9, 655. [Google Scholar] [CrossRef] [Green Version]
  22. Mandal, D.; Kumar, V.; Bhattacharya, A.; Rao, Y.S.; McNairn, H. Crop Biophysical Parameters Estimation with a Multi-Target Inversion Scheme using the Sentinel-1 SAR Data. In Proceedings of the IGARSS 2018–2018 IEEE International Geoscience and Remote Sensing Symposium, Valencia, Spain, 22–27 July 2018; pp. 6611–6614. [Google Scholar]
  23. Lancashire, P.D.; Bleiholder, H.; Boom, T.V.D.; Langelüddeke, P.; Stauss, R.; Weber, E.; Witzenberger, A. A uniform decimal code for growth stages of crops and weeds. Ann Appl. Biol. 1991, 119, 561–601. [Google Scholar] [CrossRef]
  24. Homayouni, S.; McNairn, H.; Hosseini, M.; Jiao, X.; Powers, J. Quad and compact multitemporal C-band PolSAR observations for crop characterization and monitoring. Int. J. Appl. Earth Obs. Geoinf. 2019, 74, 78–87. [Google Scholar] [CrossRef]
  25. Balenzano, A.; Mattia, F.; Satalino, G.; Davidson, M.W.J. Dense Temporal Series of C- and L-band SAR Data for Soil Moisture Retrieval Over Agricultural Crops. IEEE J. Sel. Top. Appl. Earth Obs. Remote Sens. 2011, 4, 439–450. [Google Scholar] [CrossRef]
  26. Pageot, Y.; Baup, F.; Inglada, J.; Baghdadi, N.; Demarez, V. Detection of Irrigated and Rainfed Crops in Temperate Areas Using Sentinel-1 and Sentinel-2 Time Series. Remote Sens. 2020, 12, 3044. [Google Scholar] [CrossRef]
  27. Nasrallah, A.; Baghdadi, N.; Hajj, M.E.; Darwish, T.; Belhouchette, H.; Faour, G.; Darwich, S.; Mhawej, M. Sentinel-1 data for winter wheat phenology monitoring and mapping. Remote Sens. 2019, 11, 2228. [Google Scholar] [CrossRef] [Green Version]
Figure 1. Location of the studied wheat fields in southwestern, France (a). Parcels used for ground measurements are displayed in red (be). White squares represent the sampling area of vegetation measurements. Main city names are shown in black.
Remotesensing 13 00553 g001
Figure 2. Temporal evolution, expressed in day of year (DOY), of the main crop phenological stages according to Lancashire et al. [23]. The meaning of their acronyms is indicated in Table 1.
Remotesensing 13 00553 g002
Figure 3. Time course of S-1 (orbit 30 and 132) acquisition from January to July 2016.
Remotesensing 13 00553 g003
Figure 4. Temporal evolution of the wheat parameters (total fresh mass (TFM), total dry mass (TDM), plant heights (He), and water content (WC)) for irrigated fields (a,b) and Rainfed fields (c,d).
Remotesensing 13 00553 g004
Figure 5. Mean temporal signatures of the S-1 backscattering coefficients (VV, VH, VH − VV, VH + VV) (a,b) and their cumulative values (c,d) for all fields. The vertical dashed gray lines represent the main phenological stages (their acronyms are specified in Table 1); the yellow lines represent the harvest period.
Remotesensing 13 00553 g005aRemotesensing 13 00553 g005b
Figure 6. Methodological flowchart used to identify the best synthetic aperture radar (SAR) configuration as a function of wheat parameters (He, TDM, TFM and WC). O30 and O132 represent the two orbits 30 and 132 respectively. P [1] and P [2] are the two considered vegetative periods.
Remotesensing 13 00553 g006
Figure 7. Vegetative periods: P [1] and P [2] for (a) irrigated (blue color) and (b) rainfed (yellow color) fields superposed to the temporal profiles of the S-1 backscattering coefficients (VV, VH, VH − VV, VH + VV).
Remotesensing 13 00553 g007
Figure 8. Impact of the orbit pass evaluated through the coefficient of determination and the relative error (rRMSE), calculated for the (a) VH + VV and (b) cumulative (VH + VV) index, as a function of the He (red bars), TDM (yellow bars), TFM (green bars) and WC (blue bars).
Remotesensing 13 00553 g008
Figure 9. Impact of irrigation practices evaluated by the coefficient of determination and the relative error (rRMSE), calculated for the (a) VH + VV and (b) cumulative (VH + VV) index, as a function of the He (red bars), TDM (yellow bars), TFM (green bars) and WC (blue bars).
Remotesensing 13 00553 g009
Figure 10. Correlations of the VH + VV (a,b) and its cumulative values (c,d) during the first vegetative period P [1] for orbit 30 and 132 respectively: Impact of phenological stages. Colored circles represent rRMSE values.
Remotesensing 13 00553 g010
Figure 11. Correlations of the VH + VV (a,c) and its cumulative values (b,d) during the second vegetative period P [2]: Impact of phenological stages. Colored circles represent rRMSE values.
Remotesensing 13 00553 g011aRemotesensing 13 00553 g011b
Figure 12. Best sensitivities of the cumulative (VH + VV) index to wheat crop parameters (TDM, He, TFM and WC) for each studied field and the two orbits (O30 and O132).
Remotesensing 13 00553 g012aRemotesensing 13 00553 g012b
Figure 13. Temporal evolution of: the VH + VV (a,c) and its cumulative index (b,d) at orbit 132 for each field of wheat (2016): without and with bias correction respectively.
Remotesensing 13 00553 g013
Figure 14. Enhanced correlations after considering bias for He (red bars) and TDM (yellow bars) parameters.
Remotesensing 13 00553 g014
Figure 15. Mean temporal evolution of: (a) the VH + VV backscatters and (b) its cumulative index acquired at orbit 30 during 2017, 2018 and 2019 years (eight fields of wheat are considered).
Remotesensing 13 00553 g015
Table 1. Main phenological stages of the wheat.
Principal Phenological StageSymbols Used in the Paper
Leaf developmentLD
TilleringTi
Stem elongationSE
HeadingHg
Flowering (anthesis)F
Development of fruitDF
RipeningR
Harvest: farming practice H
Table 2. Main characteristics of experimental fields.
ID_PARCCultureIRRIGATIONDate of Sampling
[First DOY–End DOY]
Surface (ha)
SoSoft wheat N[64,84,105,133,148,176]10.9
SeSoft wheatN[48,75,104,125,147,172,188]11.5
ChSoft wheatY[55,82,110,130,148,172]7.6
Co_8Durum wheat Y[64,84,105,133,148,169,179]16.9
Co_8bisDurum wheatN[70,84,105,133,148,169,179]1.8
Co_9Durum wheatY[64,84,105,133,148,169,179]12.9
Co_11Soft wheatN[64,84,105,133,148,169,179]4.1
Table 3. Main characteristics of Sentinel-1A images.
Frequency5.405 GHz (C-band)
Instrument modeInterferometric Wide Swath (IW)
Product typeGround Range Detected (GRD)
Spatial resolution (range, azimuth)About 20 × 22 m2 depending on IW subswath
Equivalent number of look (ENL)4.4
Temporal resolution12 days
PolarizationDual (VV and VH)
Swath250 km
Relative orbit30132
Pass directionASCENDINGASCENDING
Mean Incidence angle (°)33.6°43.4°
Acquisition Time (UTC)17:5517:47
Table 4. The statistical coefficient R2, calculated for the different backscattering parameters (VV, VH, VH + VV, VH − VV) and their cumulative indexes, as a function of the He, TDM, TFM and WC. The number of wheat parameters used in all the following correlations is equal to n = 136.
He (cm)TDM (g·m−2)TFM (g·m−2)WC (%)
VVVVVVVV
0.130.020.150.04
VHVHVHVH
0.060.000.090.04
VH + VVVH + VVVH + VVVH + VV
0.100.010.130.04
VH − VVVH − VVVH − VVVH − VV
0.110.040.080.01
Cumulative(VV)Cumulative(VV)Cumulative(VV)Cumulative(VV)
0.880.730.510.43
Cumulative(VH)Cumulative(VH)Cumulative(VH)Cumulative(VH)
0.880.740.490.47
Cumulative(VH + VV)Cumulative(VH + VV)Cumulative(VH + VV)Cumulative(VH + VV)
0.890.740.500.46
Cumulative(VH − VV)Cumulative(VH − VV)Cumulative(VH − VV)Cumulative(VH − VV)
0.610.550.320.41
Table 5. Comparison between the statistical coefficients R2 determined between all crop parameters and VH + VV and VH − VV for the two orbits O30 and O132 respectively.
He (cm)TDM (g·m−2)TFM (g·m−2)WC (%)
O30nVH + VVVH − VVVH + VVVH − VVVH − VVVH − VVVH + VVVH − VV
Irrigated P [1]160.600.100.510.000.470.000.180.07
Rainfed P [1]260.470.010.420.020.410.010.000.13
Irrigated P [2]120.830.020.650.020.020.510.770.12
Rainfed P [2]120.060.360.170.000.090.000.460.01
O132nVH + VVVH − VVVH + VVVH − VVVH + VVVH − VVVH + VVVH − VV
Irrigated P [1]150.920.690.800.650.780.590.060.23
Rainfed P [1]240.380.150.460.130.450.190.000.21
Irrigated P [2]140.740.170.710.010.010.120.490.12
Rainfed P [2]160.430.100.000.060.050.100.130.12
Publisher’s Note: MDPI stays neutral with regard to jurisdictional claims in published maps and institutional affiliations.

