Joint Selection of Influential Users and Locations under Target Region in Location-Based Social Networks


Abstract
:1. Introduction
- Is the location check-in frequency always an optimal choice for product promotion in LBSN?
- How much percent influenced users belong to the query region, and should we consider influenced users out of the region for product promotion?
- What users and locations to suggest for product promotion matching query region and query topic without considering location popularity information?
- We formally define the influential seed and location selection problem over location-based social networks.
- We formally define the topic-aware influential seed and location selection problem over location-based social networks.
- We propose heuristic-based algorithms for influential users and location selection simultaneously for product promotion.
2. Literature Review
2.1. Influence Maximization in Social Network
2.2. Influence Maximization in Geo-Social Network
2.3. Location Recommendation in LBSNs
3. Problem Formulation
4. Methodology
4.1. IUL Approaches
| Algorithm 1 IR influential users and locations selection. |
Input: LBSN: ; Query: Output: S-seeds, V-locations 1
|
| Algorithm 2 RF Selection of influential users and locations. |
Input: LBSN: ; Query: Output: S-seeds, V-locations 1 Initialization and locations extraction, , are same as in Algorithm 1.
|
| Algorithm 3 G-IR Selection of influential users and locations. |
Input: LBSN: ; Query: Output: S-seeds, V-locations 1 Initialization and locations extraction, , are same as in Algorithm 1. Extract Users checked in at
|
4.2. t-IUL Approaches
| Algorithm 4 t-RF Selection of influential users and locations. |
Input: LBSN: ; Query: Output: S-seeds, V-locations 1 10,000 ▹ Number of Simulations for all locations l ∈ L do if (l.city ) and (l.category == q) then
|
| Algorithm 5 t-GIR Selection of influential users and locations. |
Input: LBSN: ; Query: Output: S-seeds, V-locations 1
|
4.3. Time Complexity
5. Experiments
5.1. Experimental Setup
5.2. Experimental Results
5.2.1. IUL Approaches Result Summary
5.2.2. t-IUL Approaches Result Summary
5.3. Discussion
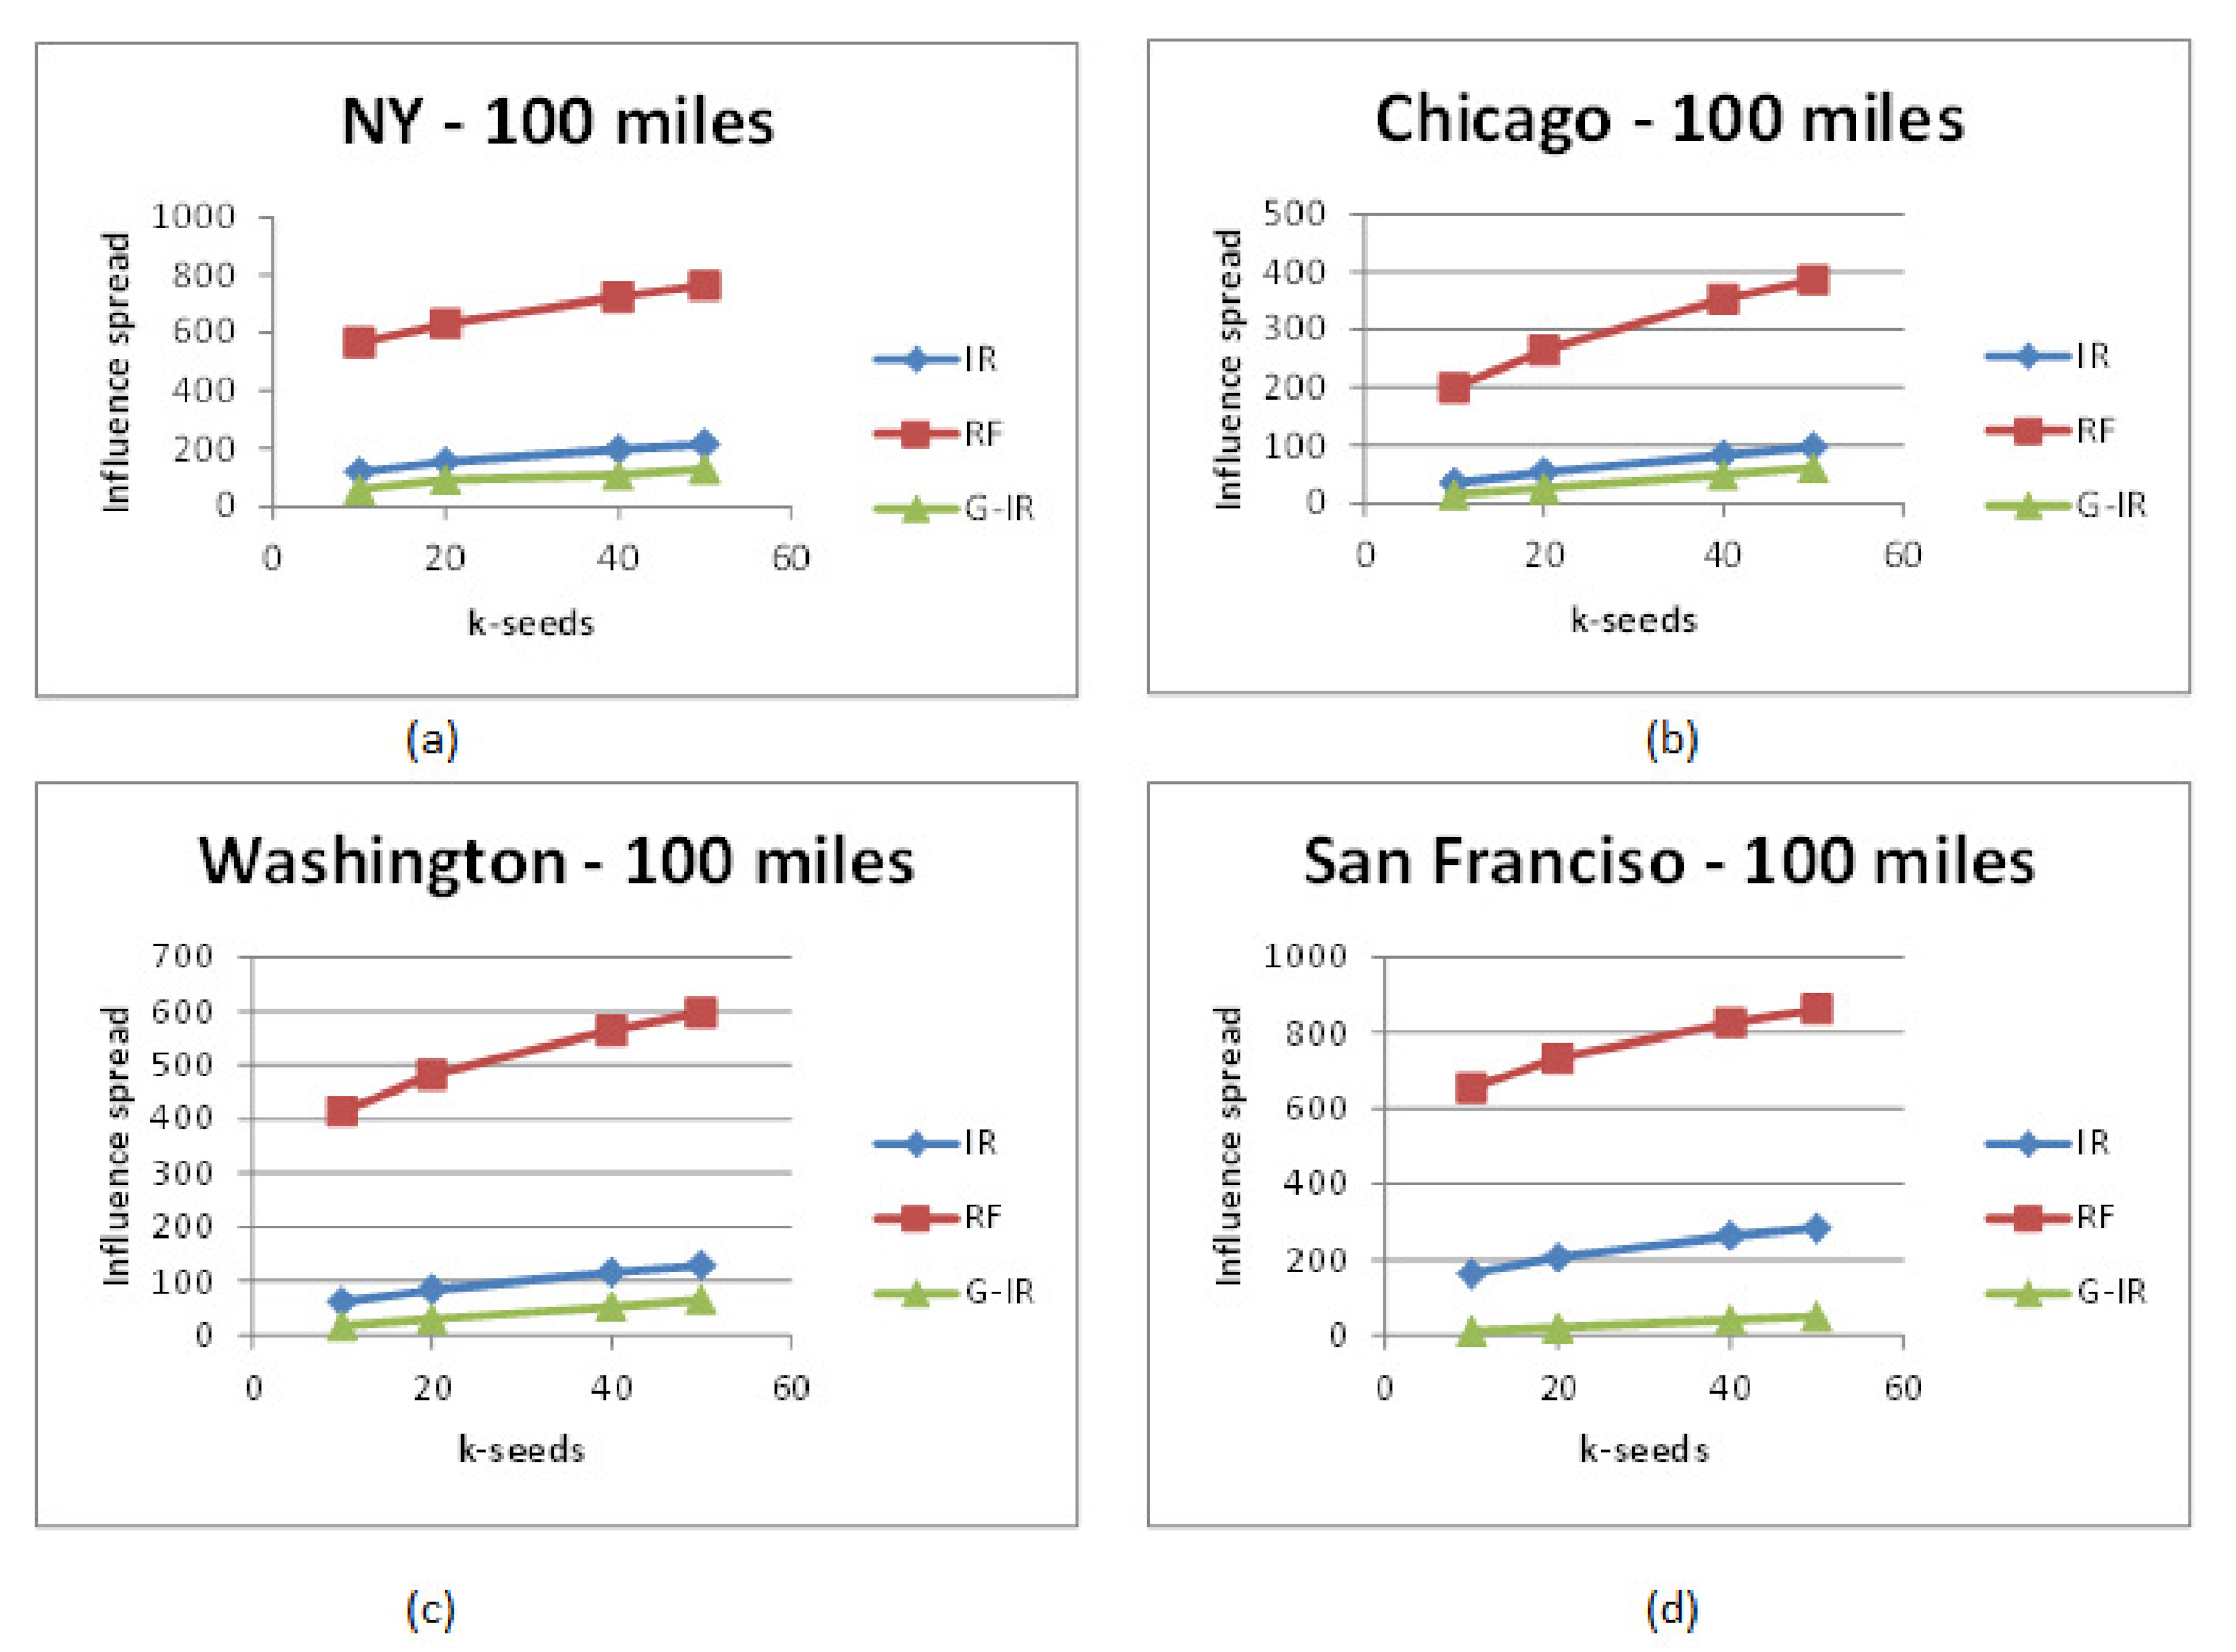
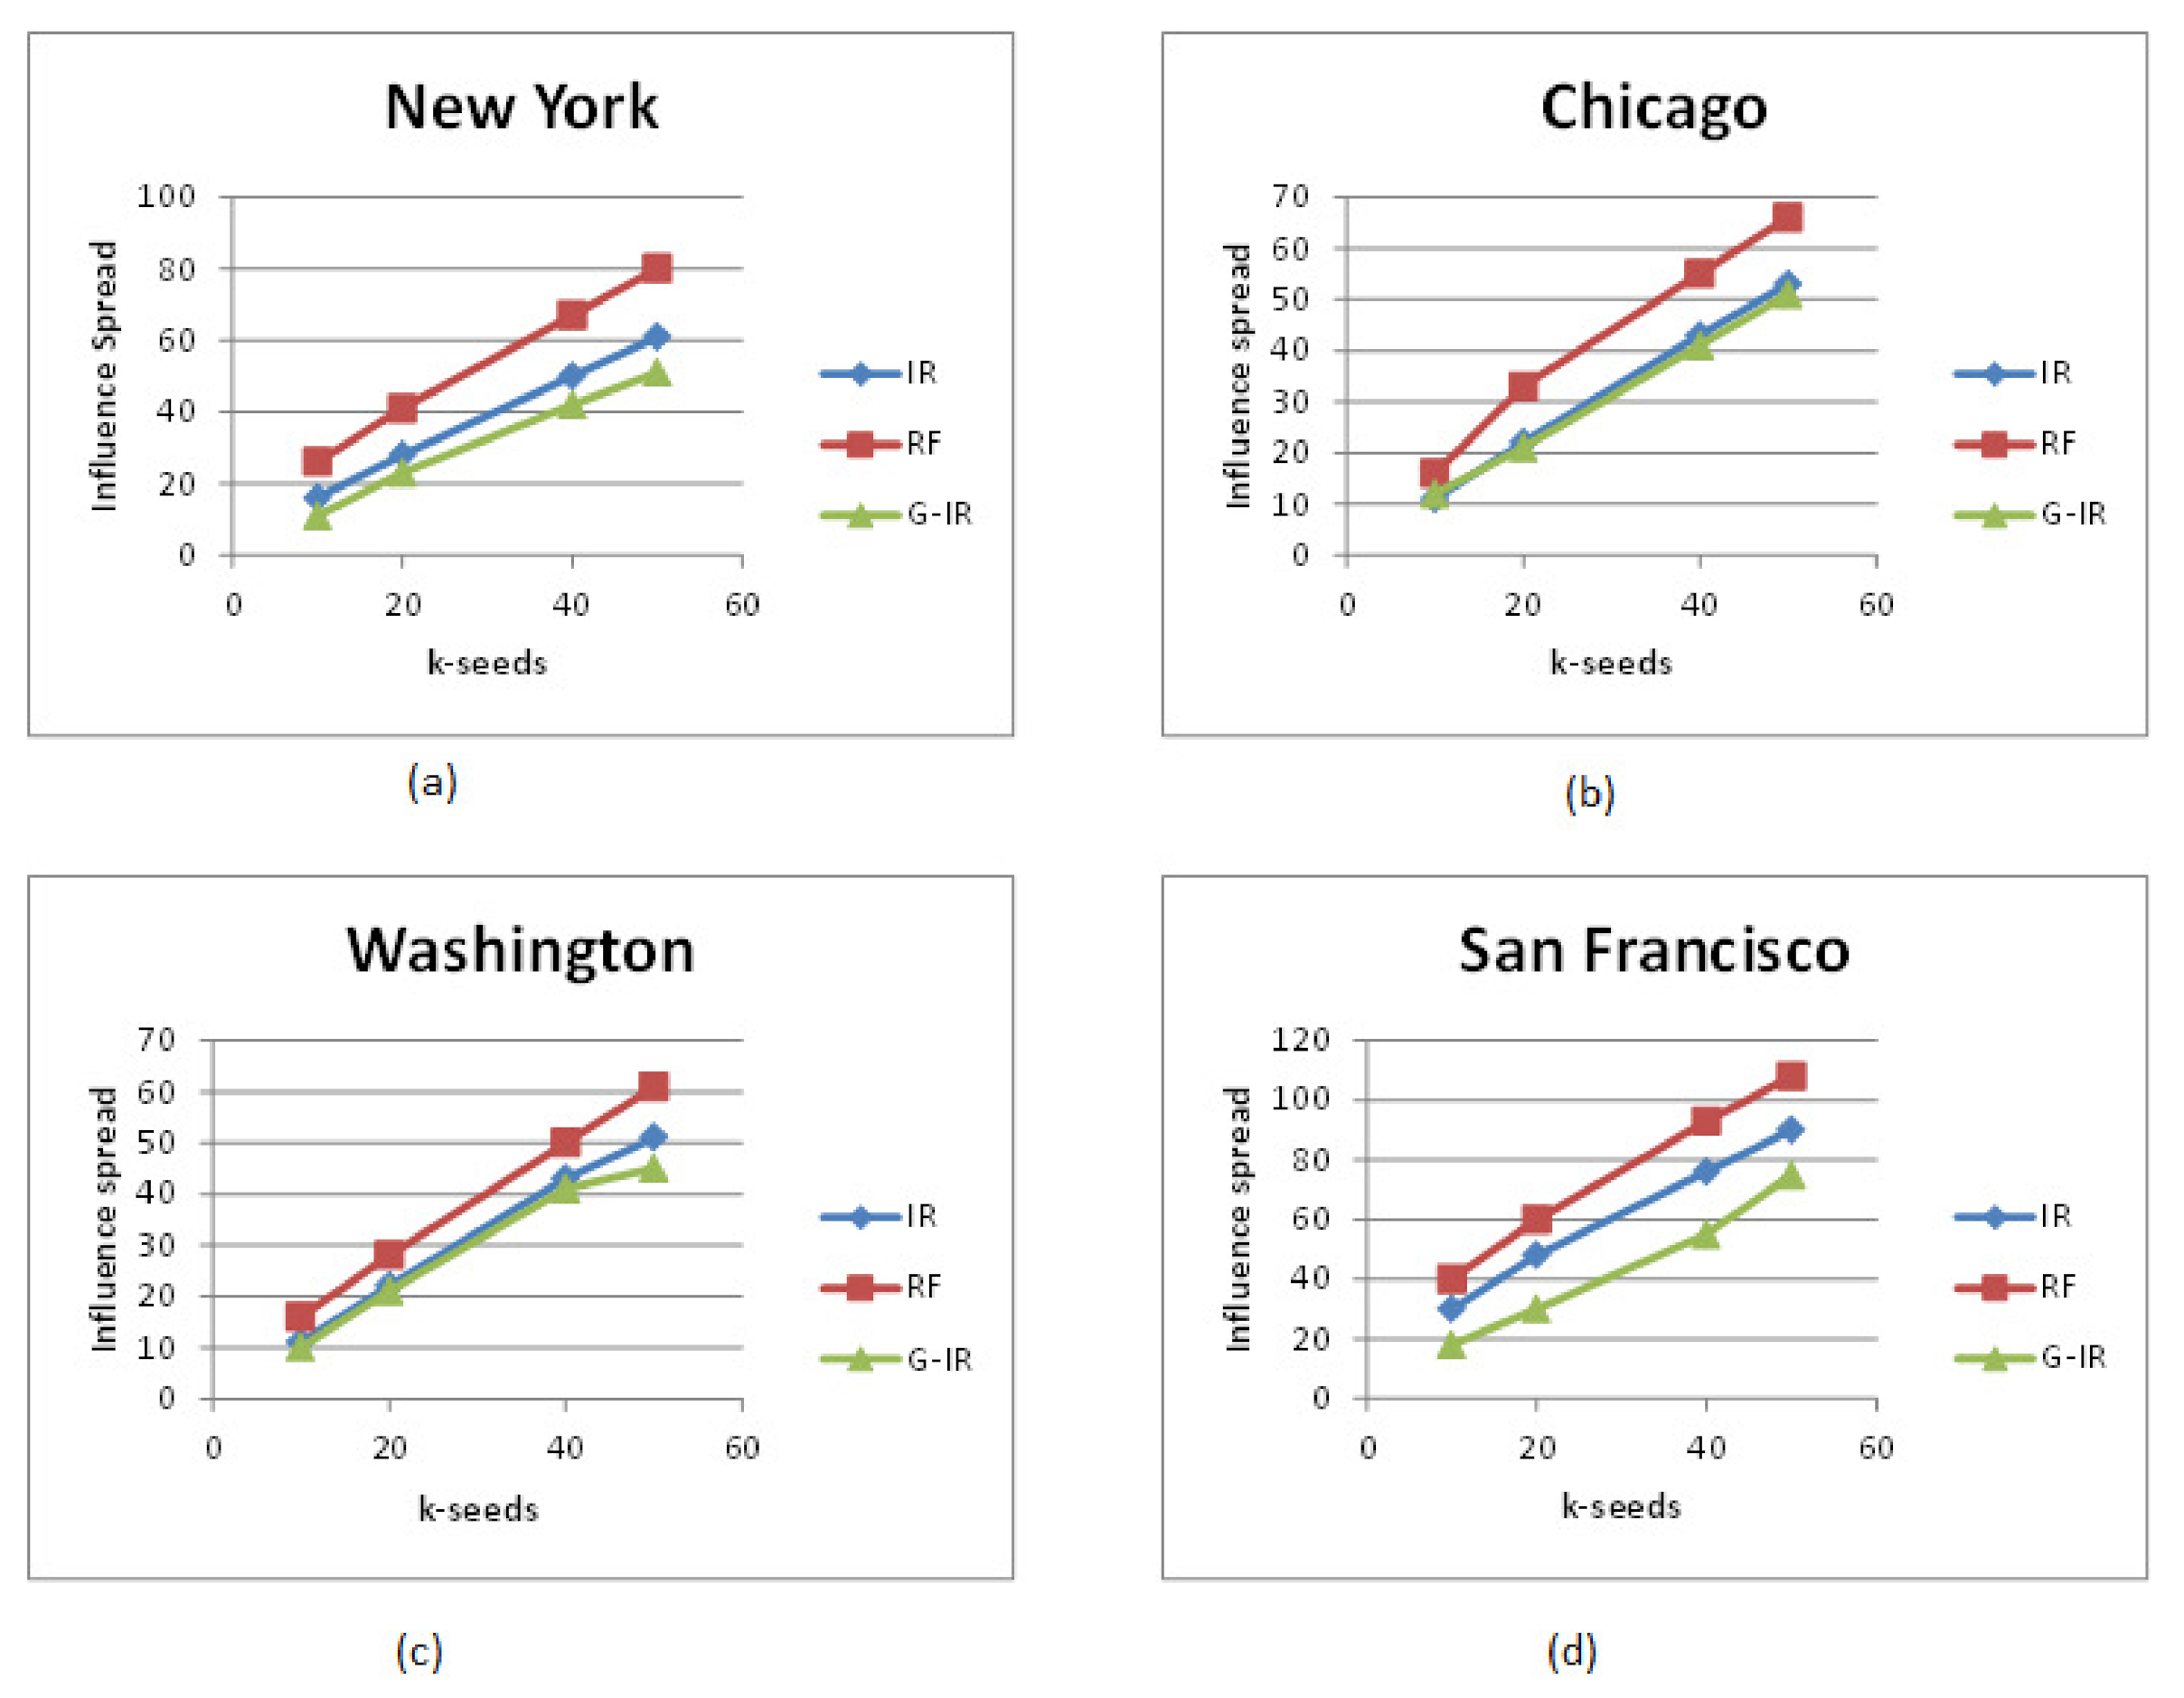
- There is a significant percentage difference in influence spread within and out of the target region.
- RF-algorithms achieved better performance as they considered users having connections across the target city for promotion. The top k-influential seed set who are local to the target city and have friends across the region can influence users to visit famous locations under target city.
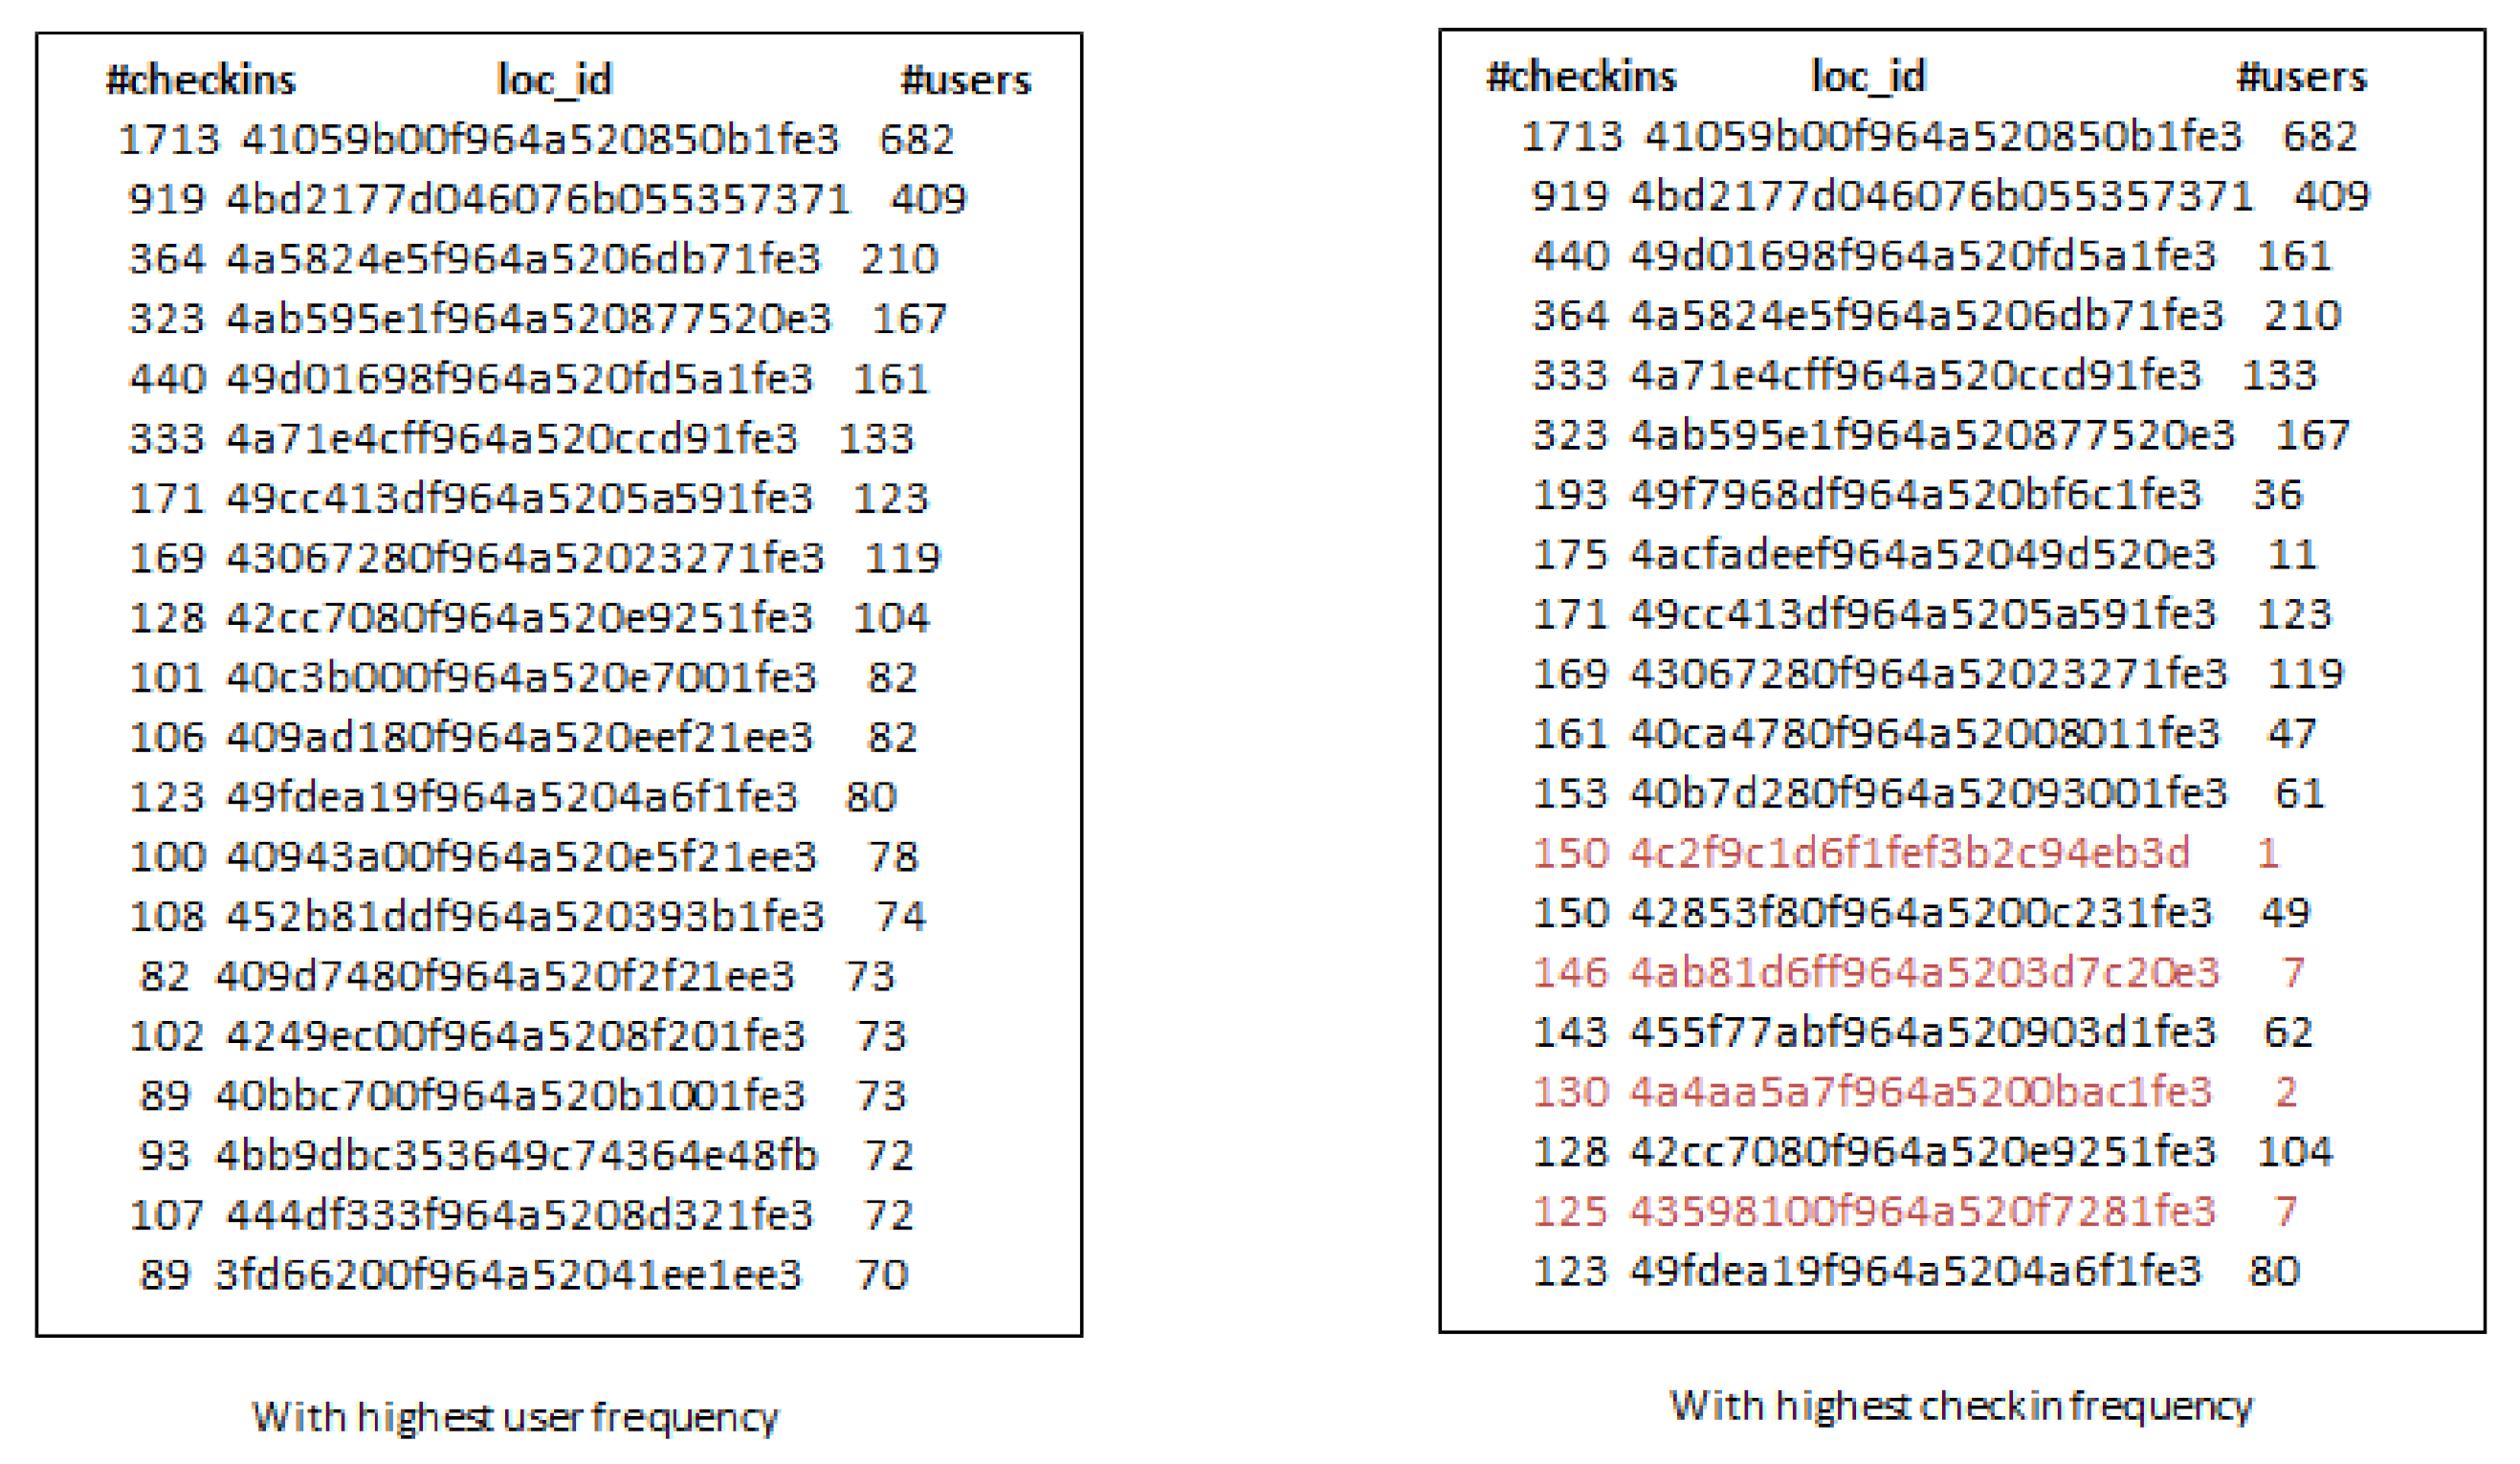
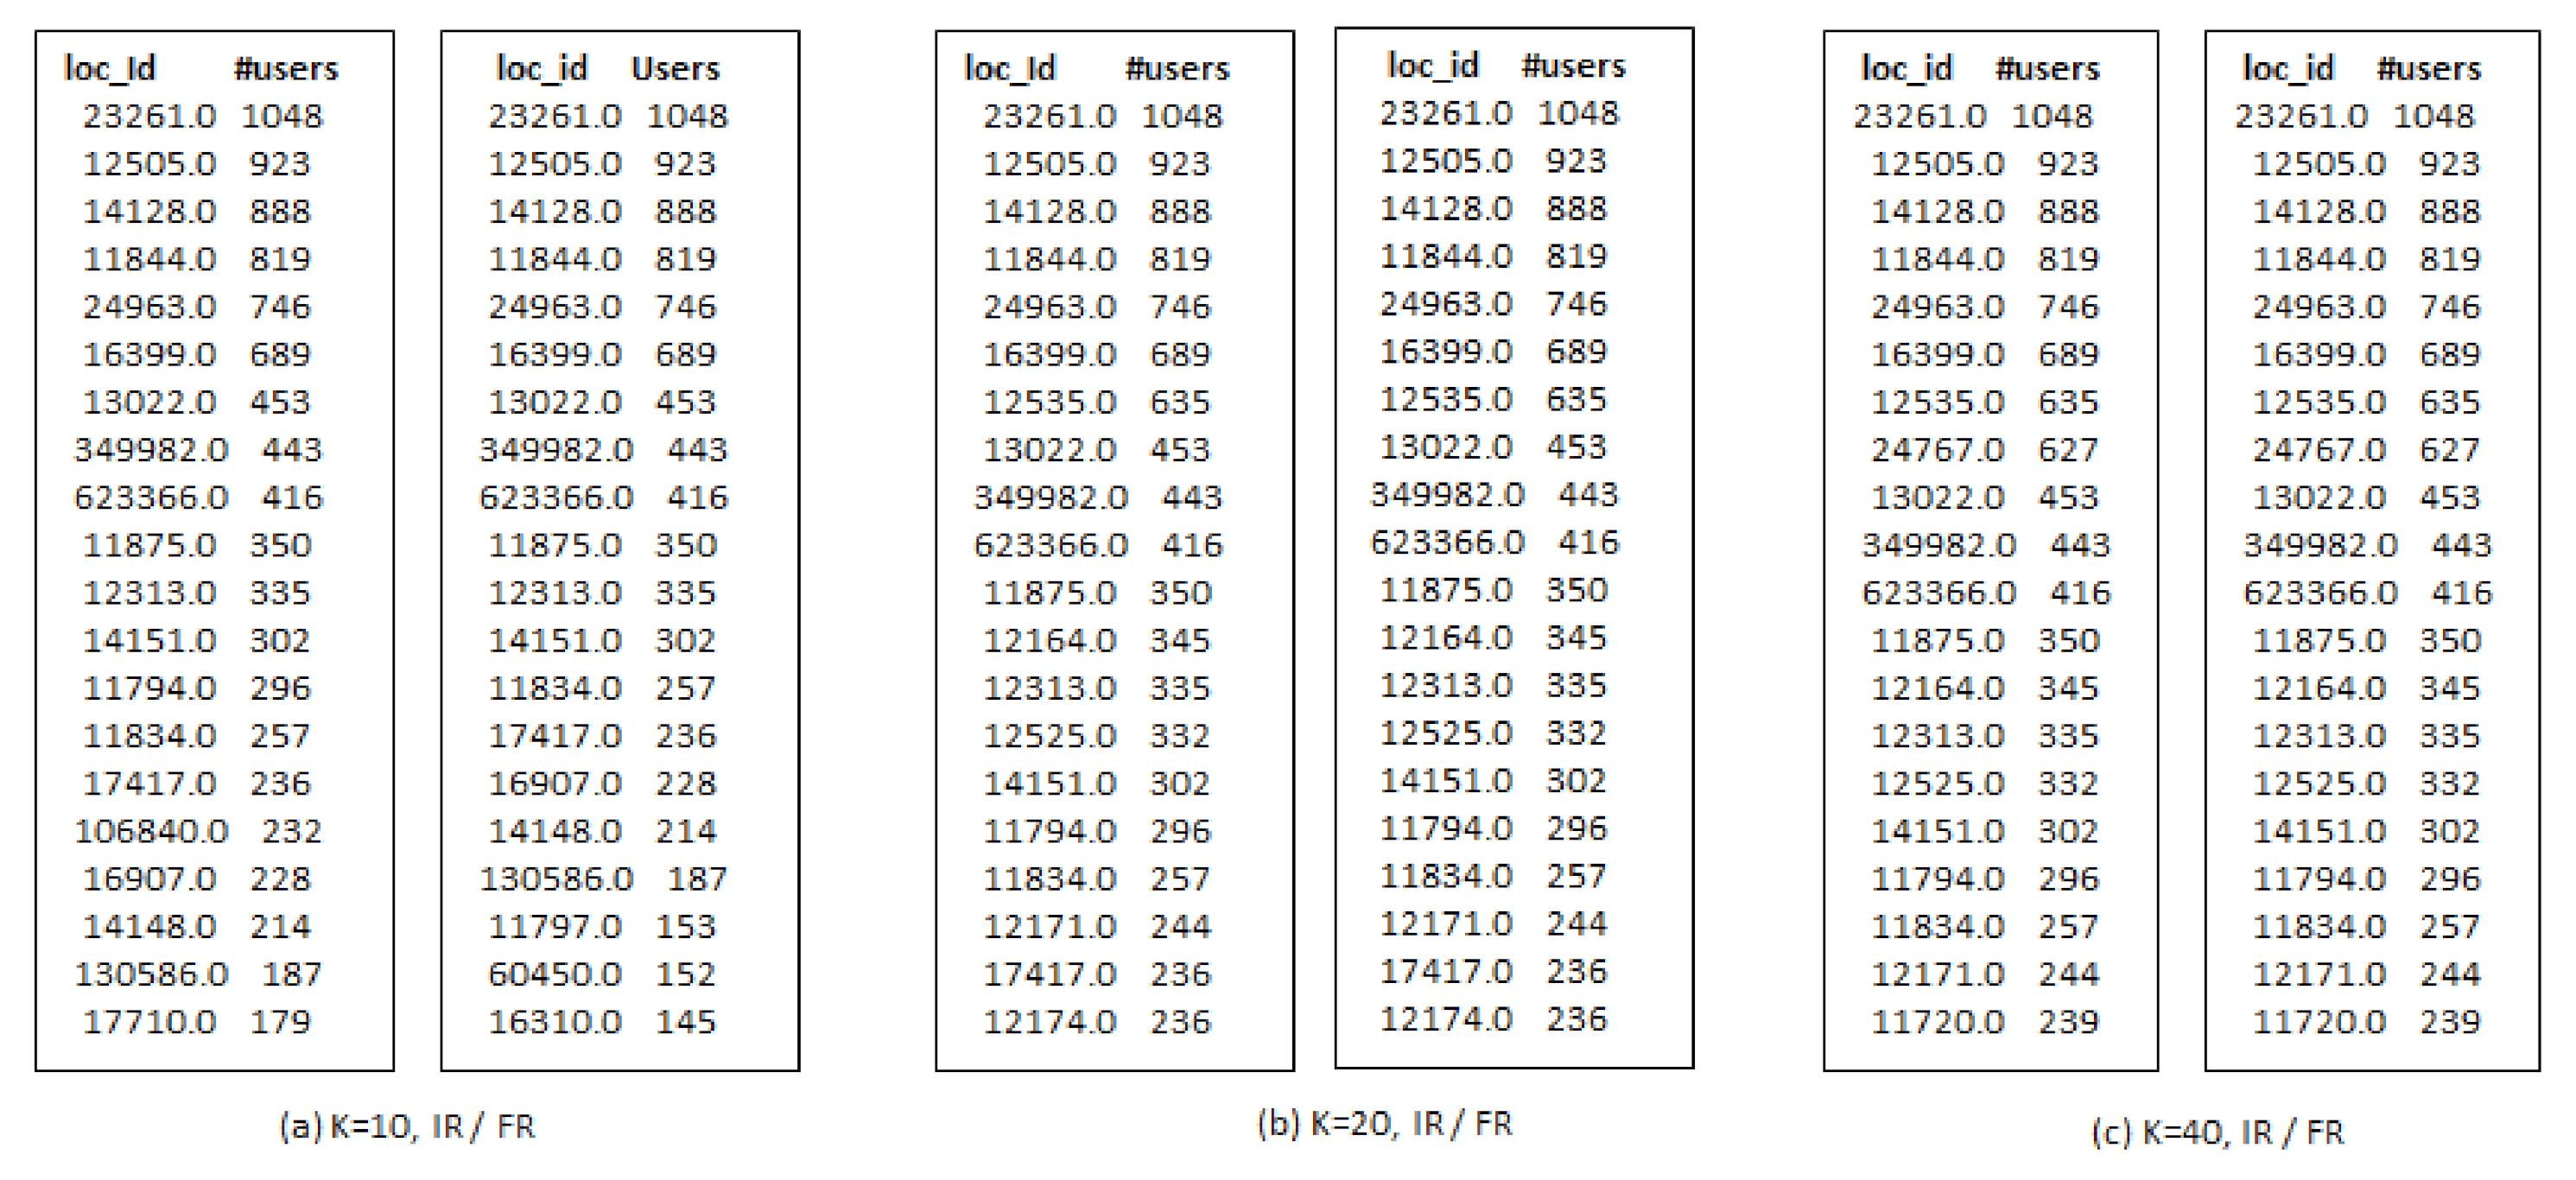
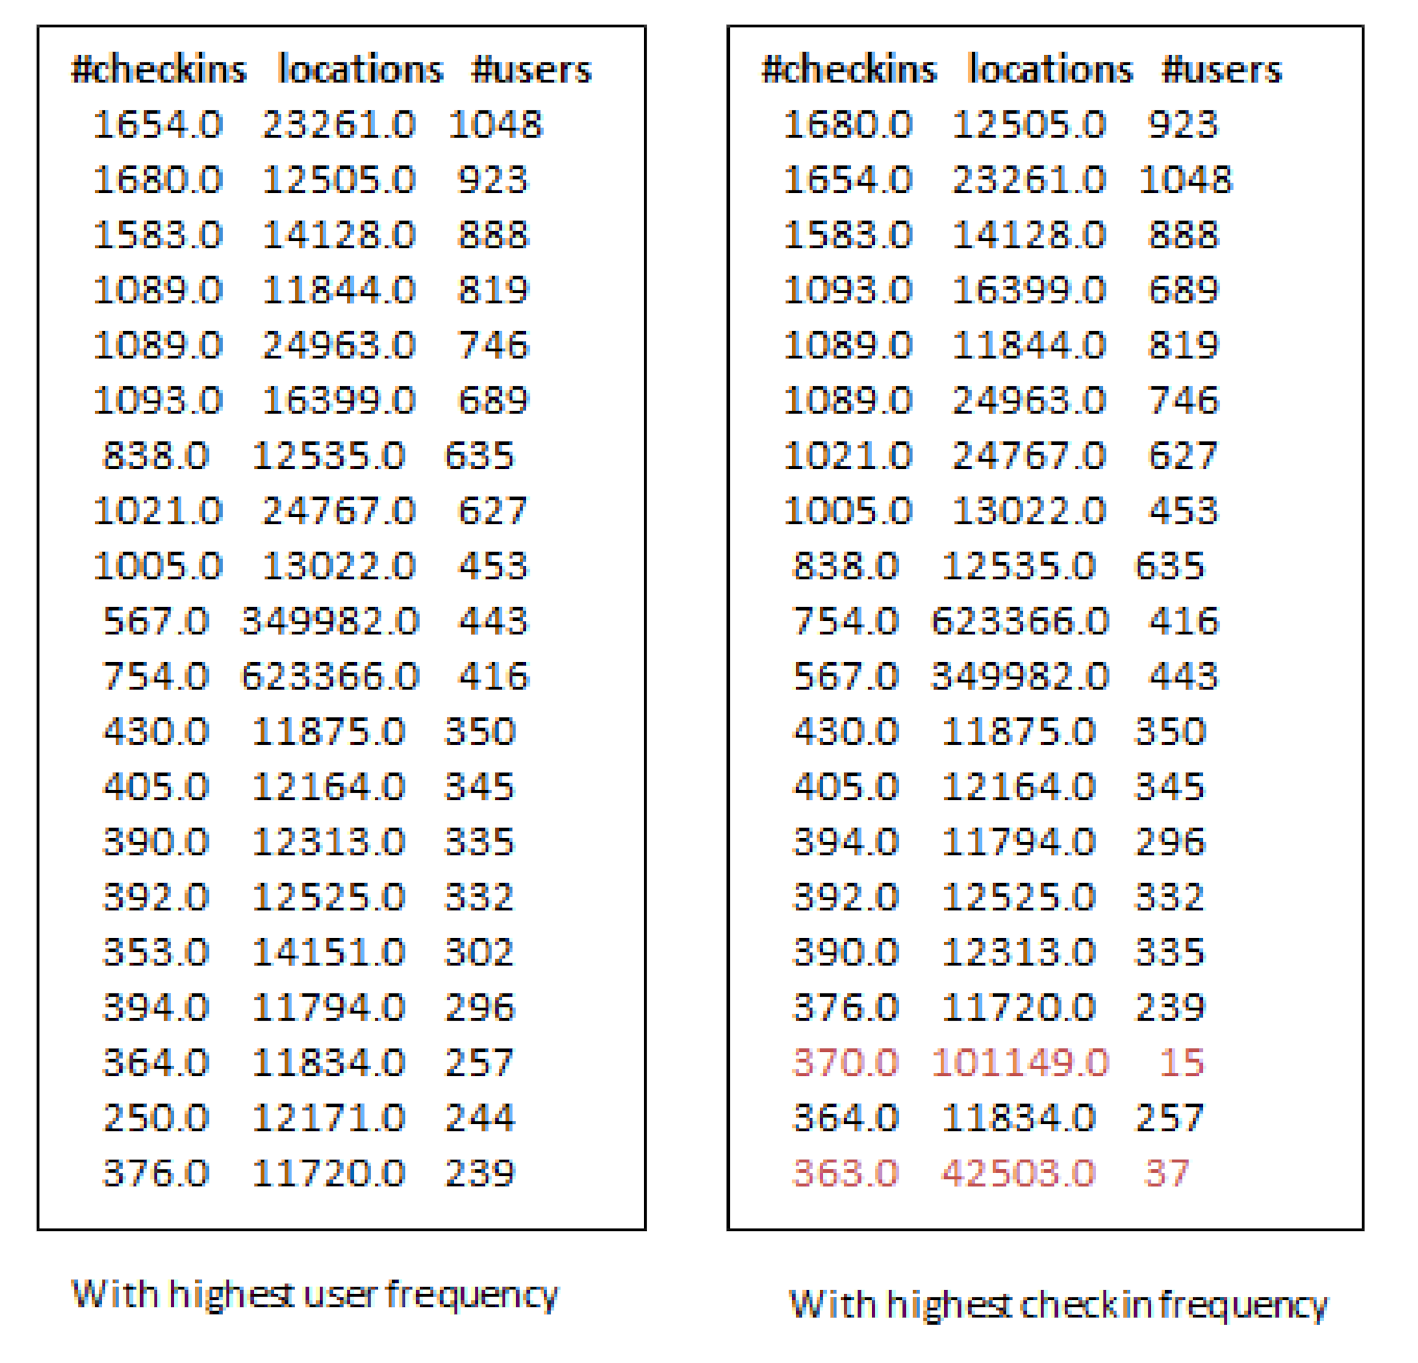
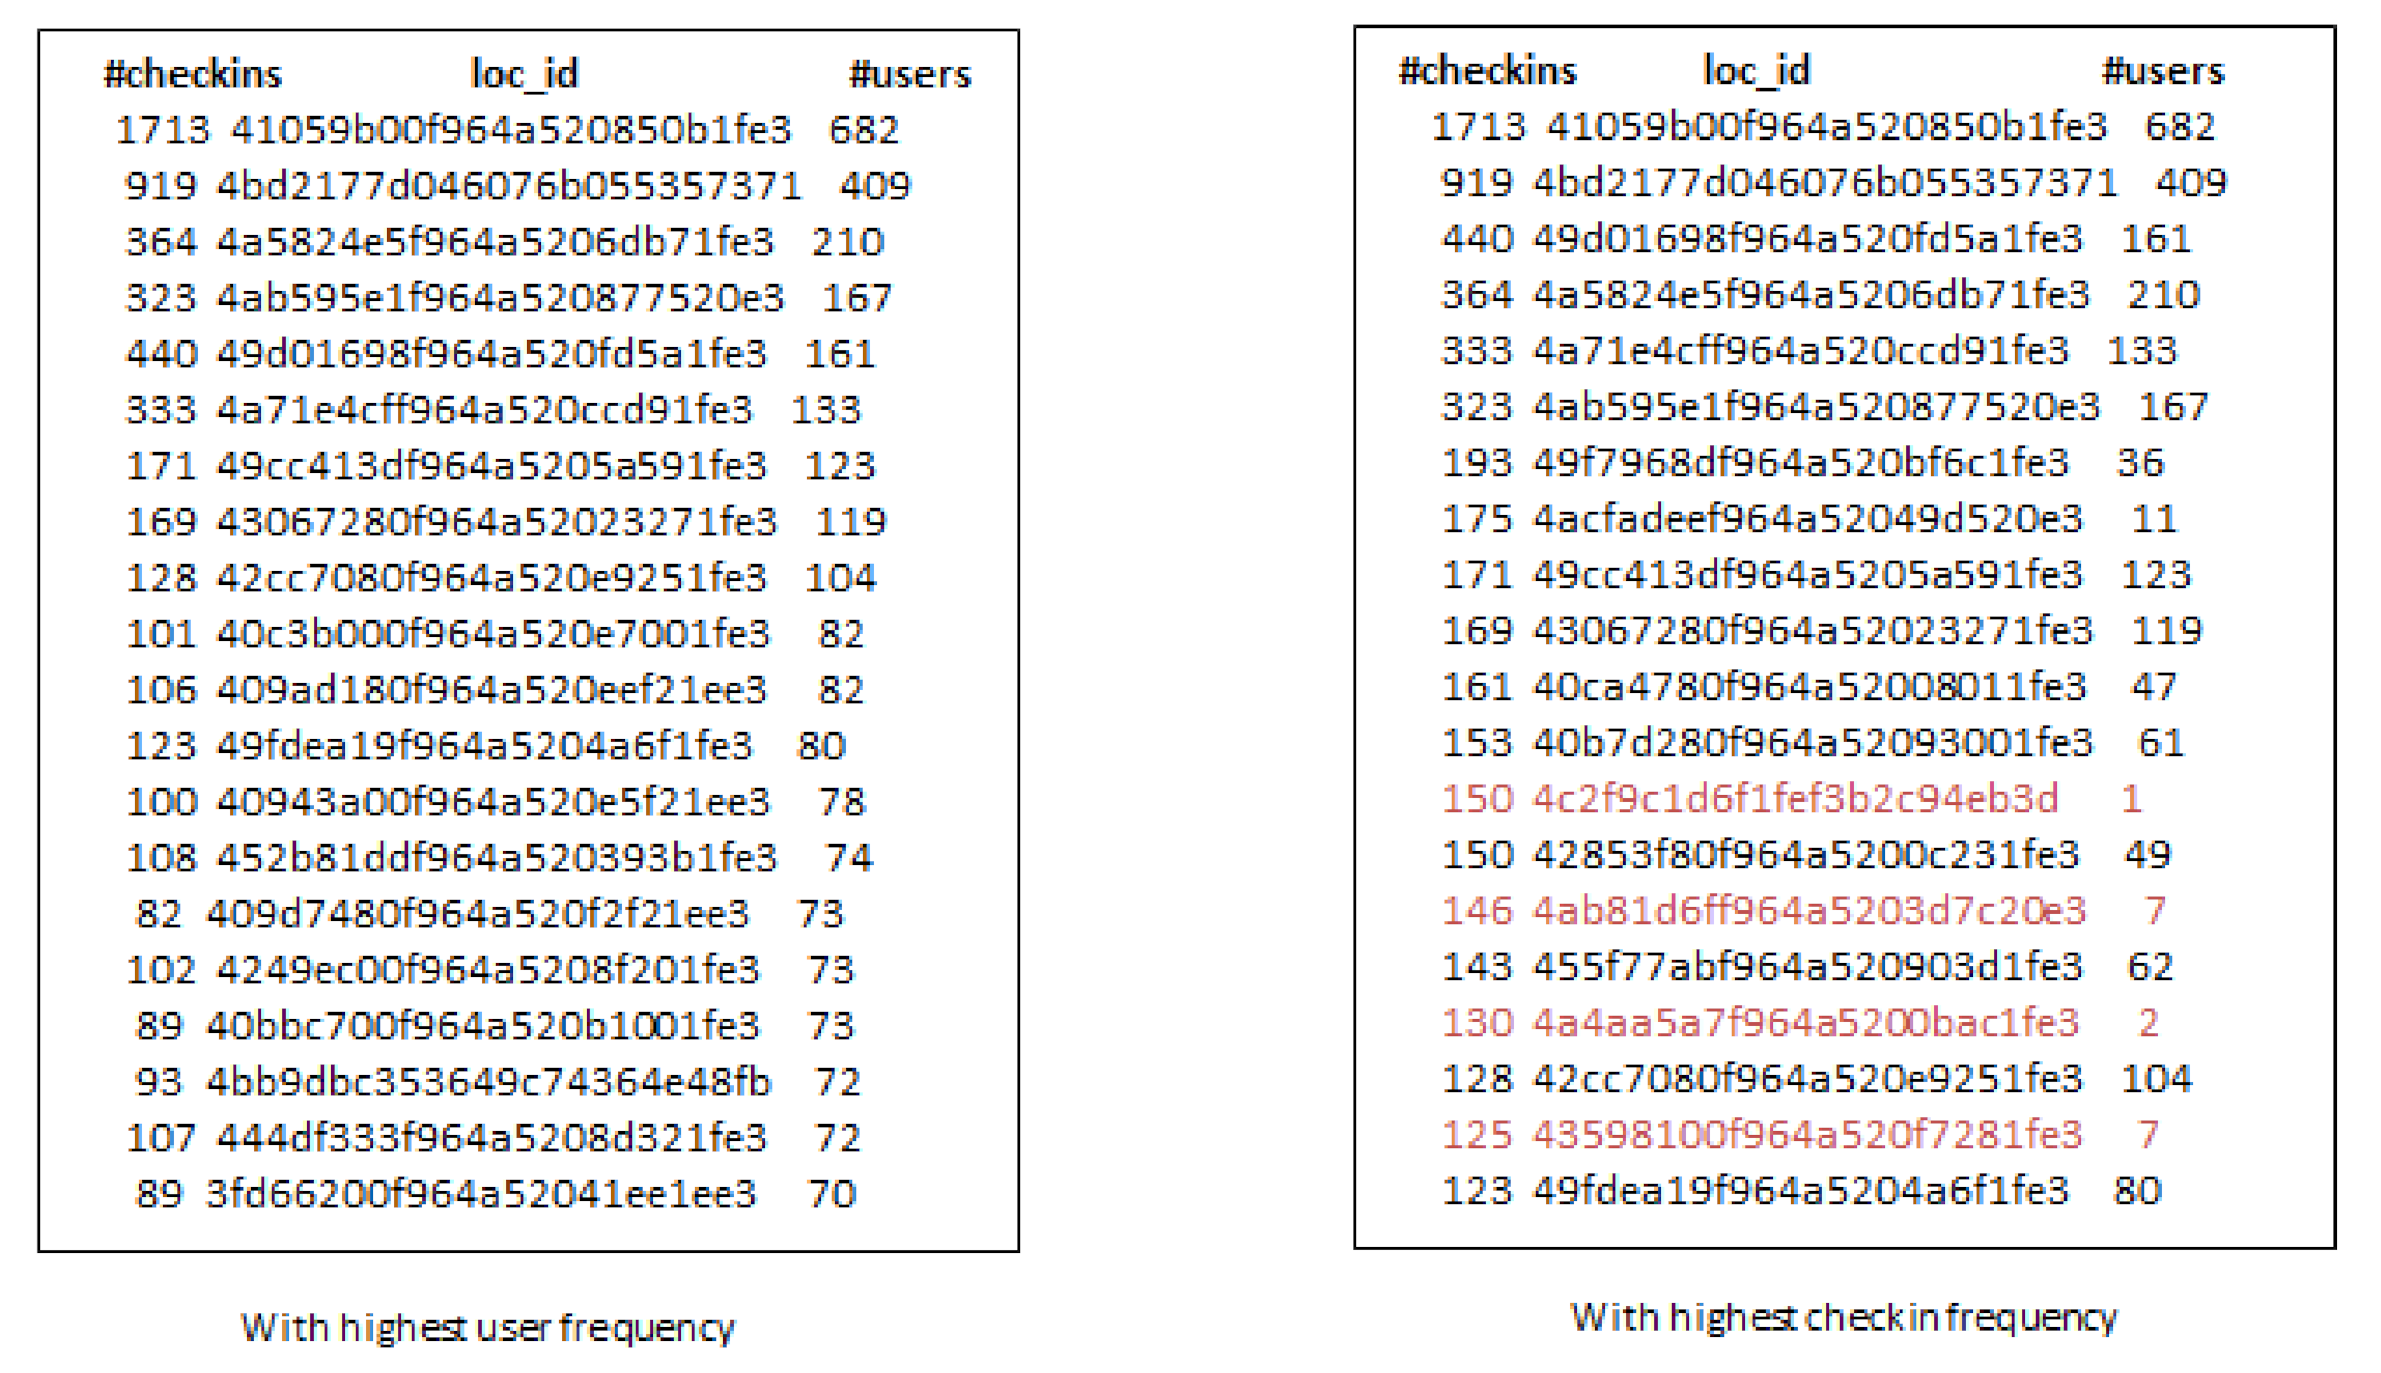
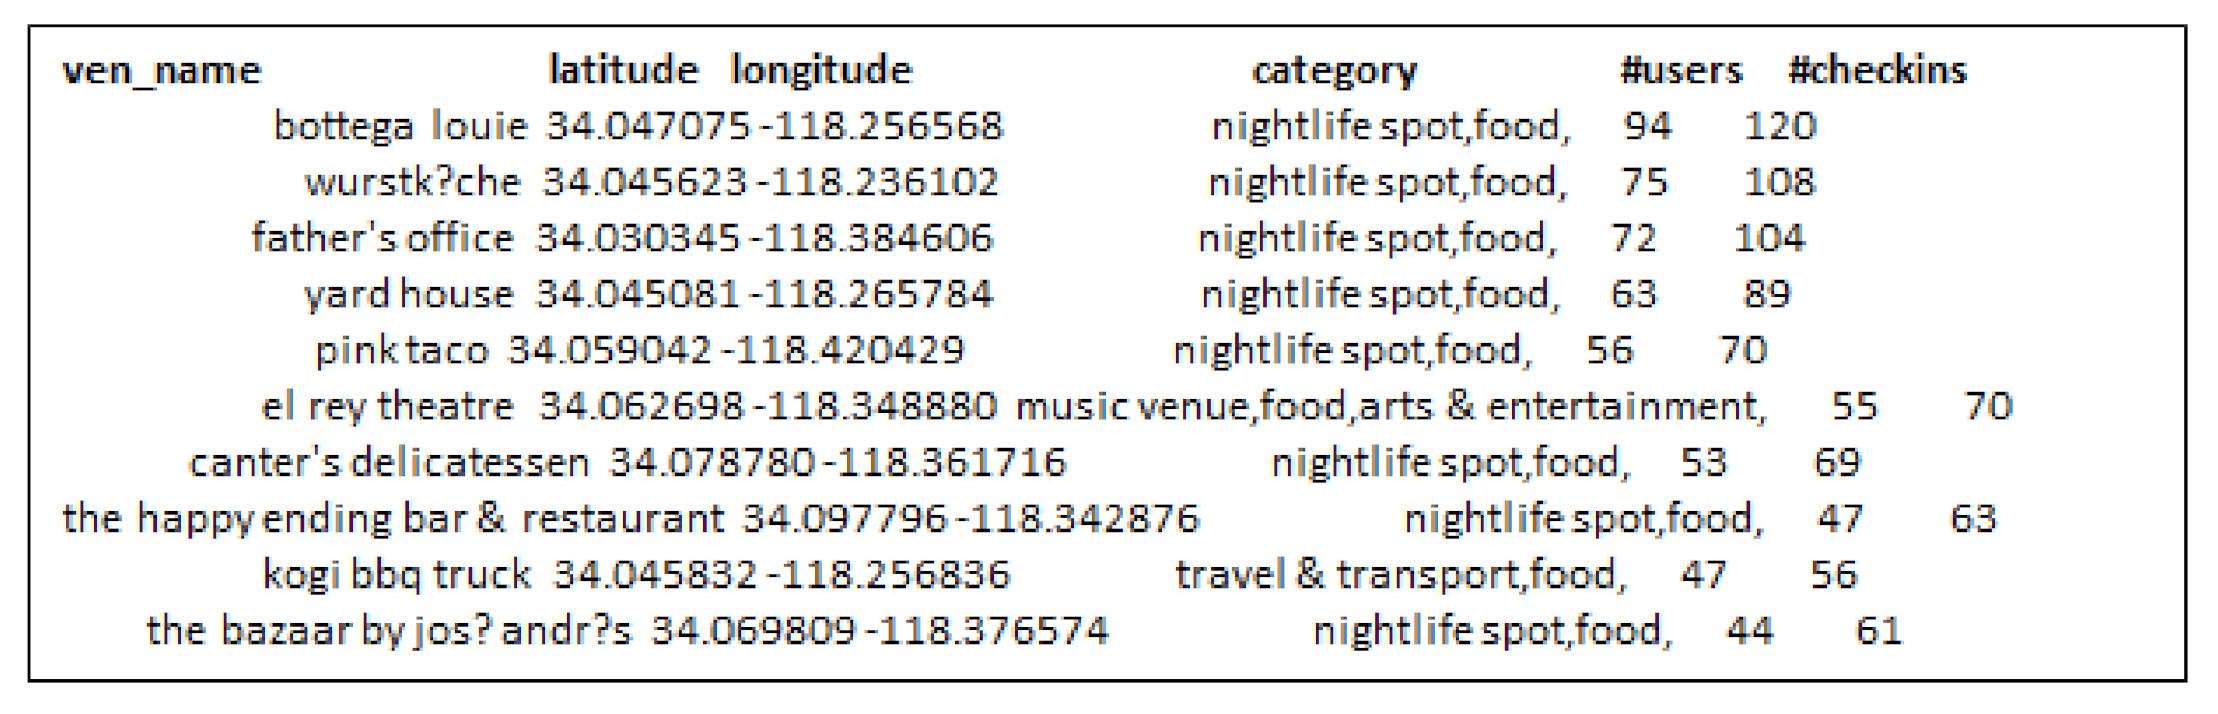
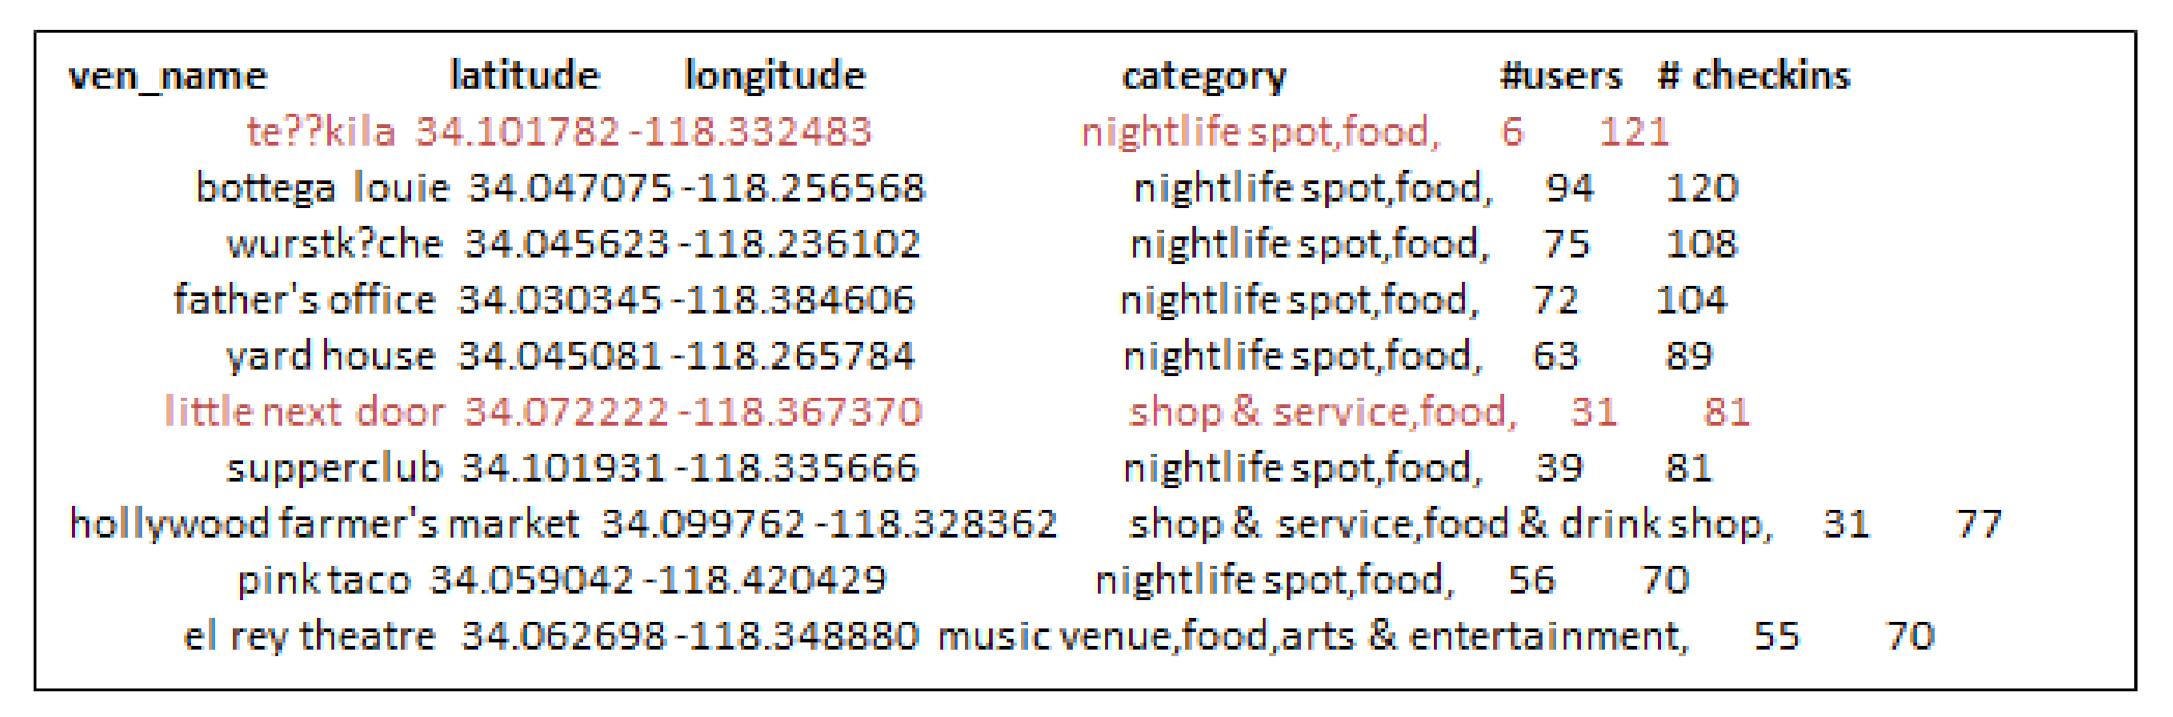
- Third, the locations selected by considering check-in information only are not always an optimal choice for production promotion. Since, few users can have checked-in location hundreds or thousands times but it may not denote its real popularity.
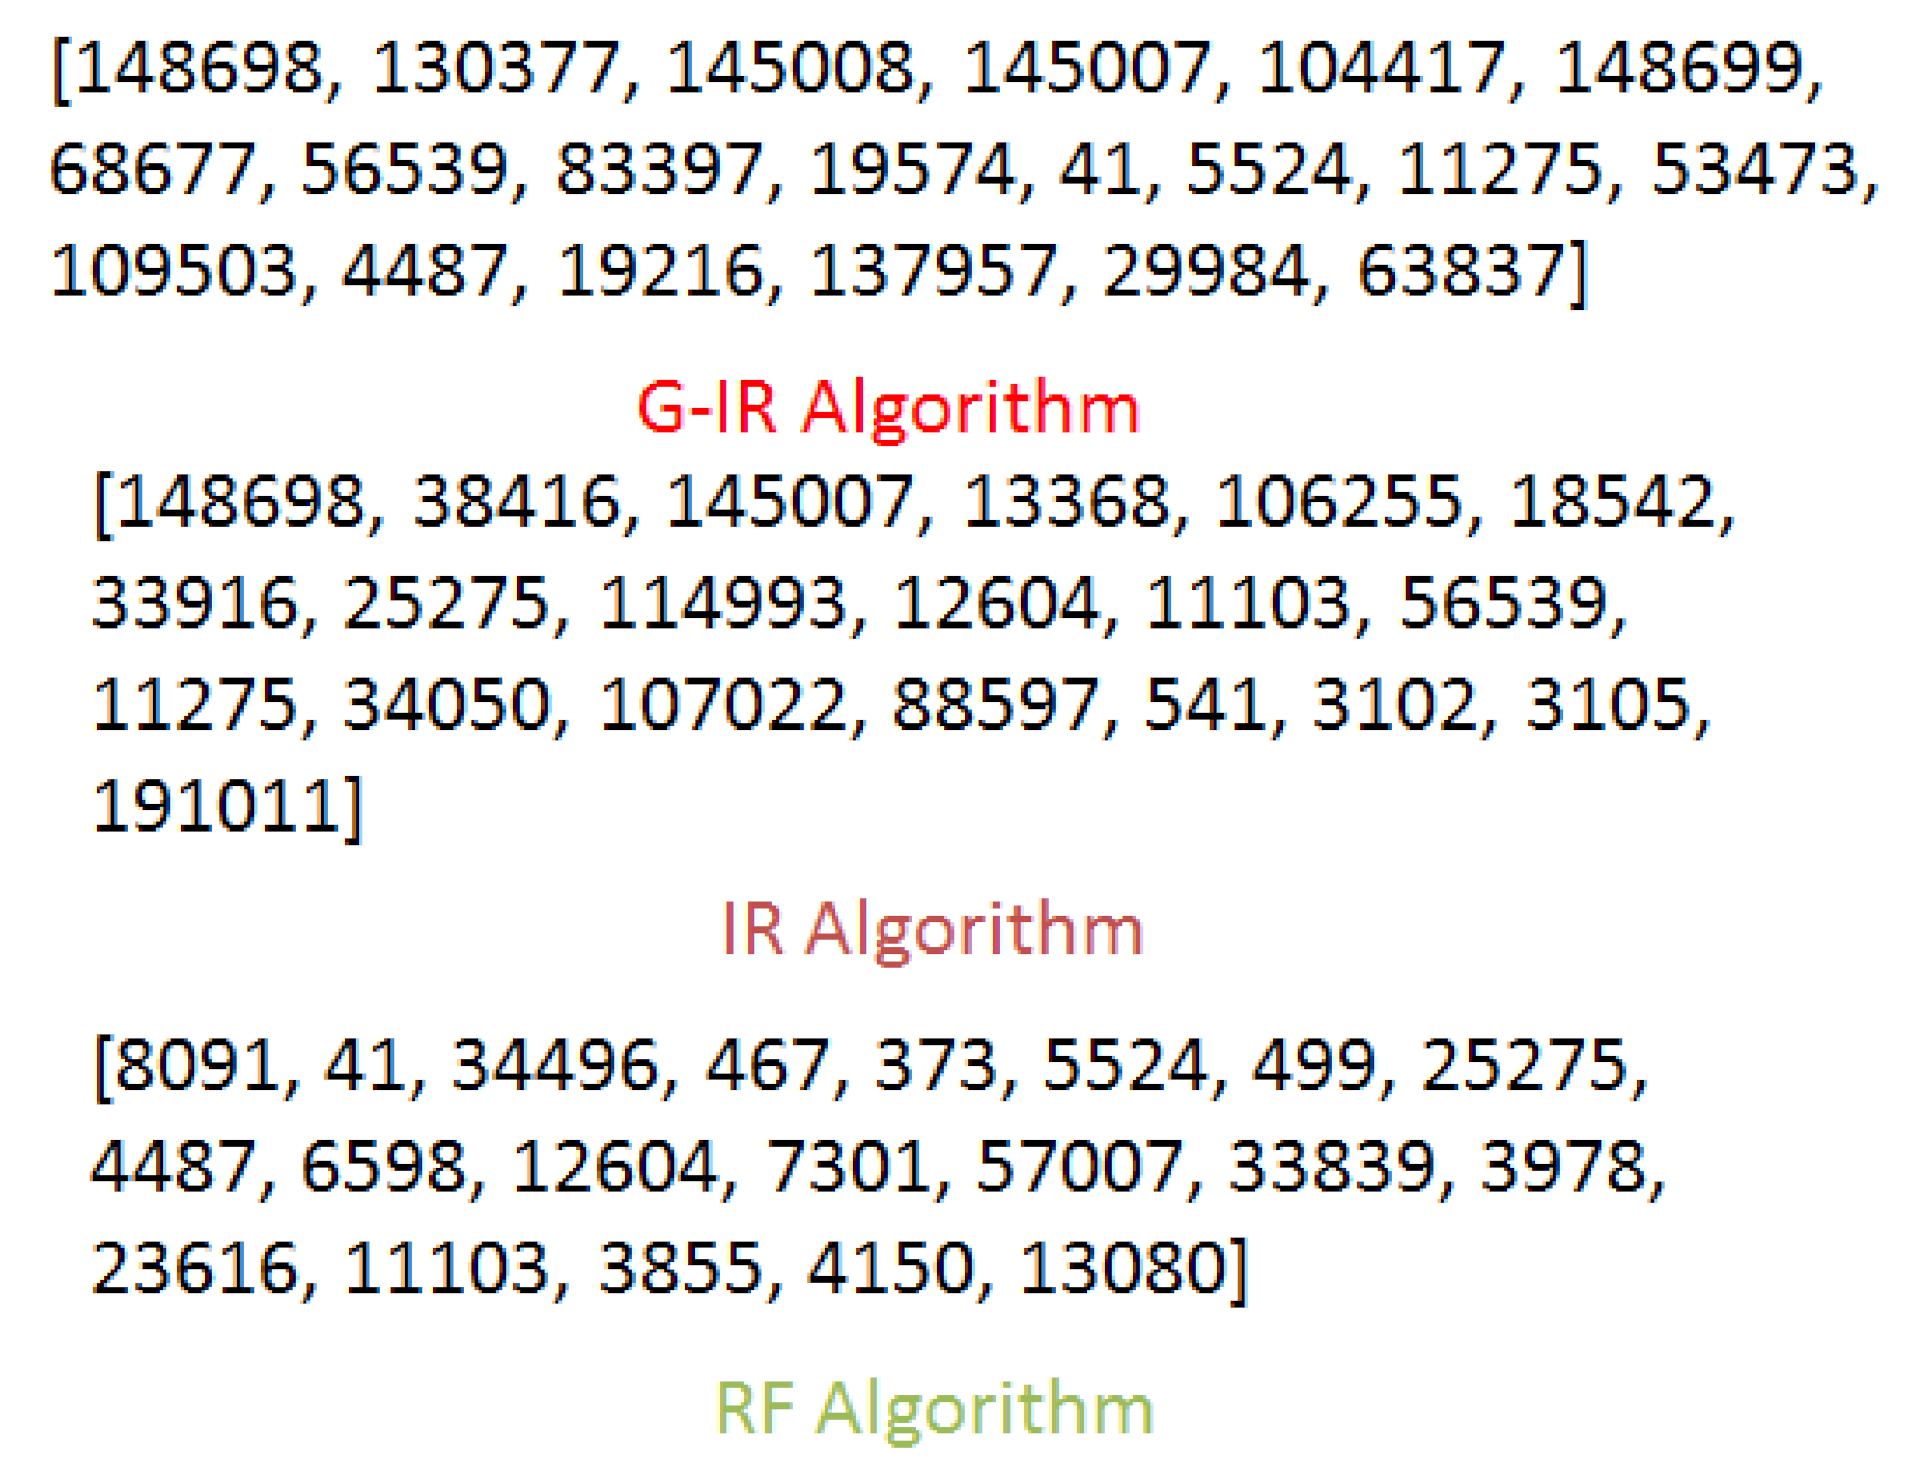
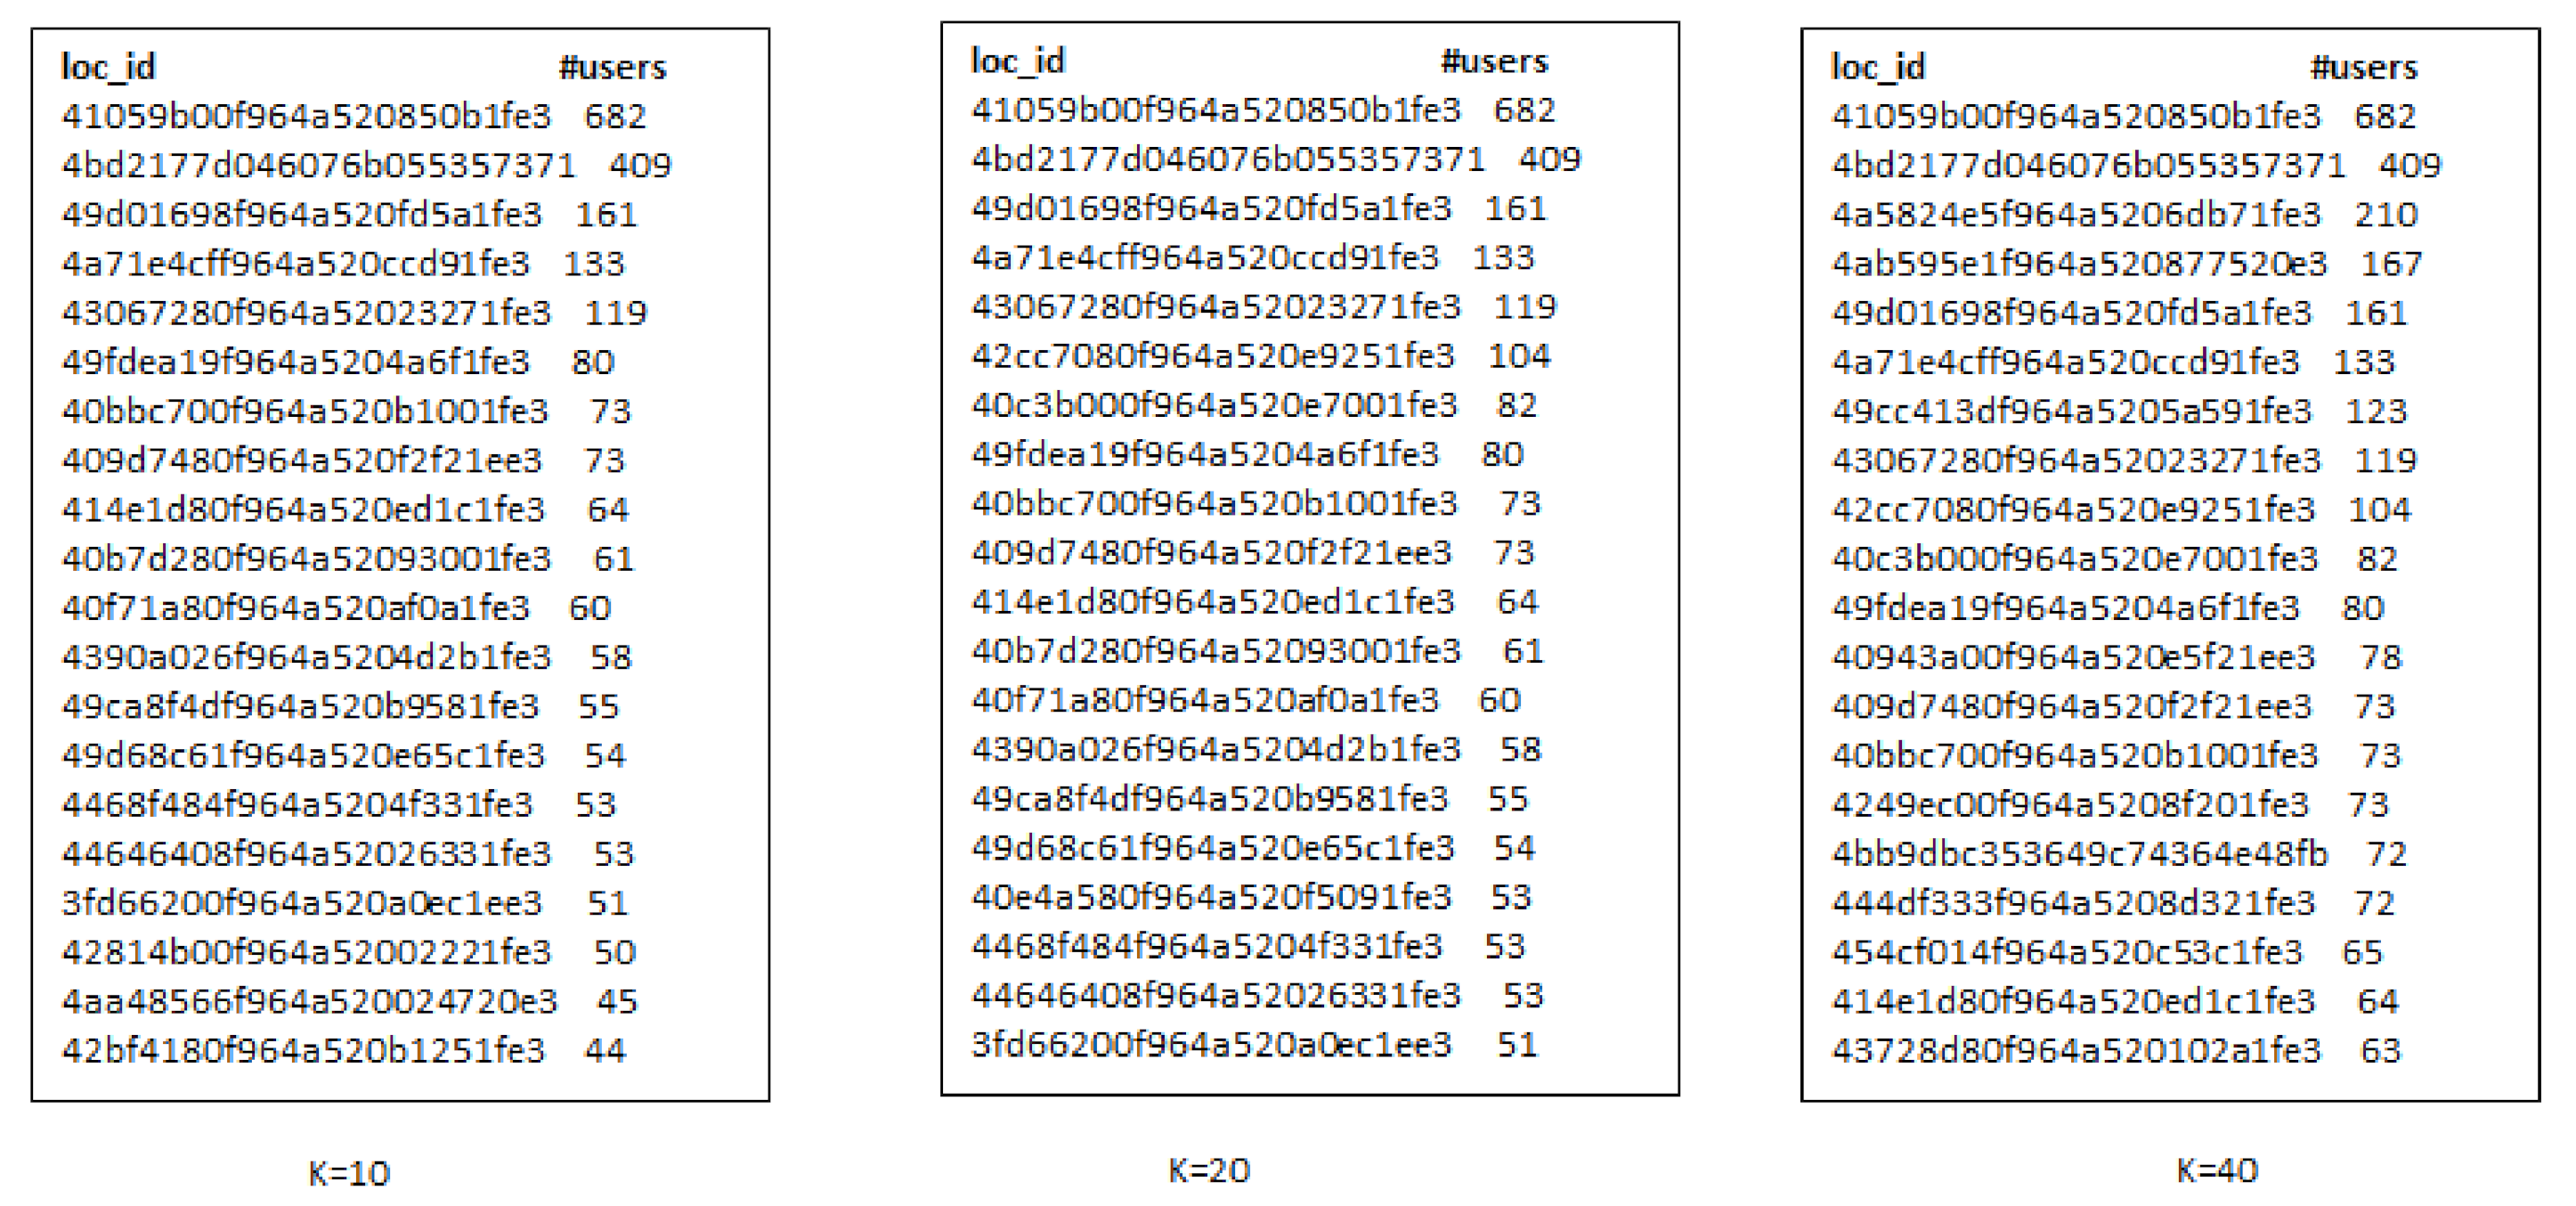
- When we increase the number of k-seeds, our proposed approach achieves better influential locations as selected by a greedy approach with the highest users. However, the greedy approach (G-IR), which considers only check-in frequency distribution, yields poor results in influential locations selection.
6. Conclusions
Author Contributions
Funding
Institutional Review Board Statement
Informed Consent Statement
Data Availability Statement
Conflicts of Interest
Abbreviations
| MDPI | Multidisciplinary Digital Publishing Institute |
| IM | Influence Maximization |
| LBSNs | Location-based Social Networks |
| IUL | Influential Users and Locations |
| t-IUL | Topic-aware Influential Users and Locations |
| IR | In-Region |
| RF | Region-Free |
| G-IR | Greedy In-Region |
| IC | Independent cascade |
| LT | Linear threshold |
| t-RF | Topic-aware Region-Free |
References
- Kempe, D.; Kleinberg, J.; Tardos, É. Maximizing the spread of influence through a social network. In Proceedings of the Ninth ACM SIGKDD International Conference on Knowledge Discovery and Data Mining, Washington, DC, USA, 24–27 August 2003; pp. 137–146. [Google Scholar]
- Chen, W.; Wang, Y.; Yang, S. Efficient influence maximization in social networks. In Proceedings of the 15th ACM SIGKDD International Conference on Knowledge Discovery and Data Mining, Paris, France, 28 June–1 July 2009; pp. 199–208. [Google Scholar]
- Chen, W.; Wang, C.; Wang, Y. Scalable influence maximization for prevalent viral marketing in large-scale social networks. In Proceedings of the 16th ACM SIGKDD International Conference on Knowledge Discovery and Data Mining, Washington, DC, USA, 24–28 July 2010; pp. 1029–1038. [Google Scholar]
- Borgs, C.; Brautbar, M.; Chayes, J.; Lucier, B. Maximizing social influence in nearly optimal time. In Proceedings of the Twenty-Fifth Annual ACM-SIAM Symposium on Discrete Algorithms, Portland, OR, USA, 5–7 January 2014; pp. 946–957. [Google Scholar]
- Ohsaka, N.; Akiba, T.; Yoshida, Y.; Kawarabayashi, K.I. Fast and Accurate Influence Maximization on Large Networks with Pruned Monte-Carlo Simulations. In Proceedings of the AAAI Conference on Artificial Intelligence, Quebec City, QC, Canada, 27–31 July 2014; pp. 138–144. [Google Scholar]
- Tang, Y.; Shi, Y.; Xiao, X. Influence maximization in near-linear time: A martingale approach. In Proceedings of the 2015 ACM SIGMOD International Conference on Management of Data, Melbourne, Australia, 31 May–4 June 2015; pp. 1539–1554. [Google Scholar]
- Domingos, P.; Richardson, M. Mining the network value of customers. In Proceedings of the Seventh ACM SIGKDD International Conference on Knowledge Discovery and Data Mining, San Francisco, CA, USA, 26–29 August 2001; pp. 57–66. [Google Scholar]
- Richardson, M.; Domingos, P. Mining knowledge-sharing sites for viral marketing. In Proceedings of the 8th ACM SIGKDD International Conference on Knowledge Discovery and Data Mining, Edmonton, AB, Canada, 23–26 July 2002; pp. 61–70. [Google Scholar]
- Gao, H.; Liu, H. Data analysis on location-based social networks. In Mobile Social Networking; Springer: Berlin/Heidelberg, Germany, 2014; pp. 165–194. [Google Scholar]
- Li, N.; Chen, G. Analysis of a location-based social network. In Proceedings of the 2009 International Conference on Computational Science and Engineering, Vancouver, BC, Canada, 29–31 August 2009; Volume 4, pp. 263–270. [Google Scholar]
- Li, G.; Chen, S.; Feng, J.; Tan, K.L.; Li, W.S. Efficient location-aware influence maximization. In Proceedings of the 2014 ACM SIGMOD International Conference on Management of Data, Snowbird, UT, USA, 22–27 June 2014; pp. 87–98. [Google Scholar]
- Bouros, P.; Sacharidis, D.; Bikakis, N. Regionally influential users in location-aware social networks. In Proceedings of the 22nd ACM SIGSPATIAL International Conference on Advances in Geographic Information Systems, Dallas/Fort Worth, TX, USA, 4–7 November 2014; pp. 501–504. [Google Scholar]
- Zhu, W.Y.; Peng, W.C.; Chen, L.J.; Zheng, K.; Zhou, X. Modeling user mobility for location promotion in location-based social networks. In Proceedings of the 21th ACM SIGKDD International Conference on Knowledge Discovery and Data Mining, Sydney, NSW, Australia, 10–13 August 2015; pp. 1573–1582. [Google Scholar]
- Wang, X.; Zhang, Y.; Zhang, W.; Lin, X. Distance-aware influence maximization in geo-social network. In Proceedings of the 32nd International Conference on Data Engineering, Helsinki, Finland, 16–20 May 2016. [Google Scholar]
- Leskovec, J.; Krause, A.; Guestrin, C.; Faloutsos, C.; VanBriesen, J.; Glance, N. Cost-effective outbreak detection in networks. In Proceedings of the 13th ACM SIGKDD International Conference on Knowledge Discovery and Data Mining, San Jose, CA, USA, 12–15 August 2007; pp. 420–429. [Google Scholar]
- Ahmad, T.; Li, X.J.; Seet, B.C.; Cano, J.C. Social Network Analysis Based Localization Technique with Clustered Closeness Centrality for 3D Wireless Sensor Networks. Electronics 2020, 9, 738. [Google Scholar] [CrossRef]
- Yuan, Q.; Cong, G.; Sun, A. Graph-based point-of-interest recommendation with geographical and temporal influences. In Proceedings of the 23rd ACM International Conference on Conference on Information and Knowledge Management, Shanghai, China, 3–7 November 2014; pp. 659–668. [Google Scholar]
- Levandoski, J.J.; Sarwat, M.; Eldawy, A.; Mokbel, M.F. Lars: A location-aware recommender system. In Proceedings of the 2012 IEEE 28th International Conference on Data Engineering, Washington, DC, USA, 1–5 April 2012; pp. 450–461. [Google Scholar]
- Berjani, B.; Strufe, T. A recommendation system for spots in location-based online social networks. In Proceedings of the 4th Workshop on Social Network Systems, Salzburg, Austria, 10 April 2011; p. 4. [Google Scholar]
- Zheng, V.W.; Zheng, Y.; Xie, X.; Yang, Q. Collaborative location and activity recommendations with GPS history data. In Proceedings of the 19th International Conference on World Wide Web, Raleigh, NC, USA, 26–30 April 2010; pp. 1029–1038. [Google Scholar]
- Ye, M.; Yin, P.; Lee, W.C. Location recommendation for location-based social networks. In Proceedings of the 18th SIGSPATIAL International Conference on Advances in Geographic Information Systems, San Jose, CA, USA, 2–5 November 2010; pp. 458–461. [Google Scholar]
- Gao, H.; Tang, J.; Hu, X.; Liu, H. Content-Aware Point of Interest Recommendation on Location-Based Social Networks. In Proceedings of the AAAI Conference on Artificial Intelligence, Austin, TX, USA, 25–30 January 2015; pp. 1721–1727. [Google Scholar]
- Zhang, J.D.; Chow, C.Y. Point-of-interest recommendations in location-based social networks. SIGSPATIAL Spec. 2016, 7, 26–33. [Google Scholar] [CrossRef]
- Leskovec, J.; Krevl, A. SNAP Datasets: Stanford Large Network Dataset Collection. 2014, p. 49. Available online: http://snap.stanford.edu/data (accessed on 10 December 2020).
- Wang, W.; Yin, H.; Chen, L.; Sun, Y.; Sadiq, S.; Zhou, X. Geo-SAGE: A geographical sparse additive generative model for spatial item recommendation. In Proceedings of the 21th ACM SIGKDD International Conference on Knowledge Discovery and Data Mining; ACM: New York, NY, USA, 2015; pp. 1255–1264. [Google Scholar]


| Datasets | #Vertices | #Edges | #Check-ins |
|---|---|---|---|
| Gowalla | 196,591 | 950,327 | 6.4 M |
| Brighkite | 58,228 | 214,078 | 4.49 M |
| Foursquare | 4163 | 32,512 | 483,813 |
Publisher’s Note: MDPI stays neutral with regard to jurisdictional claims in published maps and institutional affiliations. |
© 2021 by the authors. Licensee MDPI, Basel, Switzerland. This article is an open access article distributed under the terms and conditions of the Creative Commons Attribution (CC BY) license (http://creativecommons.org/licenses/by/4.0/).
Share and Cite
Ali, K.; Li, C.-T.; Chen, Y.-S. Joint Selection of Influential Users and Locations under Target Region in Location-Based Social Networks. Sensors 2021, 21, 709. https://doi.org/10.3390/s21030709
Ali K, Li C-T, Chen Y-S. Joint Selection of Influential Users and Locations under Target Region in Location-Based Social Networks. Sensors. 2021; 21(3):709. https://doi.org/10.3390/s21030709
Chicago/Turabian StyleAli, Khurshed, Cheng-Te Li, and Yi-Shin Chen. 2021. "Joint Selection of Influential Users and Locations under Target Region in Location-Based Social Networks" Sensors 21, no. 3: 709. https://doi.org/10.3390/s21030709
APA StyleAli, K., Li, C.-T., & Chen, Y.-S. (2021). Joint Selection of Influential Users and Locations under Target Region in Location-Based Social Networks. Sensors, 21(3), 709. https://doi.org/10.3390/s21030709