Abstract
We investigated the effect of enhancement of superconducting transition temperature by nonmagnetic atom disorder in the series of filled skutterudite-related compounds (LaSn, CaRhSn, YRhSn, LuRhSn; Co, Ru, Rh), where the atomic disorder is generated by various defects or doping. We have shown that the disorder on the coherence length scale in these nonmagnetic quasiskutterudite superconductors additionally generates a non-homogeneous, high-temperature superconducting phase with (dilute disorder scenario), while the strong fluctuations of stoichiometry due to increasing doping can rapidly increase the superconducting transition temperature of the sample even to the value of (dense disorder leading to strong inhomogeneity). This phenomenon seems to be characteristic of high-temperature superconductors and superconducting heavy fermions, and recently have received renewed attention. We experimentally documented the stronger lattice stiffening of the inhomogeneous superconducting phase in respect to the bulk one and proposed a model that explains the behavior in the series of nonmagnetic skutterudite-related compounds.
1. Introduction
The effect of atomic disorder on superconducting properties has been the cause of intense research, both experimental and theoretical, since the BCS theory [1] explained the mechanism of superconductivity. The earliest understanding was due to Anderson’s theory [2], which predicts a negligible effect of nonmagnetic impurities on the superconducting temperature , as long as the system remains a metal. At the other extreme, magnetic scatterers in a conventional isotropic superconductor suppress according to the Abrikosov–Gor’kov law [3] (see also [4]). Even a small amount of magnetic dopants can drastically reduce the critical temperature of the superconducting state [5,6]. However, later it was documented experimentally and by theory, that the Anderson theorem does not hold true in a strongly disordered nonmagnetic superconducting system. In iron-based superconductors, the nonmagnetic scatterers can also suppress at the same fast rate in a two-band state, and the scattering is purely interband in nature [7]. Therefore, observations of an enhancement of the superconducting transition temperature, when the amount of lattice disorder in the superconductor is increased, are particularly interesting. We know of rare examples of disorder-enhanced superconductivity, most of the known behavior of this type has been observed in strongly correlated superconductors (SCS), e.g., PrOsSb [8,9,10,11,12], CeIrIn [13], or CePtSi [14]. The investigations of the increase in of the disordered superconductors is, therefore, important not only for better understanding of the mechanism of superconductivity in the and SCS materials, but also for identifying the possible applications of these new superconductors. It is worth noting that there are also known examples of superconductivity enhancement due to disorder in high-temperature superconductors, e.g., in BiSrCaCuO [15,16].
Our present studies are focused on skutterudite-related superconductors for which we have documented a similar enhancement of caused by disorder. By varying the degree of disorder, we attempt to understand the role of various atomic defects and fluctuations in composition on the superconductivity of these materials. The cubic LaSn and CaRhSn, or tetragonal YRhSn and LuRhSn quasiskutterudites have been reported as s-wave BCS superconductors with atomic-scale disorder, which generates a novel superconducting state with critical temperature larger than of the bulk remaining phase. The aim of the current report is to summarize the knowledge about the superconductivity of the family of quasiskutterudites mentioned above on the basis of our results already published in Refs. [17,18,19,20,21,22], as well as theoretical modeling of the “high-temperature” superconductivity in the disordered phase. In order to supplement the literature data, we present here a microanalysis studies of these materials, and discuss the impact of the degree of disorder on the superconductivity of each system. The research was extended by investigations of the local inhomogeneities found in PrOsSb, and the impact of atomic disorder on the superconductivity of this unique Pr-based material. Based on the spectrum of literature data and our recent published results, we have proposed a phenomenological model that explains the relationships and due to the greater lattice stiffening of the disordered phase. Since the degree of the lattice stiffness is well expressed by the Grüneisen parameter, , we found of LaRhSn larger for its inhomogeneous high-temperature -phase with respect to the bulk -state (Section 4.3), which can explain the behavior.
We also discuss the known theoretical models describing the temperature dependencies of the upper critical fields , obtained experimentally for various skutterudite-related components of the series. Depending on the degree of disorder, we prove the correctness of the Werthamer–Helfand–Hohenberg theory or the percolation model, both of which are considered within the dirty limit of the BCS superconductor.
2. Experimental Details
The LaSn, CaRhSn, YRhSn, and LuRhSn samples were prepared by arc melting technique. The proper dilute alloys, e.g., LaRuCoSn, or YCaRhSn and others, were prepared by arc melting by diluting nominal compositions of the parent compounds. To ensure homogeneity, each sample was turned over and remelted several times, and annealed at 870 C for 2 weeks. Single crystals of PrOsSb were grown by the Sb flux method. All samples were examined by X-ray diffraction analysis and found to be single phase with cubic (LaSn, CaRhSn, space group P; PrOsSb, space group I), or tetragonal (YRhSn, LuRhSn, space group I) structure, respectively. Stoichiometry and homogeneity were checked by the electron microscope technique (scanning microscope JSM-5410). To obtain the surface images and structural properties of nanometer-size crystallites of YRhSn the transmission electron microscopy observations were obtained with a JEOL high-resolution JEM 3010 microscope (see Ref. [21]). Thermodynamical investigations (specific heat C, ac magnetic susceptibility , magnetization M) and resistivity were investigated using a Quantum Design (QD) Physical Properties Measurements System (PPMS) device and QD superconducting quantum interference device (SQUID) magnetometer.
3. The Meaning of Disorder in the System of Skutterudite-Related LaSn-Type Superconductors; Enhancing Superconductivity by Atomic Disorder
Investigations of atomic-scale disorder in the quasiskutterudite superconductors in the form of local defects and vacancies, granularity, and the effective increase of disorder by doping have received renewed attention particularly because of observations of enhancing superconductivity in these materials. This phenomenon is particularly interesting in a situation of dirty superconductors, where defects can disturb the pair-breaking strength, which usually leads to a decrease in . Our most recent studies focus on the family of nonmagnetic cage Remeika phases [23,24], which exhibit evidence of the impact of atomic defects both on their normal-state and enhancement of superconducting properties. An increase of a static disorder by the atomic defects as well as atomic displacements, evidenced in the series of Sn or isoelectronic RhSn superconductors ( Ca, Y, La, Lu), gives the basis for interpreting the increase in at the level of the dilute disorder case (cf. Ref. [25]). Doping at a low concentration level can also be considered as an elemental impurity effect. In the case of more inhomogeneous samples, fluctuations both in atomic disorder and composition are also possible and lead to a more significant increase in [25,26]. A special case could be a phase separation observed in YCaRhSn, where the end points: YRhSn and CaRhSn are not formed as isostructural compounds [21]. In this case, the main phase of (Y:Ca)RhSn-type is formed as a nontrivial structural deformation of the cubic minority phase (Ca:Y)RhSn [21,22]. Both phases have similar stoichiometry (i.e., 3:4:13 and 3.33:4:12, in effect of normalization of the number of Rh to 4 per each formula unit); therefore, one can consider them as the areas with strong stoichiometry fluctuations around the average composition. If the two-phase system YCaRhSn for can be approximated by strongly fluctuating inhomogeneities of the sample composition, then it is possible to explain a large difference in K on the basis of Gastiasoro and Andersen’s [25] theoretical model in approximation of the presence of strong fluctuations in the composition of the sample.
Figure 1 shows the evolution of the degree of disorder in the series of various skutterudite-related compounds. Panel (a) displays evidence of nanoscale inhomogeneity as a bulk property of PrOsSb single crystal over the length scale similar to the coherence length, which is a reason of appearance of the high temperature inhomogeneous superconducting phase with characteristic critical temperature K in the bulk superconducting state below K (cf. Refs. [8,9,10,11,12]). Panel (b) displays observations either of local atomic disorder and weak fluctuation in composition of LaRhSn within m volume fraction, while Figure 1c shows the observation of strong fluctuations in composition in the LaRuSn sample area of m. The lower panels compare the real () and imaginary () parts of ac mass magnetic susceptibility , and derivative , respectively, for single crystalline PrOsSb (d), LaRhSn (e), and LaRuSn (f). The double superconducting transitions in the good PrOsSb single crystal are divided into macroscopically segregated parts: one with distribution of and the second with a single superconducting transition at which is intrinsic—both transitions are sharp with K at the respective critical temperature. The CaRhSn [19] and LaCoSn [17] superconductors behave similarly, they exhibit sharp transitions at and ; however, , which suggests that these superconductors are homogeneous with possible nanoscale atomic disorder leading to nanoscale electronic inhomogeneity. However, the maximum value of derivative assigned to the distribution of the critical temperatures in LaRhSn (e) is broad with a half width at K, while that attributed to the transition at was observed to be much narrower ( K). The data presented in panel (f) show very broad transitions both at and of LaRuSn, which correlate with the documented strong atomic disorder and fluctuations in stoichiometry for this sample. The analogous behavior to that, shown in panels (c) and (f) was previously documented for a number of alloys, e.g., for the series of CaRhSn doped with La or Ce [20], LaRuSn doped with Co [18], or YRhSn doped with Ca [21], all systems are strongly disordered. It is worth noting, that the anomaly at marks the onset of an inhomogeneous superconducting phase with spatial distribution of the magnitude of the superconducting energy gaps. Following [17], a simple Gaussian gap distribution approximates, e.g., the specific heat data at , where and variance D of the distribution are treated as fitting parameters (see Figure 2). The maximum of the distribution also agrees with the T-dependence of and maxima in Figure 1e,f.
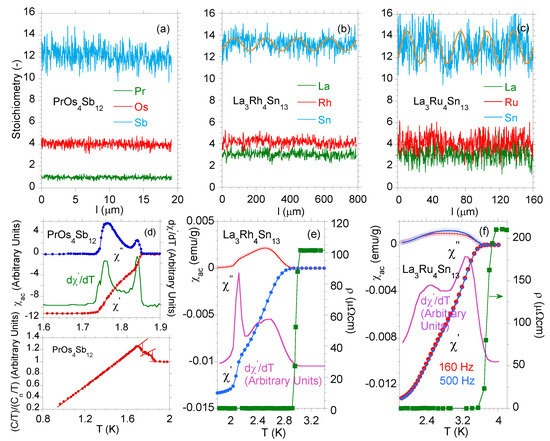
Figure 1.
Variation in stoichiometry over the length of the sample: (a) for PrOsSb, the correct stoichiometric ratio of Pr:Os:Sb from EDS analysis is 1.00:4.0:12.70, (b) for LaRhSn, the correct stoichiometric ratio of La:Rh:Sn is 3.12:4.0:12.98, (c) for LaRuSn, the correct stoichiometric ratio of La:Ru:Sn is 3.09:4.0:12.78. The yellow curve in panel (b,c) is a rough approximation of the fluctuations in Sn content around the mean Sn content by , where m for LaRhSn and m for LaRuSn. expresses a diameter of the extent of strong fluctuations in composition with an amplitude ( defines the maximum deviation in sample composition from average Sn content). In approximation of , the fluctuations in the composition of the sample disappear. Lower panels exhibit the low-temperature data () for PrOsSb (d), LaRhSn (e), and LaRuSn (f) (the data for PrOsSb are taken from Ref. [11]). Panel (d) also shows the specific heat of PrOsSb, normalized to the value of at K in the normal state of the sample. The reason for this is that the specific heat of various single crystals obtained from the same melting batch shows different values of C in the low T region due to different Sb contents in PrOsSb [12]. (d–f) The perfect diamagnetism of the full Meissner state with for mass density d is reached at the lowest temperatures. Panels (e,f) display the resistivity data (green filled squares) near .
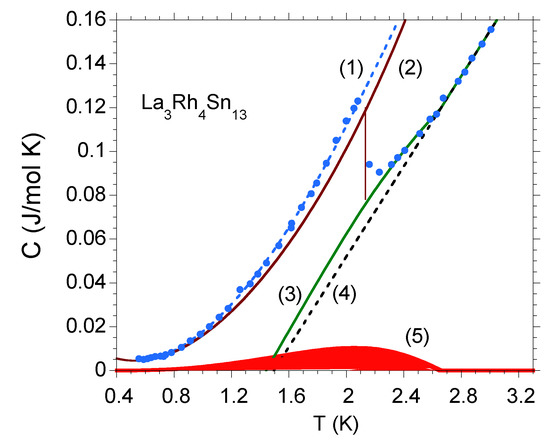
Figure 2.
Specific heat for LaRhSn was approximated using the atomic-scale disorder model. represents various contributions to , . The blue points are the C experimental data that are well fitted by the expression with the electronic specific heat coefficient mJ/mol K, lattice contribution with mJ/mol K, and energy gap K at . represents the best fit of the Gausian gap distribution with K and K. is the electronic contribution to the specific heat. The curve , (red line) was obtained after subtracting the inhomogeneous contribution from the experimental data.
In the case of strongly inhomogeneous superconductors, the mesoscopic size disorder can be a reason of large modulation of the superconducting gap, which, in consequence, leads to a large transition width to the superconducting state. In this case, both and show a weak and broad transition with the maximum in C or data at , which covers the transition at , and is well described by the function . For example, Figure 3a shows the anomalies in and data, seen over a wide temperature range below , where the critical temperature was obtained from the resistivity data. In such a strongly disturbed system [panel (a)], a type II metal–superconductor transition is broad and weakly visible, in contrast to that, measured for the LaCoSn BCS superconductor [as shown in panel (b)].
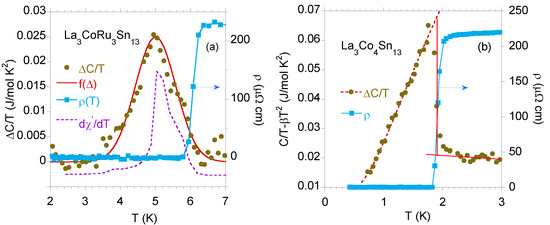
Figure 3.
(a) The temperature dependence of the specific heat of LaCoRuSn was well approximated by function with the following parameters: K and variance K, where . The derivative is also shown in arbitrary units. For comparison, panel (b) exhibits for LaCoSn subtracted by the phonon contribution , mJ/mol K. The data are well approximated by expression (red dotted line) with the fitting parameters 8 mJ/mol K and superconducting energy gap K. LaCoSn does not form the disordered phase. Both panels show the resistivity near the superconducting transition temperature. The critical temperature [in panel (a)] or (b) is defined as T at 50% of the normal-state value.
The diagram shown in Figure 4 clearly indicates the separated superconducting and phases for CaRhSn, when it is doped with La and Ce. An increase in atomic disorder due to increased doping enhances the separation of and , which is well reflected by the entropy isotherms shown in panels (b) and (d), respectively (for details see Ref. [20]). This is a rare example where atomic disorder as a result of doping, acting as perturbation of the lattice periodicity, enhances superconductivity. In this case, both pristine compounds crystallize in the same cubic structure P, thus the disorder can be treated here as a concentration variable x. At the concentration level , the increased doping is reflected by a smooth change in the lattice parameters and volume of the unit cell as a function of x [20]; hence, the doping can be considered as an elemental impurity effect, giving the basis for interpreting the increase in at each level of the disorder. Here, one should note, that in the case of the series of compounds with end-points, which are not formed as isostructural compounds, the systematic replacement of the atoms no longer simply reflects “disorder” as a variable dependent of the concentration x; this is the case for the YCaRhSn series (cf. [21]).
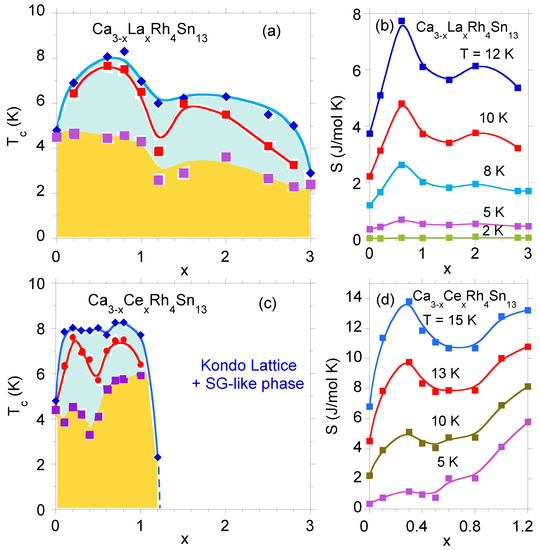
Figure 4.
phase diagram for CaLaRhSn (panel a) and CaCeRhSn (c). The blue color shows the area of the high phase, the blue line indicates the beginning of the transition from the normal to SC phase, while the red line shows the temperature of the maximum of the function. The yellow color shows the area of the bulk phase. Panels (b,d) show the entropy isotherms as a function of x for CaLaRhSn and CaCeRhSn, respectively.
Finally, we want to explain why for some skutterudites and quasiskutterudites, the literature data refer to different values of , e.g., recent results revealed an intrinsic superconducting transition at 3.8 K [27] for LaRhSn, or 8.4 K for CaRhSn [28] (both samples were obtained as single crystals) instead of 2.28 K [17] or 4.8 K [19] obtained for respective polycrystalline samples. It was reported for CaRhSn [28,29], that antisite defects Ca-Sn1 generated at high temperatures in the melting process and then frozen-in by quenching to room temperature are responsible for the strong lowering of and reduction in the unit cell volume of this superconductor. Following this, the value of K for a polycrystalline CaRhSn sample rapidly quenched during the arc melting process can be expected, as was discussed in details in Ref. [19]. This change in can also be explained by simple phenomenology, when considering CaRhSn under different heat treatments, a linear relationship was observed between its critical temperature and the lattice volume. Our previous ab initio calculations documented a linear decrease of DOS for CaRhSn at with decreasing sample volume, as a result of rapid quenching. The calculated change of DOS is a reason for the decrease in and quantitatively determines the reduction of K of a single crystalline sample to the value ∼4.8 K for the polycrystalline one. This behavior follows from the BCS equation [1]
where is the DOS at the Fermi energy in states per eV and per spin and is an average of the square of the phonon frequency (), and the expression [30]
Parameter is the Coulomb pseudopotential of Morel and Anderson [31],
and electron–phonon coupling parameter [32,33]
is the square of the electronic matrix element of electron–phonon interactions averaged over the Fermi surface, is the electronic bandwidth, and is the maximum phonon frequency (), and is the Debye temperature. A similar mechanism can explain variations in reported in the literature data for LaRhSn and other superconducting quasiskutterudites (note, we also obtained the single crystals of LaRhSn with K and K by the flax method).
4. Superconductivity in the Presence of Atomic Disorder; Dirty Limit
4.1. The Temperature Dependence of the Critical Field —Modeling on the Base of the Werthamer-Helfand-Hohenberg Theory
The upper critical field in a dirty superconductor with a mean free path that can be explained by the Werthamer–Helfand–Hohenberg (WHH) [34,35,36] or Maki-de Gennes [37,38,39] theories. This theoretical model predicts a linear change of with T near the critical temperature , and
The WHH formula [Equation (5)] for a type-II dirty one-gap superconductor allows for the zero temperature upper critical field to be estimated, while the curve in the whole superconducting range can be calculated using the di–gamma function , as was proposed by Werthamer et al. [34] [see also Equations (6) and (7)]. The issue is more complicated in the case of the multiband model. For a two-band dirty superconductor, can be calculated from the theory of Gurevich [40], which is obtained adapting the Eilenberger and Usadel equations to the case of a two-band dirty superconductor,
where , is the di–gamma function, , h is reduced magnetic field defined as , is the band diffusivity, . The parameters are expressed by the intra- and interband BCS superconducting coupling constants and , respectively. In the case of a one-band model, Equation (6) reduces to the standard Maki-de Gennes equation for
For most of the investigated skutterudite-related compounds, the and parameters determined in the framework of Ginzburg–Landau–Abricosov–Gorkov theory of the type-II superconductors [35,41] obey the relation and a one-band WHH theoretical model usually fits the data on the diagram well, as is shown for CaRhSn ( T) and LuRhSn ( T) in Figure 5. The respective values of at used for fitting the WHH are listed in Table 1. However, there are known exceptions when can be affected by the presence of two bands, this is a case of YRhSn. As can be seen in Figure 5, the one-gap WHH model failed to describe its dependence. The multi-band WHH model also effectively describes the upper critical field in the H-T diagram for CaRhSn alloys, when CaRhSn is doped with La or Ce (as shown in Figure 7 in Ref. [20]), which results in their more complicated electronic structure with calculated various electronic states of La/Ce dopants, located near the Fermi level . In the presence of lattice disorder and the effect of breaking the lattice periodicity due to doping, an alternative for describing the behaviors of these alloys could be the percolation model, which also effectively describes the upper critical field of the components x of CaRhSn (will be discussed in the next section).
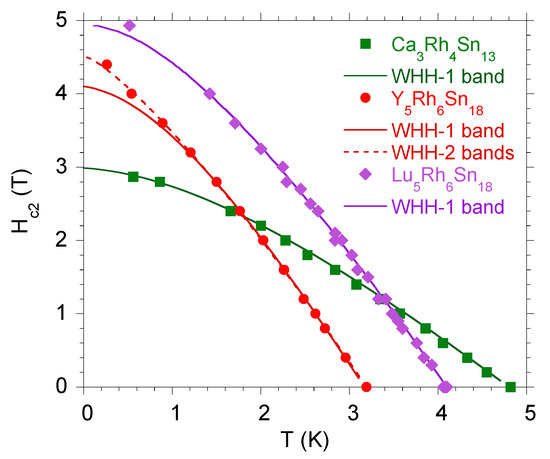
Figure 5.
The upper critical field in the plane for CaRhSn, YRhSn, and LuRhSn approximated by the one-band (solid line) and two-band (dotted line) Werthamer–Helfand–Hohenberg (WHH) model.

Table 1.
The parameters characterizing the superconducting samples. The electronic specific heat is obtained in the normal state () from a linear dependence vs. at , , and N is the number of atoms in a formula unit. The electron–phonon coupling parameters and characterize the and phases, respectively. The transition temperature ( for LaCoSn) is defined as T at 50% of the normal-state value. In the brackets the s characterizing the maxima of the f() function are shown. The final column shows the value of at (in the brackets are the respective data for the inhomogeneous phase ).
4.2. within the Percolation Modeling for Strongly Inhomogeneous Superconductors; the Case of LaRhSn
The WHH theory, even in the multi-band version, can be insufficient to explain the temperature dependence of the upper critical filed. It is based on a dirty-limit approximation and may need to be complemented by taking into account the effect of the disorder-induced inhomogeneous carrier distribution. The carrier concentration in these systems is a few orders of magnitude smaller than the typical values for metals [21,42]. Thus, weaker screening of charged impurities can lead to fluctuations of the local chemical potential and induce spatial fluctuations of the superconducting order parameter [43]. As a result, regions of space where the amplitude of is large are surrounded by regions with relatively small . For weak disorder, increasing the temperature or magnetic field suppresses superconductivity in a BCS-like manner in the entire sample, whereas stronger disorder can lead to superconducting “islands” embedded in normal or even insulating regions. Different superconducting regions usually have different local critical temperatures (this is well documented for the series of CaLaRhSn and CaCeRhSn compounds, as shown in Figure 4) and the macroscopic critical temperature depends not only on microscopic superconducting properties of pure materials, but also on the topology of the grain system. The superconducting transition occurs when a percolation path is formed across the system.
Below, we propose a simple model that is able to reproduce the temperature dependence of in LaRhSn and other similar systems, where the single-band WHH theory cannot explain the experimental data. By adjusting model parameters, the model can describe a general positive curvature of .
We assume that the inhomogeneous system can be described by the random resistor network (RRN) model [44,45]. The RRN model uses the percolation theory for the hopping conductivity that is based on the notion that the transport equations can be cast into the form of an equivalent RRN. When the temperature approaches the critical value (from above) in a inhomogeneous superconductor, more and more superconducting regions are formed. In the RNN model, it is translated into an increasing number of resistors with zero resistivity. As long as the zero resistivity elements do not form a continuous path across the system, the sample remains in the normal state, but possibly with decreasing resistivity. By calculating the resistance of the RNN, the normal–state transport properties can be determined. However, in the case of LaRhSn, the normal–state resistivity does not change significantly when temperature approaches , as shown in Figure 6.
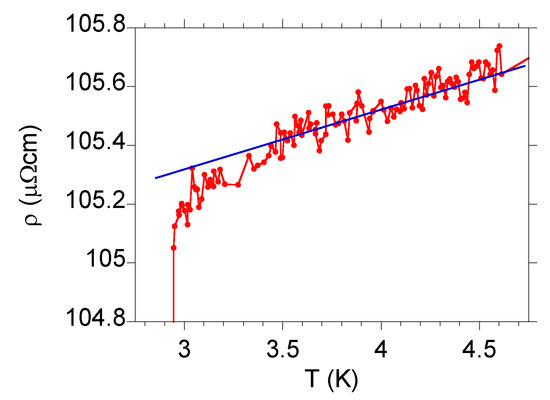
Figure 6.
Resistivity of LaRhSn near the superconducting transition. The blue solid line indicates a linear decrease of when the temperature decreases. Note, that close to , the resistivity decreases faster than linearly, which may indicate formation of disconnected superconducting regions. These give the superconducting transition a percolation path upon forming.
This means that in the corresponding RNN model, the resistance of non-superconducting resistors should be large independently of how far the temperature is from . Therefore, and because we are not interested in the normal state properties, we simply assume that every resistor is in one of two possible states: perfectly conducting or perfectly insulating. Since the resistors represent mesoscopic regions, their state (superconducting or insulating) depends on the temperature and magnetic field. The inhomogeneity of the system leads to variation of the properties of different regions so that we can assign them to be different local critical temperature . We also assume that within a single mesoscopic region, the single-band WHH theory can be applied. Therefore, we can also introduce local upper critical field given by the solution of Equation (7). The local critical temperature is continuously spread over some range, but for the sake of clarity, let us define only three characteristic local critical temperatures and () and three corresponding zero temperature values of : and . is defined as the temperature at which the superconducting regions characterized by the upper critical field form a percolation path across the sample. We assume a linear dependence between and , , where . This simple form turns out to give a perfect agreement of model predictions with experimental data for LaRhSn. Different mesoscopic regions may differ in composition, which means that the relation between their parameters can be inferred from the relation between macroscopic values of and for systems with different amounts of doping. Such results for Ca-doped LaRhSn can be seen in Figure 7.
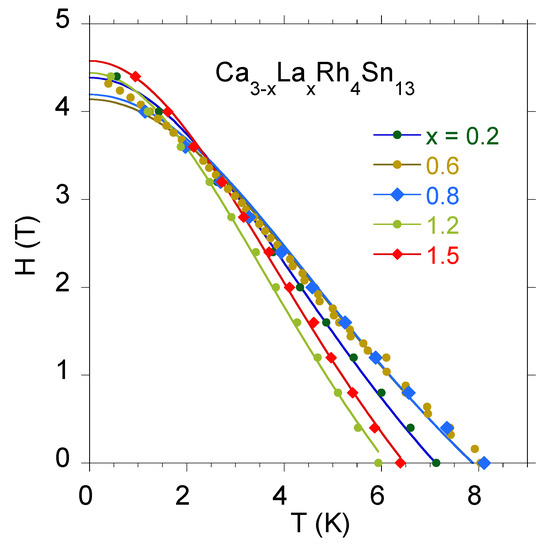
Figure 7.
Temperature dependence of the upper critical field for doped LaRhSn. Note the negative correlation between and . The continuous lines show the best fit of Ginzburg–Landau theory to experimental data, .
This behavior is not very uncommon, e.g., similar dependence for nanoscale-SiC doping of MgB has been reported [46]. The negative correlation between disorder-induced changes of and has also been demonstrated within the Ginzburg–Landau theory [47]. Foremost, the sign of the correlation is demonstrated by a direct comparison of the predictions of the model with our data for LaRhSn.
Figure 8 demonstrates the process of activating different percolation paths when the temperature is decreasing. The resulting temperature dependence of is shown in in Figure 9. The inset shows the corresponding circuit diagram that explains the electric transport measurements.
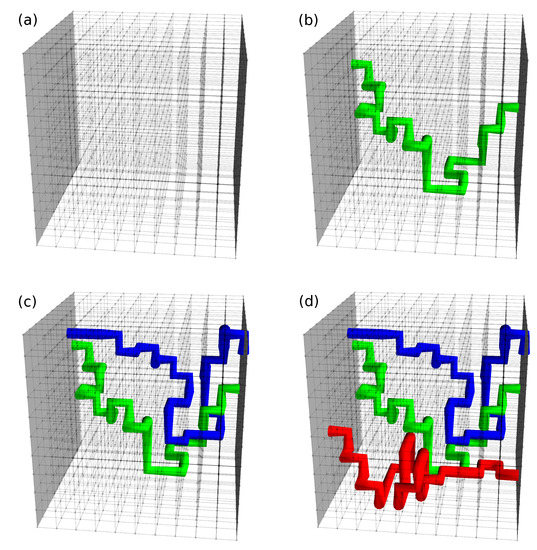
Figure 8.
Illustration of percolation path formation when temperature T is decreasing, (a), (b), (c), and (d). The green, blue, and red lines represent connected superconducting regions characterized by parameters , and , respectively.
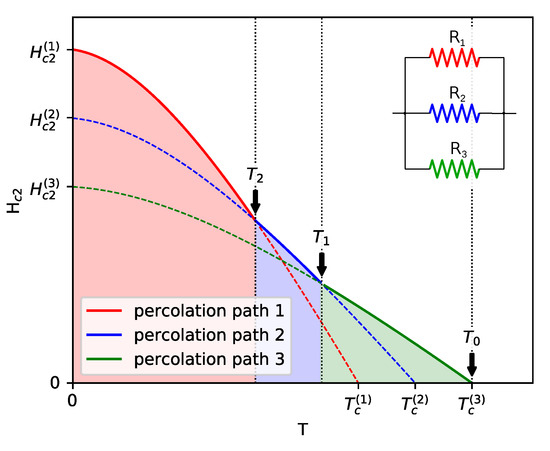
Figure 9.
Phase diagram in the plane obtained for the model described in the text. The dashed lines represent solutions of the WHH equations, the solid sections show the macroscopic upper critical field, i.e., the field below which there exists at least one percolation path across the sample. The inset shows an equivalent circuit diagram, where resistance is zero for a field smaller than the corresponding solution of the WHH equation [] and infinity otherwise. The green area is a region where only , whereas and remain finite, which corresponds to the situation depicted in Figure 8b. In the entire blue area , but below the green dashed line, . However, since for temperatures between and we have , the upper critical field in this temperature range is determined by resistance . Similarly, in the entire red area , whereas and vanish for and , respectively, i.e., below the blue and green dashed lines.
For temperatures above , superconducting regions can exist in the sample, but they are separated and electrical measurements show finite resistance. This situation is depicted in Figure 8a. In the circuit diagram, resistors , , and have infinite values.
At , regions with the zero temperature upper critical field connect to form a percolation path, shown by the green line in Figure 8b. Resistances and remain infinite, but is given by
where is the solution of Equation (7) for , shown by the solid green line in Figure 9. When the temperature reaches at zero field, a new percolation path is formed by connecting regions characterized by , as shown by the blue line in Figure 8c. At finite but weak magnetic field H, both percolation paths exist, with given by
However, in this temperature range and with increasing magnetic field, the “blue” path is destroyed as the first one, so the upper critical field is determined entirely by . As shown in Figure 9, such a situation holds up to , above which and the actual is defined by . Below the third percolation path, shown by the red line in Figure 8d, is formed by connecting regions with and the resistance drops to zero for . Then, when the temperature crosses , becomes the upper critical field for the entire sample.
It is reasonable to assume that in real systems, the temperatures at which different percolation paths are formed has a continuous distribution. Therefore, in order to compare the model with experimental data for LaRhSn, we assumed 10 values of uniformly distributed between some limiting values and . The values of corresponding have been calculated as with parameters a and b have been determined by fitting to the experimental data.
Figure 10 shows a comparison of the upper critical field obtained within the framework of the proposed above model and experimental data for LaRhSn.
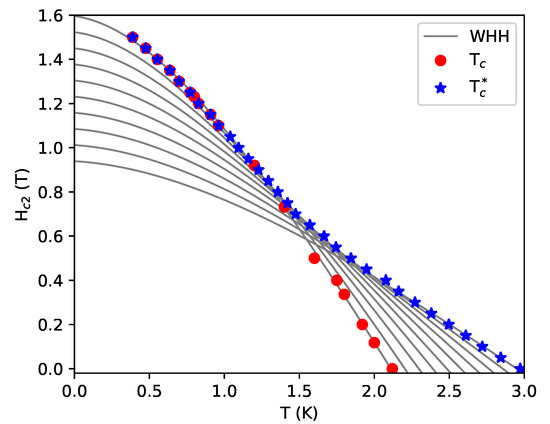
Figure 10.
The upper critical field for LaRhSn compared with results from the percolation model. The blue stars represent resistivity measurements ( and the red circles were determined from heat capacity measurements. The gray lines show WHH solutions under the assumption that , with . Parameters a and b were fitted to reproduce the resistive superconducting transition.
The transition observed in resistivity ( is marked by blue stars and the one observed in the heat capacity ( by red circles. Since percolation is related to electronic transport throughout the sample, the model parameters a and b were fitted to the observed resistive superconducting transition. One can observe almost perfect agreement. There is still, however, the question about the discrepancy between and . It can be understood if one assumes that the percolation paths are narrow, quasi-one-dimensional objects. In this case, pairing is not affected by the orbital effects of magnetic field and for , this kind of superconductivity can survive up to higher temperatures () than bulk superconductivity. However, since the superconducting fraction of the volume of the sample is very small, transition to this state is not observed in the heat capacity nor in magnetic susceptibility measurements. At lower temperatures, pairing is strong enough to repel the magnetic field and a transition to bulk superconductivity is observed at .
The percolation model almost perfectly reproduces the temperature dependence of for LaRhSn. This suggests that in this compound, the disorder scattering needs to be accompanied by the effect of spatial carrier fluctuations to properly describe the unconventional shape of the critical field. It explains why the WHH theory alone is not sufficient to describe the magnetic properties of this system.
4.3. Phenomenology
The investigations under external pressure are very useful for modeling the mechanism of superconductivity, especially in strongly disordered materials. Most of the known superconductors exhibit a decrease in with an increase in the applied pressure. At the same time, the increase in pressure stabilizes the structural properties of the disordered system by mitigating in part the inhomogeneity of the sample, in consequence is expected to also decrease with pressure (see Figure 11). The evidence of this is shown in Refs. [18,19,20,21]. Simultaneously, we documented experimentally, that the pressure coefficients are observed as being larger than those of (cf. Figure 11), which can be explained on the basis of the Eliashberg theory of strong-coupling superconductivity.
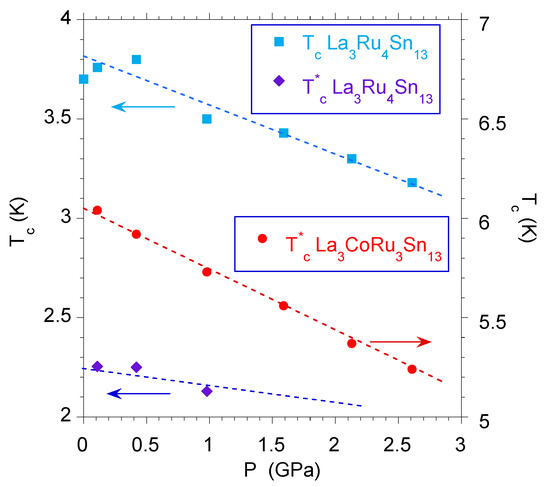
Figure 11.
Critical temperatures and vs. P for LaRuSn. The derivatives equal K/GPa and K/GPa, respectively. The critical temperatures were obtained from the resistivity under applied pressure at 50% of the normal state value. For comparison, the vs. P data are also shown for the doped LaRuCoSn sample ( K/GPa). The vs. P data were taken from Ref. [18].
Namely, for all known quasiscutterudite compounds, the electron–phonon coupling parameter obtained for the inhomogeneous superconducting phase is in each case larger than of the respective bulk superconucting state (cf. Table 1). In Equation (4) and are weakly pressure-dependent (see [21]); therefore, the comes from and , while the P-dependence of the Debye temperature is defined by the Grüneisen parameter , which provides information about the lattice stiffening. Our previous data suggest a larger for the disordered superconducting phase with respect to the one. To calculate s and s, as listed in Table 1, we used the expression
by combining Equations (2) and (3), where , and eV is a calculated conduction band width. Equation (1) allows for the calculation of the experimental value of and [] for the and phases, respectively, while Equation (10) gives the -dependent variable . This self-consistent procedure allowed for the calculation of the s listed in Table 1 for the best agreement between calculated and experimentally obtained .
It is worth noting that the following relationship is always true—. In the case of strongly disordered LaRuSn, or LaRuCoSn and the CaRuSn doped superconductors, was the largest value obtained. We, therefore, analyzed the Grüneisen parameter for LaRuSn, which represents the series of strongly disordered superconducting quasiskutterudites listed in Table 1, to confirm the hypothesis about different lattice stiffening of the and superconducting phases. For calculations, we used the expression [30,48]
For LaRuSn and from the McMillan relationship
Then, the expression (11) gives and , for and phases, respectively. The relation also explains the experimental observations measured for all superconductors listed in Table 1. One can generalize that the relationship between and can be extended for all disordered skutterudite-related superconductors (see, e.g., YRhSn doped with Ca [21]) and the filled skutterudite PrOsSb superconductor [49]. Here, one can note one of the most interesting results for the single crystal of PrOsSb, namely the observation of two various superconducting transitions at and , and the measured value of , which is % larger than [49].
5. Conclusions
We point out the unique behavior observed for the skutterudite-related compounds whereby lattice disorder enhances the superconducting transition temperature to , where . It has been shown that their superconducting transition temperature depends on the degree of atomic disorder in the system, and that increases with random disorder. The reasons for the observed behavior are both the atomic disorder on the nanoscale and the fluctuations in composition in the m area of the sample, the last one caused a significant increase in . In both cases, the observed phenomenon can be qualitatively described by the Gastiasoro and Andersen [25] theoretical approach. In a series of our previous reports, we proposed a phenomenological model to explain the increase in by the different stiffness of the bulk and the inhomogeneous high-temperature superconducting phases. From BCS theory, the critical temperature first of all depends on the value of and , while the pressure dependence of giving the Grüneisen parameter , defines the lattice stiffening. Our data obtained for various quasiskutterudite samples suggest a larger for the inhomogeneous superconducting phase with respect to the bulk effect below (cf. Ref. [21]). LaRuSn is a good sample for such investigations, because of the presence of two, well separated and superconducting states. The experimental data combined with the DFT results allowed for the Grüneisen parameter to be calculated for both its superconducting states and found the relation between them, which well supports the hypothesis of the stiffening effect on the increase of .
Author Contributions
Conceptualization, A.Ś. and M.M.M.; methodology, A.Ś. and M.M.M.; software, A.Ś. and M.M.M.; validation, A.Ś. and M.M.M.; formal analysis, A.Ś. and M.M.M.; investigation, A.Ś.; resources, A.Ś.; data curation, A.Ś.; writing—original draft preparation, A.Ś.; writing—review and editing, A.Ś. and M.M.M.; visualization, A.Ś.; supervision, A.Ś.; project administration, A.Ś.; funding acquisition, A.Ś. and M.M.M. All authors have read and agreed to the published version of the manuscript.
Funding
M.M.M. acknowledges support by the National Science Centre (Poland) under grant DEC-2018/29/B/ST3/01892.
Conflicts of Interest
The authors declare no conflict of interest.
References
- Bardeen, J.; Cooper, L.N.; Schrieffer, J.R. Theory of Superconductivity. Phys. Rev. 1957, 108, 1175–1204. [Google Scholar] [CrossRef]
- Anderson, P.W. Theory of dirty superconductors. J. Phys. Chem. Solids 1959, 11, 26–30. [Google Scholar] [CrossRef]
- Abrikosov, A.A.; Gor’kov, L.P. Contribution to the theory of superconducting alloys with paramagnetic impurities. Sov. Phys. JETP 1961, 12, 1243–1263. [Google Scholar]
- Kim, Y.-J.; Overhauser, A.W. Theory of impure superconductors: Anderson versus Abrikosov and Gor’kov. Phys. Rev. B 1993, 47, 8025–8029. [Google Scholar] [CrossRef] [PubMed]
- Matthias, B.T.; Suhl, H.; Corenzwit, E. Spin Exchange in Superconductors. Phys. Rev. Lett. 1958, 1, 92–94. [Google Scholar] [CrossRef]
- Suhl, H.; Matthias, B.T. Impurity Scattering in Superconductors. Phys. Rev. 1959, 114, 977–988. [Google Scholar] [CrossRef]
- Hirschfeld, P.J.; Korshunov, M.M.; Mazin, I.I. Gap symmetry and structure of Fe-based superconductors. Rep. Prog. Phys. 2011, 74, 124508. [Google Scholar] [CrossRef]
- Maple, M.B.; Ho, P.-C.; Zapf, V.S.; Frederick, N.A.; Bauer, E.D.; Yuhasz, W.M.; Woodward, F.M.; Lynn, J.W. Heavy Fermion Superconductivity in the Filled Skutterudite Compound PrOs4Sb12. J. Phys. Soc. Jpn. Suppl. 2002, 71, 23–28. [Google Scholar] [CrossRef]
- Vollmer, R.; Faißt, A.; Pfleiderer, C.; Löhneysen, H.V.; Bauer, E.D.; Ho, P.-C.; Zapf, V.; Maple, M.B. Low-Temperature Specific Heat of the Heavy-Fermion Superconductor PrOs4Sb12. Phys. Rev. Lett. 2003, 90, 057001. [Google Scholar] [CrossRef]
- Seyfarth, G.; Brison, J.P.; Méasson, M.-A.; Braithwaite, D.; Lapertot, G.; Flouquet, J. Superconducting PrOs4Sb12: A Thermal Conductivity Study. Phys. Rev. Lett. 2006, 97, 236403. [Google Scholar] [CrossRef]
- McBriarty, M.E.; Kumar, P.; Stewart, G.R.; Andraka, B. Superconductivity and disorder in PrOs4Sb12. J. Phys. Condens. Matter 2009, 21, 385701. [Google Scholar] [CrossRef]
- Méasson, M.-A.; Braithwaite, D.; Lapertot, G.; Brison, J.-P.; Flouquet, J.; Bordet, P.; Sugawara, H.; Canfield, P.C. Double superconducting transition in the filled skutterudite PrOs4Sb12 and sample characterization. Phys. Rev. B 2008, 77, 134517. [Google Scholar] [CrossRef]
- Bianchi, A.; Movshovich, R.; Jaime, M.; Thompson, J.D.; Pagliuso, P.G.; Sarrao, J.L. Origin of the zero-resistance anomaly in heavy fermion superconducting CeIrIn5: A clue from magnetic-field and Rh-doping studies. Phys. Rev. B 2001, 64, 220504(R). [Google Scholar] [CrossRef]
- Kim, J.S.; Mixson, D.J.; Burnetta, D.J.; Jones, T.; Kumar, P.; Andraka, B.; Stewart, G.R.; Craciun, V.; Acree, W.; Yuan, H.Q.; et al. Spurious second transition in the heavy-fermion superconductor CePt3Si. Phys. Rev. B 2005, 71, 212505. [Google Scholar] [CrossRef]
- Cren, T.; Roditchev, D.; Sacks, W.; Klein, J.; Moussy, J.-B.; Deville-Cavellin, C.; Laguës, M. Influence of Disorder on the Local Density of States in High-Tc Superconducting Thin Films. Phys. Rev. Lett. 2000, 84, 147–150. [Google Scholar] [CrossRef]
- Andersen, B.M.; Melikyan, A.; Nunner, T.S.; Hirschfeld, P.J. Thermodynamic transitions in inhomogeneous d-wave superconductors. Phys. Rev. B 2006, 74. [Google Scholar] [CrossRef]
- Ślebarski, A.; Fijałkowski, M.; Maśka, M.M.; Mierzejewski, M.; White, B.D.; Maple, M.B. Superconductivity of La3Co4Sn13 and La3Rh4Sn13: A comparative study. Phys. Rev. B 2014, 89, 125111. [Google Scholar] [CrossRef]
- Ślebarski, A.; Maśka, M.M.; Fijałkowski, M.; McElroy, C.A.; Maple, M.B. Superconductivity in the presence of disorder in skutterudite-related La3Co4Sn13 and La3Ru4Sn13 compounds: Electrical transport and magnetic studies. J. Alloys Compd. 2015, 646, 866–872. [Google Scholar] [CrossRef]
- Ślebarski, A.; Goraus, J.; Maśka, M.M.; Witas, P.; Fijałkowski, M.; Wolowiec, C.T.; Fang, Y.; Maple, M.B. Effect od atomic disorder and Ce doping on superconductivity of Ca3Rh4Sn13: Electric transport properties under high pressure. Phys. Rev. B 2016, 93, 245126. [Google Scholar] [CrossRef]
- Ślebarski, A.; Zajdel, P.; Fijałkowski, M.; Maśka, M.M.; Witas, P.; Goraus, J.; Fang, Y.; Arnold, D.C.; Maple, M.B. The effective increase in atomic scale disorder by doping and superconductivity in Ca3Rh4Sn13. New J. Phys. 2018, 20, 103020. [Google Scholar] [CrossRef]
- Ślebarski, A.; Fijałkowski, M.; Zajdel, P.; Maśka, M.M.; Deniszczyk, J.; Zubko, M.; Pavlosiuk, O.; Sasmal, K.; Maple, M.B. Enhancing superconductivity of Y5Rh6Sn18 by atomic disorder. Phys. Rev. B 2020, 102, 054514. [Google Scholar] [CrossRef]
- Ślebarski, A.; Zajdel, P.; Maśka, M.M.; Deniszczyk, J.; Fijałkowski, M. Superconductivity of Y5Rh6Sn18; Coexistence of the high temperature thermal lattice relaxation process and superconductivity. J. Alloys Compd. 2020, 819, 152959. [Google Scholar] [CrossRef]
- Remeika, J.P.; Espinosa, G.P.; Cooper, A.S.; Barz, H.; Rowel, J.M.; McWhan, D.B.; Vandenberg, J.M.; Moncton, D.E.; Fizk, Z.; Woolf, L.D.; et al. A new family of ternary intermetallic superconducting/magnetic stannides. Sol. State Commun. 1980, 34, 923–926. [Google Scholar] [CrossRef]
- Hodeau, J.L.; Marezio, M.; Remeika, J.P.; Chen, C.H. Structural distortion in the primitive cubic phase of the superconducting/magnetic ternary rare-earth rhodium stannides. Sol. State Commun. 1982, 42, 97–102. [Google Scholar] [CrossRef]
- Gastiasoro, M.N.; Andersen, B.M. Enhancing superconductivity by disorder. Phys. Rev. B 2018, 98, 184510. [Google Scholar] [CrossRef]
- Maśka, M.M.; Śledź, Ż.; Czajka, K.; Mierzejewski, M. Inhomogeneity-Induced Enhancement of the Pairing Interaction in Cuprate Superconductors. Phys. Rev. Lett. 2007, 99, 147006. [Google Scholar] [CrossRef]
- Köhler, U.; Pikul, A.P.; Oeschler, N.; Westerkamp, T.; Strydom, A.M.; Steglich, F. Low-temperature study of the strongly correlated compound Ce3Rh4Sn13. J. Phys. Condens. Matter. 2007, 19, 386207. [Google Scholar] [CrossRef]
- Westerveld, J.P.A.; Casio, D.M.R.L.; Bakker, H. Arrhenius behaviour of the degradation of the transition temperature in the ternary superconductors Yb3Rh4Sn13 and Ca3Rh4Sn13. J. Phys. F Met. Phys. 1987, 17, 1963–1971. [Google Scholar] [CrossRef]
- Westerveld, J.P.A.; Casio, D.M.R.L.; Bakker, H.; Loopstra, B.O.; Goubitz, K. Atomic disorder and superconductivity in Ca3Rh4Sn13. J. Phys. Condens. Matter. 1989, 1, 5689–5702. [Google Scholar] [CrossRef]
- Seiden, P.E. Pressure Dependence of the Superconducting Transition Temperature. Phys. Rev. 1969, 179, 458–462. [Google Scholar] [CrossRef]
- Morel, P.; Anderson, P.W. Calculation of the Superconducting State Parameters with Retarded Electron-Phonon Interaction. Phys. Rev. 1962, 125, 1263–1271. [Google Scholar] [CrossRef]
- McMillan, W.L. Transition Temperature of Strong-Coupled Superconductors. Phys. Rev. 1968, 167, 331–344. [Google Scholar] [CrossRef]
- Hopfield, J.J. Angular Momentum and Transition-Metal Superconductivity. Phys. Rev. 1969, 186, 443–451. [Google Scholar] [CrossRef]
- Werthamer, N.R.; Helfand, E.; Hohenberg, P.C. Temperature and Purity Dependence of the Superconducting Critical Field, Hc2. III. Electron Spin and Spin-Orbit Effects Phys. Rev. 1966, 147, 295–302. [Google Scholar]
- Helfand, E.; Werthamer, N.R. Temperature and Purity Dependence of the Superconducting Critical Field, Hc2. Phys. Rev. Lett. 1964, 13, 686–688. [Google Scholar] [CrossRef]
- Helfand, E.; Werthamer, N.R. Temperature and Purity Dependence of the Superconducting Critical Field, Hc2. II. Phys. Rev. 1966, 147, 288–294. [Google Scholar] [CrossRef]
- de Gennes, P.G. Behavior of dirty superconductors in high magnetic fields. Phys. Kondens. Mater. 1964, 3, 79–90. [Google Scholar] [CrossRef]
- Maki, K. The magnetic properties of superconducting alloys I. Physics 1964, 1, 21–30. [Google Scholar] [CrossRef]
- DeGennes, P.G. Superconductivity in Metals and Alloys; Benjamin: New York, NY, USA, 1966. [Google Scholar]
- Gurevich, A. Enhancement of the upper critical field by nonmagnetic impurities in dirty two-gap superconductors. Phys. Rev. B 2003, 67, 184515. [Google Scholar] [CrossRef]
- Orlando, T.P.; McNiff, E.J., Jr.; Foner, S.; Beasley, M.R. Critical fields, Pauli paramagnetic limiting, and material parameters of Nb3Sn and V3Si. Phys. Rev. B 1979, 19, 4545–4561. [Google Scholar] [CrossRef]
- Palenskis, V. Drift Mobility, Diffusion Coefficient of Randomly Moving Charge Carriers in Metals and Other Materials with Degenerated Electron Gas. World J. Condens. Matter Phys. 2013, 3, 73–81. [Google Scholar] [CrossRef]
- Ma, M.; Lee, P.A. Localized superconductors. Phys. Rev. B 1985, 32, 5658–5667. [Google Scholar] [CrossRef] [PubMed]
- Zeimetz, B.; Glowacki, B.; Evetts, J. Application of percolation theory to current transfer in granular superconductors. Eur. Phys. J. B 2002, 29, 359–367. [Google Scholar] [CrossRef][Green Version]
- Bucheli, D.; Caprara, S.; Castellani, C.; Grilli, M. Metal–superconductor transition in low-dimensional superconducting clusters embedded in two-dimensional electron systems. New J. Phys. 2013, 15, 023014. [Google Scholar] [CrossRef]
- Dou, S.X. Nanoscale-SiC doping for enhancing and Jc and Hc2 in superconducting MgB2. J. Appl. Phys. 2004, 96, 7549. [Google Scholar] [CrossRef]
- Gitterman, M.; Shapiro, I.; Shapiro, B.Y. Shift of the superconducting critical parameters due to correlated disorder. Physica C 2012, 472, 83–86. [Google Scholar] [CrossRef]
- Wejgaard, W. Effect of pressure on the superconducting transition temperature of iridium. Phys. Lett. A 1969, 29, 396–397. [Google Scholar] [CrossRef]
- Méasson, M.-A.; Braithwaite, D.; Salce, B.; Flouquet, J.; Lapertot, G.; Sugawara, H.; Sato, H.; Onuki, Y. Pressure dependence of the double superconducting transition of the filled skutterudite PrOs4Sb12. J. Magn. Magn. Mater. 2007, 310, 626–628. [Google Scholar] [CrossRef]


Publisher’s Note: MDPI stays neutral with regard to jurisdictional claims in published maps and institutional affiliations. |
© 2020 by the authors. Licensee MDPI, Basel, Switzerland. This article is an open access article distributed under the terms and conditions of the Creative Commons Attribution (CC BY) license (http://creativecommons.org/licenses/by/4.0/).