Article

Engineering of TeO2-ZnO-BaO-Based Glasses for Mid-Infrared Transmitting Optics

Intelligent Optical Module Research Center, Korea Photonics Technology Institute, Gwangju 61007, Korea
*
Authors to whom correspondence should be addressed.
Materials 2020, 13(24), 5829; https://doi.org/10.3390/ma13245829
Submission received: 10 November 2020 / Revised: 4 December 2020 / Accepted: 15 December 2020 / Published: 21 December 2020
(This article belongs to the Section Optical and Photonic Materials)

Abstract

:
In this paper, the glass systems, TeO2–ZnO–BaO (TZB), TeO2–ZnO–BaO–Nb2O5 (TZB–Nb) and TeO2–ZnO–BaO–MoO3 (TZB–Mo), were fabricated by the traditional melt-quench protocol for use as mid-infrared (mid-IR) transmitting optical material. The effect of Nb2O5 and MoO3 on the key glass material properties was studied through various techniques. From the Raman analysis, it was found that the structural modification was clear with the addition of both Nb2O5 and MoO3 in the TZB system. The transmittance of studied glasses was measured and found that the optical window covered a region from 0.4 to 6 μm. The larger linear refractive index was obtained for the Nb2O5-doped TZB glass system than that of other studied systems. High glass transition temperature, low thermo-mechanical coefficient and high Knoop hardness were noticed in the Nb2O5-doped TZB glass system due to the increase in cross-linking density and rigidity in the tellurite network. The results suggest that the Nb2O5-doped TZB optical glasses could be a promising material for mid-infrared transmitting optics.

1. Introduction

In recent years, interest on infrared optical systems has been increased because of their extensive usage in optical fields. These optical systems usually use the electromagnetic radiations in atmospheric window of mid-infrared region covering from 3 to 12 μm [1,2,3,4]. As per reported literature, the infrared crystalline materials have been conventionally deployed to fabricate infrared lenses [5,6,7]. However, the evolution of optical systems using crystalline materials possesses drawbacks like being time-consuming, expensive and very difficult for mass production.
In this regard, the amorphous chalcogenide glass systems have been investigated rigorously for the development of infrared optical systems [8,9]. However, these glasses have drawbacks like low level of transmission, poor thermal stability and prone to crystallization, leading to investigate the alternative mid-infrared transmitting optical glasses. Among soft glass systems, tellurium oxide (TeO2)-based glasses are emerging as enabling materials for mid-infrared (IR) optics due to their wide array of functional properties, such as wide transmission ranging from ultraviolet (UV) to mid-IR (0.4 to 6 μm), low melting temperatures (~800 °C), good thermal stability (≥100 °C), larger index of refraction (≥2.0), low maximum phonon energies (~750 cm−1) and larger Raman gain coefficient [10,11,12,13]. Many researchers have thus studied the tellurite glass materials as contenders for a range of optical applications that include lasers/amplifiers [14,15,16,17,18,19,20], ceramic bulk lasers [21], upconverters [22,23], Raman amplifiers [24,25], mid-infrared lasers [26] and non-linear optical devices [27].
From the investigations, it was noted that key glass material properties that include thermal, thermo-mechanical, mechanical and optical are important and they must be known for precision glass molding/fiber processes of optical glasses. In particular, for the application of mid-infrared transmitting optics, the most important parameters are the transformation temperature (Tg), the softening temperature (Ts) and the thermo-mechanical coefficient (α) that play an important role, therefore, they must be studied in dependence of glass composition. In particular, the data of Ts and α were not available for many studied glass compositions. The tuned glass-forming area is required in order to establish a relationship between physical and optical properties and glass composition.
Hence, the present study is targeted to develop a high index of refraction (>1.8 at 3, 4 and 5 μm), high transmittance (>70%), low glass transition temperature (≤450 °C), low coefficient of thermal expansion (≤15 × 10−6/K at 100 °C) and good mechanical stability (>300 kgf/mm2) glass material for the design of a lens. Many researchers have already reported the TeO2–ZnO–based glass systems for various optical applications [10,12,15,17,19,24,27]. However, the TeO2–ZnO glass system showed low thermal and optical properties [10,12,15,17,19,24,27]. Thus, we have chosen the TeO2–ZnO–BaO glass system for the design and evolution of mid-infrared glass lens through the glass molding process. The effect of Nb2O5 and MoO3 additions on key glass properties in the TeO2–ZnO–BaO glass system was investigated. The addition of Nb2O5 and MoO3 transition metal oxides into the network of tellurite strengthens the connectivity and improves the glass forming ability (GFA) as well, which leads to improve the physical and optical properties [28].

2. Materials and Methods

Reagent grade TeO2, ZnO, BaO, Nb2O5 and MoO3 chemical constituents with purity of 99.99% were used for the preparation of glasses, and the molar ratio of glasses is shown in Table 1. The net weight of 30 g of raw materials was thoroughly grinded using a ball mill (PL-BM5L, Poong Lim, Seoul, South Korea) for 1 h and then mixed powder was taken in Pt crucible and heated at 900 °C using an electric furnace in a flowing N2 atmosphere for 45 min. The melt was poured onto a brass plate that was preheated and then the glass samples were annealed near the Tg for 2 h and naturally cooled down to room temperature. The glass samples free of defects were optically polished glasses and were inspected for the measurement. Figure 1 displays the photographs of indigenously developed TZB series prism samples.
The Raman experiment for the fabricated tellurite glass samples was conducted by using the Horiba Jobin-Yvon, France LabRam HR800 UV Raman spectrometer. The Raman spectra were recorded in the frequency region of 200–1200 cm−1 by focusing an Ar ion laser at 514.5 nm. The laser exposure time of 10 s, accumulation time of 3× and objective lens (100×, numerical aperture (N.A) = 0.85), were applied for obtaining the data. At room temperature (RT), the vibrational spectra were recorded with a resolution of 0.5 cm−1 in an unpolarized mode and backscattering geometry. The optical transmission spectra were measured by Frontier Optica Fourier-Transform Infrared (FTIR) Spectrometer (Perkin Elmer, L1280032, Cleveland, OH, USA) in the wavelength region from 0.4 to 6.0 μm. The glass samples with thickness of 2 mm were used for the measurement. Refractive index of TZB and TZB–10Nb glasses was measured by SpectroMaster@HR (Trioptics, Wedel, Germany) at different mid-infrared wavelengths of 3, 4 and 5 μm. In order to get high accuracy in the measurement, the glass block of 40 × 40 × 40 mm3 was cleaved into a prism shape and then polished. The accuracy of the instrument for single measurement was found to be 0.2 arcsec. In this study, a HgCdTe detector was used for the mid-IR wavelengths of 3, 4 and 5 μm. The simultaneous thermal analyzer (STA 409, NETZSCH, Wittelsbacherstraße, Selb, Germany) was deployed for the calorimetric analysis. For the measurement, about 25 mg glass powder was taken in the alumina pan and then the thermal traces were measured in the range from RT to 800 °C at a rate of 10 K/min under nitrogen atmosphere. The dilatometer (DIL 402C, NETZSCH, Wittelsbacherstraße, Selb, Germany) was used for measuring the dilatometric traces of glass samples with size of 5 × 5 × 10 mm3 in the range of 30 to 450 °C. The fitting accuracy of thermal expansion was 0.1 K. Micro-hardness of the resultant glasses were determined by a hardness tester (Mitutoyo HM-200, Aurora, IL, USA). The glass samples with size of 5 × 5 × 10 mm3 were used for measuring the hardness.

3. Results and Discussion

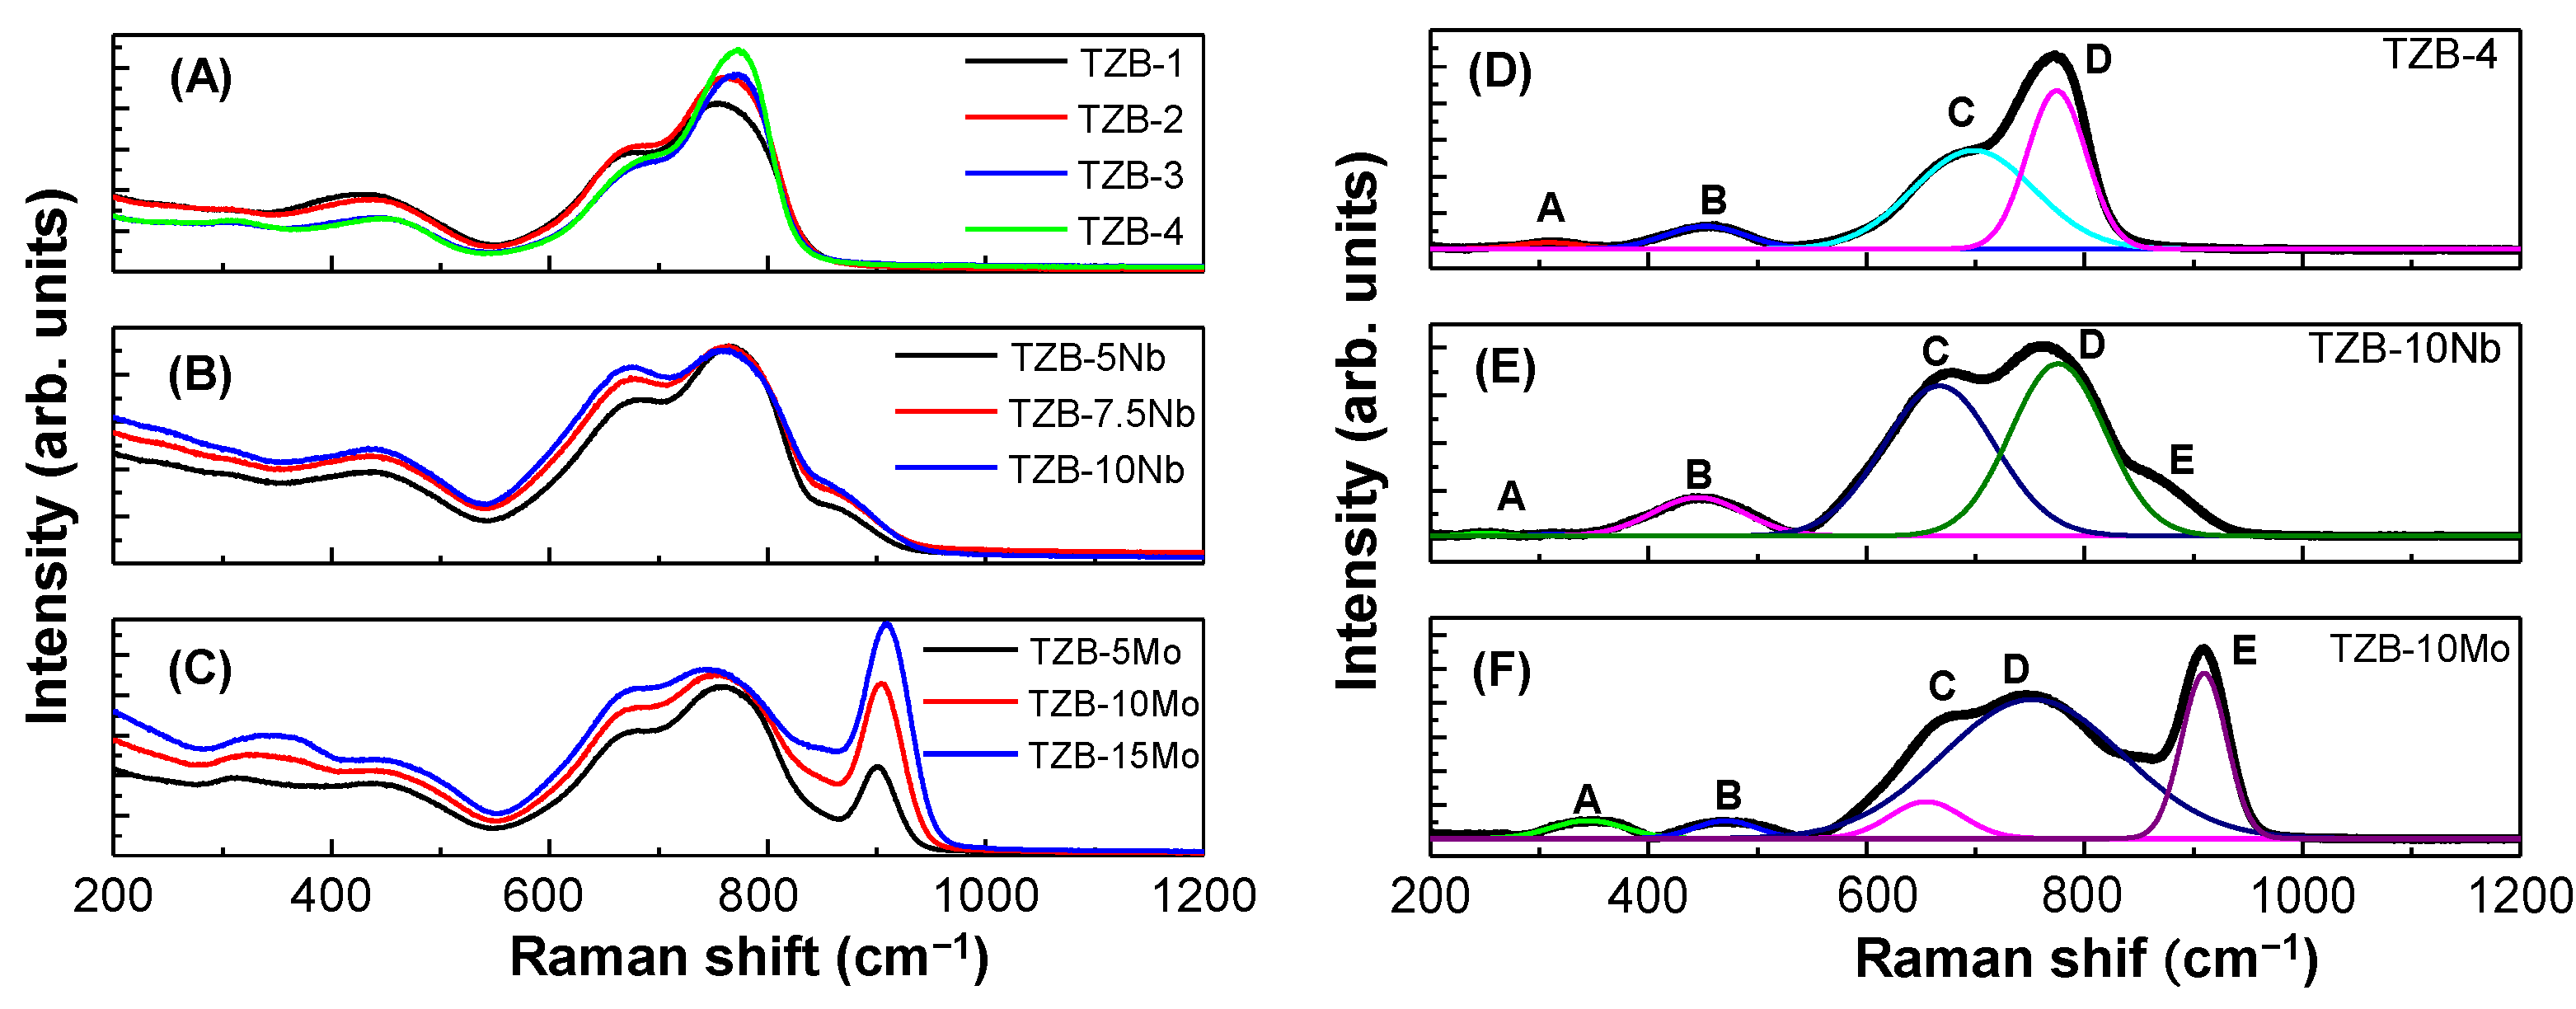
3.1. Structural Analysis—Raman Spectra

The characterization of structural behavior for the titled glasses using vibrational spectroscopy is vital for optical device application. Figure 2A–C displays the Raman spectra of the TZB glass system for different modifier concentrations. Figure 2D–F depicts the deconvoluted Raman spectra of one of the characteristic glass compositions of each series compositions. It was found that the observed Raman bands of the presented glasses are corresponding to the same structural units of α–TeO2 crystal and tellurite glasses containing various modifier oxides [10,11,13,29,30,31,32,33]. As described in the literature [10,11,29,30,31,32,33], the tellurite network possesses a basic structural fragment of TeO4 trigonal bipyramid (tbp), TeO3 trigonal pyramid (tp) and intermediate TeO3+δ polyhedron. In the present study, the vibrational bands were noted in the frequency region of 309–304, 428–452, 671–692 and 754–771 cm−1 for the TZB glass system at different BaO contents, as shown in Figure 2A. The Raman bands’ frequency and its assignment are shown in Table 2. The deconvoluted Raman spectrum for the characteristic glass composition in this series is shown in Figure 2D. As is seen, the amplitude of 300, 428 and 671 cm−1 frequency bands decreased, while the 754 cm−1 frequency band increased with the increase in BaO content substituted for TeO2, indicating that the number of bridging oxygen’s decreases, which in turn reduces the network connectivity. The enhancement of the band at ~754 cm−1 was due to the increase of ν(Te–O) stretching and bending vibrations in TeO3+δ and TeO3 networks that occur with the addition of BaO. It was also noted that the width of the Raman bands decreased with the addition of BaO content. This clearly determines the change of TeO4 tbp structural fragment into TeO3+δ or TeO3 units with the addition of BaO content.
The Raman spectra for the TZB−Nb glasses at different Nb2O5 concentrations are depicted in Figure 2B. As could be seen from the spectra, five characteristic vibrational frequency bands were found in the range of 308–310, 439–440, 681–676, 761–758 and 865–851 cm−1. The optical phonon frequencies and assignment are tabulated in Table 2 and the identified bands were similar to the Nb2O5-based tellurite glasses reported elsewhere [34,35,36,37,38]. The deconvoluted Raman spectrum for the representative glass in this series is shown in Figure 2E. The comparison of the Raman spectra of Nb2O5-doped TZB glasses showed that the intensity of Te–O stretching and bending vibrations in TeO3+δ and TeO3 networks at 310 cm−1 decreased with respect to the Nb2O5 concentration. The frequency bands at 439, 681 and 761 cm−1 attributed to the νs(Te−O−Te) stretching and bending, νas(Te–O) stretching, and ν(Te−O) stretching vibrations increased with the addition of Nb2O5 content, respectively. The band centered at ~865 cm−1 was noticed in the higher frequency region, which can be assigned to the νs(Nb–O) stretching vibrations in NbO6 octahedra [34,35,36,37,38], and its intensity decreased with the addition of Nb2O5 concentration. The position of all the major bands moved towards lower wave numbers from 681 to 676 cm−1, 761 to 758 cm−1 and 865 to 851 cm−1 respectively, with the increase in Nb2O5 additive concentration. Thus, the structural change occurs from TeO4 tbp units into TeO3/TeO3+δ units along with the creation of non-brdging oxygens (NBOs), as the Nb2O5 content increases. This structural rearrangement determines that the tellurite network adopted the maximum number of Nb5+ ions as modifier ions [39]. It was worthy to note that the Raman spectral bandwidth of all the bands of Nb2O5-based TZB glasses was found to be larger that of the bands identified for base TZB glass compositions. In view of the bandwidth, the TZB−Nb glasses could be useful for the broadband Raman amplifier application.
The Raman spectra for the TZB–Mo glasses at different MoO3 concentrations are depicted in Figure 2C. As could be seen from the spectra, five characteristic frequency bands were noticed in the range of 304–338, 433–436, 678–679, 754–745 and 900–909 cm−1. The assignment and peak positions of frequency bands are tabulated in Table 2 and the identified bands are similar to the MoO3-based tellurite glasses reported elsewhere [40,41,42,43]. Overall, the spectra exhibited two continuous broad bands, which are composed of the characteristic vibration bands of Te−O polyhedron, Mo–O polyhedron and possible Te−O–Mo bonds. The deconvoluted Raman spectrum for the representative glass composition in this series is depicted in Figure 2F. The accuracy of fitting was found to be 99.9%. Five characteristic frequency bands of Te−O and Mo−O groups were identified at 344, 468, 655, 752 and 910 cm−1 and are similar to the reported TeO2−MoO3 glass systems [40,41,42,43]. As is seen from Figure 2C, the intensity of all frequency bands increased with the MoO3 additive content. In addition, the shift in peak position of bands with respect to MoO3 concentration was noticed. Peak A from 304 to 338 cm−1, peak B from 433 to 436 cm−1, peak C from 678 to 679 cm−1, peak D from 754 to 745 cm−1 and peak E from 900 to 909 cm−1 shifted with an increase in MoO3 content. This shows a change in bond length of the frequency group and a distortion of the basic TeO4 tbp structural unit, resulting in a variation of physical and optical properties.

3.2. Optical Studies

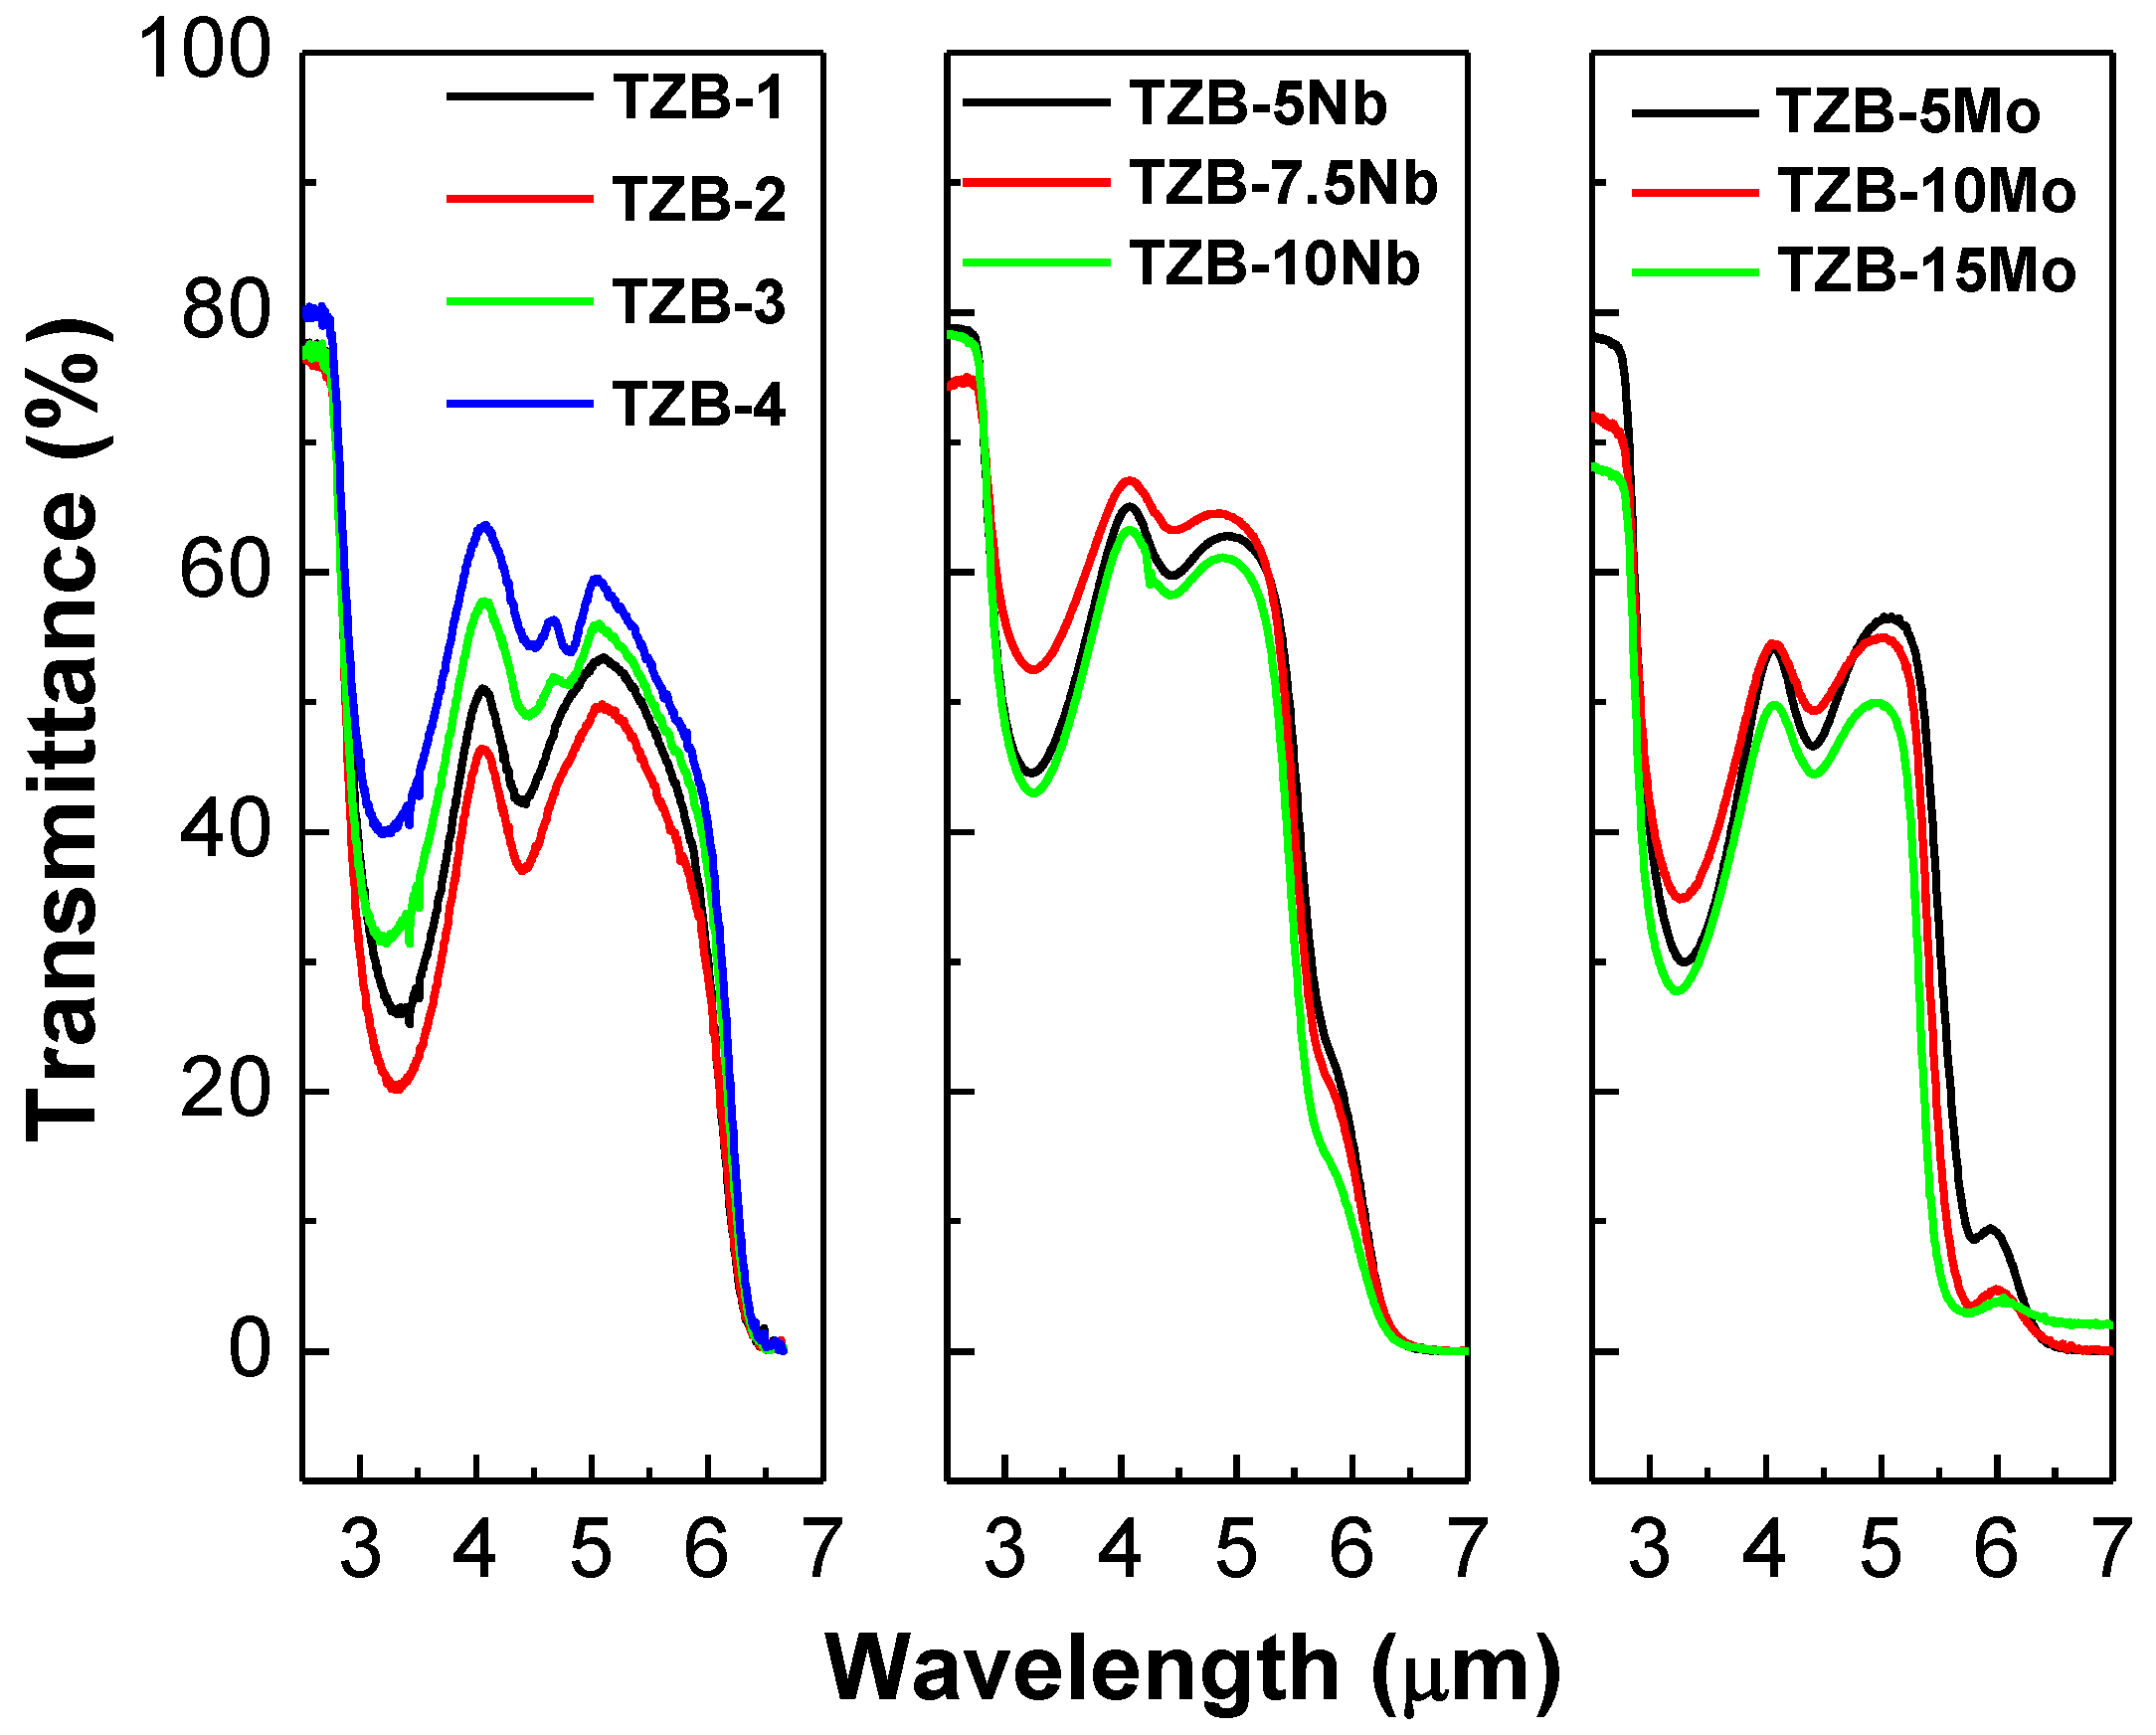
3.2.1. Mid-Infrared Optical Transmittance

Figure 3 shows the transmittance of all three series glasses in the mid-IR region ranging from 3 to 6 μm. It was clear that the titled glasses added with different additives showed a good transmittance up to 6 μm, indicating attractive mid-infrared transmitting optics. As is seen from transmission spectra, the transmission level of all the samples was close to 70%. The broad absorption bands were due to the absorption of glass matrix, Fresnel reflections and dispersion [44,45,46,47,48]. At ~3 μm, an intense hollow was observed, which corresponds to free hydroxyl groups, and the weaker hollow at ~4.5 μm attributes to multiphonon absorption [44,45,46,47,48]. The hydroxyl group absorption can be removed in the tellurite glasses with addition of fluorides along with sealing gas (Ar or O2) [44,45,46,47,48].
The coefficient of absorption (αOH−) and OH−concentration (NOH−) in the resultant tellurite glasses can be obtained by the following two equations [44,45,46,47,48], given by:
α OH = ln ( T 0 T ) L
N OH = N AV ε α OH
where L is the thickness (cm), T0 is the maximum transmittance, T is the transmittance at ~3 μm, NAV is the Avogadro constant (6.02 × 10²³ mol−1) and ε is the molar absorptivity corresponding to OH in tellurite glasses (49.1 × 103 cm2/mol) [49]. The αOH− for TZB series glasses was calculated to be 5.44, 6.56, 4.43 and 3.51 cm−1, respectively. The αOH− of Nb2O5-doped TZB glasses was found to be 2.85, 1.76 and 3.03 cm−1, respectively. The αOH− of MoO3-doped TZB glasses was found to be 4.47, 3.62 and 4.49 cm−1, respectively. The NOH− values were obtained to be 6.67, 8.04, 5.43 and 4.30 (×1019 cm−3) for different BaO contents of 5, 10, 15 and 20 mol%, respectively. The NOH− values were calculated to be 3.49, 2.16 and 3.71 (×1019 cm−3) for different Nb2O5 contents of 5, 7.5 and 10 mol%, respectively. The NOH− values were found to be 3.49, 2.16 and 3.71 (×1019 cm−3) for different MoO3 contents of 5, 10 and 15 mol%, respectively. Among all three series glasses, it was clear that the Nb2O5-doped TZB glasses showed lower values of αOH− and NOH−. The αOH− and NOH− values are comparable to the reported oxyfluoride tellurite glasses [47]. From the results, it was suggested that the Nb2O5-doped TZB glasses could be incorporated with fluorides in order to reduce more OH− absorption in the glass network.

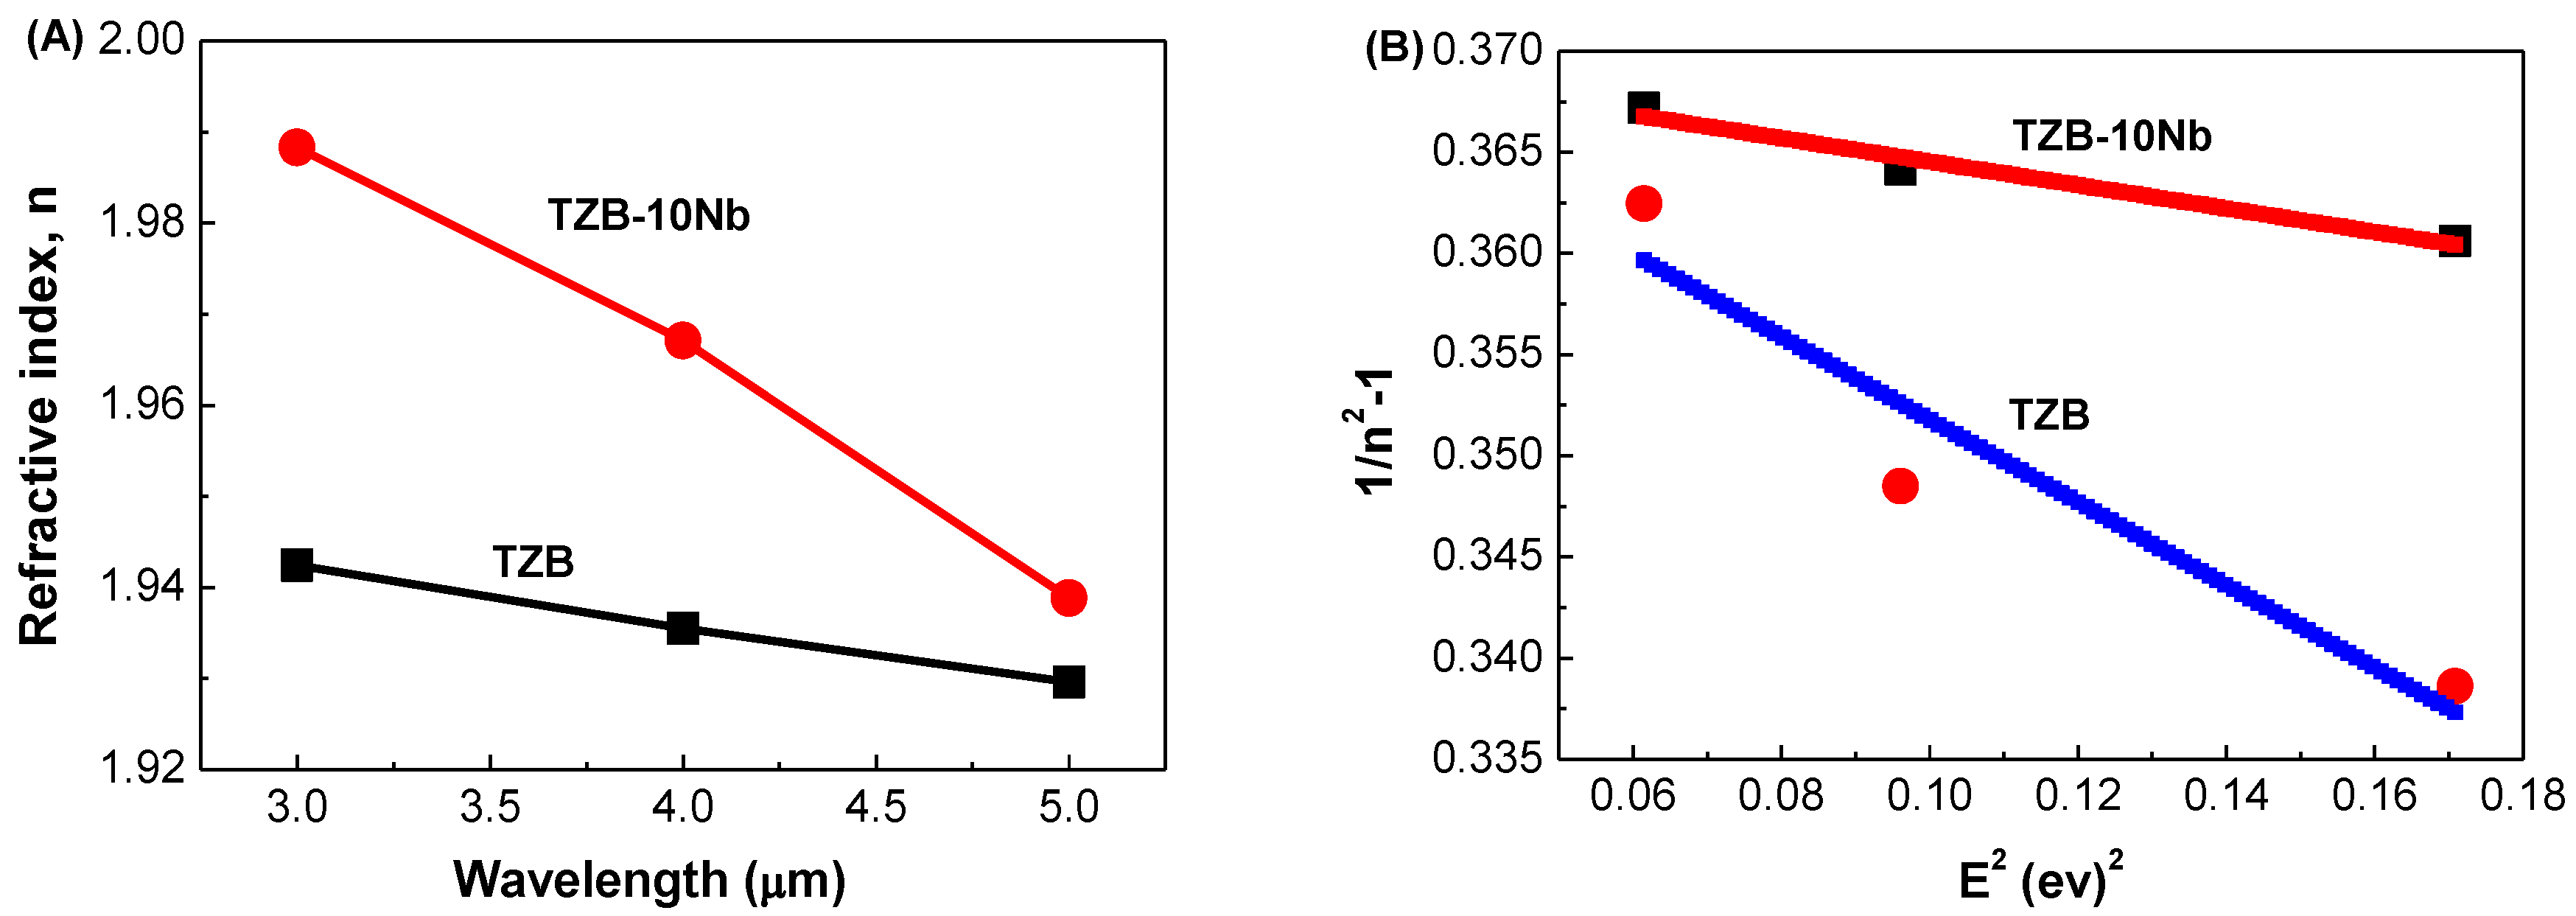
3.2.2. Refractive Index and Optical Dispersion

In addition to transmittance, the index of refraction and dispersion are vital parameters for the application of optical materials in optical device systems. The refractive index was measured in the mid-IR region at 3.0, 4.0 and 5.0 μm for the TZB and TZB–Nb glasses (see Figure 4A). From the figure, as usual, the refractive index decreases with respect to wavelength, irrespective of the glass composition. With the addition of Nb2O5 to the base TZB glass system, the refractive index increased significantly, as shown in Figure 4A. The reason for this behavior can be explained based on the oxide ion polarizability. Dimitrov et al. [50] have reported that the cation polarizability of oxides (αO2−) affects the refractive index in the order of Te4+ (1.595 Å3) > Nb5+ (1.035 Å3) > Zn2+ (0.286 Å3). In the present study, the ZnO content was replaced with Nb2O5, resulting in a high refractive index for the Nb5+-doped glasses. Based on the oxide ion polarizability of simple oxides, an optical basicity (Λ) was obtained from the relation, Λ = 1.67(1−1/αO2−). The optical basicity (Λ) of TeO2, Nb2O5 and ZnO was reported to be 0.93, 1.05 and 1.08, respectively [50]. The effect of Nb2O5 addition on Abbe number was studied for the TZB glass system. The Abbe number is used in order to know dispersion of optical materials. Abbe number (ν) can be calculated from the following equation [51], given by:
ν   =   n 4 1 n 3 n 5
where n3, n4 and n5 represent the refractive indices at wavelengths 3, 4 and 5 μm, respectively. The ν for the TZB and Nb-doped TZB glasses was found to be 73.08 and 19.53, respectively. This indicates that the optical dispersion depends on the glass composition. From the results, the Nb-doped TZB glasses are considered as high dispersive material. The variation of refractive index with photon energy can be obtained based on the single oscillator approximation suggested by Wemple [52]:
n 2 1 =   E d E o E o 2 E 2   1 n 2 1 = E o E d E 2 E o E d
where n is the refractive index at a specific wavelength, E is the photon energy (= hν), Eo is the average excitation energy for electronic transitions and Ed is the dispersion energy. Eo and Ed values for the TZB and TZB–Nb glasses were determined from the linear fit of 1/(n2 − 1) vs E2 plot, as shown in Figure 4B. The Eo and Ed values were found to be 2.5285 and 6.8278 for TZB glasses, while 1.3491 and 3.6243 values were obtained for the TZB–10Nb glass, respectively. In single crystal, the dispersion energy, Ed, depends on the neighbor cation coordination number and anion valency. In the present study, the addition of Nb2O5 contents shows a decrease in the Ed values. In case of glasses, the Ed value follows a similar trend but lower than that of the values for single crystal [52]. According to the reported literature, the 5% addition of Nb2O5 to the Na2O–TeO2 system results in an increase of the Ed value up to 70% [53]. This may probably be due to the substitution of large ionic radii atoms like Na+, that are also likely to influence the optical characteristics [54]. A decrease in dispersion energies, Ed, with the composition infers the decrease in the covalency of glass network with the increase of Nb content.

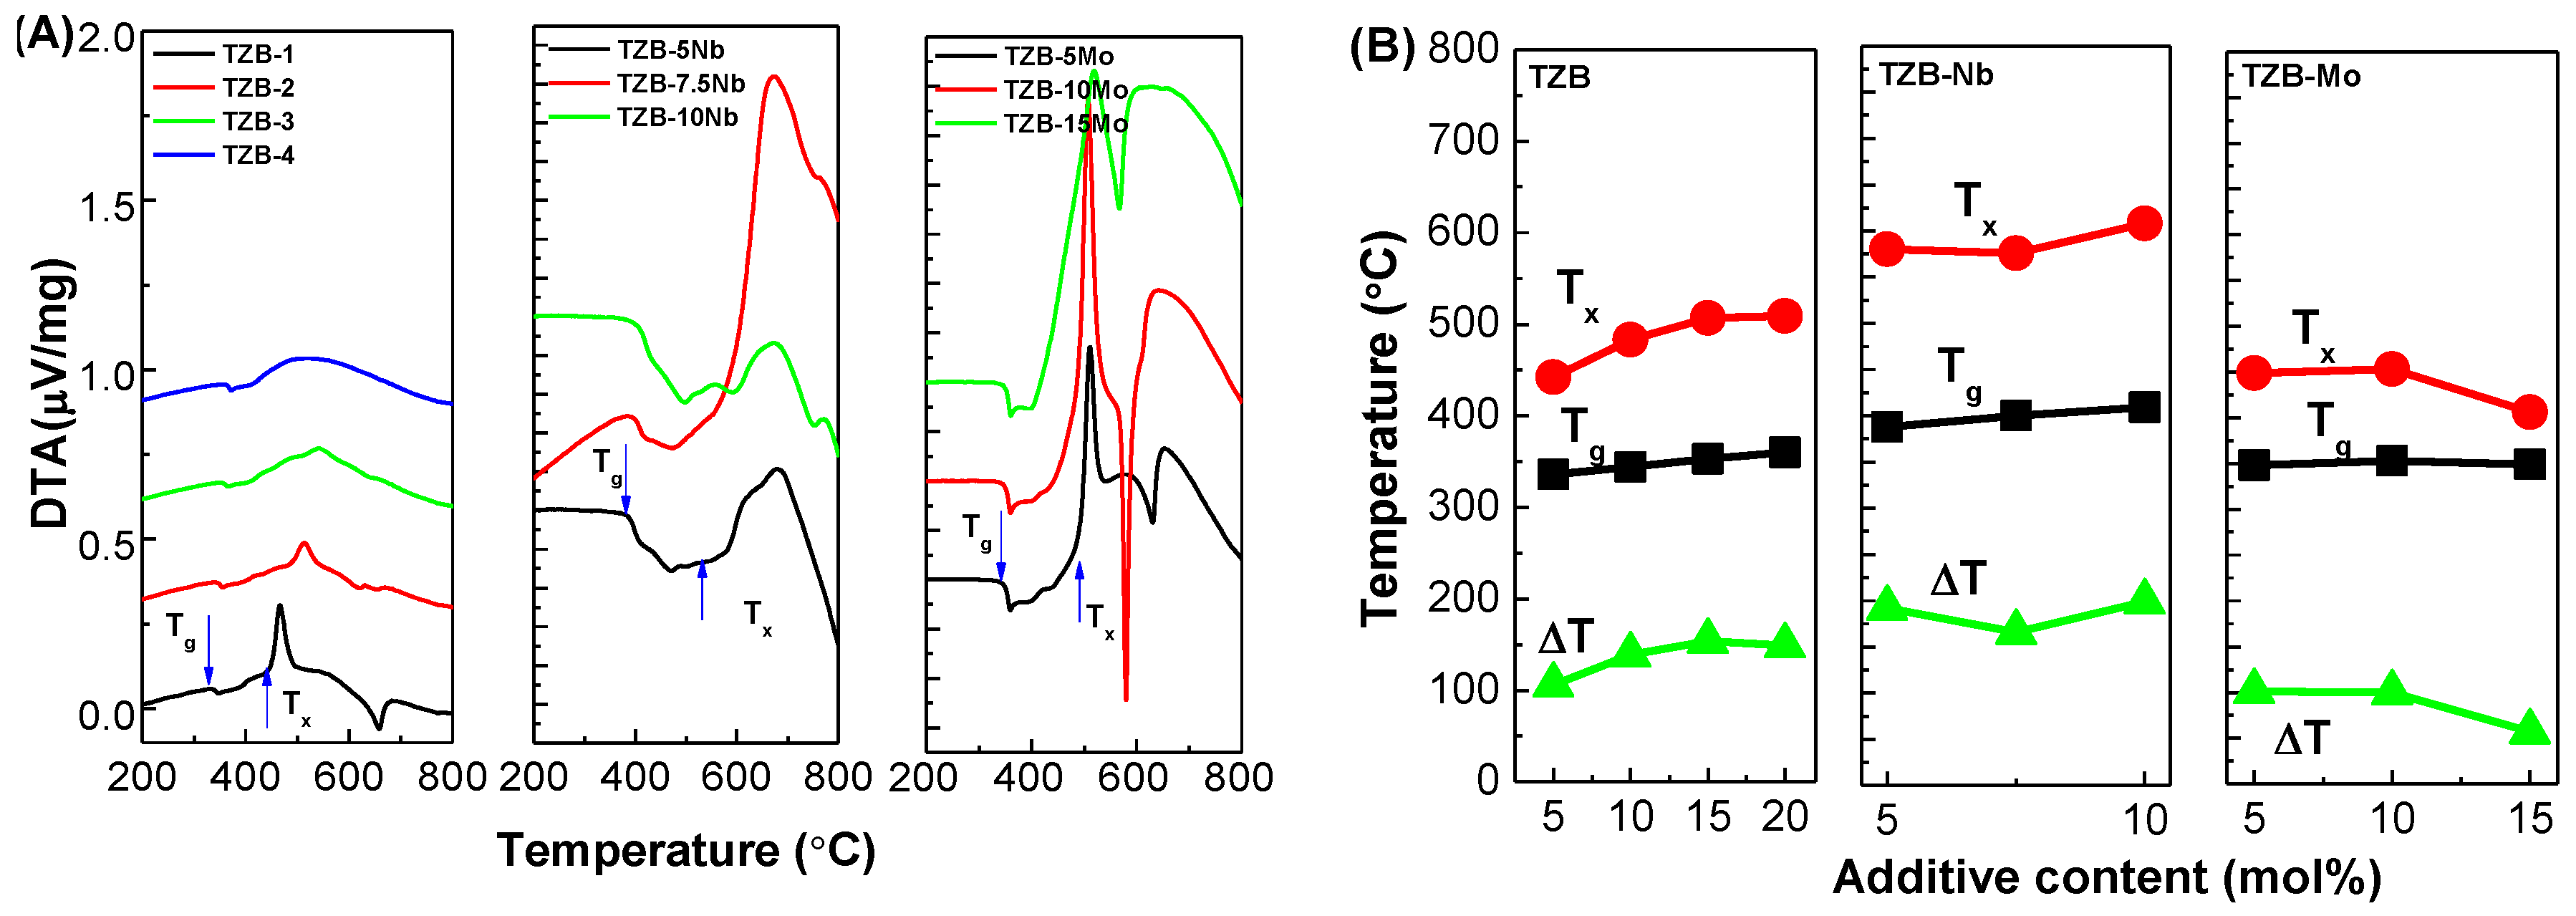
3.3. Thermal Studies

The calorimetric study is used to investigate the thermal stability of glass. The thermal stability, i.e., ΔT = Tx − Tg, should be as high as possible to have a wide working range. The larger the thermal stability, the greater the glass quality. The typical ΔT should be ≥100 °C to avoid crystal formation inside the glass. The fiber drawing and glass molding processes require high ΔT as the optical glasses undergo repeated reheating cycles. Figure 5A represents the qualitative calorimetric data of the TeO2–ZnO–BaO glass system incorporated with different additives of BaO, Nb2O5 and MoO3. From the calorimetric analysis, the characteristic temperatures such as Tg, Tx and ∆T were obtained for the resultant glasses. It was noted that all the glasses exhibited single glass transition. The inferred values of these temperatures are tabulated in Table 3 and depicted in Figure 5B. The Tg and Tx increased from 336 to 360 °C and 442 to 509 °C with the addition of BaO content, respectively. The trend of Tg could be attributed to the increased cross-linking density and bond strength between the atoms involved [10]. This can be explained based on the ionic radii of Te (0.89 Å) and Ba (1.45 Å). The substitution of BaO, instead of TeO2, leads to cleaving Te–O–Te linkages and filling open spaces due to its high ionic radii compared to that of Te4+ [10]. It was worthy to note that the intensity of the Tx decreased with the increase in BaO content and it almost vanished at 20 mol% of BaO owing to structural rearrangement. As can be seen from Figure 5B, ΔT increased with the substitution of BaO instead of TeO2 (Table 3).
In case of TZB–Nb, with the addition of Nb2O5, the parameters Tg and Tx showed an increasing trend from 388 to 409 °C and 580 to 598 °C, respectively. There are two reasons for this behavior in Nb2O5-modified glasses. In the niobium-tellurite glass network, Nb5+ ions exist partially in both NbO6 octahedra (mainly connect to non-bridging oxygen, NBO), and NbO4 tetrahedra (mainly connect to bridging oxygen, BO) [33,37,39]. Moreover, the bond energy of Nb5+ (771 kJ/mol) was larger than that of Zn2+ (151 kJ/mol) [37,39,50]. This shows that the bond cleaving in the Nb2O5–TeO2 glass network becomes difficult, leading to an increase in Tg and Tx. It was interesting to note from Figure 5A that the crystallization peaks were weak for the TZB–10Nb glass, indicating that the glass sample was more stable against devitrification and thus appropriate for the glass molding process/fiber fabrication.
For the TZB–Mo glass system, the Tg and Tx values were determined to be in the range of 350 to 352 °C and 487 to 408 °C, respectively. The considerable variation was not noticed for the Tg with the addition of MoO3, while the Tx was found to decrease with the MoO3 addition. The trend of the thermal characteristics of TZB–Mo glasses can be explained based on structural behavior. The substitution of MoO3 instead of ZnO into the tellurite network breaks the Te–O bonds, decreases the number of bridging oxygens and encourages the creation of Te−O−Mo bonds in the present glass. Additionally, the transformation of TeO4 tbp units into TeO3+δ/TeO3 units eventually leads to a more disordered structure, resulting in the deteriorated or even vanished peak of crystallization. This conclusion was sustained by Raman studies which confirmed that the frequency band at 900 cm−1 had dominant behavior compared to that of 750 cm−1.
It was interesting to note that the studied TZB-based glass systems performed the key glass properties (Tg, Ts, α and HK) that were comparable to the commercial SUMITA optical glasses. The commercial SUMITA Optical Glass MFG. Co., Ltd. Company (Saitama, Japan) had developed the mid-IR optical glasses (K-FIR98UV, K-FIR98UV) with specific values of thermal properties for precision glass molding. The quantitative values of Tg, Ts, α and HK were reported to be 427, 447 °C, 16.3 × 10⁻⁶/K and 351 kgf/mm2, respectively. In particular, the Nb2O5-based TZB glasses showed close values to the commercial glasses and thus they are promising candidates for glass molding.

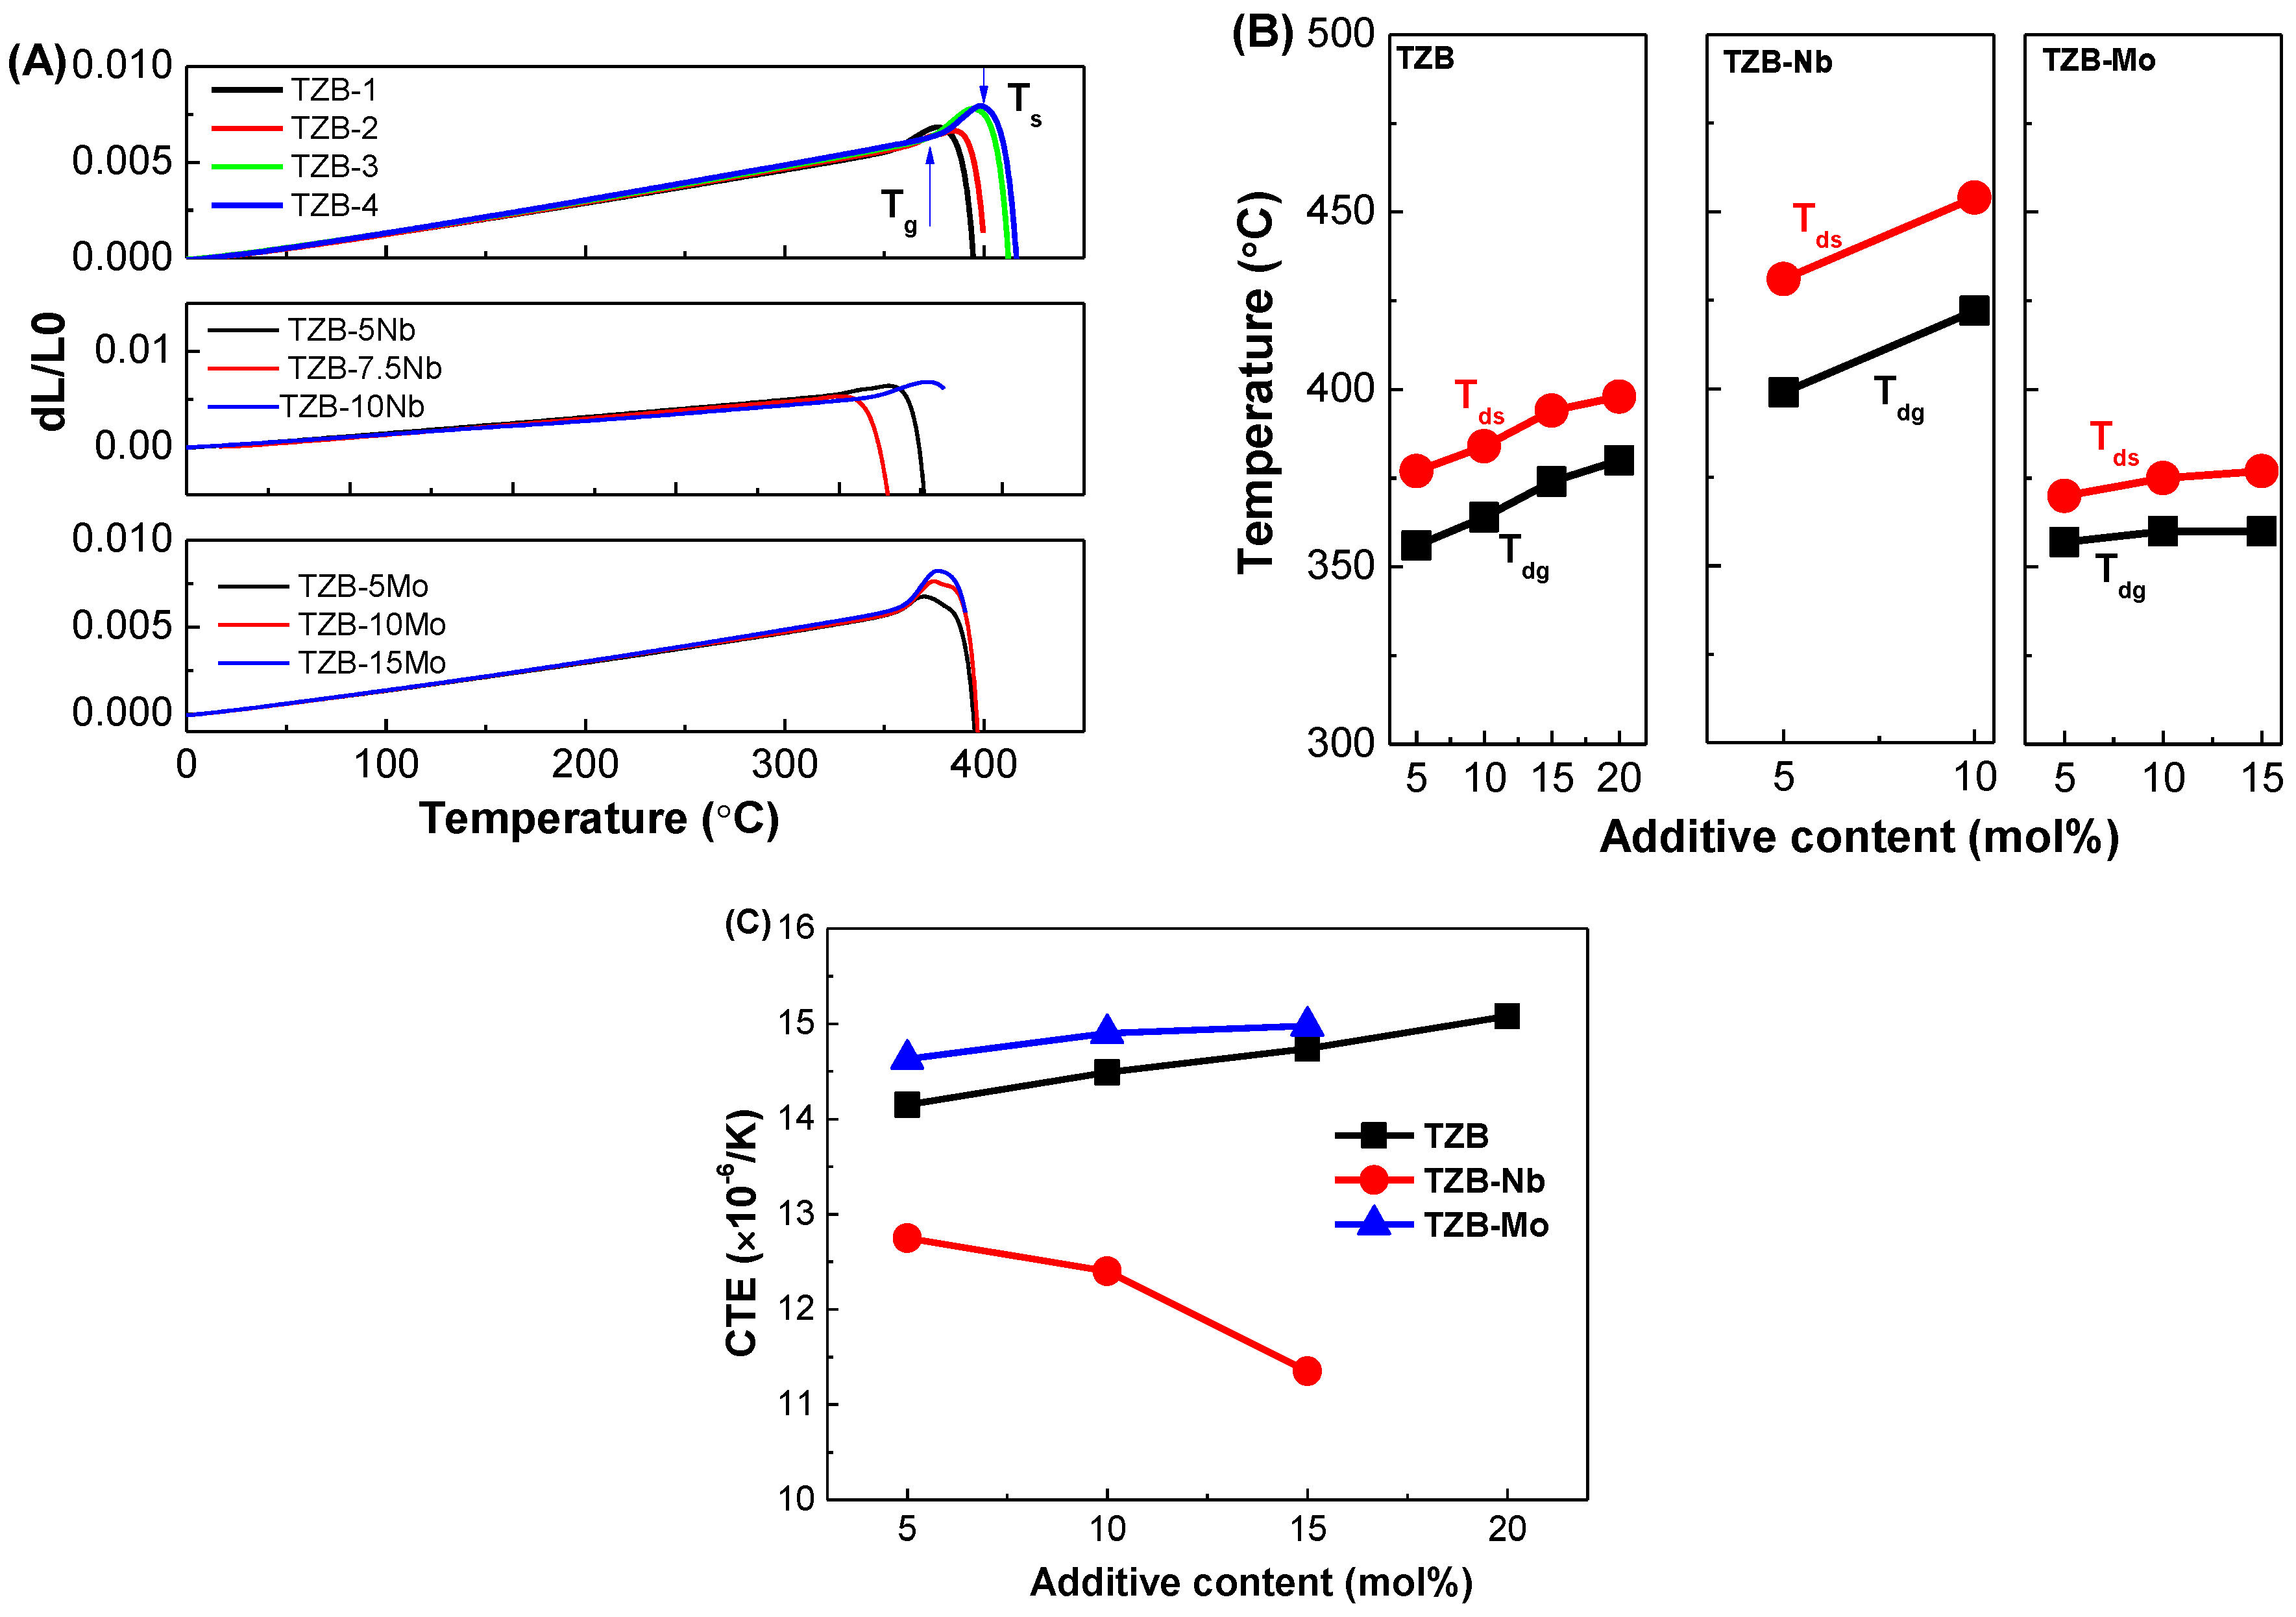
3.4. Thermo-Mechanical Studies

The thermo-optic coefficient (CTE, α) is a vital parameter for the realization of several practical optical systems [55]. The α can lead to stress-optic effects and also influences the thermo-optic coefficient, dn/dT of glass [56,57,58]. The dilatometer was used for measuring the dilatometric traces of titled glasses in order to obtain the properties like dilatometric glass transition temperature (Tdg), dilatometric softening temperature (Tds) and α. Figure 6A displays the qualitative dilatometric traces of studied glasses. The α was determined by linear fitting of the curves measured in the temperature range of 25 to 450 °C. The Tdg was determined from the expansion curve using the interception method, while the Tds was determined by the maximum temperature of the expansion curve. The quantitative values of Tdg and Tds for the resultant glasses are shown in Figure 6B and Table 3. The quantitative values of α for the resultant glasses are shown in Figure 6C and Table 3. For the TZB series glasses, the α increased from 14.15 to 15.05 (×10−6/K at 100 °C) with respect to BaO content varied from 5 to 20 mol%, respectively. The Tdg and Tds temperatures also increased from 356 to 380 °C and 377 to 398 °C with respect to BaO content, respectively. To understand the trend of α for the studied glasses, as shown in Figure 6C, we consider the electronegativities of the modifying cations. The relative electronegativities of elements determine the strength of the chemical bonds between them. As such, when discussing a substitution of one element for another in a glass matrix, the electronegativities of the elements being exchanged are directly related to the bond strengths. The trend of the α can also be explained based on the field strength of cations and the molecular weight of modifiers. For the TZB system, the α increased with the increase in BaO content instead of TeO2 due to an increase of the molecular weight of BaO.
For the TZB–Nb system, the α decreased from 12.75 to 11.35 (×10−6/K at 100 °C) with the increase in doping of Nb2O5, respectively. The Tdg and Tds temperatures increased from 399 to 422 °C and 431 to 454 °C respectively, maybe due to higher single bond strength of the Nb–O bond (~771 kJ/mol) than that of Zn–O (~151 kJ/mol) and Te–O bonds (~285 kJ/mol) [50]. The increased network strength realized through Nb2O5 addition holds the glass together more strongly and thus lowers the glass response to thermal variations. Based on the relative electronegativities of Nb5+ (1.6) and Zn2+ (1.65), the bond strength increases when Nb5+ is substituted for Zn2+ in the glass network. Accordingly, the α decreased for the TZB–Nb glass system for different Nb2O5 contents. The α (14.63 to 14.98 × 10⁻⁶/K at 100 °C), Tdg (357 to 360 °C) and Tdg (370 to 377 °C) increased with the substitution of MoO3 content, respectively. Based on the relative electronegativities of Mo6+ (2.15) and Zn2+ (1.65), the bond strength decreases when Mo6+ is substituted for Zn2+ in the glass network because of the larger electronegativity of Mo6+. Accordingly, the α increased for the TZB–Mo glass system for different MoO3 contents.
The trends of individual series can also be explained based on the conversion of TeO4 → TeO3+δ → TeO3. From the Raman spectra, as shown in Figure 2, for TZB–Mo series glasses, there is a rapid transformation of TeO4 tbp units into TeO3 for the substitution of MoO3 modifier content. This change is associated with the intermediate TeO3+δ state, which possesses an elongated axial bond and further, because the elongation of this bond is significant with respect to the shortening of the equatorial bond lengths, the increase in α can be understood in terms of a decrease in bond energy associated with the creation of TeO3+δ subunits. Conversely, it was worthy to note that the Nb2O5-modified TZB glasses showed lower α and higher Tdg and Tds than that of TZB- and MoO3-based TZB glass systems, indicating a candidate material for the glass molding process.

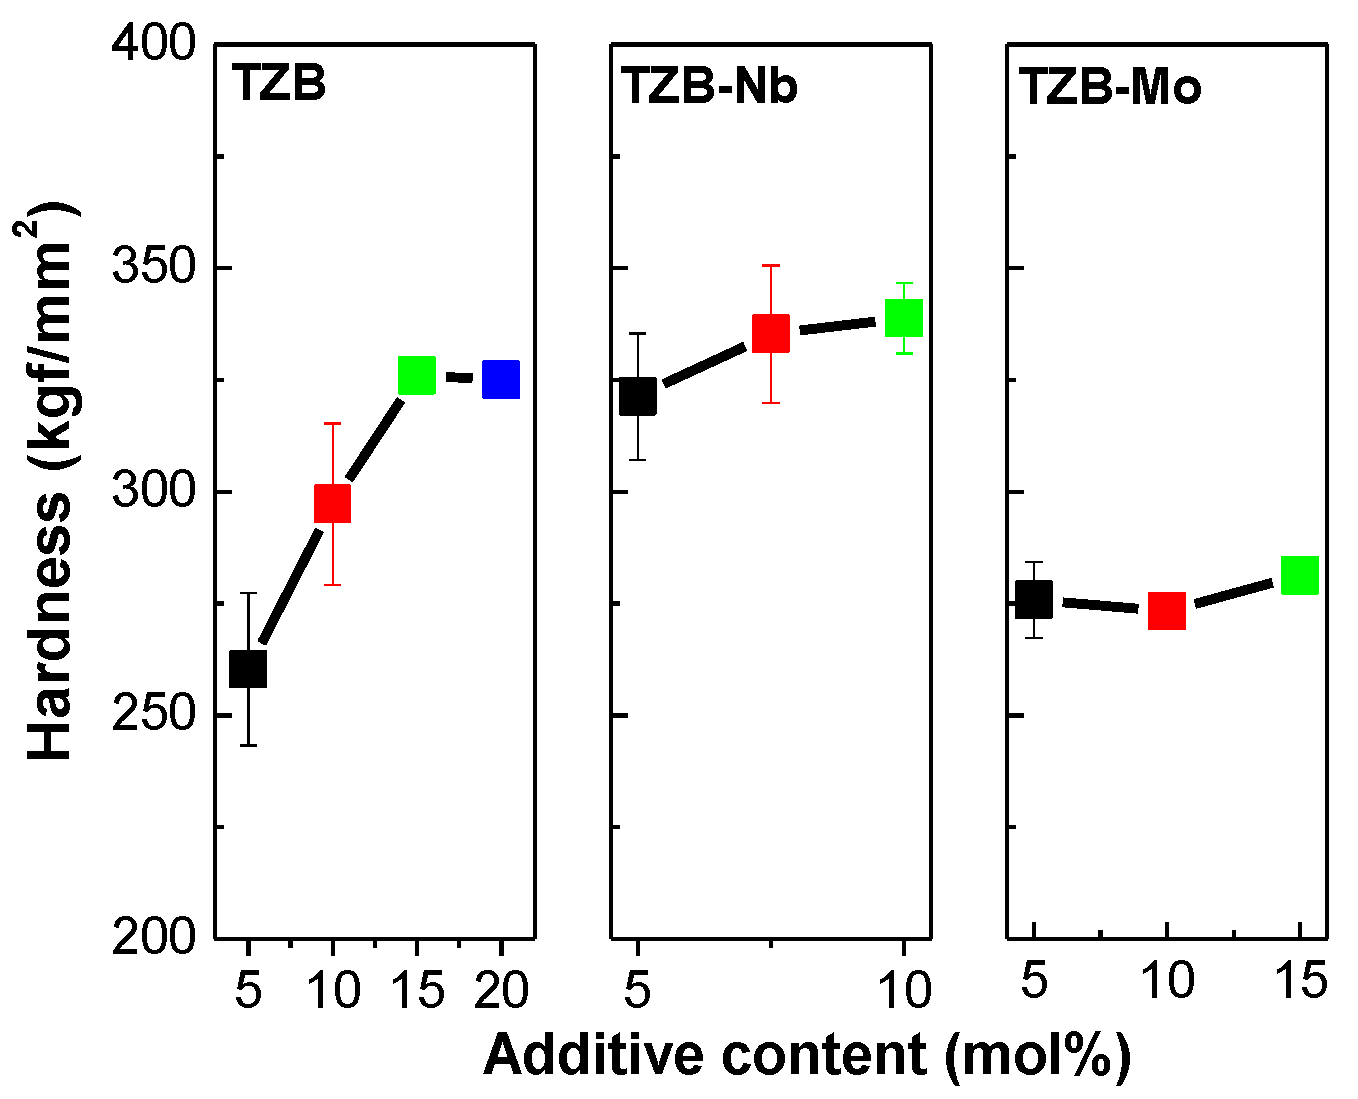
3.5. Mechanical Studies

Micro-indentation is a common test to determine the physical properties of glasses for specific application. As per previous literature, the tellurite-based glasses have been reported to be very weak, and therefore, a Knoop indenter can be used to measure the hardness of glasses [59,60]. The Knoop hardness (HK) can be obtained using the following equation [61], given by:
H K = P L 2 C p
where P is the applied load in Newton (N), L is the length of indentation diagonal (μm) and Cp is the correction factor (0.07028). Figure 7 depicts the variation of HK with respect to glass composition at different concentrations of modifiers. As can be seen from the figure, the HK values were found to increase from 260 to 325 kgf/mm2 with the addition of BaO content that was increased from 5 to 20 mol%, respectively. The HK values were found to be 321, 335 and 339 kgf/mm2 for different Nb2O5 concentrations of 5, 7.5 and 10 mol%, respectively. The HK values were determined to be 276, 273 and 281 kgf/mm2 for different MoO3 concentrations of 5, 7.5 and 10 mol%, respectively. From the results, it was noticed that the hardness increased with respect to modifier concentration. It was worthy to note that the Nb2O5-modified tellurite glasses had higher HK values that that of other studied TZB and TZB–Mo glass systems. The results direct that the TZB–Nb glasses have much larger mechanical strength than that of TZB and TZB–Mo glasses.

4. Conclusions

In the present study, all three series TZB glasses modified with different additives of BaO, Nb2O5 and MoO3 at different concentrations were prepared by the melt-quenching technique and their structural, physical and optical properties were studied systematically for mid-infrared transmitted optical glass material. The Raman studies of the present glasses resemble the basic structural behavior of tellurite glasses. The structural modification was noted in the TeO2 network with the additions of Nb2O5 and MoO3 modifiers. The bands at ~860 and 900 cm−1 were assigned to the νs(Nb–O) stretching vibrations in NbO6 octahedra and Mo=O vibrations in MoO6 octahedra, respectively. The studied glasses were transparent in the mid-IR region covering from 3 to 6 μm, and the maximum transmittance of about 70% was noticed for the Nb-doped glass system. High refractive index of the order of 1.99 at 3 μm was obtained for the Nb2O5-based glass. The glass transition temperature was determined to be ~360, 409 and 352 °C for TZB, TZB–Nb and TZB–Mo glass systems, respectively. From the thermal and mechanical studies, it was concluded that the Nb2O5-based TZB glass system exhibited a high stability of 192 °C, low CTE of 11.35 × 10⁻⁶/K at 100 °C and high Knoop hardness of 339 kgf/mm2. The results of the studied glasses were compared to the commercial SUMITA optical glasses. It was noticed that the Nb2O5-based TZB glasses are promising for the application of mid-wave infrared optical glass lenses.

Author Contributions

Conceptualization, J.H.C. and S.H.K.; methodology, K.L. and J.-H.I.; writing—original draft preparation, K.L. and K.H.; writing—review and editing, J.H.C. and K.H. All authors have read and agreed to the published version of the manuscript.

Funding

This work was supported by the Materials and Components Technology Development Program of MOTIE/KEIT, 20010150 (Oxide-based visible-MW infrared transmitted optical glass material for dual-band optics).

Conflicts of Interest

The authors declare no conflict of interest.

References

  1. Bureau, B.; Zhang, X.H.; Smektala, F.; Adam, J.-L.; Troles, J.; Ma, H.; Boussard-Pledel, C.; Lucas, J.; Lucas, P.; Le Coq, D.; et al. Recent advances in chalcogenide glasses. J. Non-Cryst. Solids. 2004, 345, 276–283. [Google Scholar] [CrossRef]
  2. Zhang, X.H.; Bureau, B.; Lucas, P.; Boussard-Pledel, C.; Lucas, J. Glasses for seeing beyond visible. Chem. Eur. J. 2008, 14, 432–442. [Google Scholar] [CrossRef] [PubMed]
  3. Bureau, B.; Boussard-Pledel, C.; Lucas, P.; Zhang, X.H.; Lucas, J. Forming glasses from Se and Te. Molecules 2009, 14, 4337–4350. [Google Scholar] [CrossRef] [PubMed] [Green Version]
  4. Cui, S.; Chahal, R.; Boussard-Plédel, C.; Nazabal, V.; Doualan, J.-L.; Troles, J.; Lucas, J.; Bureau, B. From selenium-to tellurium-based glass optical fibers for infrared spectroscopies. Molecules 2013, 18, 5373–5388. [Google Scholar] [CrossRef] [PubMed] [Green Version]
  5. Umicore Germanium Optics Leading the Way in Infrared Optics. Available online: http://pdf.directindustry.com/pdf/umicore-electronic-materials/germanium-infrared-optics-brochure/59063-507001.html (accessed on 31 January 2019).
  6. Ueno, T.; Hasegawa, M.; Yoshimura, M.; Okada, H.; Nishioka, T.; Teraoka, K.; Fujii, A.; Nakayama, S. Development of ZnS lenses for FIR cameras. SEI Tech. Rev. 2009, 69, 48–53. [Google Scholar]
  7. Corsetti, J.A.; McCarthy, P.; Moore, D.T. Color correction in the infrared using gradient-index materials. Opt. Eng. 2013, 52, 112109. [Google Scholar] [CrossRef]
  8. Huddleston, J.; Novak, J.; Moreshead, W.V.; Symmons, A. Investigation of As40Se60 chalcogenide glass in precision glass molding for high-volume thermal imaging lenses. Proc. SPIE 2015, 9451, 94511O. [Google Scholar]
  9. Zhou, T.; Zhu, Z.; Liu, X.; Liang, Z.; Wang, X. A Review of the Precision Glass Molding of Chalcogenide Glass (ChG) for Infrared Optics. Micromachines 2018, 9, 337. [Google Scholar] [CrossRef] [Green Version]
  10. Manikandan, N.; Ryasnyanskiy, A.; Toulouse, J. Thermal and optical properties of TeO2–ZnO–BaO glasses. J. Non-Cryst. Solids 2012, 358, 947–951. [Google Scholar] [CrossRef]
  11. Jose, R.; Suzuki, T.; Ohishi, Y. Thermal and optical properties of TeO2–BaO–SrO–Nb2O5 based glasses: New broadband Raman gain media. J. Non-Cryst. Solids 2006, 352, 5564–5571. [Google Scholar] [CrossRef]
  12. Manning, S.; Ebendorff-Heidepriem, H.; Monro, T.M. Ternary tellurite glasses for the fabrication of nonlinear optical fibres. Opt. Mater. Express 2012, 2, 140–152. [Google Scholar] [CrossRef]
  13. Murugan, G.S.; Ohishi, Y. Structural and physical properties of a novel TeO2–BaO–SrO–Ta2O5 glass system for photonic device applications. J. Non-Cryst. Solids 2005, 351, 364–371. [Google Scholar] [CrossRef]
  14. Jha, A.; Joshi, P.; Shen, S.; Huang, L. Spectroscopic characterization of signal gain and pump ESA in short-lengths of RE-doped tellurite fibers. J. Non-Cryst. Solids 2007, 353, 1407–1413. [Google Scholar] [CrossRef]
  15. Bell, M.J.V.; Anjos, V.; Moreira, L.M.; Falci, R.F.; Kassab, L.R.P.; da Silva, D.S.; Doualan, J.L.; Camy, P.; Moncorgé, R. Laser emission of a Nd-doped mixed tellurite and zinc oxide glass. J. Opt. Soc. Am. B 2014, 31, 1590–1594. [Google Scholar] [CrossRef] [Green Version]
  16. Rivera, V.A.G.; Manzani, D. Technological advances in tellurite glasses. In Springer Series in Material Science, 1st ed.; Springer: Berlin/Heidelberg, Germany, 2017. [Google Scholar]
  17. Muravyev, S.V.; Anashkina, E.A.; Andrianov, A.V.; Dorofeev, V.V.; Motorin, S.E.; Koptev, M.Y.; Kim, A.V. Dual-band Tm3+-doped tellurite fiber amplifier and laser at 1.9 μm and 2.3 μm. Sci. Rep. 2018, 8, 16164. [Google Scholar] [CrossRef] [PubMed]
  18. Narro-García, R.; Chillcce, E.F.; Miranda, A.R.; Giehl, J.M.; Barbosa, L.C.; Rodriguez, E.; Arronte, M. Optical and physical properties of Er3+-Yb3+ co-doped tellurite fibers. Proc. SPIE 2011, 8120, 812005. [Google Scholar]
  19. Shen, S.; Jha, A.; Liu, X.; Naftaly, M.; Bindra, K.; Bookey, H.J.; Kar, A.K. Tellurite Glasses for Broadband Amplifiers and Integrated Optics. J. Am. Ceram. Soc. 2002, 85, 1391–1395. [Google Scholar] [CrossRef]
  20. Mori, A.; Ohishi, Y.; Sudo, S. Erbium-doped tellurite glass fibre laser and amplifier. Electron. Lett. 1997, 33, 863–864. [Google Scholar] [CrossRef]
  21. Dolhen, M.; Tanaka, M.; Couderc, V.; Chenu, S.; Delaizir, G.; Hayakawa, T.; Cornette, J.; Brisset, F.; Colas, M.; Thomas, P.; et al. Nd3+-doped transparent tellurite ceramics bulk lasers. Sci. Rep. 2018, 8, 4640. [Google Scholar] [CrossRef]
  22. Tang, J.; Sun, M.; Huang, Y.; Gou, J.; Zhang, Y.; Li, G.; Li, Y.; Man, Y.; Yang, J. Study on optical properties and upconversion luminescence of Er3+/Yb3+ co-doped tellurite glass for highly sensitive temperature measuring. Opt. Mater. Express 2017, 7, 3238–3250. [Google Scholar] [CrossRef]
  23. Jakutis, J.; Gomes, L.; Amancio, C.T.; Kassab, L.R.P.; Martinelli, J.R.; Wetter, N.U. Increased Er3+ upconversion in tellurite fibers and glasses by co-doping with Yb3+. Opt. Mater. 2010, 33, 107–111. [Google Scholar] [CrossRef]
  24. O’Donnell, M.D.; Richardson, K.; Stolen, R.; Seddon, A.B.; Furniss, D.; Tikhomirov, V.K.; Rivero, C.; Ramme, M.; Stegeman, R.; Stegeman, G.; et al. Tellurite and Fluorotellurite Glasses for Fiberoptic Raman Amplifiers: Glass Characterization, Optical Properties, Raman Gain, Preliminary Fiberization, and Fiber Characterization. J. Am. Ceram. Soc. 2007, 90, 1448–1457. [Google Scholar] [CrossRef]
  25. De Andrade, G.D.; Rocha, H.D.O.; Segatto, M.E.V.; Pontes, M.J.; Castellani, C.E.S. Study and Optimization of Raman Amplifiers in Tellurite-Based Optical Fibers for Wide-Band Telecommunication Systems. J. Microw. Optoelectron. 2019, 18, 219–226. [Google Scholar] [CrossRef]
  26. Richards, B.D.O.; Jha, A.; Jose, G.; Teddy-Fernandez, T.; Binks, D.; Tsang, Y. Tellurite glass as a solid-state mid-infrared laser host material. In Proceedings of the Advanced Solid-State Lasers Congress OSA Technical Digest, Paris, France, 27 October–1 November 2013. [Google Scholar]
  27. Feng, X.; Shi, J.; Segura, M.; White, N.M.; Kannan, P.; Calvez, L.; Zhang, X.; Brilland, L.; Loh, W.H. Towards Water-Free Tellurite Glass Fiber for 2–5 μm Nonlinear Applications. Fibers 2013, 1, 70–81. [Google Scholar] [CrossRef] [Green Version]
  28. Canioni, L.; Martin, M.-O.; Bousquet, B.; Sarger, L. Precise measurements and analysis of linear and nonlinear optical properties of glass materials near 1.5 μm. Opt. Commun. 1998, 151, 241–246. [Google Scholar] [CrossRef]
  29. Sekiya, T.; Mochida, N.; Ohtsuka, A. Raman spectra of MO-TeO2 (M = Mg, Sr, Ba and Zn) glasses. J. Non-Cryst. Solids 1994, 168, 106–114. [Google Scholar] [CrossRef]
  30. Jha, A.; Richards, B.D.O.; Jose, G.; Toney Fernandez, T.; Hill, C.J.; Lousteau, J.; Joshi, P. Review on structural, thermal, optical and spectroscopic properties of tellurium oxide based glasses for fibre optic and waveguide applications. Int. Mater. Rev. 2012, 57, 357–382. [Google Scholar] [CrossRef]
  31. Jackson, J.; Smith, C.; Massera, J.; Rivero-Baleine, C.; Bungay, C.; Petit, L.; Richardson, K. Estimation of peak Raman gain coefficients for Barium-Bismuth-Tellurite glasses from spontaneous Raman cross-section experiments. Opt. Express 2009, 17, 9071–9079. [Google Scholar] [CrossRef]
  32. Hill, C.J.; Jha, A. Development of novel ternary tellurite glasses for high temperature fiber optic mid-IR chemical sensing. J. Non-Cryst. Solids 2007, 353, 1372–1376. [Google Scholar] [CrossRef]
  33. Lin, J.; Huang, W.; Sun, Z.; Ray, C.S.; Day, D.E. Structure and non-linear optical performance of TeO2–Nb2O5–ZnO glasses. J. Non-Cryst. Solids 2004, 336, 189–194. [Google Scholar] [CrossRef]
  34. Bachvarova-Nedelcheva, A.; Iordanova, R.; Ganev, S.; Dimitriev, Y. Glass formation and structural studies of glasses in the TeO2–ZnO–Bi2O3–Nb2O5 system. J. Non-Cryst. Solids 2019, 503–504, 224–231. [Google Scholar] [CrossRef]
  35. Kaur, A.; Khanna, A.; Sathe, V.G.; Gonzalez, F.; Ortiz, B. Optical, thermal, and structural properties of Nb2O5–TeO2 and WO3–TeO2 glasses. Phase Transit. 2013, 86, 598–619. [Google Scholar] [CrossRef]
  36. Moraes, J.C.S.; Nardi, J.A.; Sidel, S.M.; Mantovani, B.G.; Yukimitu, K.; Reynoso, V.C.S.; Malmonge, L.F.; Ghofraniha, N.; Ruocco, G.; Andrade, L.H.C.; et al. Relation among optical, thermal and thermo-optical properties and niobium concentration in tellurite glasses. J. Non-Cryst. Solids 2010, 356, 2146–2150. [Google Scholar] [CrossRef]
  37. Chen, D.D.; Liu, Y.H.; Zhang, Q.Y.; Deng, Z.D.; Jiang, Z.H. Thermal stability and spectroscopic properties of Er3+-doped niobium tellurite glasses for broadband amplifiers. Mater. Chem. Phys. 2005, 90, 78–82. [Google Scholar] [CrossRef]
  38. Elkhoshkhany, N.; Abbas, R.; El-Mallawany, R.; Humoud Sharba, K.S.H. Thermal properties of quaternary TeO2–ZnO–Nb2O5–Gd2O3 glasses. Ceram. Int. 2014, 40, 11985–11994. [Google Scholar] [CrossRef] [Green Version]
  39. Hoppe, U.; Yousef, E.; Russel, C.; Neuefeind, J.; Hannon, A.C. Structure of zinc and niobium tellurite glasses by neutron and X-ray diffraction. J. Phys. Condens. Matter 2004, 16, 1645–1663. [Google Scholar] [CrossRef]
  40. Sekiya, T.; Mochida, N.; Ogawa, S. Structural study of MoO3-TeO2 glasses. J. Non-Cryst. Solids 1995, 185, 135–144. [Google Scholar] [CrossRef]
  41. Liu, J.L.; Wang, W.C.; Xiao, Y.B.; Huang, S.J.; Mao, L.Y.; Zhang, Q.Y. Nd3+-doped TeO2–MoO3–ZnO tellurite glass for a diode-pump 1.06μm laser. J. Non-Cryst. Solids 2019, 506, 32–38. [Google Scholar] [CrossRef]
  42. Kaur, A.; Khanna, A.; González, F.; Pesquera, C.; Chen, B. Structural, optical, dielectric and thermal properties of molybdenum tellurite and borotellurite glasses. J. Non-Cryst. Solids 2016, 444, 1–10. [Google Scholar] [CrossRef]
  43. Yuan, J.; Yang, Q.; Chen, D.D.; Qian, Q.; Shen, S.X.; Zhang, Q.Y.; Jiang, Z.H. Compositional effect of WO3, MoO3, and P2O5 on Raman spectroscopy of tellurite glass for broadband and high gain Raman amplifier. J. Appl. Phys. 2012, 111, 103511. [Google Scholar] [CrossRef] [Green Version]
  44. Feng, X.; Tanabe, S.; Hanada, T. Hydroxyl groups in erbium-doped germanotellurite glasses. J. Non-Cryst. Solids 2001, 281, 48–54. [Google Scholar] [CrossRef]
  45. O’Donnell, M.D.; Miller, C.A.; Furniss, D.; Tikhomirov, V.K.; Seddon, A.B. Fluorotellurite glasses with improved mid-infrared transmission. J. Non-Cryst. Solids 2003, 331, 48–57. [Google Scholar] [CrossRef]
  46. Chen, F.; Wei, T.; Jing, X.; Tian, Y.; Zhang, J.; Xu, S. Investigation of mid-infrared emission characteristics and energy transfer dynamics in Er3+ doped oxyfluoride tellurite glass. Sci. Rep. 2015, 5, 10676. [Google Scholar] [CrossRef] [PubMed] [Green Version]
  47. Zhang, F.F.; Zhang, W.J.; Yuan, J.; Chen, D.D.; Qian, Q.; Zhang, Q.Y. Enhanced 2.7 μm emission from Er3+ doped oxyfluoride tellurite glasses for a diode-pump mid-infrared laser. AIP Adv. 2014, 4, 047101. [Google Scholar] [CrossRef]
  48. Chen, F.; Xu, S.; Wei, T.; Wang, F.; Cai, M.; Tian, Y.; Xu, S. Mid-infrared emission and Raman spectra analysis of Er3+-doped oxyfluorotellurite glasses. Appl. Opt. 2015, 54, 3345–3352. [Google Scholar] [CrossRef]
  49. Gomes, L.; Oermann, M.; Ebendorff-Heidepriem, H.; Ottaway, D.; Monro, T.; Librantz, A.F.H.; Jackson, S.D. Energy level decay and excited state absorption processes in erbium-doped tellurite glass. J. Appl. Phys. 2011, 110, 083111. [Google Scholar] [CrossRef] [Green Version]
  50. Dimitrov, V.; Komatsu, T. An interpretation of optical properties of oxides and oxide glasses in terms of the electronic ion polarizability and average single bond strengths. J. Univ. Chem. Technol. Metall. 2010, 45, 219–250. [Google Scholar]
  51. Ghosh, G. Sellmeier Coefficients and Chromatic Dispersions for Some Tellurite Glasses. J. Am. Ceram. Soc. 1995, 78, 2828–2830. [Google Scholar] [CrossRef]
  52. Wemple, S.H.; DiDomenico, M., Jr. Behavior of the Electronic Dielectric Constant in Covalent and Ionic Materials. Phys. Rev. B 1971, 3, 1338–1351. [Google Scholar] [CrossRef]
  53. Vijaya Prakash, G.; Narayana Rao, D.; Bhatnagar, A.K. Linear optical properties of niobium-based tellurite glasses. Solid State Commun. 2001, 119, 39–44. [Google Scholar] [CrossRef]
  54. Terashima, K.; Kim, S.-H.; Yoko, T. Nonlinear Optical Properties of B2O3-Based Glasses: M2O-B2O3(M = Li, Na, K, Rb, Cs, and Ag) Binary Borate Glasses. J. Am. Ceram. Soc. 1995, 78, 1601–1605. [Google Scholar] [CrossRef]
  55. Noda, J.; Okamoto, K.; Sasaki, Y. Polarization-maintaining fibers and their applications. J. Lightwave Technol. 1986, 4, 1071–1089. [Google Scholar] [CrossRef]
  56. Dragic, P.; Cavillon, M.; Ballato, J. On the thermo-optic coefficient of P2O5 in SiO2. Opt. Mater. Express 2017, 7, 3654–3661. [Google Scholar] [CrossRef]
  57. Komatsu, T.; Ito, N.; Honma, T.; Dimitrov, V. Temperature dependence of refractive index and electronic polarizability of RO–TeO2 glasses (R=Mg, Ba, Zn). Solid State Sci. 2012, 14, 1419–1425. [Google Scholar] [CrossRef]
  58. Silva, K.C.; Sakai, O.A.; Steimacher, A.; Pedrochi, F.; Baesso, M.L.; Bento, A.C.; Medina, A.N.; Lima, S.M.; Oliveira, R.C.; Moraes, J.C.S.; et al. Temperature and wavelength dependence of the thermo-optical properties of tellurite and chalcogenide glasses. J. Appl. Phys. 2007, 102, 073507. [Google Scholar] [CrossRef] [Green Version]
  59. Yoshida, S.; Matsuoka, J.; Soga, N. Crack growth behavior of zinc tellurite glass with or without sodium oxide. J. Non-Cryst. Solids 2001, 279, 44–50. [Google Scholar] [CrossRef]
  60. Watanabe, T.; Benino, Y.; Ishizaki, K.; Komatsu, T. Temperature dependence of Vickers hardness for TeO2-based and soda-lime silicate glasses. J. Ceram. Soc. Jpn. 1999, 107, 1140–1145. [Google Scholar] [CrossRef] [Green Version]
  61. Knoop, F.; Peters, C.G.; Emerson, W.B. A sensitive pyramidal-diamond tool for indentation measurements. J. Res. NBS 1939, 23, 39–61. [Google Scholar] [CrossRef]
Figure 1. Photographs of indigenously developed TeO2-ZnO-BaO TZB series prism samples.
Materials 13 05829 g001
Figure 2. (AC) Raman spectra of TZB, TZB−Nb and TZB−Mo glass systems and (DF) Deconvoluted Raman spectra of TZB−4, TZB−10Nb and TZB−10Mo glasses using Gaussian fit.
Materials 13 05829 g002
Figure 3. Mid-infrared (IR) transmission spectra of TeO2−BaO−ZnO glasses varied with different additive concentrations.
Materials 13 05829 g003
Figure 4. (A) Variation of refractive index in dependence of wavelength for TZB and TZB–10Nb glasses. (B) Variation of refractive index with photon energy, obtained using Wemple’s approximation for the experimental data of TZB and TZB–10Nb glasses. The red and blue curves indicate the two terms Sellmeier equation fit to the data.
Materials 13 05829 g004
Figure 5. Differential Scanning Calorimetric (DSC) curves (A) and Quantitative data (B) of the TeO2–ZnO–BaO glass system varied with different additive concentrations.
Materials 13 05829 g005
Figure 6. (A) Dilatometric curves, (B) Quantitative data of dilatometric glass transition temperature (Tdg) and dilatometric softening temperature (Tds), and (C) Coefficient of thermal expansion (CTE) of the TeO2–ZnO–BaO glass system varied with different additive concentrations.
Materials 13 05829 g006
Figure 7. Knoop hardness (HK) of the TeO2–BaO–ZnO glass system varied with different additive concentrations.
Materials 13 05829 g007
Table 1. Glass compositions and their labels of TeO2–ZnO–BaO glasses.
S. No.Glass LabelMolar Composition (mol%)
1TZB165TeO2–30ZnO–5BaO
2TZB260TeO2–30ZnO–10BaO
3TZB355TeO2–30ZnO–15BaO
4TZB450TeO230ZnO–20BaO
5TZB–5Nb60TeO2–25ZnO–10BaO–5Nb2O5
6TZB–7.5Nb60TeO2–22.5ZnO–10BaO–7.5Nb2O5
7TZB–10Nb60TeO2–20ZnO–10BaO–10Nb2O5
8TZB–5Mo60TeO2–25ZnO–10BaO–5MoO3
9TZB–10Mo60TeO2–20ZnO–10BaO–10MoO3
10TZB–15Mo60TeO2–15ZnO–10BaO–15MoO3
Table 2. Raman bands’ frequency and their assignment in the TZB series glass system for different modifier contents.
Optical Phonon Frequency, ν (cm−1)Assigned Vibrational Modes
TZBTZB–NbTZB–Mo
12345 Nb7.5 Nb10 Nb5 Mo10 Mo15 Mo
309300301304308310310304326338ν(Te–O) stretching and bending vibrations in TeO3+δ and TeO3 networks
428438437437439440440433436436νs(Te–O–Te) stretching and bending vibrations
671675683683681674676678678679νas(Te–O) stretching vibrations in TeO4 networks
754759769769771762758754750745ν(Te–O) stretching vibrations in TeO3 and TeO3+δ networks
----865860857900905909νs(Nb–O) stretching vibrations of bonds in NbO6 octahedra
Table 3. The glass transition temperature (Tg), onset crystallization temperature (Tx), glass stability parameter (∆T), dilatometric glass transition temperature (Tdg), dilatometric softening temperature (Tds), coefficient of thermal expansion (α) and Knoop hardness (HK) of TeO2 glasses modified with different contents of BaO, Nb2O5 and MoO3 at various concentrations.
Glass SampleTg
±2 (°C)
Tx
±2 (°C)
∆T
(°C)
Tdg
±2 (°C)
Tds
±2 (°C)
α
±0.1 (×10−6/K)
HK (kgf/mm2)Reference
TZB133644210635637714.15260This work
TZB234448313936438414.49297This work
TZB335350715437439414.74326This work
TZB436050914938039815.08325This work
TZB–5Nb38858019239943112.75321This work
TZB–7.5Nb40057617638439912.40335This work
TZB–10Nb40959818942245411.35339This work
TZB–5Mo35048713735737014.63276This work
TZB–10Mo35147112036037514.90273This work
TZB–15Mo3524085636037714.98281This work
Publisher’s Note: MDPI stays neutral with regard to jurisdictional claims in published maps and institutional affiliations.

