Article

Surfactant-Polymer Interactions in a Combined Enhanced Oil Recovery Flooding

Department of Chemical Engineering, ENTEG, University of Groningen, Nijenborgh 4, 9747AG Groningen, The Netherlands
*
Author to whom correspondence should be addressed.
Energies 2020, 13(24), 6520; https://doi.org/10.3390/en13246520
Submission received: 27 September 2020 / Revised: 3 December 2020 / Accepted: 6 December 2020 / Published: 10 December 2020
(This article belongs to the Special Issue Reservoir Simulation Studies for Enhanced Oil Recovery)

Abstract

:
The traditional Enhanced Oil Recovery (EOR) processes allow improving the performance of mature oilfields after waterflooding projects. Chemical EOR processes modify different physical properties of the fluids and/or the rock in order to mobilize the oil that remains trapped. Furthermore, combined processes have been proposed to improve the performance, using the properties and synergy of the chemical agents. This paper presents a novel simulator developed for a combined surfactant/polymer flooding in EOR processes. It studies the flow of a two-phase, five-component system (aqueous and organic phases with water, petroleum, surfactant, polymer and salt) in porous media. Polymer and surfactant together affect each other’s interfacial and rheological properties as well as the adsorption rates. This is known in the industry as Surfactant-Polymer Interaction (SPI). The simulations showed that optimum results occur when both chemical agents are injected overlapped, with the polymer in the first place. This procedure decreases the surfactant’s adsorption rates, rendering higher recovery factors. The presence of the salt as fifth component slightly modifies the adsorption rates of both polymer and surfactant, but its influence on the phase behavior allows increasing the surfactant’s sweep efficiency.

Graphical Abstract

1. Introduction

Since the last half-century the world economy has been facing a problem regarding its energy demands. The trend has been to develop new sources, sustainable and “greener”, in order to replace fossil hydrocarbons. Nevertheless, the current technologies make it actually impossible for these to replace the oil, gas, wood and/or coal derivate sources. Based on this, the possibilities are reduced to either find new fossil energy resources, or extending the lifetime and/or performance of the already mature oilfields, which are close to their economic limit of exploitation. The objective of EOR processes is to increase the latter by means of the developing of novel chemical species aimed at modifying the physical properties of the formation and/or the fluids trapped in it [1,2,3]. With respect to chemical EOR processes, the combination of two or more agents which complement each other in the recovery mechanisms may render a novel, improved technique. One of the most common combined processes is the surfactant-polymer flooding, which is the objective of this paper. This includes their synergy as well as interactions in the porous medium, known as Surfactant-Polymer Interaction (SPI) [2,3,4,5,6].

Polymer-Surfactant Flooding and Interaction

Different authors have reported about the SPI and the effects of salt on these interactions. Khan [7] presented the study of the interaction between water-soluble polymers (polyacrylamide and commercial grade partially hydrolyzed polyacrylamide) and anionic surfactants (sodium dodecyl sulfate and sodium dodecyl benzene sulfonate). He has also investigated the influence of alkali (NaOH) and salts (Na2CO3, NaCl) on the SPI. The IFT in the presence of the polymer increases (Figure 1) in both two-phase emulsion, Type II(−) (oil-in-water) and Type II(+) (water-in-oil). This is due to the interaction of the polymer molecules with those of surfactant, which reduces the concentration of the latter in the interface, increasing the interfacial tension (IFT). This increase may be counterbalanced with the addition of alkali or salts. Similar results were found by Ye [8] when studying the interaction of hydrophobically associating polyacrylamide and dodecyl dimethyl betaine (zwitterionic), observing that the air-water surface tension and oil-water IFT are reduced by the polymer presence due to the fact that the latter forms a network in the aqueous solution with the surfactant.
However, the presence of the polymer in a solution with surfactants could be beneficial in terms of the reduction of the IFT, provided that some requirements are met, which was reported by Wu [10] and Bao-dong Ma [11]. For anionic surfactants there exist vacancies between surfactant molecules at the interface due to electrostatic interaction. When the polymer concentration is lowered, its molecules enter these vacancies and form a compact mixed-adsorption layer with the surfactant, influencing the interfacial molecular arrangement and therefore reducing the IFT. As the polymer concentration increases, the surfactant molecules may decrease due to the insertion phenomenon mentioned, thus the IFT increases. When surfactant molecules interact with hydrophobically associating polyacrylamides, their hydrophobic blocks form mixed micelle-like associations with the former, inducing an increase of the IFT [11,12,13].
With respect to the numerical simulation of chemical EOR processes, it is well-known that the compositional approach is the most suitable system to model a multi-phase and -component flooding. The former has been used in order to represent CEOR techniques due to its versatility to model a certain number of components and phases, and accurately represent the properties of the latter as a function of the concentrations of the former [14,15,16,17,18,19,20,21,22]. Several authors have proposed previously the numerical simulation of combined chemical species in EOR processes. Jin [23] developed one of the most complete academic simulators for SP flooding, considering a 2D mathematical model for a three-phase, six-component system. The model takes into account phenomena such as the effect of SPI on the viscosity, IFT and adsorption. One of his main conclusions is that the SPI effects should be considered so as to match field data with the mathematical model. However, the model developed contemplates the phenomenon of degradation only in viscosity, following an exponential model. It is known however that the degradation is caused by the scission of the polymer molecules, so that the molecular weight is affected, and indirectly the viscosity [24]. By not taking the degradation into account in molecular weight, all other related properties (i.e., relaxation time, viscoelasticity and residual oil saturation) will be unaffected by this phenomenon. Yuan [19] used an implicit, parallel-based in-house simulator to study SP flooding process, considering a shear-thinning and -thickening rheology model for the polymer, although the degradation mechanisms are not considered. The model can deal with all the two- and three-phase emulsion types based on the salinity. Nevertheless, it did not consider any synergy between polymer and surfactant in the IFT or a competitive process in the rock adsorption. Besides the SP flooding studied during this paper, numerous investigations have been published on combined chemical EOR techniques similar to SP flooding. These include the injection of an alkaline solution prior to the polymer and surfactant, which is known as ASP flooding. The advantages and synergies of the three chemical components have already been described previously. Numerous laboratory tests, simulations and field data have proven that ASP flooding is one of the most efficient techniques for the recovery of medium and low viscosity oils mainly, although this technique can be effectively used for high viscosity oil fields as well. Several simulations have been reported for ASP processes using both academic and commercial software (e.g., CMG-STARS, Eclipse, UTCHEM) considering, among others: the polymer degradation, pore reduction due to adsorption processes, and ion exchange mechanisms [15,16,17,25,26,27].

2. Aim of This Work

Based on the process description and the literature review, a new simulator for a two-dimensional oilfield is proposed and developed in order to simulate the flow of a two-phase, five-component system. The presence of both surfactant and polymer affects the phase behavior and rheology of the system. The influence of the surfactant is considered adopting a ternary diagram, as published previously [28,29], while the polymer is taken into account in the viscoelastic properties and it includes the influence of the degradation mechanisms in the macromolecules [30,31]. The presence of the salt as fifth component affects the chemical species properties, which is represented as a function dependent on the total dissolved solids (TDS), assumed to be present only in the aqueous phase. Moreover, the Surfactant-Polymer Interaction (SPI) is also considered when modeling the species’ effects on the physical properties (IFT and adsorption). All in all, it is considered necessary the investigation and proposal of new mathematical models able to perform the modeling of the chemicals’ phase behavior and the polymer degradation as well as a sufficiently robust and accurate numerical discretization in order to decrease the occurrence of instabilities. The objective in this paper is to perform a study of a novel combined SP flooding simulator, focusing on the SPI effects and the presence of the salt, and how they modify the sweep efficiency [32]. This new model considers five components (water, petroleum, polymer, surfactant, and salt). A simplified ternary phase diagram is employed in order to determine the value of the concentration ratios which are necessary to solve the equations of the compositional model. From a numerical point of view, the model employs a second order discretization scheme with a TVD flux limiter to minimize numerical diffusion and dispersion phenomena. Moreover, the aqueous phase viscosity formulation takes into account the influence of all five components, from the TDS in the aqueous phase, to the surfactant contribution in both phases and finally, the influence of the polymer’s architecture and molecular weight in the aqueous viscosity. This, to our best knowledge, is not considered in previous commercial and academic simulators.

3. Model Description
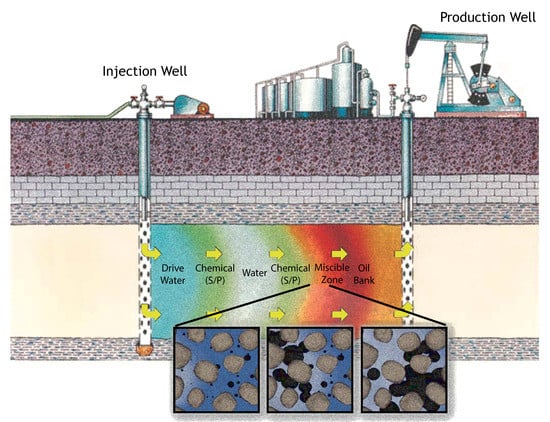
3.1. Physical Model

To model a SP flooding, a 2D physical model is used, based on geometric patterns which are usually found in the oil industry. The five-spot scheme satisfies the requirement for this research. It is represented by a square domain, with an injection well placed at the center, and four producing points located at the corners (Figure 2). During this analysis, a simplification of the model was used, known as quarter five-spot.
The physical model is represented then by a 2D reservoir ( Ω ) with an absolute permeability tensor (K), a porosity field ( ϕ ) and a formation compressibility ( c r ), which can be represented as constant or using statistic distribution functions. Moreover, the flow is considered isothermal, Newtonian for the organic phase, incompressible. Since a continuum approach is used to represent the model, the Darcy’s law is valid [33].

3.2. Mathematical Model

The numerical model comprises a system highly non-linear partial differential equations, complemented with several relationships which describe the properties of the system, namely: IFT, residual saturations, component partitioning, relative permeabilities, viscosities, rock wettability, inaccessible pore volume (IAPV), adsorption of both polymer and surfactant onto the formation, disproportionate permeability reduction (DPR), polymer degradation, surfactant-polymer interactions (SPI), and dispersion. The scheme used for the solution of this system is the IMPEC (IMplicit in Pressure, Explicit in Concentration) method. The discretization of the differential equations is done using a fully second-order stencil, complemented with Total Variation Diminishing (TVD) flux-limiting functions [34,35,36,37]. With respect to the validation, this simulator is an improvement of an algorithm previously published for surfactant flooding [28], validated against academic and commercial simulators using different recovery schemes. Thus, it is considered for this purpose that the validation was already done and reported [34,38,39]. The equations describing the fluid flow and mass transport in porous media using the Darcy approach are,
u j = K ̲ ̲ · k r j μ j · p j ; j = o , a
ϕ z i t + · j V i j · u j · j D i j ̲ ̲ · · V i j = ϕ A d i t + q i ; i = p , c , w , s , pol
D i j ̲ ̲ = d m i j · ϕ · S j · δ i j + u j · d l j u j 2 · ( u x j ) 2 u x j · u y j u y j · u x j ( u y j ) 2 + d t j · 1 ( u x j ) 2 u j 2 u x j · u y j u j 2 u y j · u x j u j 2 1 ( u y j ) 2 u j 2
ϕ c r p a t + · ( λ · p a ) = t ϕ · i A d i · λ o · p c + q t
These equations render a system parabolic PDE’s, which are discretized using a finite difference method. The terms containing pressures (Equation (5)) are solved implicitly using a centered-scheme improved with a second-order Taylor approximation in the time derivatives. The Darcy velocities are solved explicitly using the same stencil. Thus, Equations (1) and (4) are discretized as,
c r ϕ + Δ t 2 ϕ t m , n < n + 1 > , [ k ] p m , n a , < n + 1 > p m , n a , < n > Δ t [ k + 1 ] + λ x , m + 1 2 , n < n + 1 > , [ k ] Δ x 2 · p m + 1 , n a p m , n a < n + 1 > , [ k + 1 ] . . . λ x , m 1 2 , n < n + 1 > , [ k ] Δ x 2 · p m , n a p m 1 , n a < n + 1 > , [ k + 1 ] + λ y , m + 1 2 , n < n + 1 > , [ k ] Δ y 2 · p m , n + 1 a p m , n a < n + 1 > , [ k + 1 ] . . . λ y , m 1 2 , n < n + 1 > , [ k ] Δ y 2 · p m , n a p m , n 1 a < n + 1 > , [ k + 1 ] = ϕ + Δ t 2 ϕ t m , n < n + 1 > , [ k ] A d m , n < n + 1 > A d m , n < n > Δ t [ k + 1 ] + . . . + A d + Δ t 2 A d t m , n < n + 1 > , [ k ] ϕ m , n < n + 1 > ϕ m , n < n > Δ t [ k + 1 ] + λ x , m + 1 2 , n o , < n + 1 > , [ k ] Δ x 2 · p m + 1 , n c p m , n c < n + 1 > , [ k + 1 ] . . . λ x , m 1 2 , n o , < n + 1 > , [ k ] Δ x 2 · p m , n c p m 1 , n c < n + 1 > , [ k + 1 ] + λ y , m + 1 2 , n o , < n + 1 > , [ k ] Δ y 2 · p m , n + 1 c p m , n c < n + 1 > , [ k + 1 ] . . . λ y , m 1 2 , n o , < n + 1 > , [ k ] Δ y 2 · p m , n c p m , n 1 c < n + 1 > , [ k + 1 ] + q m , n t , < n + 1 > , [ k ]
u m , n < n + 1 > , [ k + 1 ] = λ x , m , n [ k ] 2 · Δ x · p m + 1 , n a p m 1 , n a [ k + 1 ] . . . λ x , m , n o , [ k ] 2 · Δ x · p c , m + 1 , n a p c , m 1 , n a [ k + 1 ] i n t 1 1 < n + 1 > · i ^ + λ y , m , n [ k ] 2 · Δ y · p m , n + 1 a p m , n 1 a [ k + 1 ] . . . λ y , m , n o , [ k ] 2 · Δ y · p c , m , n + 1 a p c , m , n 1 a [ k + 1 ] i n t 1 1 < n + 1 > · j ^
u m , n a , < n + 1 > , [ k + 1 ] = λ x , m , n a , [ k ] 2 · Δ x · p m + 1 , n a p m 1 , n a [ k + 1 ] < n + 1 > · i ^ + . . . + λ y , m , n a , [ k ] 2 · Δ y · p m , n + 1 a p m , n 1 a [ k + 1 ] < n + 1 > · j ^
where m , n are the cells in the numerical domain x , y = m · Δ x , n · Δ y , respectively, and < n > is the time-step time = < n > · Δ t and [ k ] , k N + , is the iteration number within each temporal step. The mass conservation equation is discretized using also a second-order approach. Equation (4) is the typical advection-diffusion PDE used to study the mass transport in several media. The advective terms are of hyperbolic nature, and it is known that first-order numerical schemes provoke artificial diffusion in the solution [28]. To decrease the effects of the truncation error, a fully second-order scheme is used, based on TVD flux limiters. This allows for a proper tracking of the chemical front wave and reduce the occurrence of spurious oscillations. The diffusive terms are discretized using a centered second order scheme. Moreover, a relationship is required to relate the gradient of the volumetric concentrations and these limiting functions, which depends on the ratio of the concentrations’ consecutive gradients in the numerical mesh r x , i = V i , m , n j , [ k ] V i , m 1 , n j , [ k ] V i , m + 1 , n j , [ k ] V i , m , n j , [ k ] . Hence the numerical mass conservation equation is,
C 1 Δ t z i < n + 1 > = C 2 z i < n > + C 3 Δ x · j F L I M , x j , < n + 1 > , [ k + 1 ] u x , m , n j , [ k + 1 ] · V i , m , n j , [ k ] u x , m 1 , n j , [ k + 1 ] · V i , m 1 , n j , [ k ] < n + 1 > + . . . + C 3 Δ y · j F L I M , y j , < n + 1 > , [ k + 1 ] u y , m , n j , [ k + 1 ] · V i , m , n j , [ k ] u y , m , n 1 j , [ k + 1 ] · V i , m , n 1 j , [ k ] < n + 1 > + . . . + 1 Δ x 2 · j S j ϕ d m i j m + 1 2 , n · V i , m + 1 , n j V i , m , n j S j ϕ d m i j m 1 2 , n · V i , m , n j V i , m 1 , n j < n + 1 > , [ k ] + . . . + 1 Δ y 2 · j S j ϕ d m i j m , n + 1 2 · V i , m , n + 1 j V i , m , n j S j ϕ d m i j m , n 1 2 · V i , m , n j V i , m , n 1 j < n + 1 > , [ k ] . . . 1 Δ t ϕ + Δ t ϕ t m , n < n + 1 > , [ k + 1 ] · A d i < n + 1 > A d i < n > m , n [ k ] A d i , m , n < n + 1 > , [ k ] Δ t · ϕ < n + 1 > ϕ < n > m , n [ k ] + . . . + q i , m , n < n + 1 > , [ k + 1 ] + j u x , m , n j , [ k + 1 ] Δ t 2 ϕ m , n < n + 1 > , [ k + 1 ] · A d x ϕ t + A d 2 ϕ t x + ϕ x A d t i , m , n < n + 1 > , [ k ] + . . . + j u y , m , n j , [ k + 1 ] Δ t 2 ϕ m , n < n + 1 > , [ k + 1 ] · A d y ϕ t + A d 2 ϕ t y + ϕ y A d t i , m , n < n + 1 > , [ k ] . . . j u x , m , n j , [ k + 1 ] Δ t 2 2 A d t x + u y , m , n j , [ k + 1 ] Δ t 2 2 A d t y i , m , n < n + 1 > , [ k ] + . . . + j Δ t 2 ϕ m , n < n + 1 > , [ k + 1 ] u x , m , n j , [ k + 1 ] 2 2 V i , m , n j , [ k ] x 2 + u y , m , n j , [ k + 1 ] 2 2 V i , m , n j , [ k ] y 2 + 2 u x , m , n j , [ k + 1 ] u y , m , n j , [ k + 1 ] 2 V i , m , n j , [ k ] x y < n + 1 >
and the coefficients C 1 , 2 , 3 are calculated as follows,
C 1 = ϕ m , n + Δ t ϕ t u t x , m , n Δ t 2 ϕ m , n ϕ x u t y , m , n Δ t 2 ϕ m , n ϕ y < n + 1 > , [ k + 1 ] C 2 = ϕ m , n Δ t u t x , m , n 2 ϕ m , n ϕ x u t y , m , n 2 ϕ m , n ϕ y + u t x , m , n Δ t 2 ϕ m , n 2 ϕ t x + u t y , m , n Δ t 2 ϕ m , n 2 ϕ t y < n + 1 > , [ k + 1 ] C 3 = 1 Δ t 2 ϕ m , n ϕ t < n + 1 > , [ k + 1 ]

4. Physical Properties

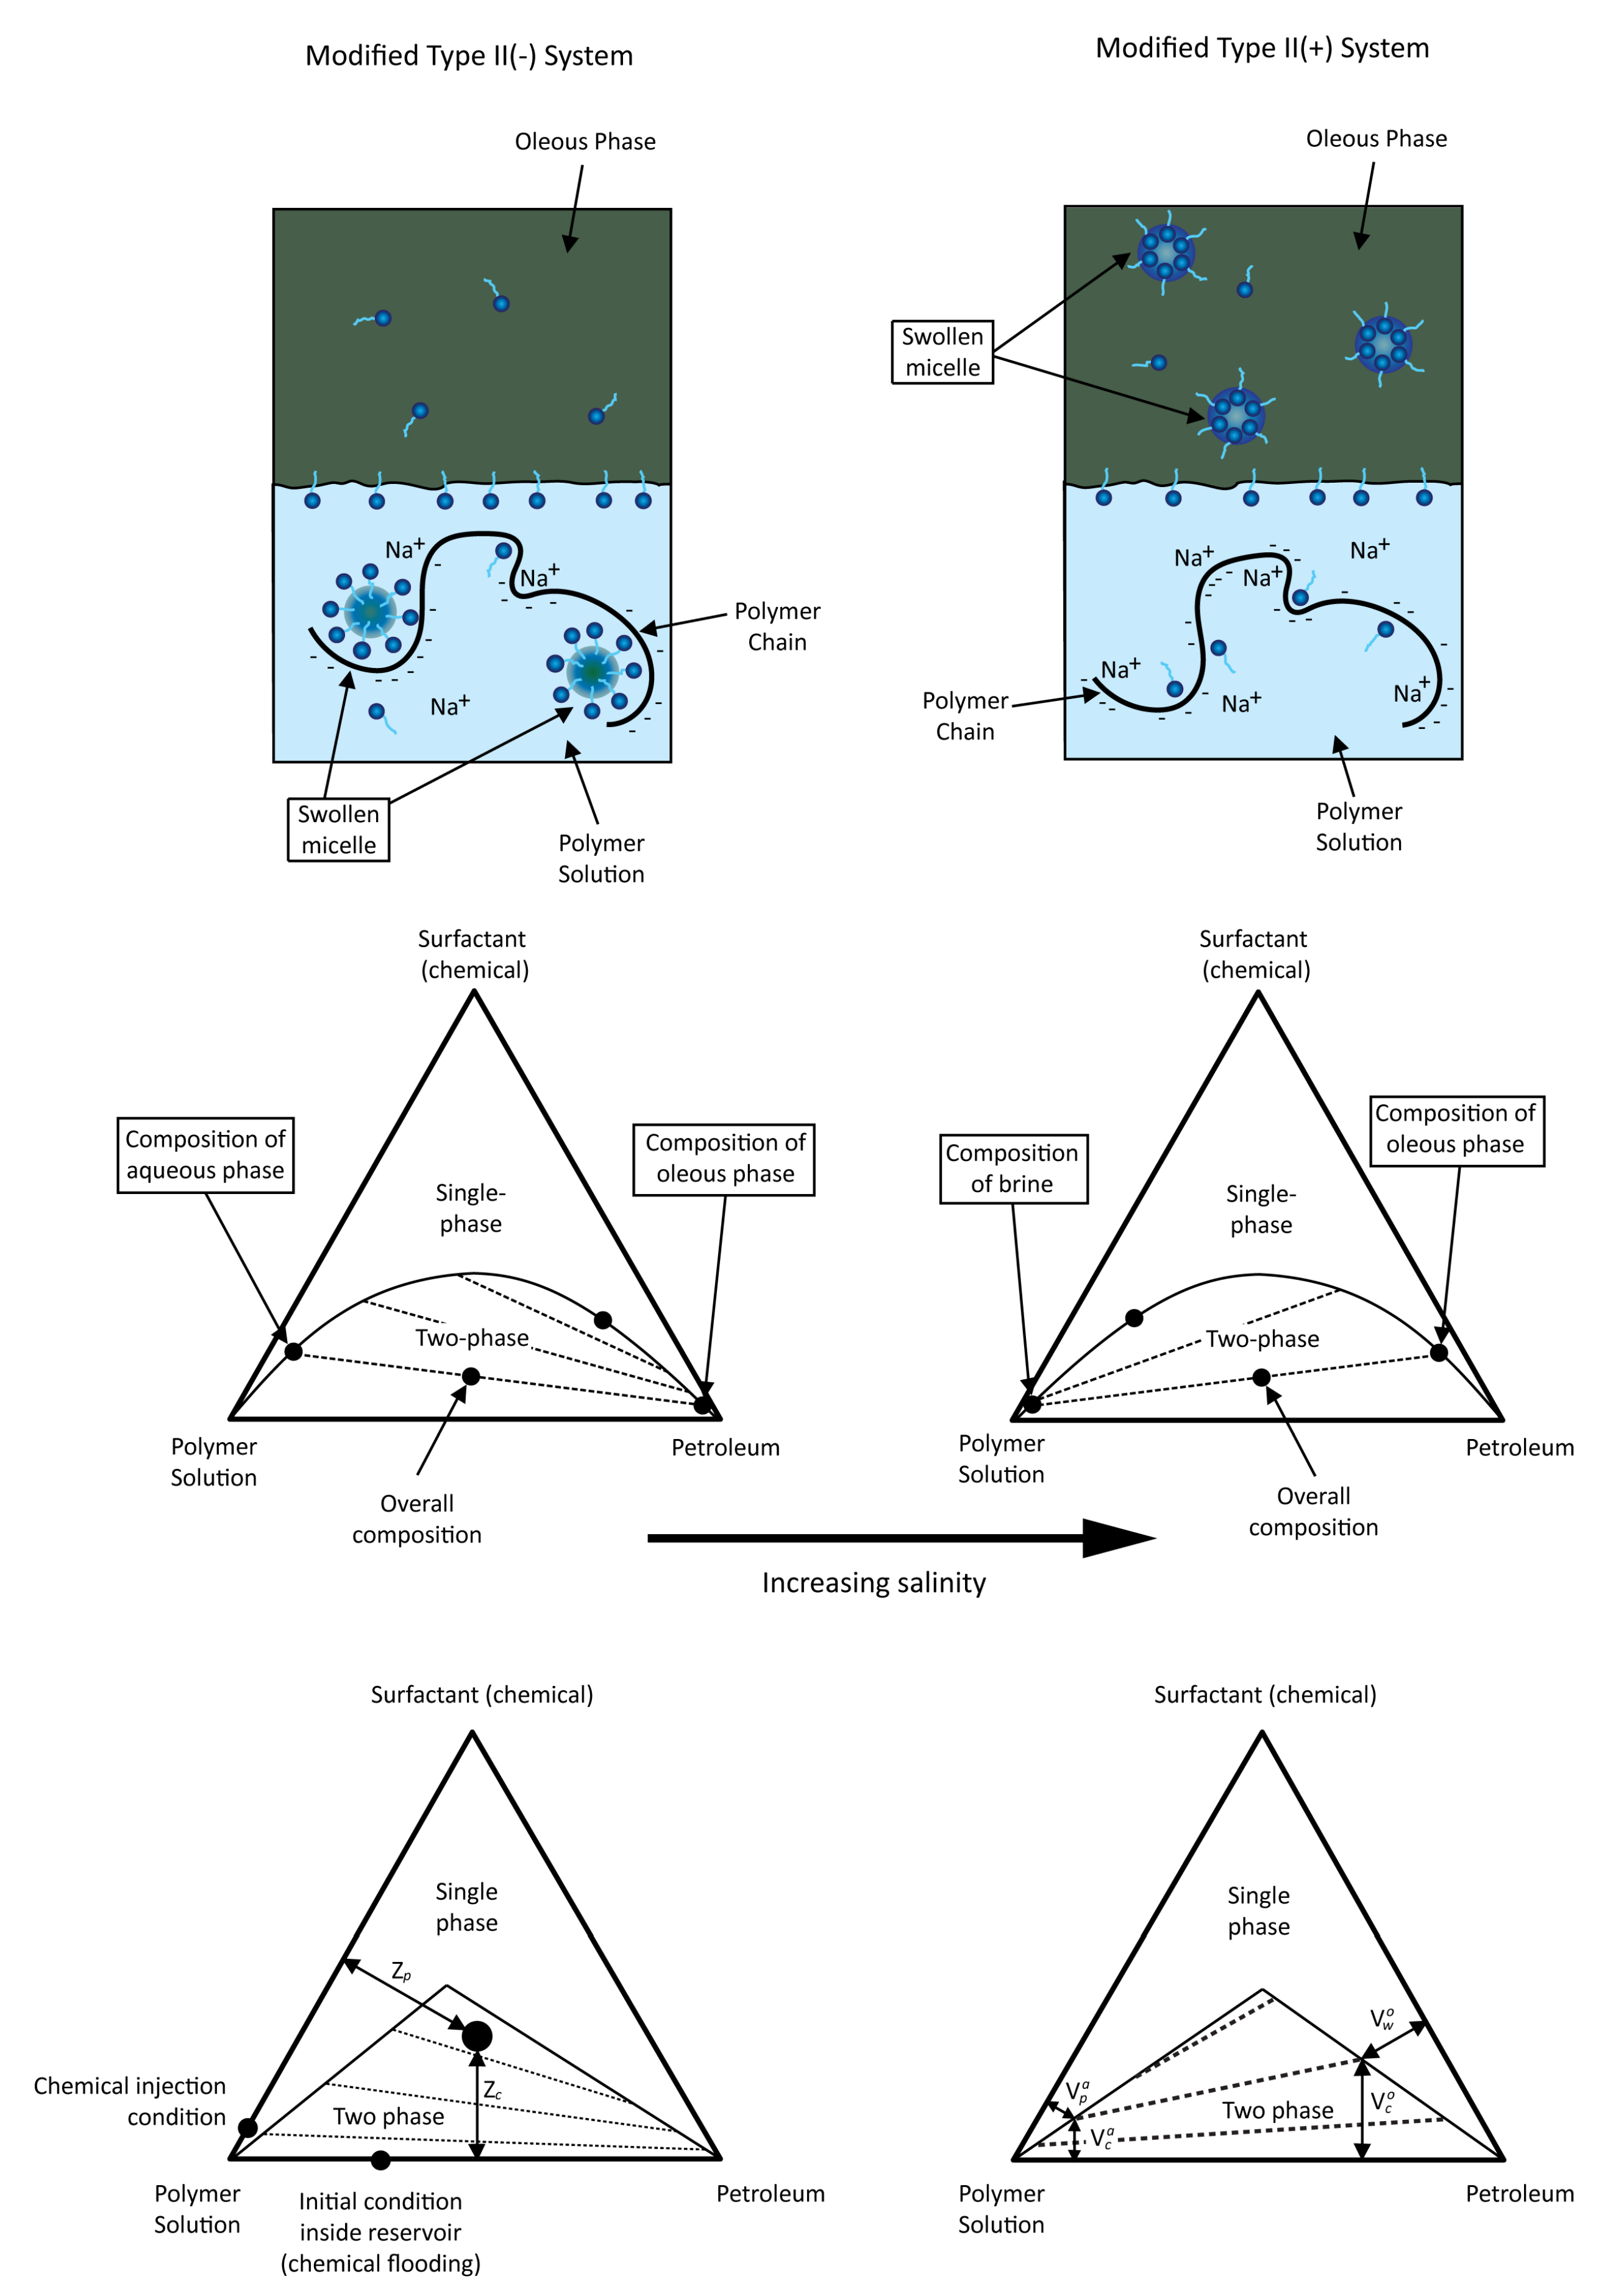
4.1. Chemical Component Partitioning

The chemical component partitioning in a compositional simulator describes how the species are distributed in the phases. In a combined SP flooding, this can be also modeled using the same approach followed by standard surfactant systems, i.e., using a ternary phase diagram (Figure 3) [40,41,42]. It is considered that the surfactant can be present in both the aqueous and organic phases, while the polymer and salt are present only in the aqueous phase, independently of the emulsion present in the reservoir [3,32]. Therefore, the following parameters allow determining the partitioning of surfactant, water and petroleum components in the two phases,
Solubilization Coefficient = L p c a = V p a V c a
Swelling Coefficient = L w c o = V w o V c o
Partitioning Coefficient = k c = V c o V c a
The value of the partitioning coefficient determines two different emulsions: Type II(−) (if k c < 1 ), and Type II(+) (if k c > 1 ). The coefficient k c > 1 is a function of the composition (i.e., surfactant) as well as the water properties, such as salinity. This is modeled in this paper as a piece-wise function of the salinity (Equation (13)) [32,43].
k c = 10 2 V s a V s , o p t a 1 if V s a > V s , o p t a 10 2 1 V s a V s , o p t a if V s a < V s , o p t a
The remaining relationships are obtained from the salt and polymer partitioning. These are only present in the aqueous phase ( V s o = V p o l o = 0 ). All things considered, these five relationships determine the equations numerically. Figure 3 depicts the adopted five-component model system, including its representation in the ternary diagram, such as those used with surfactant flooding.

4.2. Interfacial Tension

The interfacial tension is a function of the several chemical species concentrations used during the EOR process, being affected mainly by the surfactant concentration, followed by the salt and the polymer [33,41,44,45,46]. In this paper, following the same approach as in previous reported simulators, a step-wise system is followed to consider the influence of the different species on the IFT. Firstly, the importance of the salt is quantified, calculating the IFT in an oil/water/salt system, expressed in Equation (14) [47].
σ s a l t o w = σ H o w + 0.0334 · T · ln 1 + 4.43 · V s a
where σ H o w is the interfacial tension of the original water-oil system and T is the temperature of the domain. Secondly, the influence of the surfactant is calculated. This is done using the following formulation, based on the emulsion type. For Type II(−) systems (oil-in-water):
log ( σ c ) = log ( F ) + ( 1 L p c a ) · log ( σ H ) + . . . + G 1 1 + G 2 · L p c a ; L p c a < 1 log ( σ c ) = log ( F ) + G 1 1 + L p c a · G 2 ; L p c a 1
For Type II(+) systems (water-in-oil):
log ( σ c ) = log ( F ) + ( 1 L w c o ) · log ( σ H ) + . . . + G 1 1 + G 2 · L w c o ; L w c o < 1 log ( σ c ) = log ( F ) + G 1 1 + L w c o · G 2 ; L w c o 1
Constants G 1 and G 2 are constant parameters, and the term F can be obtained according the following equation [43],
F = 1 e i = p , w , c ( V i o V i a ) 2 1 e 2
The water-oil IFT system is considered constant throughout the simulation. Finally, the influence of the polymer on the IFT is done by proposing a novel formulation, considering the surfactant concentration and partitioning coefficient [7,8,11,13,48,49,50,51,52].
σ = σ c · 1 + I F T p o l K · V p o l a 1 + e k c · Z c Z c c r i t I F T p o l n
I F T p o l K = I F T p o l K m a x · 1 e C p o l · V p o l a
The terms I F T p o l K m a x , Z c c r i t , I F T p o l n and C p o l are constants of the model. The term I F T p o l K follows then an exponential law, with the influence of the polymer negligible as its concentration goes to zero. The partitioning coefficient was included in this formulation, since it is assumed that the polymer’s influence is inversely proportional to the former, due to the fact that the surfactant is only in the organic phase when k c 1 (Figure 4). Below a certain concentration, the influence of the polymer is not considered. It is deemed that further research must be done in order to improve the proposed formulation in this paper with the values of IFT exhibited by different polymer-surfactant systems, considering the architecture of these molecules as well.

4.3. Adsorption

The adsorption takes place when either the surfactant or polymer molecules form onto the rock surface. This (ir)reversible phenomenon causes a loss of the chemicals in the porous media, rendering the process economically not attractive in case of high adsorption rates. The reason of this is that extra chemical is necessary and the interfacial properties are not optimal. The adsorption rate is dependent on the rock properties, the type of chemical agents, and the type of electrolytes present in the solution. Because of the IAPV phenomenon, the polymer will tend to flow in front of the surfactant slug and thus is “sacrificed” for adsorption [32,53,54,55]. Thus, the rock will be covered by a layer of polymer molecules, hence fewer sites are available for surfactant adsorption to occur, a process known as competitive adsorption. To consider this, the scheme used in UTCHEM was adopted, developing a formulation that relates the surfactant adsorption with the adsorbed polymer, and vice versa [56,57,58,59,60].
F S P = 1 A d p o l A d m a x , p o l · F a d s F S P p o l = 1 A d c A d m a x , c · F a d s p o l
A d p o l , c is the polymer/surfactant adsorbed, A d m a x , p o l , c is the asymptote of the Langmuir equation for the adsorption process. The terms F a d s and F a d s p o l are tunable parameters to adjust the adsorption due to the competitive process mentioned earlier. Therefore, the adsorption of both chemical species is calculated as,
A d c , p o l = min Z c , p o l + A d c , p o l , F S P ( p o l ) · a 1 , c , p o l · Z c , p o l 1 + a 2 , c , p o l · Z c , p o l
Because the multiplier F S P ( p o l ) , the surfactant asymptote is unchanged ( F S P ( p o l ) = 0 A d c , p o l = 0 ) or reduced ( F S P ( p o l ) 0 A d c , p o l 0 ). On the contrary, if the surfactant is injected before the polymer, the rock will be covered by surfactant and thus the polymer adsorption will be hindered. The Langmuir adsorption parameter a 1 , p o l , c is function of the salinity present in the reservoir [43].
a 1 , c = ( a 11 , c + a 12 , c · C S E ) a 1 , p o l = ( a 11 , p o l + a 12 , p o l · C S E P )
The term C S E is the surfactant effective salinity, considering the concentration of dissolved salts in the non-organic phase, the thermal effects, and the fraction of divalent cations bound to surfactant micelles [43].
C S E = V s a · 1 1 β d i v f d i v · 1 1 + β t e m p T T r e f
The term C S E P , known as the polymer effective salinity, is not considered constant throughout the simulation and domain, and it is estimated according to the following equation (salt is considered the fifth component in the system),
C S E P = V s a + β p o l 1 C D I V a V w a
where C D I V a is the divalent cations concentration in the aqueous phase, which it is considered in this case to be negligible. Moreover, the constant β p o l should be obtained from laboratory measurements [43].

5. Results and Discussion

5.1. Introduction

The aim in this paper is to study the influence of the adsorption in a combined SP flooding, considering firstly a four-component system (no salt). Therefore, four different injection schemes are presented: polymer injected in the first place, followed by the surfactant (separated/overlapped) and vice versa. Moreover, the importance of the SPI is also studied, and how this affects the adsorption rates of the chemical species being injected in the second place. Secondly, the five-component system is tested, discussing as well the importance of the salt in the adsorption process, considering also its influence in the surfactant’s phase behavior. This is done by replacing the injection water with a brine of constant salinity.

Data

Following the scheme adopted in a previous study [28], the most important parameters of the simulation and the physical properties are established to represent an oilfield after a primary recovery, which is considered to be the target of the combined EOR processes (Table 1 and Table 2).

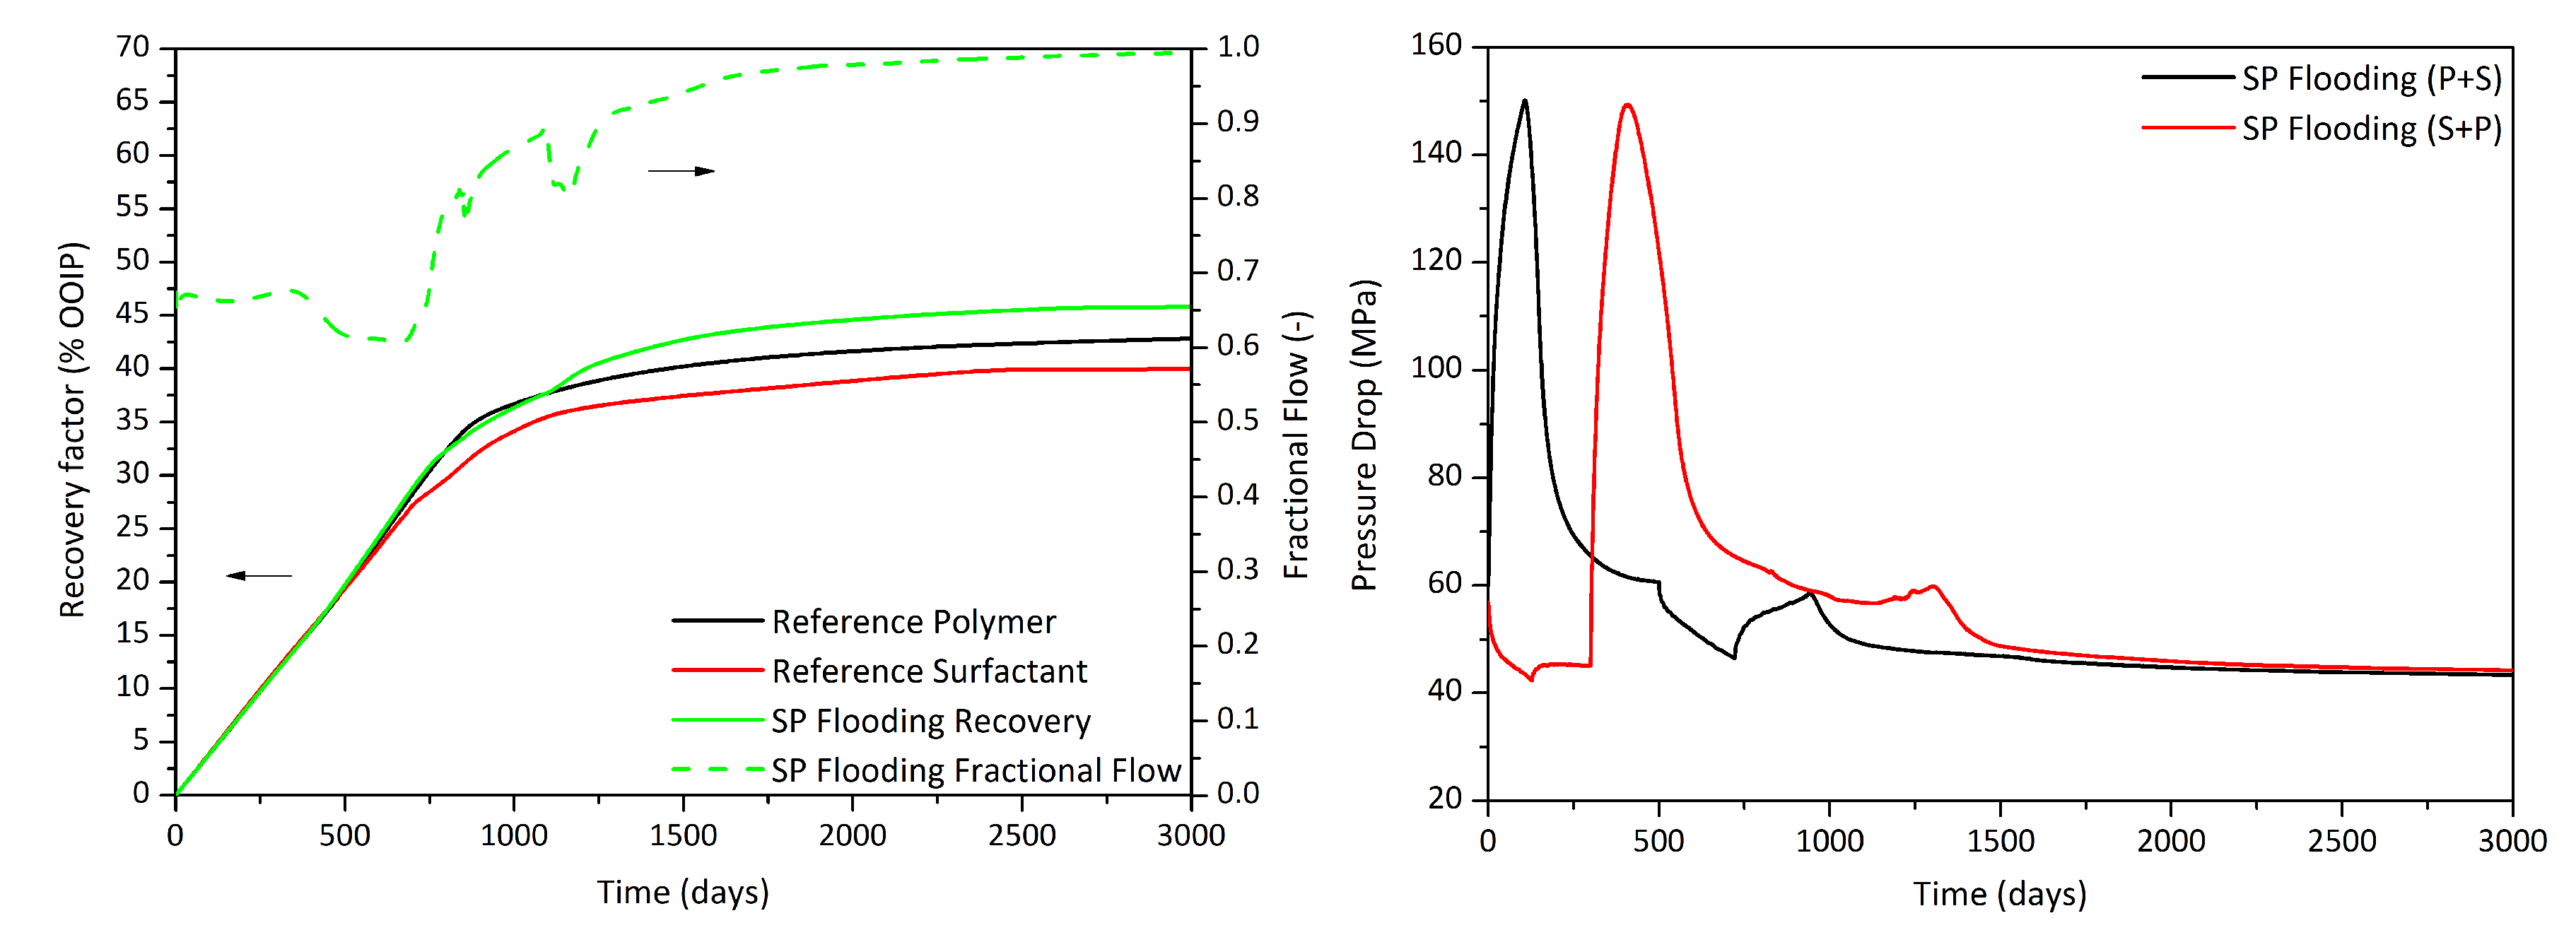
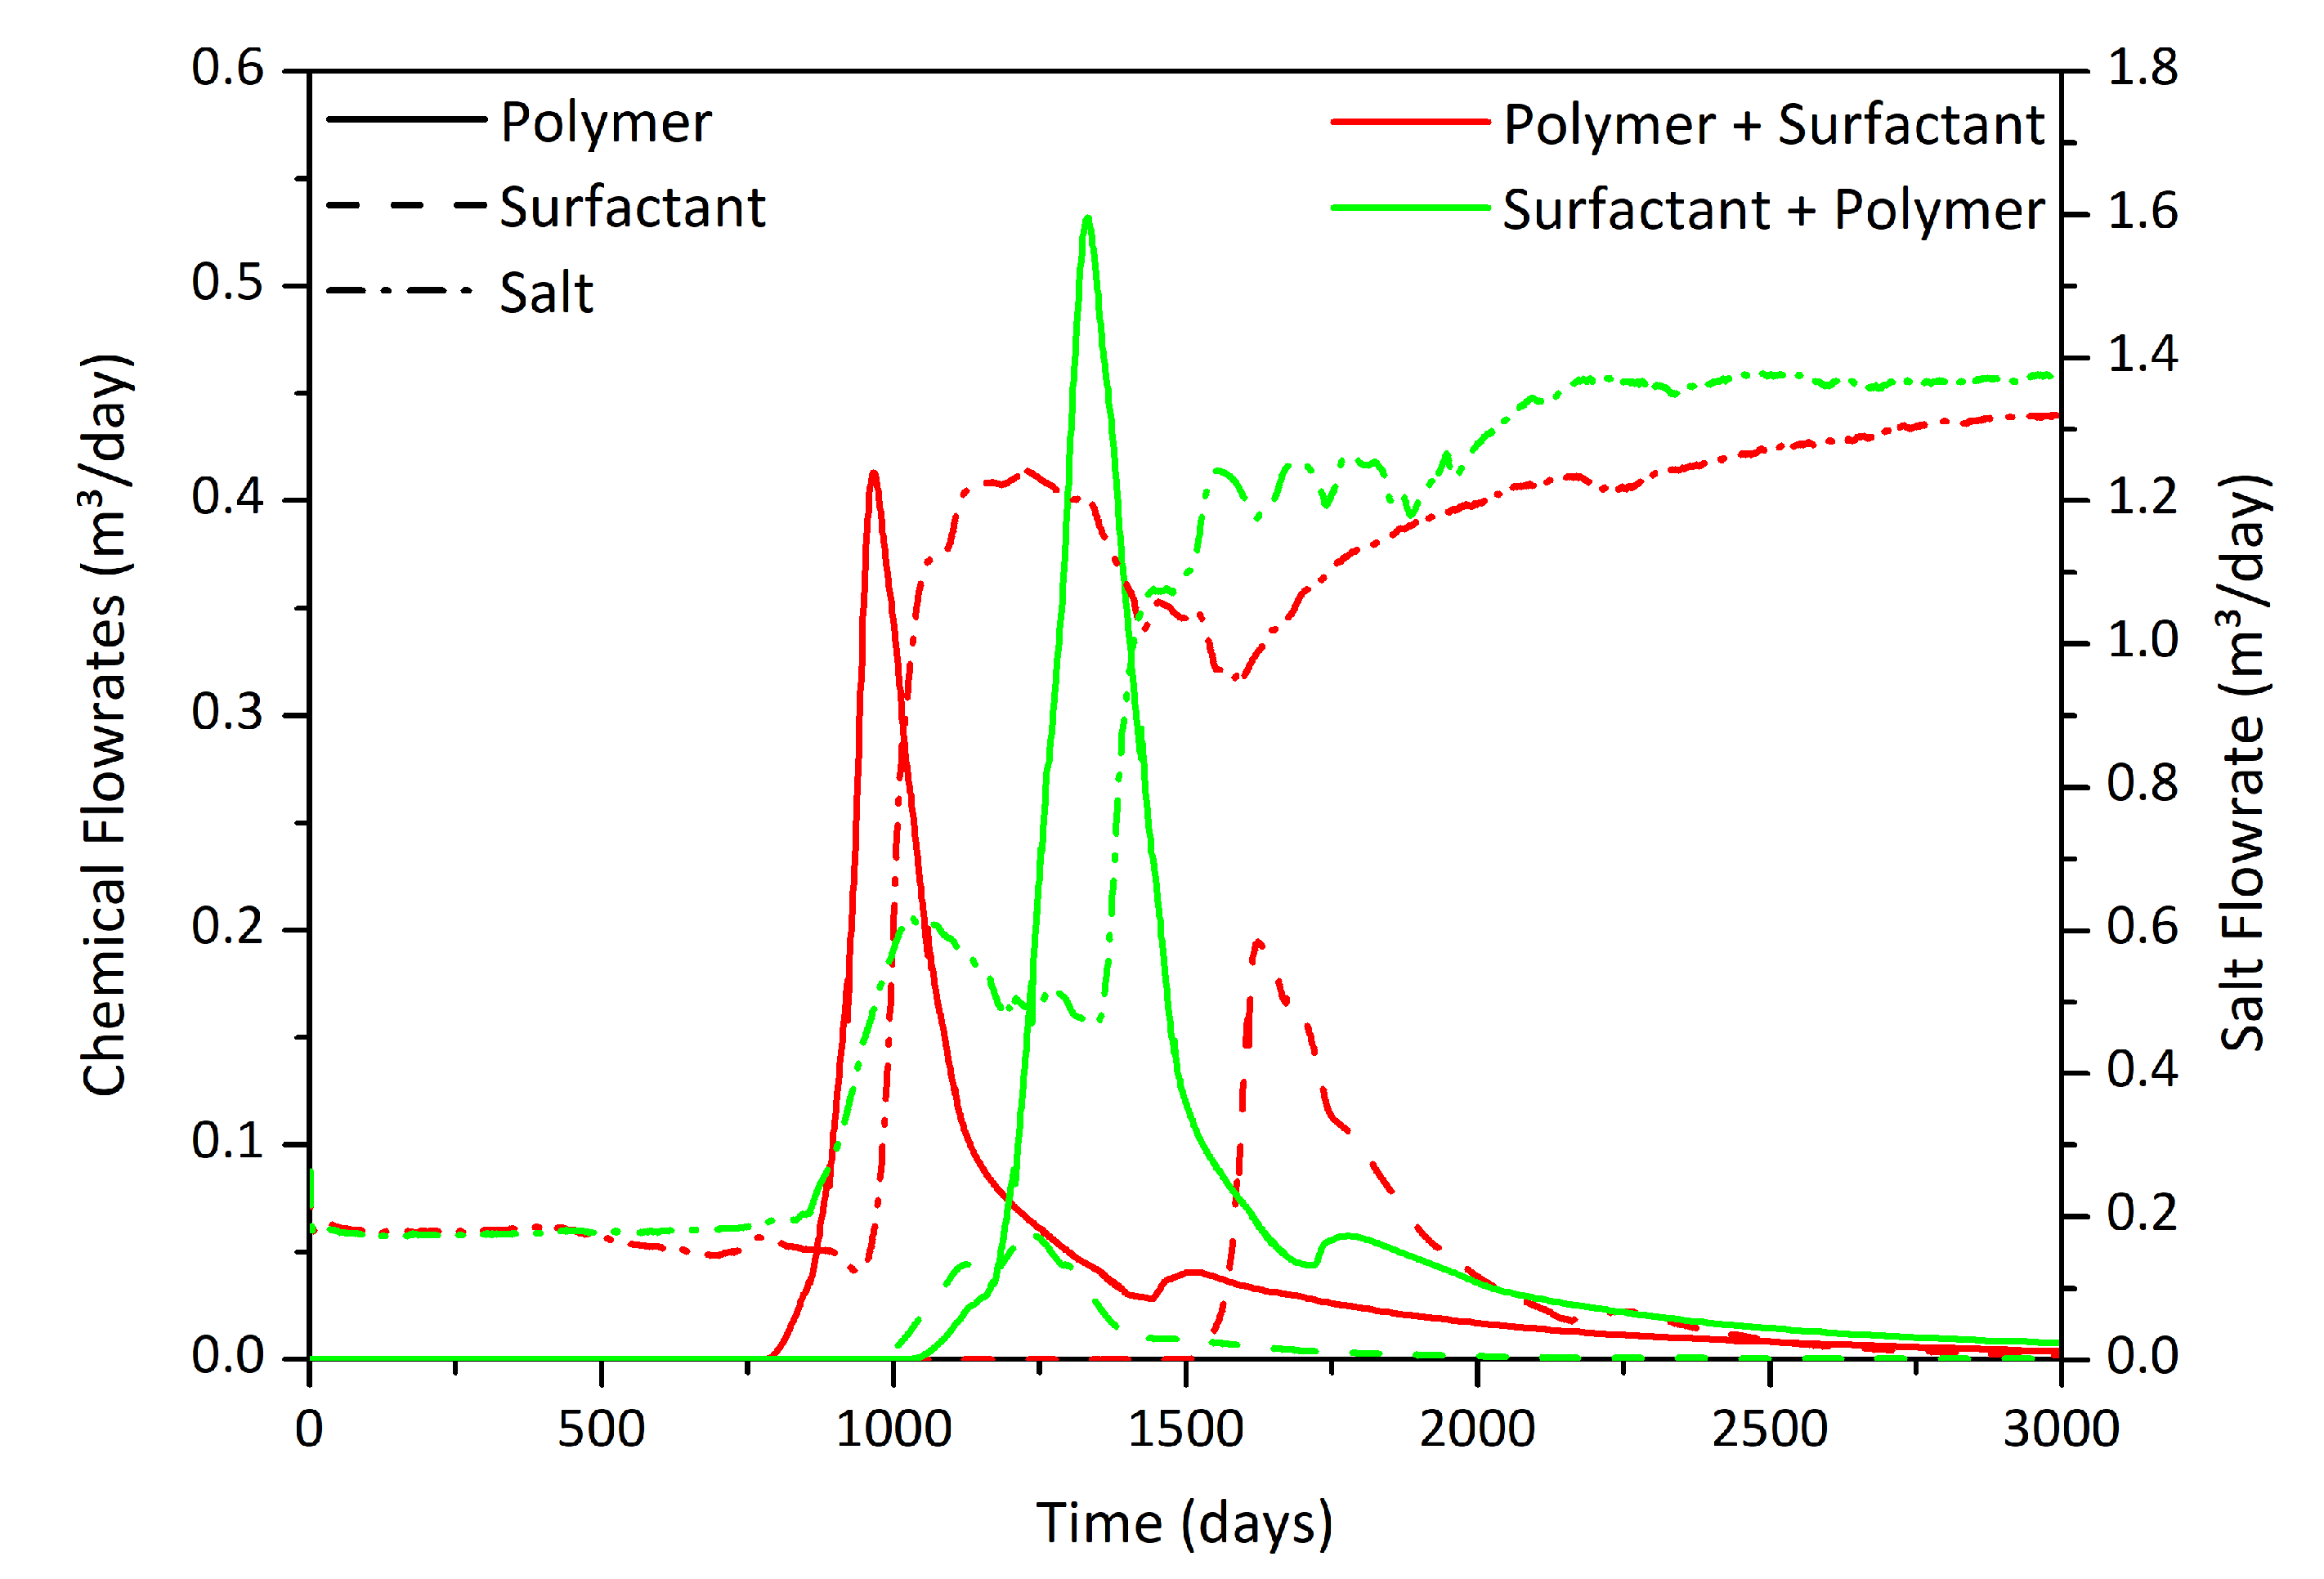
5.2. Influence of the Adsorption and the Surfactant-Polymer Interaction

It is known in combined chemical EOR processes that the injection order, and also the time gap between the slugs, play a critical role in the recovery process. The goal in this section is to study the influence of the adsorption in this order, as well as the SPI, more specifically the competitive adsorption process between polymer and surfactant, which is taken into account in the model in Equations (20) and (21). Parameters F S P , F S P p o l and F a d s directly affect the amount of chemicals adsorbed by the porous medium. Both F S P and F S P p o l depend on a competitive adsorption parameter. To understand the influence of these new terms, several simulations were performed according to the schemes previously mentioned. Therefore, the simulation comprises reference cases, i.e., polymer and surfactant flooding, and then a series of SP simulations with different injection orders. In the latter, the adsorption of either the polymer or the surfactant will affect the maximum adsorbed amounts of the other chemical species, depending on the other of injection. Consequently, the sacrifice of the chemical species injected in the first term will benefit the recovery efficiency of the second. This should be studied in more detail in case the surfactant is injected first but with an overlap with the polymer slug. Due to the IAPV, the molecules of the latter will flow through the reservoir more quickly and in the vicinity of the producing well the latter will become the species being sacrificed. This is the reason a bidirectional influence (between the chemical species) when considering adsorption in SP or ASP flooding should be adopted.
The physical properties and operating conditions of the phases under study were maintained from the previous section. For the purposes of these simulations a competitive adsorption factor equal to 1.5 was initially assumed. However, the influence of the fifth component has not been considered yet, which affects the process of adsorption and phase behavior. This will be discussed in the next section. Table 3 and Figure 5 and Figure 6 present the results of these simulations. The adsorption constants adopted for this study are a 11 , c = a 11 , p o l = 0.25 , a 2 , c = a 2 , p o l = 3 , a 12 , c = 5 , and a 12 , p o l = 2 .
The trend and behavior obtained in the previous point was confirmed again, in this case considering the phenomenon of adsorption. Efficiencies in oil recovery, both in reference cases and in SP flooding, decreased according to what expected. Adsorption mainly affects the chemical species being injected first, which acts as a sacrificial agent. In the case of the polymer, this is manifested in a loss of the viscosifying properties and therefore in the mobility ratio. For surfactant, adsorption affects the reduction of IFT and therefore decreases the Capillary Number, which affects the amount of oil that can be displaced by the chemical flooding. In this case, the polymer rendered slight better recovery factors than the surfactant, although this must not be always the case. The performance of these two agents separately depends on many factors to be considered, namely: viscosifying properties, viscoelastic characteristics, adsorption rates, molecules’ architectures, interfacial properties, as well as the porous medium being studied, e.g., its wettability, porosity and permeability. All these factors combined determine the sweep efficiency of the EOR agents.
The competitive adsorption phenomenon is shown in Table 4 and Figure 7, Figure 8 and Figure 9. The oil saturation profile from Figure 7 can be compared when the adsorption is considered, against a reference case. The loss of viscosifying properties is visible in the polymer front wave, diminishing the sweep efficiency and tending to render a waterflooding pattern (Figure 7 and Figure 8). The influence of the injection order is evident in the amount of chemical lost in the reservoir. In the case that the polymer is injected in the first term, the order of injection together with the IAPV causes that the amount of surfactant adsorbed to be smaller in the whole domain and that the main losses occur with the former. In contrast, when the injection order changes, in the region near the injector well the loss occurs in the first element, so the amount of surfactant is mostly affected (Figure 6). Then, due to the IAPV, the polymer slug reaches the surfactant and the former becomes the sacrificial element, reason the adsorbed amount of the surfactant decreases. Table 4 presents the influence of the competitive adsorption factor in the recovery process. This parameter is an indication of the hindrance to the adsorption process of the chemical being injected in second place (Figure 9). As this factor increases, the adsorption of the latter decreases and therefore the recovery efficiency increases. The estimation of this factor should be also carefully evaluated in laboratory experiments with the surfactant, polymer and the rock formation to be used, since an incorrect estimation might lead to lower recoveries than expected.
Therefore, the adsorption process does not modify the optimum injection order in SP flooding. Injecting the polymer slug in the first term, followed by the surfactant after a short water bank, rendered the best recovery results. However, the recovered oil values were obviously affected by this process and therefore this should be taken into account in chemical flooding processes, both from a technical and economic point of view. Adsorption process is the most significant for chemical EOR processes, for both standard and combined techniques.

5.3. Adsorption in a Five-Component System

During this study the efficiency of a combined SP flooding process was studied, focusing on recovering medium/low viscosity oils. This study included the analysis of the order of injection, the start time of the EOR process and then the influence of adsorption on a combined chemical process. This phenomenon depends on the salt content present in the reservoir. The last part of this paper is then dedicated to the discussion of the process under the influence of adsorption when the salt is present. This involves the simulation of a two-phase system and five pseudo-components. According to the formulation used, the presence of the salt affects the parameters a 2 , c , p o l of the two chemicals species, surfactant and polymer. It is assumed an isothermal system and the presence of divalent cations to be negligible; hence, the effective salinity is equal to the salt concentration in the aqueous phase (Equations (22)–(24)). Based on this system, a series of simulations were carried out using different injection orders in order to infer conclusions about the optimal scheme for SP flooding and how the salt affects the combined EOR process. The results of these simulations, together with the reference cases, are presented in Table 5 and Figure 10 and Figure 11.
As previously noticed, the injection of the polymer before the surfactant achieved the highest recovery factors, even though the difference in this case is smaller than in previous simulations. The best results are obtained when the water bank between chemical slugs is reduced to a minimum. The injection of the polymer in the first stage has several possible advantages: the viscosifying properties of the polymer help to create an uniform displacement front (also in heterogeneous formations), which improves the behavior of the surfactant slug injected afterwards. Furthermore, the polymer front also sweeps part of the TDS initially found in the reservoir, which may hinder the performance of the surfactant slug. When slugs are injected with a large time difference, the result resembles more than two separated chemical EOR processes, rather than a combine one. If the difference between injections decreases, the influence of one chemical on the other becomes more evident and this is reflected in the recovered oil (Figure 10—left). Analyzing the latter in particular, it is observed that the differences in recovered oil are minimal and they could be improved since there are several parameters influencing the process, namely: slug size, injection time, viscosifying properties of the polymer. Then, although the results agree with what was published in the literature, [21,53,54,60] simulations of an SP process could also agree with what Sheng [32] obtained in his 1D homogeneous models. Another important point to be considered is the presence of the salt and how this affects the recovery process. In the present simulation, a theoretical study of the influence of this component was carried out, considering a simplified salinity profile in the rock. In future studies, these simulations should be complemented with laboratory or field studies which can improve the comprehension of the profiles found in the reservoir as well as the influence of the salt in the sweep process of the EOR agents. As conclusion, further studies are necessary to determine if there is an optimal injection scheme for the SP process, or whether the order depends on the physical parameters of the porous medium and fluids.
The pressure drop (Figure 10—right) was also indirectly affected by the presence of the salt, since the latter modifies negatively the zero shear-rate viscosity of the polymer solution and therefore the pressure drop sharply dropped when compared to previous cases. The chemical flowrates (Figure 11) show the influence of the adsorption together with the injection order and the IAPV. The difference in the chemical breakthrough times in the case where the polymer is injected first is clearly visible, while in the opposite injection scheme both chemical reach the producing well at approximately the same time. The difference in the flowrates is evidence of the adsorption and the “sacrificial” process the first chemical suffers in the porous medium.
The salt affects the phase behavior properties in the surfactant flooding. The model adopted for the simulations, in terms of initial and injected salt content, was determined to obtain partitioning coefficients of the same order as those used in previous simulations. However, these are now functions of position, time and salt concentration, and not constants as in the previous points. Salt affects the maximum values of adsorption, which causes a detriment in the recovered oil, as shown in Figure 12, Figure 13 and Figure 14. This has affected both the properties of the polymer, causing a decrease in the viscosities of the aqueous phase, and in the interfacial properties in the surfactant slug. The salt in the model also affects the competitive adsorption process: although the competitive adsorption factor is not affected by this component, the isothermal adsorption curves are indeed affected by the former, as they depend on Equations (20) and (21). Salt has negative consequences for the recovery process, both from a technical and economic point of view. The decrease in the sweep efficiency increases the operating times and can decrease to a certain extent the recoverable maximum oil. Economically speaking, this translates into longer operating times and thus higher associated costs. In conclusion, the adsorption parameters must be carefully studied for each porous medium before beginning any EOR process of chemical recovery. In discussing the properties of the chemicals used, a desirable characteristic would be to reduce as much as possible the influence of salt (both mono- and divalent ions) on the properties of the polymers and adsorption rates without affecting significantly the phase behavior in the surfactant flooding. There are currently several lines of research developing improved chemical EOR agents, which are focused on the relationship between the molecules’ architecture and the associated chemical properties. For instance, the use of hyperbranched polymers instead of the traditional linear ones, which exhibit a stronger resistance to the TDS, as well as improved rheological and viscoelastic properties compared to traditional polymers. Furthermore, in recent years a new type of EOR agent has gained momentum, i.e., the polymeric surfactants: these combine the viscosifying properties of polymers with the interfacial capabilities of surfactants, and present a great potential for application in EOR processes [12,29].
Considering the system’s behavior and all the previous cases as well, it is observed that although the polymer in the preflush maximizes the recovery efficiency, this system is more sensitive to the adsorption and the presence of the salt than the cases when the polymer is injected after the surfactant. The results of this analysis are shown in Table 5. Evaluating the four possible schemes, the greatest decrease in the oil recovery factor occurred in the schemes where the optimal results were obtained. This is because in these cases, the polymer acted as a sacrificial agent and this caused a decrease in the viscosity of the aqueous phase, which affected the mobility ratio and the sweep efficiency. The surfactant injected thereafter, although it diminished the IFT and modified slightly the aqueous viscosity, did not manage to displace the remaining oil with the same efficiency due to the difference between the viscosities of both phases, which yielded an even greater mobility ratio. This is shown in Figure 12 and Figure 13, where the final oil saturations are presented for the two schemes which rendered the best results in terms of oil recovery. When the polymer is injected before, the sweep efficiency in the domain due to adsorption decreases and higher oil saturation values are obtained at the vertexes of the model, the farthest points from the wells. Nonetheless, while the sweep efficiency decreased, the surfactant achieved a better sweep in the area near the injector well, so that residual oil saturation values achieved are lower than those when the polymer is injected in second place.
The chemical slug propagation and its influence on the aqueous phase properties are shown in Figure 14 and Figure 15. While the shape and mass transport are not affected neither the adsorption nor the presence of the salt, their values are. The polymer adsorption profile (Figure 15—right) is also different from the one obtained for the surfactant. This is related to the combined process and the mobility ratio. The polymer slug has a better areal sweep efficiency than the one of the surfactant, and so the adsorption patter is spread throughout the domain. In the case of the surfactant, this was limited by the presence of the polymer slug injected first (Figure 9—right).
This is one more reason to consider that more studies are needed to determine if there is really an optimal scheme for every type of rock formation in SP flooding processes. As it was already noted, in the simulations with five components both injection schemes yielded practically similar recovery results. Therefore, it is deemed that both the size and the temporal positioning of the slugs should be evaluated in simulations and laboratory tests before beginning the EOR process in order to maximize the results. These studies should consider the properties and conditions of the fluids and the porous medium and should serve as input for the selection and/or possible design of chemical agents for the flooding process.

6. Conclusions

This paper aimed at continuing the study of a combined SP flooding simulator, developed for a 2D porous medium and a two-phase, five-component system. The numerical model is described by a set of partial differential equations (parabolic and hyperbolic/parabolic) representing the aqueous phase pressure and the mass continuity in the domain. This model was discretized using a second-order finite difference stencil, coupled with TVD flux limiters which proved to diminish the numerical diffusion and dispersion, improving the chemical front-tracking. The scenarios in this paper aimed at studying the influence of the adsorption, the SPI and the salt on the injection scheme and on the overall recovery performance. A set of benchmark cases was simulated, followed by four different possible SP configurations. The polymer being injected first and with the surfactant slug slightly overlapped yielded the best sweeping efficiencies, although this difference was subtle, which is similar to previously published results.
Notwithstanding the surfactant-polymer interaction (SPI) had not shown a noticeable effect in both the IFT and the viscosity, it affected noticeably the adsorption, and therefore, the final recovery efficiency. This could have a major economic effect in the whole process, since the surfactant adsorption is one of the main disadvantages in chemical EOR processes. Sacrificing the polymer may result in major economic enhancement with respect to traditional EOR techniques, but more simulations and experiments are deemed necessary in order to determine if this applies to every rock formation and/or every chemical (polymer and surfactant) couple. The second part of this paper considered the influence of the salt on the abovementioned phenomena, which did not modified the general results and injection schemes, but it affected mainly the adsorption rate parameters, diminishing the oil recovered.
Combined chemical EOR processes present a great potential in order to further increase the recovery factors after waterflooding, when the chemical agents being used complement each other in the recovery mechanisms. As conclusion, it is also considered that the research on the development of “green” polymers, polymeric surfactants and surfactants for such kind of process is also advisable. This is a field where product technology could use the tools to synthesize new chemicals in order to improve the efficiency and/or reduce the exploitation costs.

Author Contributions

Methodology, Formal Analysis, Validation, Investigation, Resources, Writing-Original Draft Preparation, Supervision, P.D.; Writing-Review & Editing, Project Administration, F.P. All authors have read and agreed to the published version of the manuscript.

Funding

This research received no external funding.

Acknowledgments

P.D. gratefully acknowledges the support of the Erasmus Mundus EURICA scholarship program (Program Number 2013-2587/001-001-EMA2) and the Roberto Rocca Education Program. P.D. is also thankful to Aleksandra Piekorz and Mikesz Latocha for the insightful discussions and advices.

Conflicts of Interest

The authors declare no conflict of interest.

Abbreviations

The following abbreviations are used in this manuscript:
EOREnhanced Oil Recovery
TDSTotal Dissolved Solids
IAPVInaccessible Pore Volume
TVDTotal Variation Diminishing
PDEPartial Differential Equation
IFTInterfacial Tension
IMPECImplicit in Pressure, Explicit in Concentration
OOIPOriginal Oil in Place

Nomenclature

D ̲ ̲ Dispersion Tensor Ω Reservoir Domain
d m Molecular Diffusion [ m 2 / s ]
d l Longitudinal Dispersion [ m 2 / s ] Superscripts
d t Transversal Dispersion [ m 2 / s ] aAqueous Phase
k r Relative Permeability HWater-Oil System (no Chemical)
pReservoir Pressure [ P a ] jPhase
p w f Bottomhole Pressure [ P a ] [ k ] Iteration Number
rVolumetric Concentration Gradient < n > Time-Step
r w Well Radius [ m ] oOleous Phase
SPhase Saturation rResidual
sWell Skin Factor
VVolumetric Concentration Subscripts
zOverall Concentration cChemical (Surfactant) Component
iComponent
Greek Letters i n Injection
Γ Domain Boundary m , n Spatial Grid Blocks
δ i j Kronecker Delta pPetroleum Component
λ Phase Mobility [ m 2 / ( P a · s ) ] p o l Polymer Component
μ Absolute Viscosity [ P a · s ] s t Salt Component
σ Interfacial Tension [ m N / m ] wWater Component

References

  1. Al-Mjeni, R.; Arora, S.; Cherukupalli, P.; Wunnik, J.V.; Edwards, J.; Felber, B.J.; Gurpinar, O.; Hirasaki, G.J.; Miller, C.A.; Jackson, C. Has the time come for EOR? Oilfield Rev. 2010, 2011, 4. [Google Scholar]
  2. Dake, L.P. Fundamentals of Reservoir Engineering; Elsevier: Amsterdam, The Netherlands, 1978; ISBN 0-444-41830-X. [Google Scholar]
  3. Lake, L.W. Enhanced Oil Recovery; Prentice-Hall Inc.: Englewood Cliffs, NJ, USA, 1989; ISBN 0-13-281601-6. [Google Scholar]
  4. Satter, A.; Iqbal, G.M.; Buchwalter, J.L. Practical Enhanced Reservoir Engineering; PennWell Books: Tulsa, OK, USA, 2008; ISBN 978-1-59370-056-0. [Google Scholar]
  5. Schmidt, R.L.; Venuto, P.B.; Lake, L.W. A Niche for Enhanced Oil Recovery in the 1990’s. Oilfield Rev. 1992, 4, 55–61. [Google Scholar]
  6. Hirasaki, G.J.; Miller, C.A.; Puerto, M. Recent Advances in Surfactant EOR. SPE J. 2011, 16, 889–907. [Google Scholar] [CrossRef]
  7. Khan, M.Y.; Samanta, A.; Ojha, K.; Mandal, A. Interaction between aqueous solutions of polymer and surfactant and its effect on physicochemical properties. Asia-Pac. J. Chem. Eng. 2008, 3, 579–585. [Google Scholar] [CrossRef]
  8. Ye, Z.; Guo, G.; Chen, H.; Shu, Z. Interaction between aqueous solutions of hydrophobically associating polyacrylamide and dodecyl dimethyl betaine. J. Chem. 2014, 932082. [Google Scholar] [CrossRef] [Green Version]
  9. Druetta, P.; Picchioni, F. Surfactant-Polymer flooding: Influence of the injection scheme. Energy Fuels 2018, 32, 12231–12246. [Google Scholar] [CrossRef] [PubMed]
  10. Wu, X.; Han, M.; Zahrani, B.H.; Guo, L. Effect of surfactant-polymer interaction on the interfacial properties for chemical EOR. In SPE Middle East Oil & Gas Show and Conference; Society of Petroleum Engineers: Manama, Bahrain, 2015. [Google Scholar] [CrossRef]
  11. Ma, B.D.; Gao, B.Y.; Zhang, L.; Gong, Q.T.; Jin, Z.Q.; Zhang, L.; Zhao, S. Influence of polymer on dynamic interfacial tensions of EOR surfactant solutions. J. Appl. Polym. Sci. 2014, 131, 40562. [Google Scholar] [CrossRef]
  12. Druetta, P.; Raffa, P.; Picchioni, F. Chemical enhanced oil recovery and the role of chemical product design. Appl. Energy 2019, 252, 113480. [Google Scholar] [CrossRef]
  13. Zhang, L.; Wang, X.-C.; Yan, F.; Luo, L.; Zhang, L.; Zhao, S.; Yu, J.-Y. Interfacial dilational properties of partly hydrolyzed polyacrylamide and gemini surfactant at the decane-water interface. Colloid Polym. Sci. 2008, 286, 1291–1297. [Google Scholar] [CrossRef]
  14. Fathaddin, M.T.; Nugrahanti, A.; Buang, P.N.; Elraies, K.A. Surfactant-polymer flooding performance in heterogeneous two-layered porous media. IIUM Eng. J. 2011, 12, 31–38. [Google Scholar] [CrossRef]
  15. Bekbauov, B.; Berdyshev, A.; Baishemirov, Z. Numerical simulation of chemical enhanced oil recovery processes. In DOOR (suplement); CEUR-WS.org: Vladivostok, Russia, 2016; pp. 664–676. [Google Scholar]
  16. Abadli, F. Simulation Study of Enhanced Oil Recovery by ASP (Alkaline, Surfactant and Polymer) Flooding for Norne Field C-segment. Ph.D. Thesis, Norwegian University of Science and Technology, Trondheim, Norway, 2012. [Google Scholar]
  17. Atthawutthisin, N. Numerical Simulation of Low Salinity Water Flooding Assisted with Chemical Flooding for Enhanced Oil Recovery. Ph.D. Thesis, Norwegian University of Science and Technology, Trondheim, Norway, 2012. [Google Scholar]
  18. Roshanfekr, M.; Johns, R.T.; Pope, G. Effect of pressure, temperature, and solution gas on oil recovery from surfactant polymer floods. In SPE Annual Technical Conference and Exhibition; Society of Petroleum Engineers: New Orleans, LA, USA, 2009. [Google Scholar] [CrossRef]
  19. Changli, Y. Commercial Scale Simulations of Surfactant/Polymer Flooding. Ph.D. Thesis, University of Texas at Austin, Austin, TX, USA, 2012. [Google Scholar]
  20. Rai, S.; Bera, A.; Mandal, A. Modeling of surfactant and surfactant-polymer flooding for enhanced oil recovery using STARS (CMG) software. J. Pet. Explor. Prod. 2014, 1–11. [Google Scholar] [CrossRef] [Green Version]
  21. Rai, K.; Johns, R.T.; Lake, L.W.; Delshad, M. Oil-recovery predictions for surfactant polymer flooding. In SPE Annual Technical Conference and Exhibition; Society of Petroleum Engineers: New Orleans, LA, USA, 2009. [Google Scholar] [CrossRef]
  22. Thirawarapan, C.; Thiele, M.R.; Kovscek, A.; Batycky, R.; Clemens, T. A simplified model for field-scale surfactant-polymer flooding. In SPE Heavy Oil Conference-Canada; Society of Petroleum Engineers: Calgary, AB, Canada, 2014. [Google Scholar] [CrossRef]
  23. Jin, B.; Jiang, H.; Zhang, X.; Wang, J.; Yang, J.; Zheng, W. Numerical simulation of surfactant-polymer flooding. Chem. Technol. Fuels Oils 2014, 50, 55–70. [Google Scholar] [CrossRef]
  24. Garrepally, S.; Jouenne, S.; Olmsted, P.; Lequeux, F. Scission of flexible polymers in contraction flow: Predicting the effects of multiple passages. J. Rheol. 2020, 64, 601–614. [Google Scholar] [CrossRef] [Green Version]
  25. Hosseini-Nasab, S.M.; Padalkar, C.; Battistutta, E.; Zitha, P.L.J. Mechanistic modeling of the alkaline/surfactant/polymer flooding process under sub-optimum salinity conditions for enhanced oil recovery. Ind. Eng. Chem. Res. 2016, 55, 6875–6888. [Google Scholar] [CrossRef]
  26. Sinha, A.K.; Bera, A.; Raipuria, V.; Kumar, A.; Mandal, A.; Kumar, T. Numerical simulation of enhanced oil recovery by alkali-surfactant-polymer floodings. Pet. Sci. Technol. 2015, 33, 1229–1237. [Google Scholar] [CrossRef]
  27. Fadili, A.; Kristensen, M.R.; Moreno, J. Smart integrated chemical EOR simulation. In International Petroleum Technology Conference; Society of Petroleum Engineers: Doha, Qatar, 2009. [Google Scholar] [CrossRef]
  28. Druetta, P.; Yue, J.; Tesi, P.; Persis, C.D.; Picchioni, F. Numerical modeling of a compositional flow for chemical EOR and its stability analysis. Appl. Math. Model. 2017, 47, 141–159. [Google Scholar] [CrossRef]
  29. Druetta, P. Numerical Simulation of Chemical EOR Processes. Ph.D. Thesis, University of Groningen, Groningen, The Netherlands, 2018. [Google Scholar]
  30. Azad, M.; Trivedi, J. Quantification of the Viscoelastic Effects During Polymer Flooding: A Critical Review. SPE J. 2019, 24, 2731–2757. [Google Scholar] [CrossRef]
  31. Azad, M.; Trivedi, J. Quantification of Sor Reduction during Polymer Flooding Using Extensional Capillary Number. SPE J. 2020, 204212. [Google Scholar] [CrossRef]
  32. Sheng, J. Modern Chemical Enhanced Oil Recovery; Elsevier: Amsterdam, The Netherlands, 2011; ISBN 978-1-85617-745-0. [Google Scholar]
  33. Bidner, M.S.; Savioli, G.B. On the numerical modeling for surfactant flooding of oil reservoirs. Mec. Comput. 2002, 21, 566–585. [Google Scholar]
  34. Chen, Z.; Huan, G.; Ma, Y. Computational Methods for Multiphase Flows in Porous Media; Society for Industrial and Applied Mathematics: Philadelphia, PA, USA, 2006; ISBN 978-0-89871-606-1. [Google Scholar] [CrossRef] [Green Version]
  35. Druetta, P.; Tesi, P.; Persis, C.D.; Picchioni, F. Methods in Oil Recovery Processes and Reservoir Simulation. Adv. Chem. Eng. Sci. 2016, 6, 39. [Google Scholar] [CrossRef] [Green Version]
  36. Barrett, R.; Berry, M.; Chan, T.; Demmel, J.; Donato, J.; Dongarra, J.; Eijkhout, V.; Pozo, R.; Romine, C.; van der Vorst, C. Templates for the Solution of Linear Systems: Building Blocks for Iterative Methods; Society for Industrial and Applied Mathematics: Philadelphia, PA, USA, 1994; ISBN 978-0-89871-328-2. [Google Scholar] [CrossRef]
  37. Kamalyar, K.; Kharrat, R.; Nikbakht, M. Numerical Aspects of the Convection-Dispersion Equation. Pet. Sci. Technol. 2014, 32, 1729–1762. [Google Scholar] [CrossRef]
  38. Bear, J. Dynamics of Fluids In Porous Media; American Elsevier Publishing Company: New York, NY, USA, 1972; ISBN 978-0-44400-114-6. [Google Scholar]
  39. Kuzmin, D. A Guide to Numerical Methods for Transport Equations; University Erlangen-Nuremberg: Nuremberg, Germany, 2010. [Google Scholar]
  40. Larson, R.G. The Influence of Phase Behavior on Surfactant Flooding. Soc. Pet. Eng. J. 1979, 19, 411–422. [Google Scholar] [CrossRef]
  41. Porcelli, P.; Bidner, M. Simulation and transport phenomena of a ternary 2-phase flow. Transp. Porous Media 1994, 14, 101–122. [Google Scholar] [CrossRef]
  42. Attwood, D.; Florence, A.T. Surfactant Systems—Their Chemistry, Pharmacy and Biology; Chapman and Hall: London, UK, 1983; ISBN 978-9-40095-775-6. [Google Scholar]
  43. Delshad, M.; Pope, G.; Sepehrnoori, K. UTCHEM Version 9.0 Technical Documentation; Center for Petroleum and Geosystems Engineering, The University of Texas at Austin: Austin, TX, USA, 2000; Volume 78751. [Google Scholar]
  44. Hirasaki, G.J. Application of the Theory of Multicomponent, Multiphase Displacement to 3-Component, 2-Phase Surfactant Flooding. Soc. Pet. Eng. J. 1981, 21, 191–204. [Google Scholar] [CrossRef]
  45. Bidner, M.; Porcelli, P. Influence of phase behavior on chemical flood transport phenomena. Transp. Porous Media 1996, 24, 247–273. [Google Scholar] [CrossRef]
  46. Bidner, M.; Porcelli, P. Influence of capillary pressure, adsorption and dispersion on chemical flood transport phenomena. Transp. Porous Media 1996, 24, 275–296. [Google Scholar] [CrossRef]
  47. Kumar, B. Effect of Salinity on the Interfacial Tension of Model and Crude Oil Systems. Ph.D. Thesis, University of Calgary, Calgary, AB, Canada, 2012. [Google Scholar]
  48. Goddard, E. Polymer/surfactant interaction: Interfacial aspects. J. Colloid Interface Sci. 2002, 256, 228–235. [Google Scholar] [CrossRef]
  49. Panmai, S.; Prud’homme, R.; Peiffer, D.; Jockusch, S.; Turro, N. Interactions between hydrophobically modified polymers and surfactants: A fluorescence study. Langmuir 2002, 18, 3860–3864. [Google Scholar] [CrossRef]
  50. Ji, Y.; Wang, D.; Cao, X.; Guo, L.; Zhu, Y. Both-branch amphiphilic polymer oil displacing system: Molecular weight, surfactant interactions and enhanced oil recovery performance. Colloids Surfaces A Physicochem. Eng. Asp. 2016, 509, 440–448. [Google Scholar] [CrossRef]
  51. Xu-Long, C.; Jing, L.; Yong, Y.; Ji-Chao, Z.; Lei, Z.; Lu, Z.; Sui, Z. Effects of Surfactants on Interfacial Shear Rheological Properties of Polymers for Enhanced Oil Recovery. Acta Phys. Chim. Sin. 2014, 30, 908–916. [Google Scholar] [CrossRef]
  52. Yan, L.; Cui, Z.; Song, B.; Pei, X.; Jiang, J. Glyceryl Ether Ethoxylates as Surfactants for Surfactant-Polymer Flooding. Energy Fuels 2016, 30, 5425–5431. [Google Scholar] [CrossRef]
  53. Al-Wahaibi, Y.; Al-Hashmi, A.; Joshi, S.; Mosavat, N.; Rudyk, S.; Al-Khamisi, S.; Al-Kharusi, T.; Al-Sulaimani, H. Mechanistic study of surfactant/polymer adsorption and its effect on surface morphology and wettability. In SPE Oil and Gas India Conference and Exhibition; Society of Petroleum Engineers: Mumbai, India, 2017. [Google Scholar] [CrossRef]
  54. Darvas, M.; Gilanyi, T.; Jedlovszky, P. Competitive adsorption of surfactants and polymers at the free water surface. a computer simulation study of the sodium dodecyl sulfate- poly(ethylene oxide) system. J. Phys. Chem. B 2011, 115, 933–944. [Google Scholar] [CrossRef]
  55. Druetta, P.; Picchioni, F. Influence of the polymer properties and numerical schemes on tertiary oil recovery processes. Comput. Math. Appl. 2020, 79, 1094–1110. [Google Scholar] [CrossRef]
  56. Curbelo, F.D.S.; Santanna, V.C.; Neto, E.L.B.; Dutra, T.V.; Dantas, T.N.C.; Neto, A.A.D.; Garnica, A.I.C. Adsorption of nonionic surfactants in sandstones. Colloids Surfaces -Physicochem. Eng. Asp. 2007, 293, 1–4. [Google Scholar] [CrossRef]
  57. Thomas, C.; Fleming, P.; Winter, W. A Ternary, 2-Phase, Mathematical-Model of Oil-Recovery with Surfactant Systems. Soc. Pet. Eng. J. 1984, 24, 606–616. [Google Scholar] [CrossRef]
  58. Nambam, J.S.; Philip, J. Competitive adsorption of polymer and surfactant at a liquid droplet interface and its effect on flocculation of emulsion. J. Colloid Interface Sci. 2012, 366, 88–95. [Google Scholar] [CrossRef]
  59. Postmus, B.R. Polymer vs. Surfactant—Competitive Adsorption at the Solid-Liquid Interface. Ph.D. Thesis, University of Wageningen, Wageningen, The Netherlands, 2008. [Google Scholar]
  60. Wang, J.; Han, M.; Fuseni, A.B.; Cao, D. Surfactant adsorption in surfactant-polymer flooding for carbonate reservoirs. In SPE Middle East Oil & Gas Show and Conference; Society of Petroleum Engineers: Manama, Bahrain, 2015. [Google Scholar] [CrossRef]
Figure 1. Polymer—Surfactant interactions and their effect on the IFT (Adapted from Druetta [9]).
Energies 13 06520 g001
Figure 2. Schematic representation of the quarter 5-spot used for the EOR simulations (Reproduced with permission from Druetta [28], Elsevier, 2017).
Energies 13 06520 g002
Figure 3. Ternary phase diagrams considering the polymer presence for type II(−) (left) and II(+) (right) systems (top), and their simplifications for the simulations (bottom) (Adapted with permission from Druetta [28], Elsevier, 2017).
Energies 13 06520 g003
Figure 4. IFT ratio ( I F T p o l I F T ) considering the influence of the polymer and surfactant concentrations, and the partitioning coefficient.
Energies 13 06520 g004
Figure 5. Oil recovery, fractional flow (left) and pressure drop (right) for the reference and SP schemes cases considering adsorption.
Energies 13 06520 g005
Figure 6. Chemical flowrates for the different SP injection schemes considering the adsorption process.
Energies 13 06520 g006
Figure 7. Oil saturation in a P+S overlapped scheme after 500 days for the reference, non-adsorption case (left), and considering the adsorption (right).
Energies 13 06520 g007
Figure 8. Oil concentration after 3000 days, at the end of the EOR process, for an overlapped polymer + surfactant (left) and surfactant + polymer (right) SP flooding.
Energies 13 06520 g008
Figure 9. Combined chemical agents slugs in a P+S flooding scheme after 1000 days (separated–left) and amount of surfactant adsorbed after 3000 days (overlapped–right).
Energies 13 06520 g009
Figure 10. Oil recovery, fractional flow (left) and pressure drop (right) for the reference cases and different SP schemes, considering adsorption phenomena in a five pseudo-component system.
Energies 13 06520 g010
Figure 11. Chemical and salt flowrates as a function of time for the different SP injection schemes considering the adsorption process in a five pseudo-component system. The red lines represent the flow rates for an injection scheme ’Polymer + Surfactant’, while the green ones depict the behavior of the system for an injection scheme ’Surfactant + Polymer’. The line-types shown in the top left of the graph are used to differentiate the different components under study.
Energies 13 06520 g011
Figure 12. Oil saturation in a P+S overlapped scheme after 500 days (left) and 3000 days (right) in a porous medium considering adsorption and the presence of salt in the aqueous phase.
Energies 13 06520 g012
Figure 13. Oil saturation in a P+S scheme after 1000 days (separated—left) and IFT [ m N m ] after 1000 days in a P+S (overlapped—right), considering adsorption and the presence of salt in the aqueous phase.
Energies 13 06520 g013
Figure 14. Polymer concentration profile after 1000 in a surfactant + polymer flooding (overlapped—left) and combined chemicals after 1000 days in a polymer + surfactant flooding (overlapped—right).
Energies 13 06520 g014
Figure 15. Aqueous phase viscosity [mPa·s] after 1000 days in a surfactant + polymer SP scheme (separated—left) and amount of polymer adsorbed after 1000 days in a surfactant + polymer flooding (overlapped—right).
Energies 13 06520 g015
Table 1. General parameters (reproduced with permission from Druetta [28], Elsevier, 2017).
Geometrical Data of the Reservoir
Length in axis X500 mLength in axis Y500 mLayer thickness5 m
n x 25 blocks n y 25 blocks
Rock Properties
Porosity0.25 k x x 200 mD k y y 200 mD
Initial Conditions
S o 0.70 S o r (EOR)0.35 S a r H = S o r H 0.15
Simulation Data
Total time3000 daysSurf. inj. time100 days z c I N 0.1
Pol. inj. time100 days z p o l I N 0.025
Physical Data of the Phases
μ a H 1 cP μ o H 10 cPOil density850 kg/m 3
Water density1020 kg/m 3 IFT50 mN/m
Table 2. Wells’ physical and operating conditions (reproduced with permission from Druetta [28], Elsevier, 2017).
Physical Information
Number of wells2Well radius0.25 mSkin factor0
Operating Conditions
Total flowrate222.58 m 3 /dayBottomhole pressure55,160 kPa
Table 3. Recovery processes for different SP flooding schemes considering adsorption of the chemical species.
CaseOil RecoveredCaseOil Recovered
m 3 %OOIPm 3 %OOIP
Reference Polymer81,54043.5Polymer + Surfactant
(separated)
87,53046.7
Reference Surfactant75,45040.2Surfactant + Polymer
(overlapped)
90,03648.0
Polymer + Surfactant
(overlapped)
90,92848.5Surfactant + Polymer
(separated)
87,74046.9
Table 4. Oil recovery efficiency in a random permeability field as a function of the partitioning coefficient.
Competitive Adsorption FactorOil RecoveredCompetitive Adsorption FactorOil Recovered
m 3 %OOIPm 3 %OOIP
0.186,75046.3287,76746.8
186,93046.4589,51647.7
1.587,53046.71091,59448.9
Table 5. Results of the recovery process for different SP flooding schemes considering adsorption of the chemical species and the presence of the salt as fifth component.
CaseOil RecoveredCaseOil Recovered
m 3 %OOIPm 3 %OOIP
Reference Polymer80,30042.8Polymer + Surfactant
(separated)
84,01044.8
Reference Surfactant74,86039.9Surfactant + Polymer
(overlapped)
84,86045.3
Polymer + Surfactant
(overlapped)
85,78045.8Surfactant + Polymer
(separated)
84,35045.0
Publisher’s Note: MDPI stays neutral with regard to jurisdictional claims in published maps and institutional affiliations.

