Article

Modeling Near-Miscible Gas Foam Injection in Fractured Tight Rocks and Its Challenges

Center for Subsurface Energy and the Environment, The University of Texas at Austin, Austin, TX 78712, USA
*
Author to whom correspondence should be addressed.
Energies 2021, 14(7), 1998; https://doi.org/10.3390/en14071998
Submission received: 4 March 2021 / Revised: 30 March 2021 / Accepted: 1 April 2021 / Published: 5 April 2021
(This article belongs to the Special Issue Reservoir Simulation Studies for Enhanced Oil Recovery)

Abstract

:
Unlocking oil from tight reservoirs remains a challenging task, as the existence of fractures and oil-wet rock surfaces tends to make the recovery uneconomic. Injecting a gas in the form of a foam is considered a feasible technique in such reservoirs for providing conformance control and reducing gas-oil interfacial tension (IFT) that allows the injected fluids to enter the rock matrix. This paper presents a modeling strategy that aims to understand the behavior of near-miscible foam injection and to find the optimal strategy to oil recovery depending on the reservoir pressure and gas availability. Corefloods with foam injection following gas injection into a fractured rock were simulated and history matched using a compositional commercial simulator. The simulation results agreed with the experimental data with respect to both oil recovery and pressure gradient during both injection schedules. Additional simulations were carried out by increasing the foam strength and changing the injected gas composition. It was found that increasing foam strength or the proportion of ethane could boost oil production rate significantly. When injected gas gets miscible or near miscible, the foam model would face serious challenges, as gas and oil phases could not be distinguished by the simulator, while they have essentially different effects on the presence and strength of foam in terms of modeling. We provide in-depth thoughts and discussions on potential ways to improve current foam models to account for miscible and near-miscible conditions.

1. Introduction

Carbonate or tight reservoirs account for over half of total oil reserves worldwide and contribute to a vast amount of oil production [1]. The production rate of such reservoirs could be high during the early stage of primary recovery owing to connected natural fracture network that facilitates oil flow, but it is difficult to sustain the same oil production with secondary (such as gas flooding) or traditional tertiary recovery methods after the reservoir pressure has depleted [2]. This is because the injected fluids usually bypass the matrix in fractured rocks, and the injected fluid is not imbibed into the carbonate matrices because they are typically oil-wet and hinder the drainage of oil from matrices into the fractures [3,4]. As a result, bolstering oil recovery from fractured reservoirs remains a challenging and emergent task in the oil and gas industry.
Amongst various enhanced-oil-recovery methods, injecting foaming solution with gas is considered a feasible technology for such reservoirs [5,6]. Foam is a dispersed medium with discontinuous gas phase separated by aqueous films sustained by surfactant, which greatly reduces the gas mobility in porous media [7]. Foam is stable in low capillary pressure and low oil saturation environment, thus making it a smart and adaptable agent, i.e., being strong in fractures or high permeability streaks and weak in tight matrices [8,9,10] (Note that a strong foam has a fine bubble texture and creates a high pressure gradient in the porous media, while a weak foam has a relatively coarse bubble texture that results in a moderate pressure gradient). This feature is highly beneficial since it not only enables diversion of injected fluids from factures to low-permeability regions, but also avoids excessive injectivity loss and ensures the formation safety [11,12].
In addition to blocking gas flow in fractures, another critical aspect for foam to enhance oil recovery in carbonates is to overcome the capillary barrier imposed by the oil-wet rock surface. This can be achieved by reducing the interfacial tension (IFT) or altering the wettability [13,14]. For such a purpose, the practical foams used for fractured carbonates can be divided into two major categories: the low-IFT foam (sometimes called low-tension gas) and the miscible gas foam. The low IFT foam takes advantage of a cocktail of different surfactants, which can serve for both foaming and IFT reduction purposes [15,16]. This is particularly useful when the gas is immiscible with oil and the aqueous solution is able to enter the matrix rocks. A weakness of this technique is that strong foam and ultra-low IFT are usually found to be incompatible during the chemical formulation development, thus a compromise between the two counterparts is needed [17,18]. The alternative foam, i.e., the miscible or near-miscible foam is considered when the reservoir pressure is high enough and the resource of miscible gas such as CO2 or ethane is available [19,20,21,22,23,24]. Miscible gas foam not only reduces the gas-oil IFT to allow injected gas to enter the rock matrix, but also benefits from the advantages of miscible gas flooding including oil swelling, viscosity reduction, and molecular diffusion. Even though experiments have generally shown that miscible gas foam leads to higher oil recovery than the immiscible gas foam [19,24,25], one should account for the actual reservoir pressure and the availability of gas resources. Therefore, it is possible that the gas and oil phases could shift among immiscible, near-miscible and miscible conditions due to the variation of pressure and gas composition with space and time.
There have been several simulation studies on miscible gas foam injection in the literature [25,26,27,28,29,30], including a few of them applied to fractured media [28,29,30]. Ref. [28] compared the oil recovery of CO2 floods with the CO2 foam floods in conditions considering fractures. Ref. [29] studied how foam performed in the presence of a vertical fracture to avoid gravity override. Ref. [30] compared the foam behaviors of aqueous-soluble and CO2-soluble foaming surfactants. However, how the miscibility changes the foam performance in fractured rocks has rarely been paid attention to in the literature. Miscibility is critical for the multi-phase fluid flow, and it should play an important role in a foam process that is more complex. As a result, this paper attempts to understand the factors that affect the foam behavior in fractured oil-wet rock and to find optimal injection strategy depending on the available conditions through reservoir simulation. In addition, we also would like to investigate the effect of miscibility on the foam behavior under the gas-oil miscible or near-miscible conditions.
The paper is organized as follows. The next section introduces the foam model used for simulation. The third section demonstrates the simulation and history-match for near-miscible gas foam injections. Additional simulations are presented to investigate the effects of foam strength and gas composition on the oil recovery. Finally, we discuss the achievement and challenges for modeling this problem.

2. Experimental Description and Model Set-Up

This section briefly describes the experiments conducted by [24] that serve as the objects for simulation cases, and presents how to set up the geometry to represent the fractured core and the choice of simulator and foam model for simulating the foam injection process.

2.1. Experimental Description

The experiments were conducted in 1-foot long and 1.5-inch diametrical fractured Texas Cream limestone cores at different injection miscibilities (e.g., injecting 50% methane 50% ethane, 25% methane 75 ethane, and 100% ethane) [24]. The fracture split the matrix core into two halves and was filled with silica proppant to support the opening where overburden pressure was applied. The permeabilities of the matrix and the fracture were measured to be 10 md and 2250 md. Their porosities were measured to be 0.28 and 0.8, respectively. The oil was decane with 2% naphthenic acid and the core was saturated and aged with oil to generate the oil-wet condition. Gas or foam was injected from the top at 1 ft/day and oil was produced from the bottom side at a constant back pressure, i.e., 950 psi. The confining pressure was 1500 psi, and the injection pressure was slightly larger than the back-pressure depending on the dynamic pressure drop across the core. The foaming surfactant solution used was 1% Bioterge AS40 mixed with 1% NaCl. The oil recoveries and pressure drops were measure with time.

2.2. Fractured Core Model

Figure 1 shows a typical geometry of the fractured core used in coreflood experiments [24]. The original cylindrical core was split lengthwise in the middle into two semi-cylindrical pieces. An aperture exists between the two half cores to mimic the fracture.
Due to the symmetry, the half core can be further divided into two symmetric quarter-cylinders by the red dash-dot lines shown in Figure 1. As a result, we can use a three-dimensional quarter-cylinder geometry to model the entire fractured core for the sake of minimizing the number of gridblocks in simulation.

2.3. Foam Model

There are different foam models including the implicit-texture models and the mechanistic models [31,32,33,34,35]. A comprehensive overview of the foam models is covered in reference [36]. In this paper, we focus on the implicit-texture model, assuming that foam reaches the local-equilibrium condition in the rock. We choose the CMG-GEM reservoir simulator for our simulation, which can take care of both the foam flow and the gas-oil composition with an equation of state (EOS) [32]. The equation of state for the oil and gas components were generated by CMG-Winprop [37]. The Sigmund correlation [38] is used to model the molecular diffusion of different components in oil and gas phases.
The CMG-GEM foam model modifies the relative permeability of the gas phase in the presence of foam, k r g f , with the following equation:
k r g f = k r g F M
where krg is the gas relative permeability in the absence of foam and FM is the mobility reduction factor. FM is a function of various factors:
F M = 1 1 + f m m o b F 1 F 2 F 3 F 4 F 5 F 6 F 7 F D R Y
where fmmob is the maximum mobility reduction factor and F1F7 are normalized coefficients which represent, in sequence, the effects of foaming surfactant concentration, oil saturation, shear rate, pressure gradient, oil component, salt, and permeability, respectively. FDRY accounts for the dry-out effect when water saturation is low. Among those coefficients, F2 and FDRY that account for the effects of oil saturation and water saturation are emphasized in this paper. F2 and FDRY are expressed as:
F 2 = 1 i f S o < f l o i l [ ( f m o i l S o ) / ( f m o i l f l o i l ) ] e p o i l i f f l o i l S o < f m o i l 0 i f f m o i l S o < ( 1 S w r )
where epoil is the exponent, floil is the oil saturation limit below which oil has no effect on foam, and fmoil is the oil saturation limit above which oil totally destroys foam. And
F D R Y = 0.5 + arctan s f b e t S w S F π
where:
S F = max G n * 1 s f d r y + s f d r y
where sfbet is a constant, sfdry is the dry-out water saturation that is slightly above the irreducible water saturation, and Gn (n = 1, 4) is a normalized value that calculates effects of surfactant, oil, capillary number, and salt during the dry-out of foam. In this particular case, the effects of Gn are not considered and hence SF is equal to sfdry.

3. Simulation Cases

In this section, we will present four case studies under different conditions. Section 3.1 will present the simulation and corresponding history-matching work for the experiment with 50% ethane 50% methane injection. Section 3.2 will perform a sensitivity study based on the previous case to investigate the effect of foam strength on oil recovery and pressure gradient. Section 3.3 and Section 3.4 present the history-matching results to the two experiments with more miscible conditions including 75% ethane 25% methane and 100% ethane, the former of which represents near-miscible condition and the latter leads to the full miscibility.

3.1. Simulation of 50% Ethane 50% Methane Near-Miscible Foam Injection

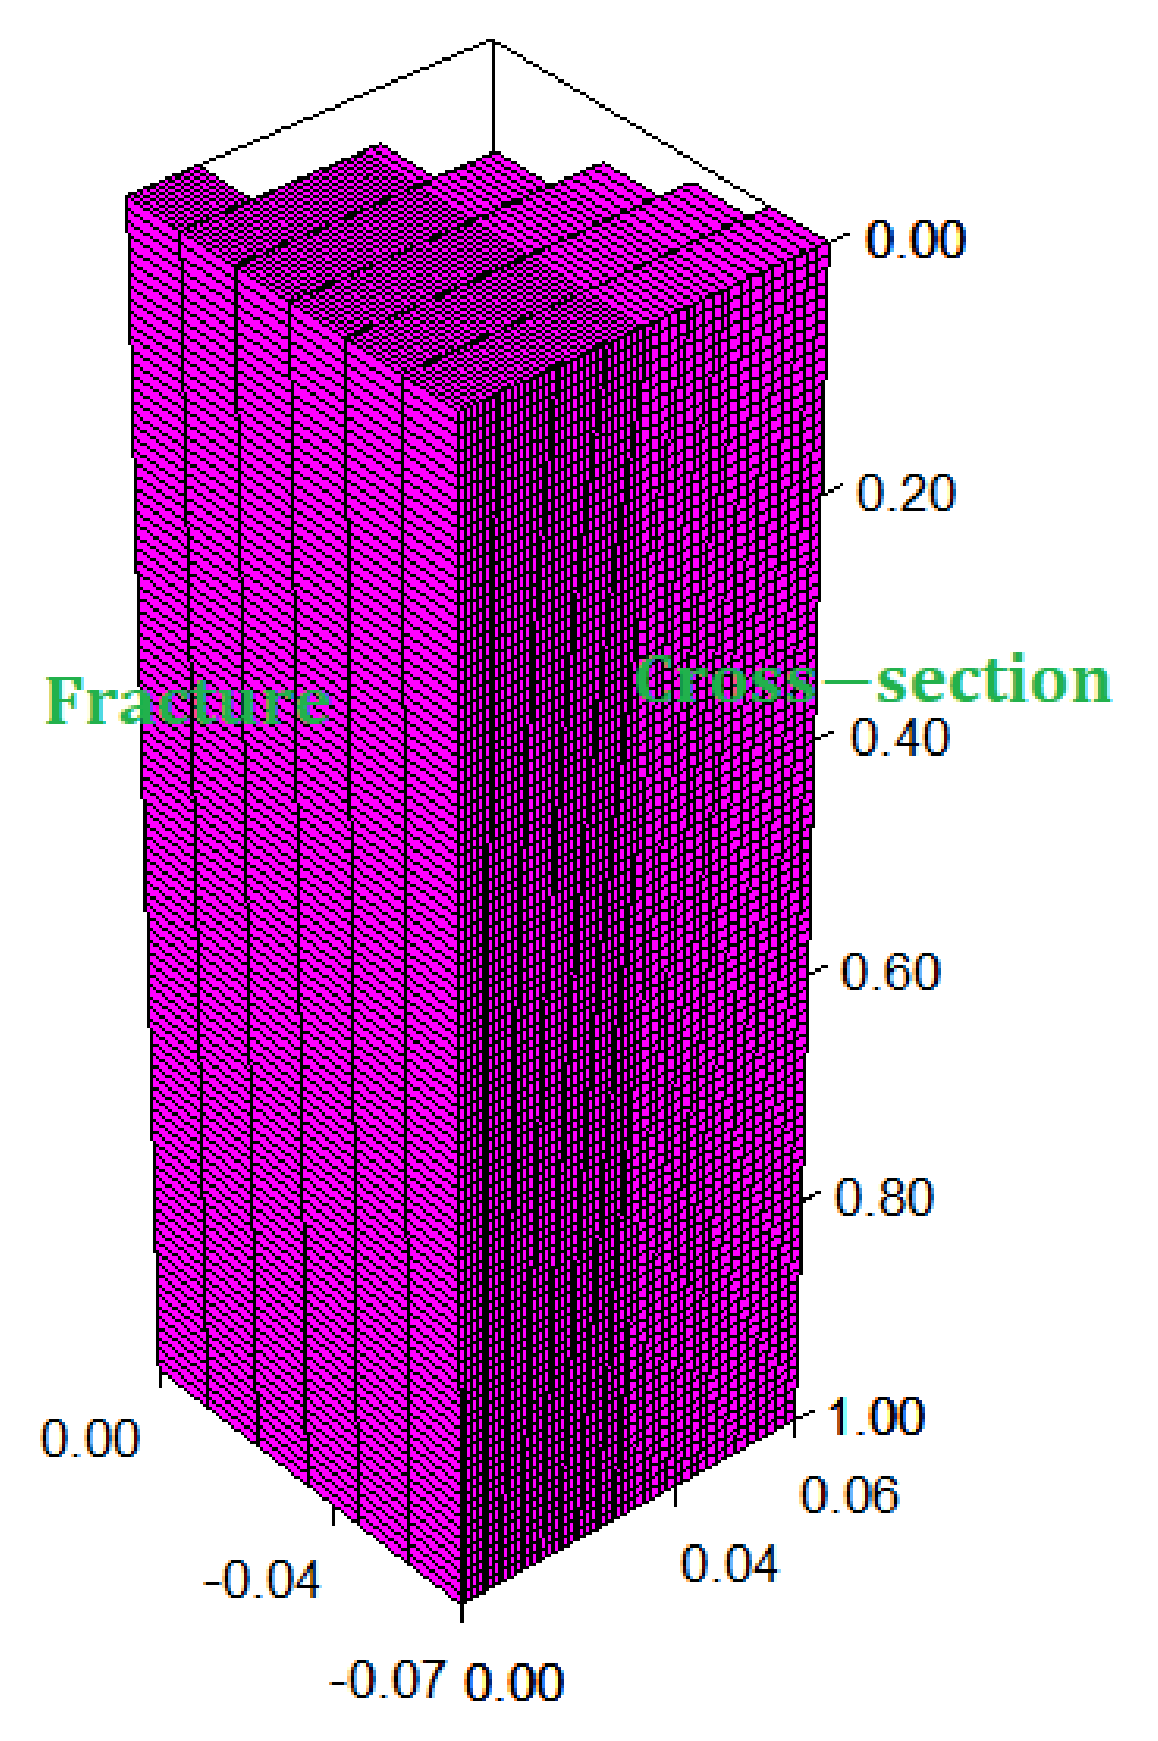
This section presents the simulation results for the 50% ethane 50% methane gas and foam injection experiment conducted in [24]. The quarter-cylinder geometry described in the previous section was used and the relevant grid was 50 × 6 × 100, as shown in Figure 2 with inactive cells outside the circle shape. One lateral side of the geometry was bounded by the fracture with thinner gridblocks, and the other lateral side belonging to the symmetrical cross-section is inside the matrix. The core had a confining-pressure at 950 psi, and the injected gas composition was 50% ethane and 50% methane and the back-pressure was 950 psi, which was not far from but below the minimum miscibility pressure (MMP). 1.3 PV of foam injection at 85% foam quality, which is defined as the ratio of the gas rate over the total fluid rate, followed the injection of 1.9 PV of gas. Other model parameters and rock and fluid properties are listed in Table 1.
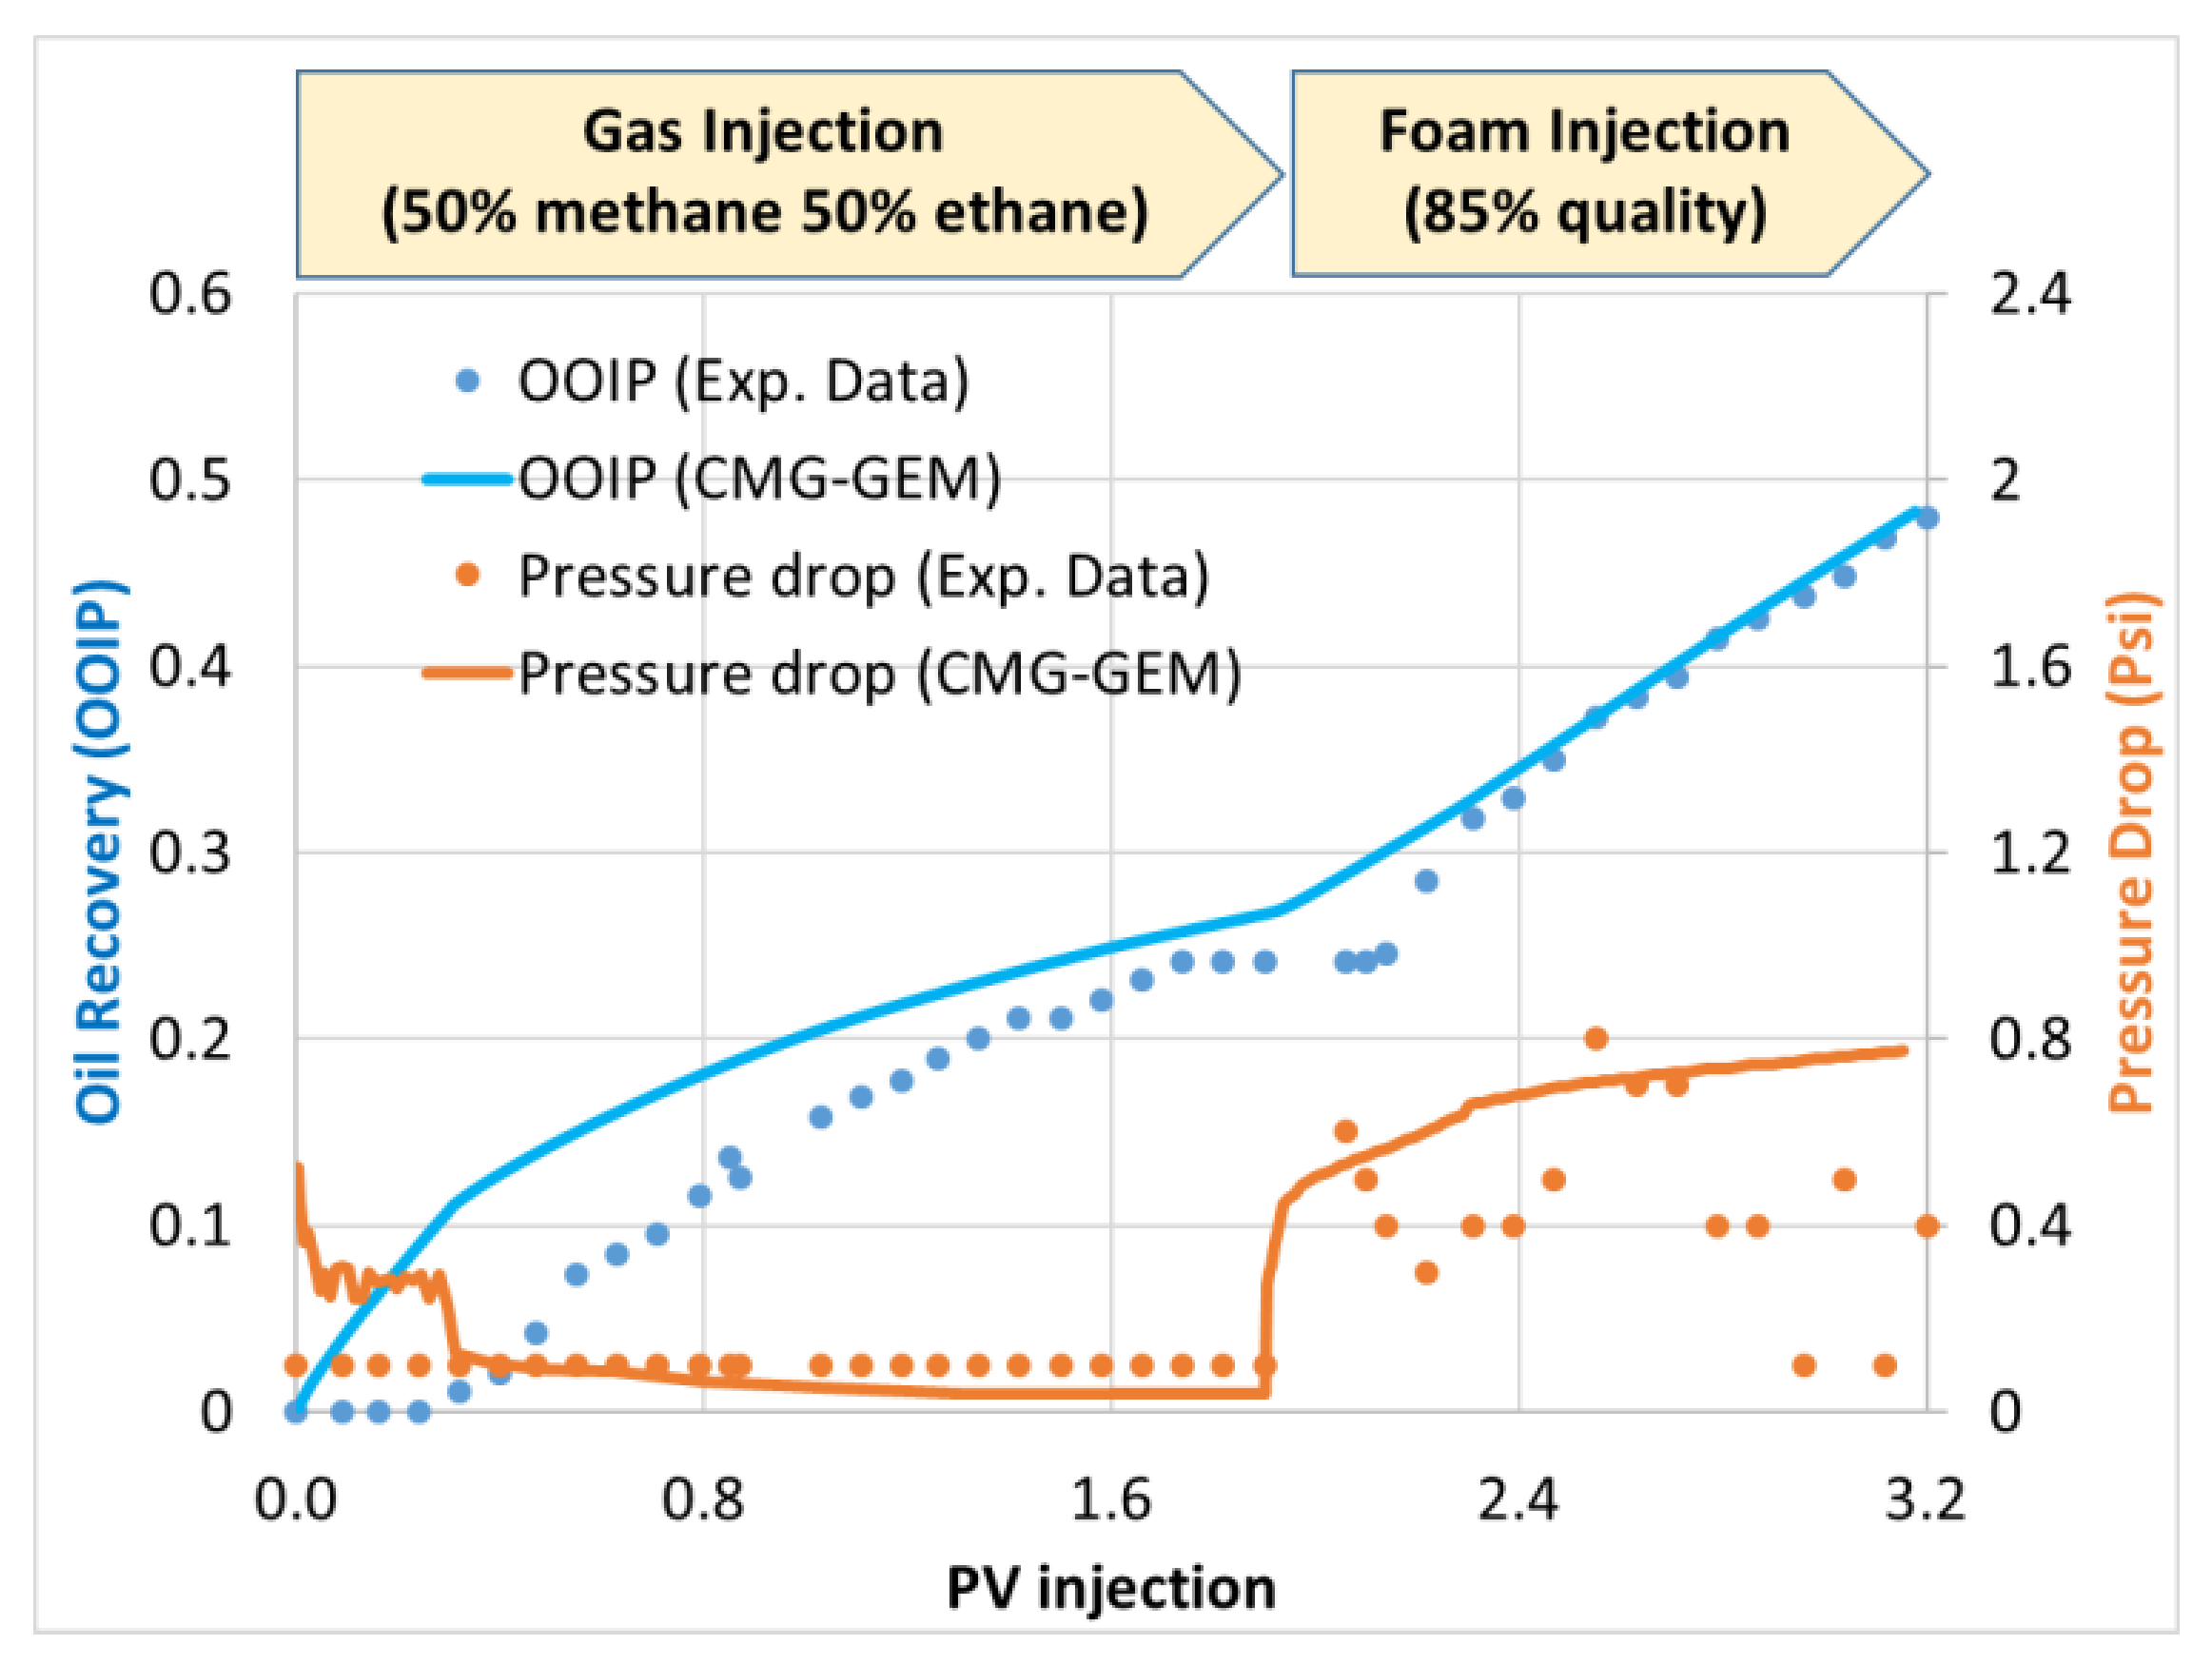
Figure 3 depicts the simulated oil (decane) recovery and pressure drop against the experimental data. The simulation results agree well with the data in terms of both oil recovery and pressure drop. The gas flooding produced about 26% of the original oil in place (OOIP) during 1.9 PV gas injection and the rate gradually declined. The pressure drop was low during the gas injection. During the foam injection, the pressure drop increased significantly and the oil production accelerated, which led to another 22% OOIP oil recovery in 1.3 PV. A total of 48% OOIP recovery is quite significant for immiscible gas floods in fractured cores, but there is still potential to improve the oil recovery.
In simulations, the first five parameters in Table 1 were known from lab measurement and the rest of the parameters were tuned to history-match both the oil recovery and pressure drop. Additional tweaking was needed to balance different experiments that would be presented in the later subsections. The values for the residual phase saturations, i.e., Swr, Sorw, Sorg, and Sgc, adopted typical values for a carbonate rock and were subject to slight change if accurate measurement could be conducted. The water and gas entry capillary pressures accounted for the interfacial tensions of water/gas and oil/gas. Their history-matched values being relatively small compared to a regular range (several psi) was because the matrix was fully saturated with oil initially without residual gas and water saturations. The foam parameter fmmob is the key parameter for foam strength and it was strongly correlated to the measured pressure drop. fmoil, floil, and epoil indicated that the foam was stable below oil saturation 0.1 and gradually became unstable above oil saturation 0.2. The suggested value for sfdry is slightly above the residual water saturation in the fracture (0) and sfbet is on the order of a few digits.
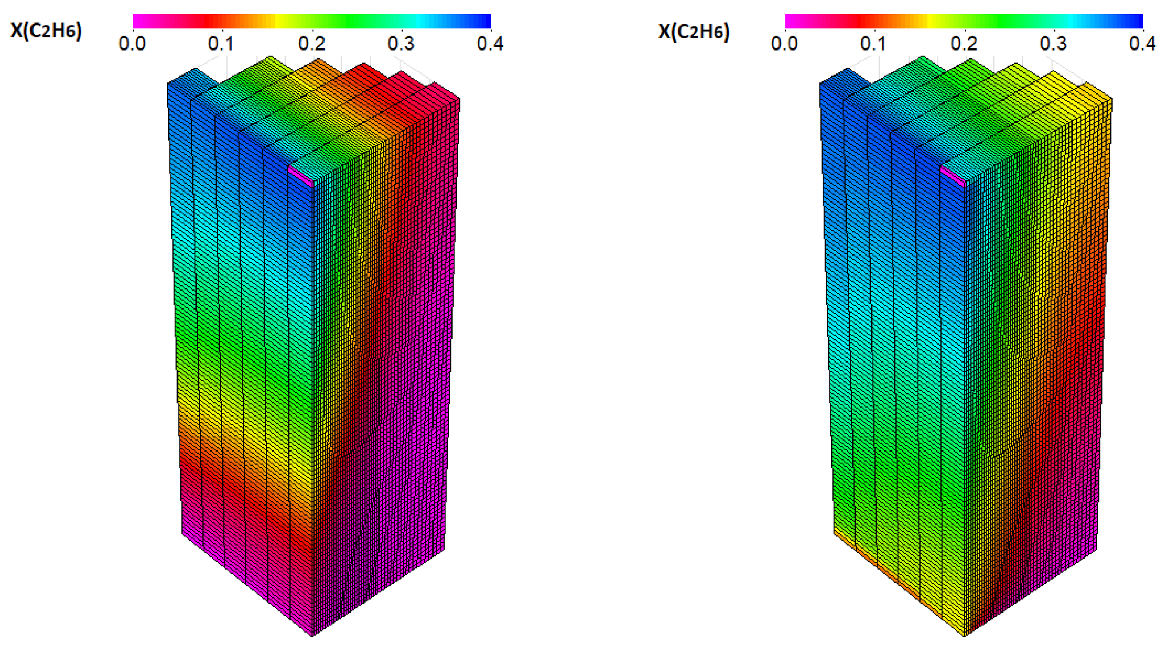
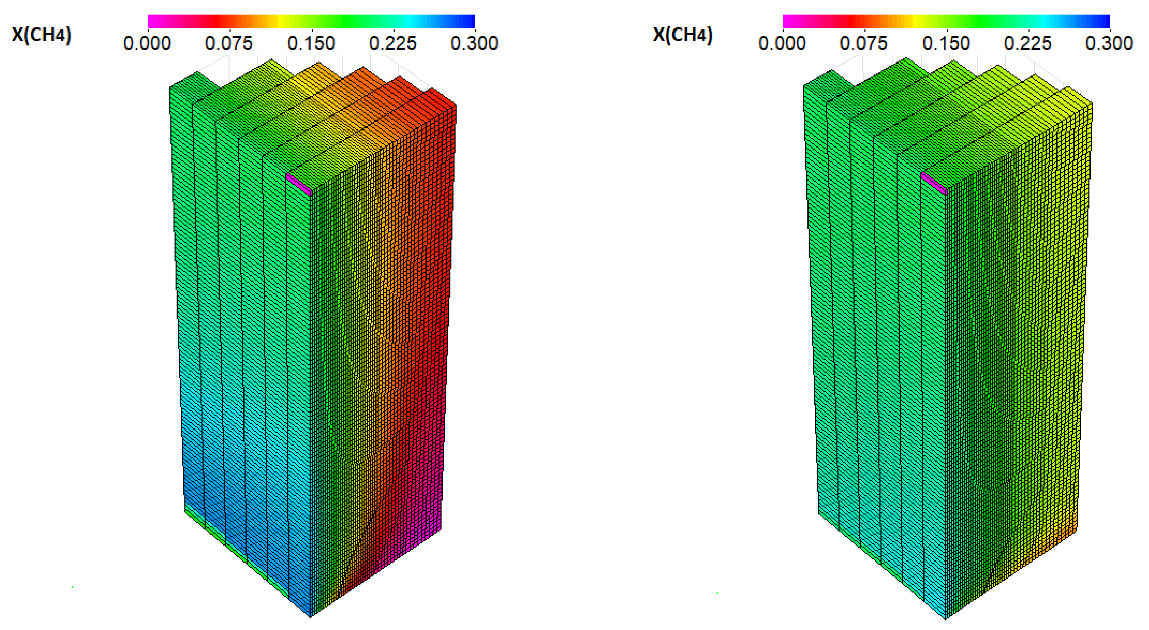
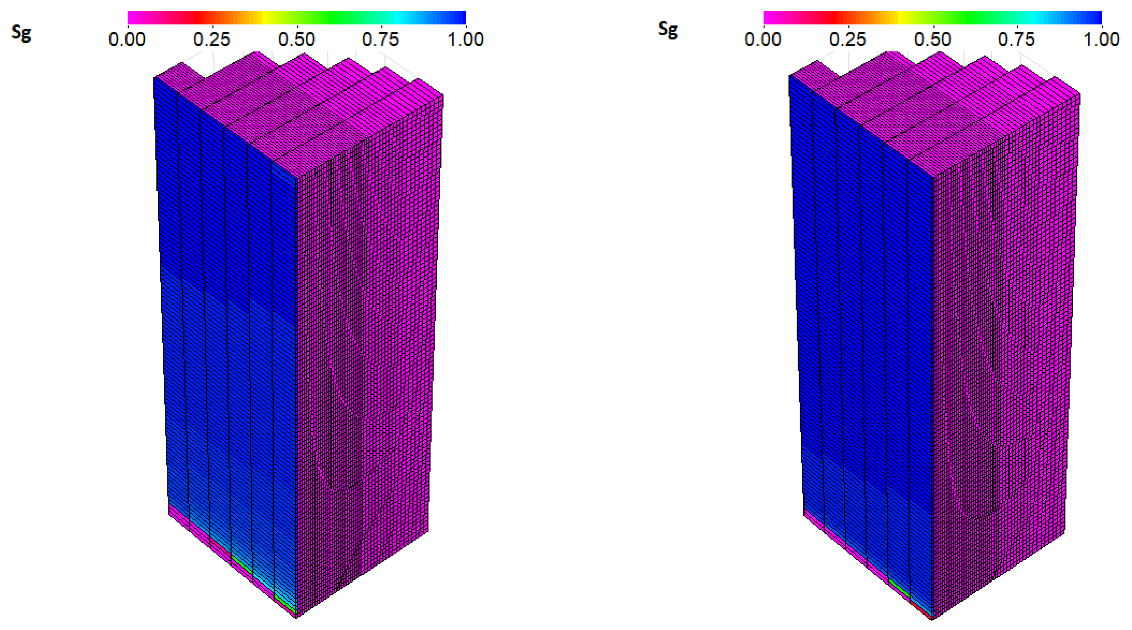
Figure 4 and Figure 5 show the profiles of ethane mole fraction and methane model fraction in the oil phase at 0.5 PV and 1.0 PV of gas flooding, respectively. Fronts of ethane and ethane are observed in the matrix rock, which propagate inward gradually. The methane front moved faster than the ethane front. Note that the cell at the center top is where the injector located. Oil saturation is zero there and the mole fraction values of different components are all defined as 0. Figure 6 shows that the gas saturation remains 0 at 0.5 PV and 1.0 PV of gas flooding, which indicates that gas was unable to enter the matrix rock from the fracture due to the capillary barrier. As a result, the increases of the methane and ethane mole fractions in the matrix are mainly due to the molecular diffusion of the components.
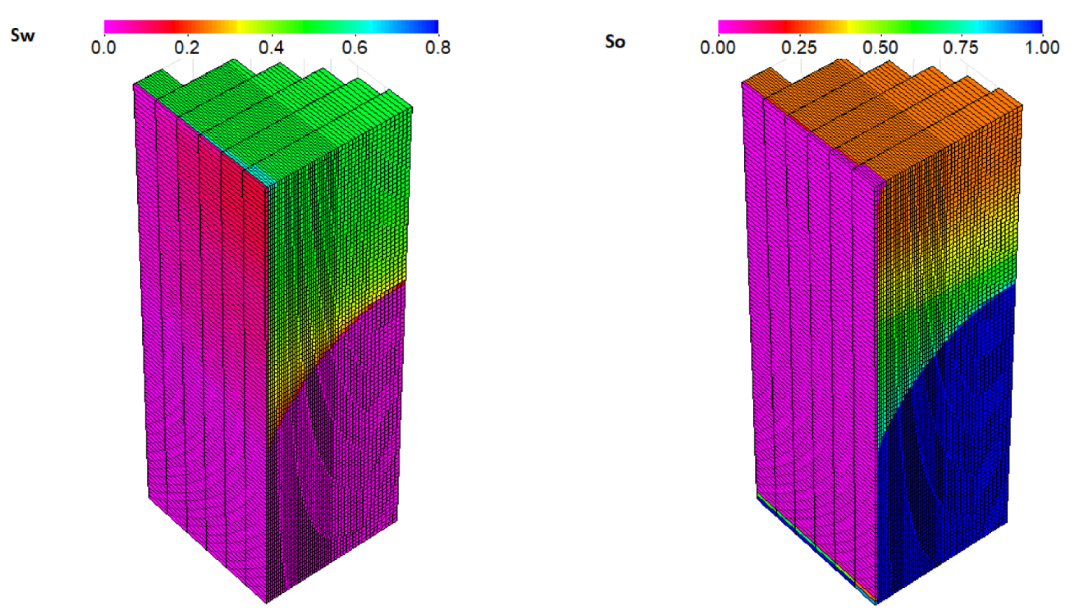
Figure 7 shows the water saturation and oil saturation at the end of foam injection. Water was able to enter the matrix block thanks to the increased pressure in the fracture during the foam injection that helped water overcome the water-oil capillary pressure. Oil saturation was low on the upper part of the rock because of water invasion and a small amount of gas that entered. Note that although the oil saturation was close to 1 at the lower part of the rock, the decane-in-place had been partially displaced by diffusion of methane and ethane.

3.2. Sensitivity Study by Increasing Foam Strength

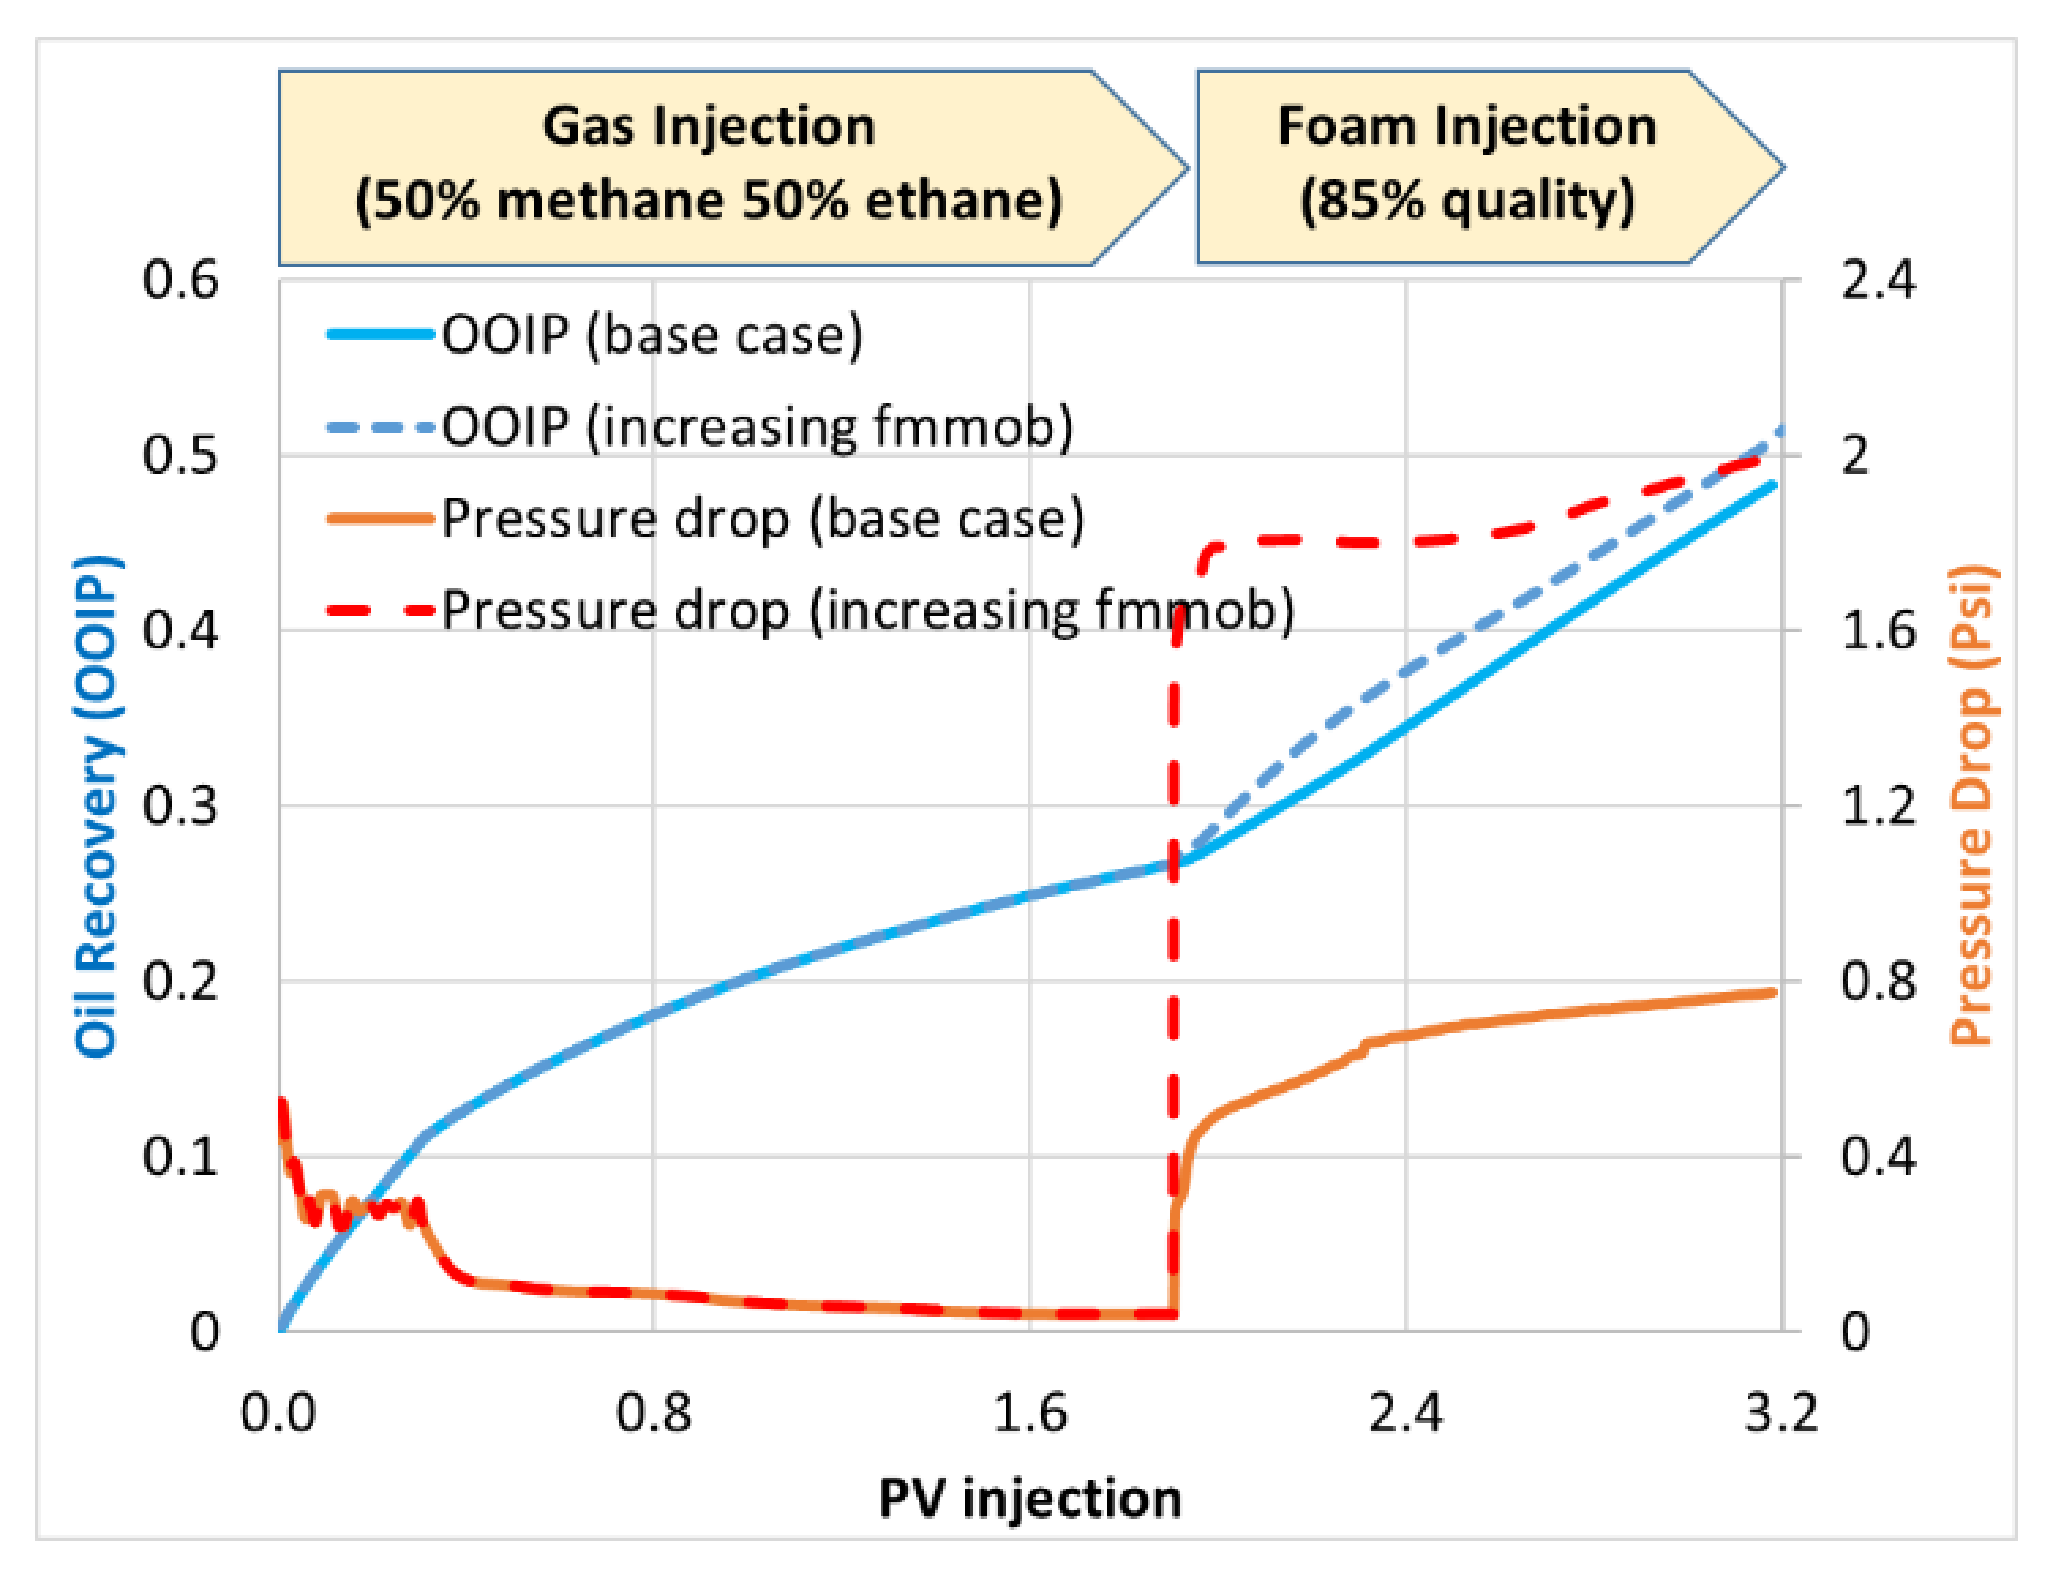
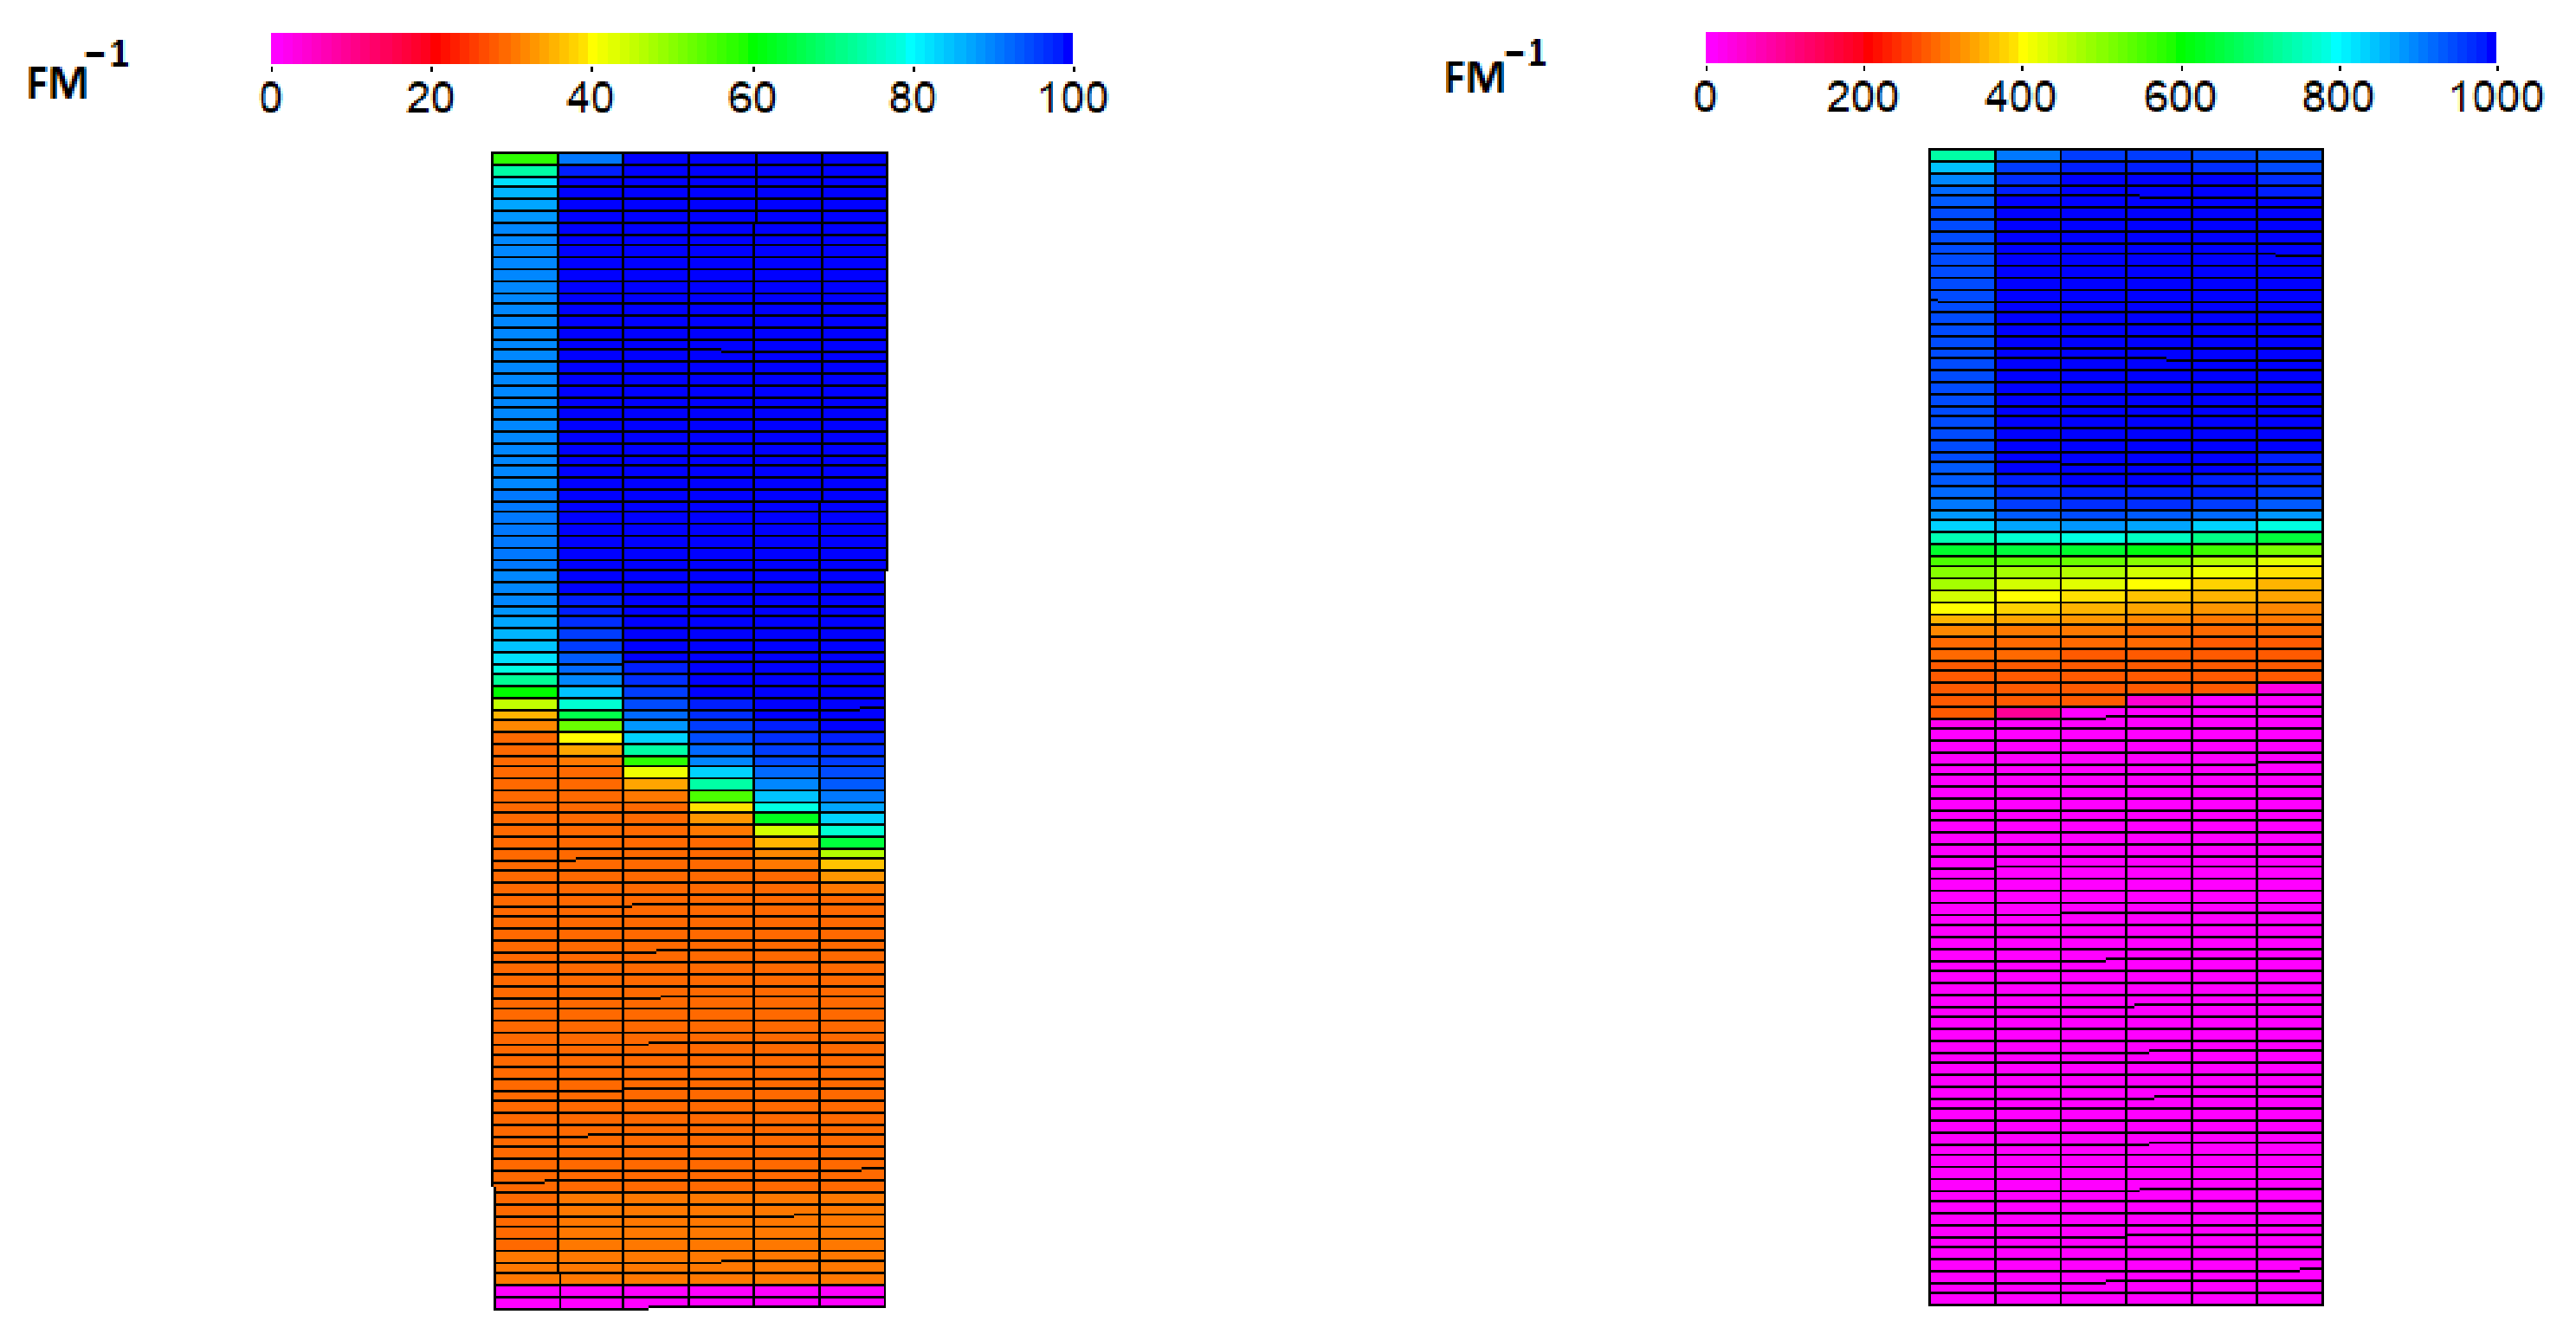
This study is aimed to investigate the effect of foam strength on the oil recovery and pressure drop based on the above case. All parameters were kept the same as the above base case except that fmmob was artificially increased by 10 times, i.e., to 1100. Simulation was conducted and the comparison of simulation results for oil recovery and pressure drop are plot in Figure 8. The sensitivity study shows that the pressure drop increases greatly as fmmob is 10 times higher than the base case. The resulting oil recovery during the foam injection period is 26% OOIP compared to 22% OOIP of the base case, generating a 4% additional oil recovery. Figure 9 compares the reciprocal of the foam mobility reduction factor (FM−1) in the fracture at the end of foam injection (3.2 PV). The FM−1 value is close to fmmob at the upper part of the fracture for each of the case. The lower part of fracture has weaker foam, mainly because the water saturation is lower and oil saturation is higher. This case indicates that increasing foam strength is helpful to improved oil recovery in such a case.

3.3. Simulation of 75% Ethane 25% Methane Near Miscible Foam Injection

This case simulates the 75% ethane 25% methane gas and foam injection experiment that was also conducted in [24]. The injected gas was more miscible with the in-situ oil than the previous case, but the pressure was still slightly below MMP and hence a near miscible flood. The core and confined pressure were the same as the previous case, so the used parameters and properties were the same as Table 1. Gas flooding lasted for 2 PVs, followed by 1 PV foam injection with the same injection rate and foam quality.
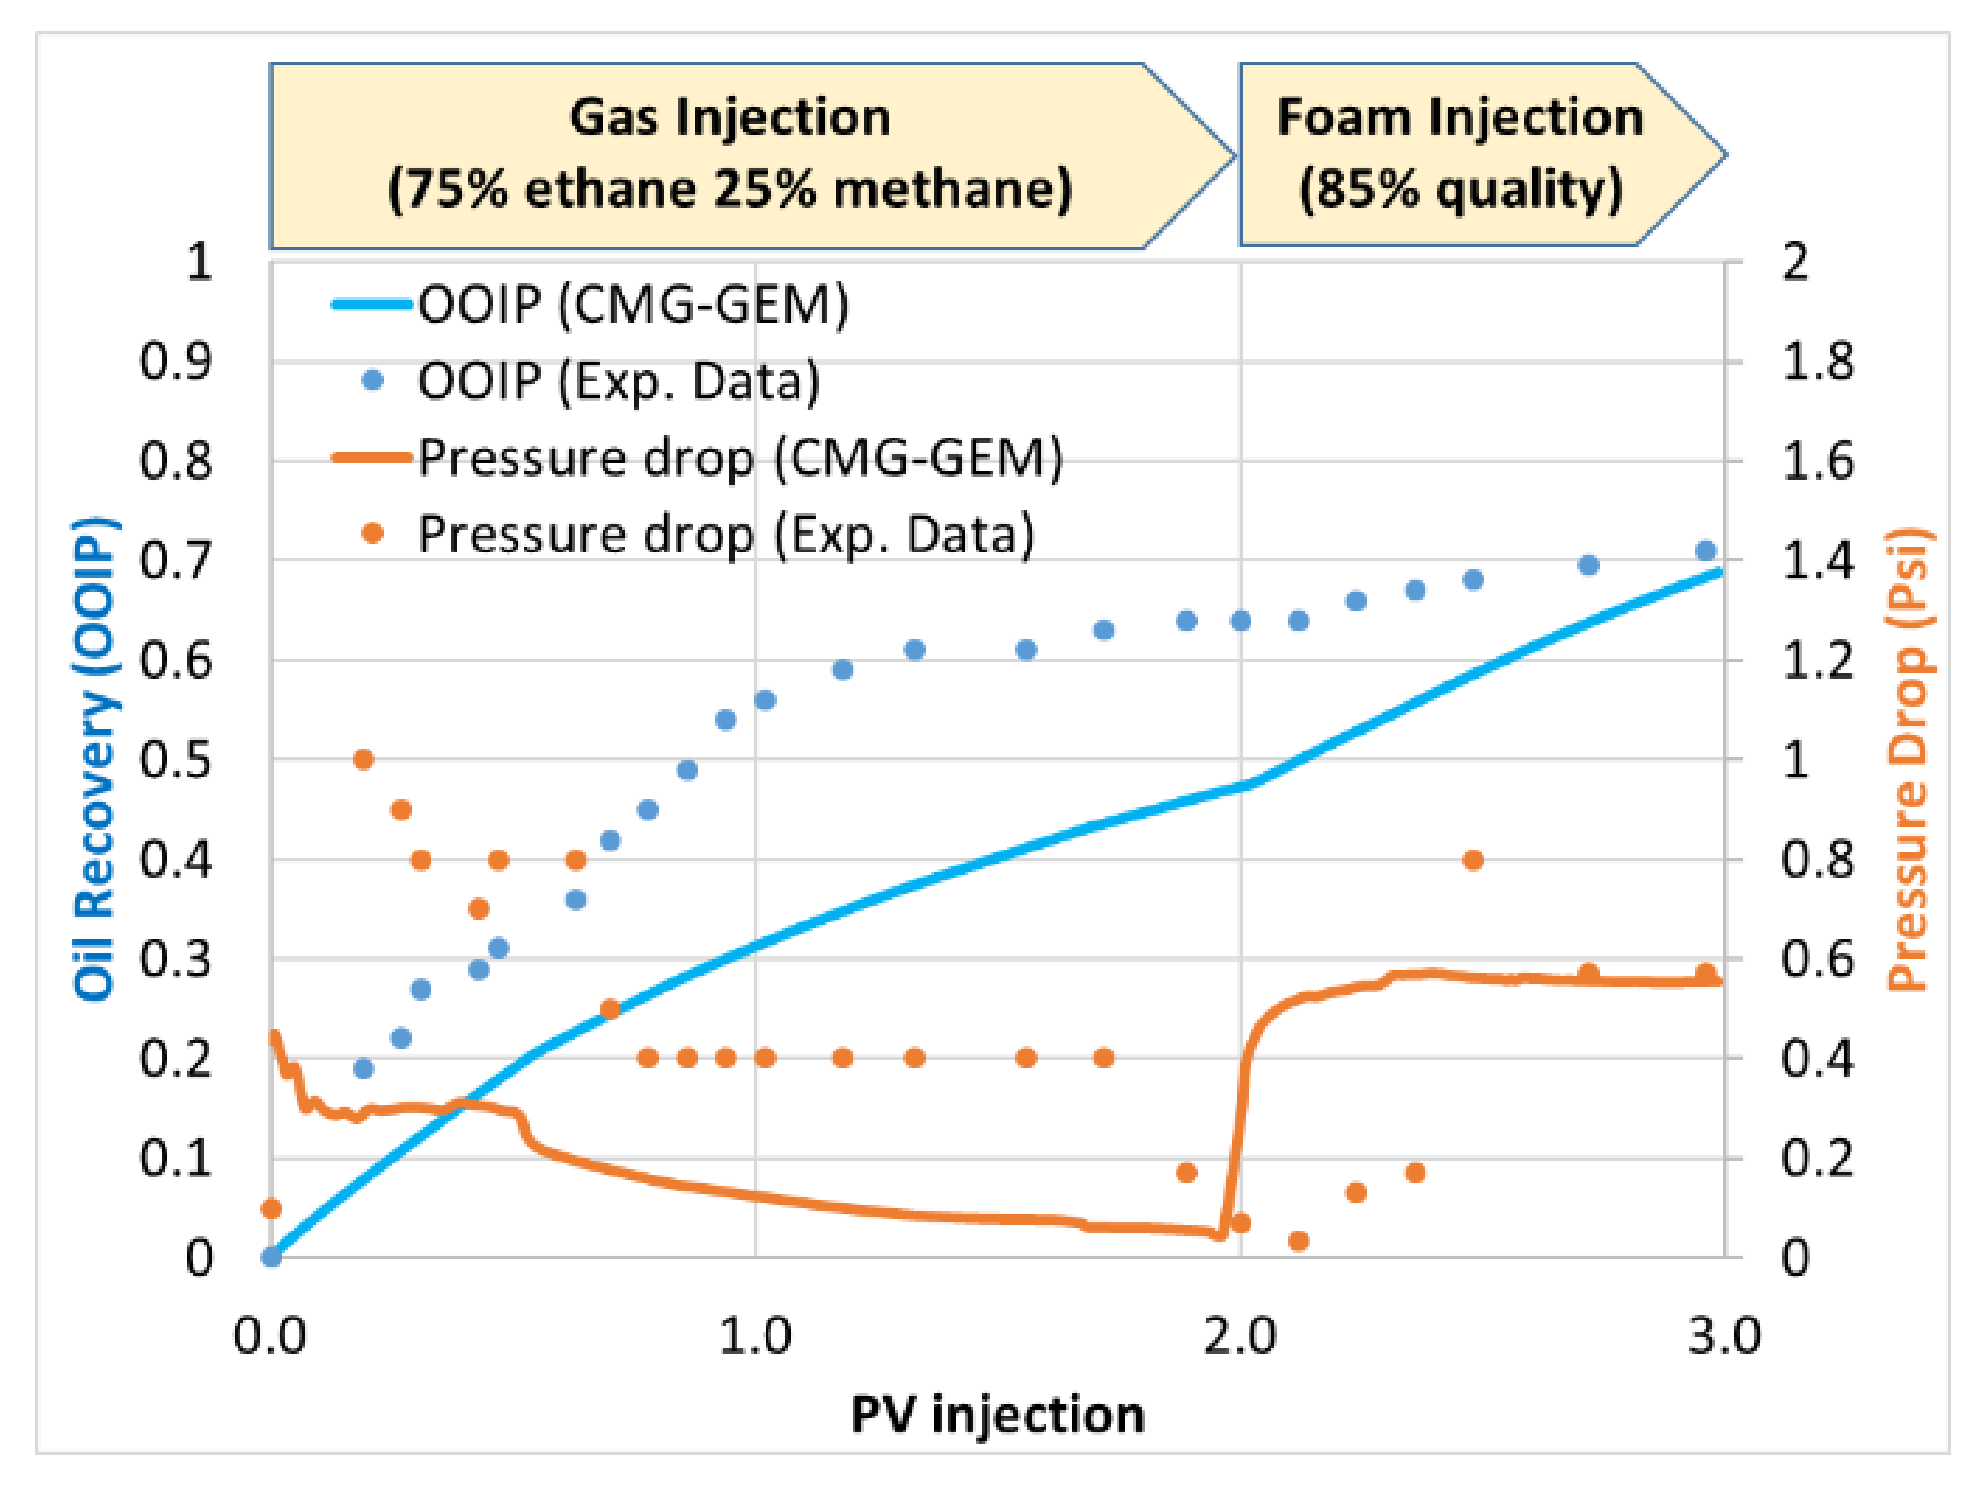
Figure 10 depicts the simulated oil recovery and pressure drop, which are compared to the experimental data. Even though the simulation results do not match the data well, the overall trend is largely captured. Note that the purpose of this study was not to perfectly history-match all experiments due to several restrictions (such as using the same set of core and fluid properties among different experiments) and the uncertainties in the laboratory experiment (such as the actual aperture of the fracture could be uncertain). The main goal is to use the simulation tool to understand how the change of injected gas composition and foam affect the overall behavior. The increase in gas enrichment increased oil recovery by the gas flood. Shifting to foam injection in this case led to a significant acceleration of oil production and increasing of pressure drop. Foam apparently plays an important role in this process.
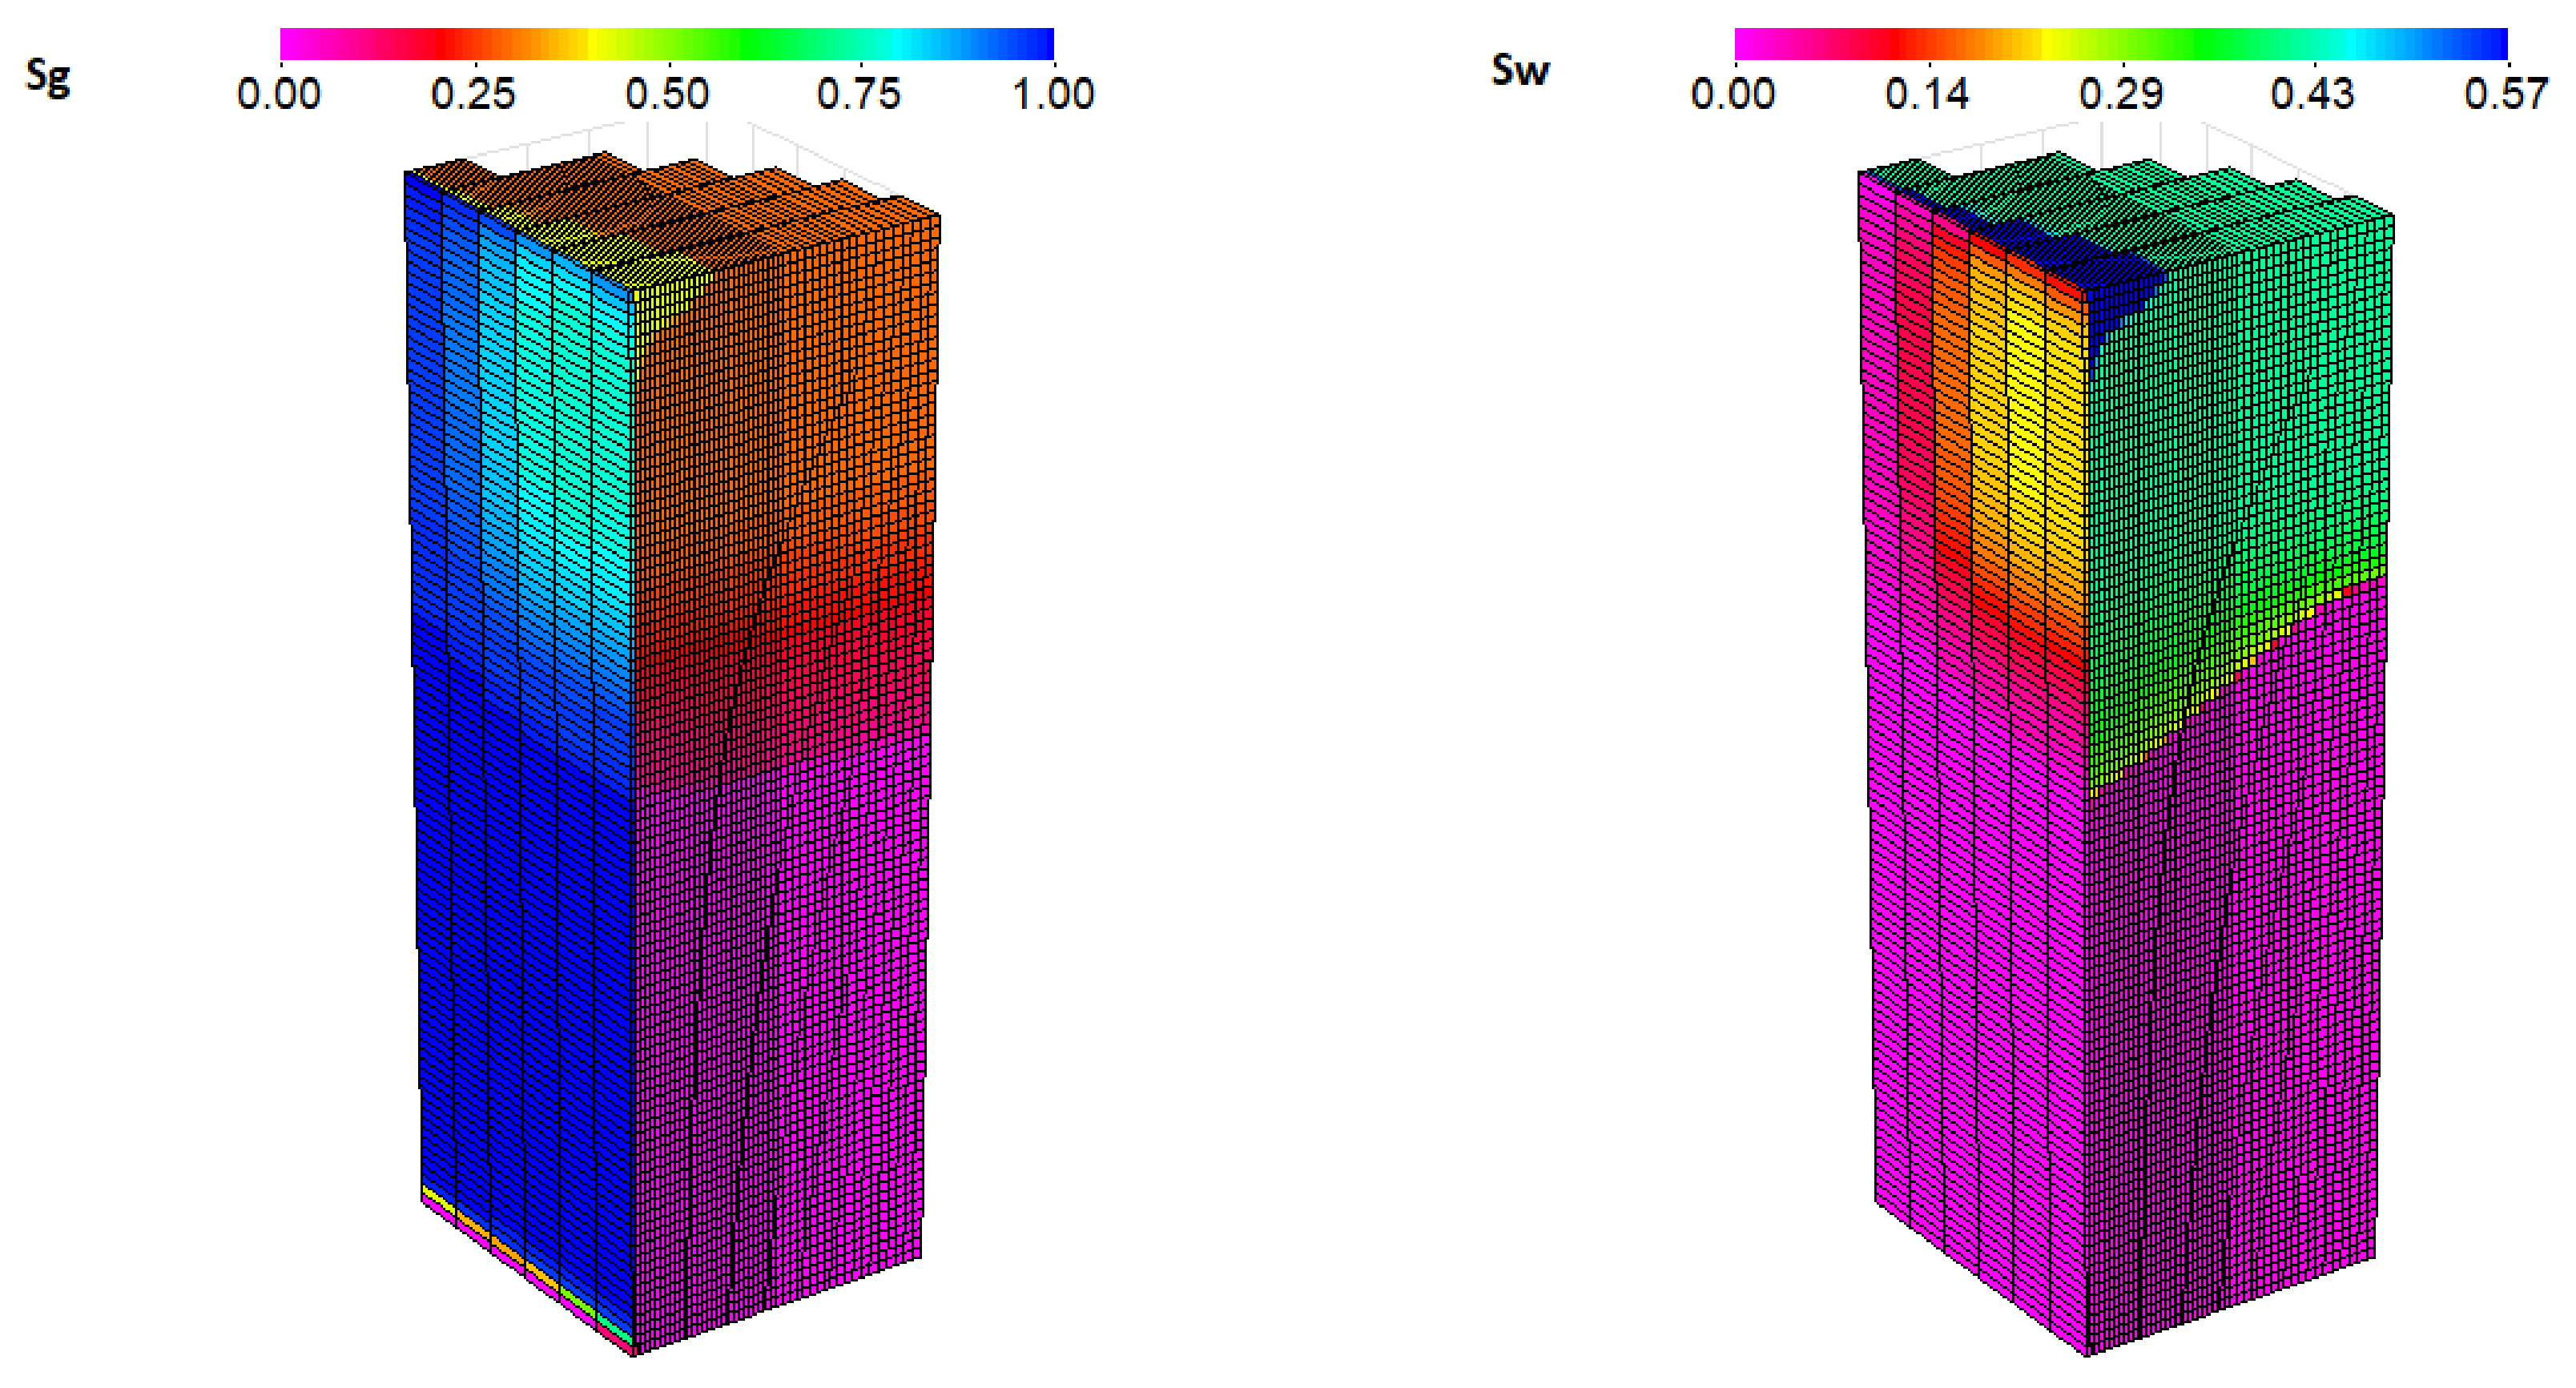
Figure 11 shows the distributions of water saturation and gas saturation at the end of foam injection (3.0 PV). Water is able to overcome the entry capillary due to the greater pressure gradient created by foam and to enter the upper side of the matrix and displace the oil therein. Gas saturation is small at the bottom of fracture near the producer. This is where the oil component is rich as drained from the matrix. The upper part of the fracture has more foam and the bottom part has more gas because foam followed gas injection.

3.4. Simulation of 100% Ethane Miscble Foam Injection

This case simulates the 100% ethane gas injection experiment, which was also conducted in [24]. Since the pressure was above MMP, it was a miscible injection. The case adopts the same set-up as the previous cases except that the gas flood is for 1.5 PV followed by 1.0 PV foam injection.
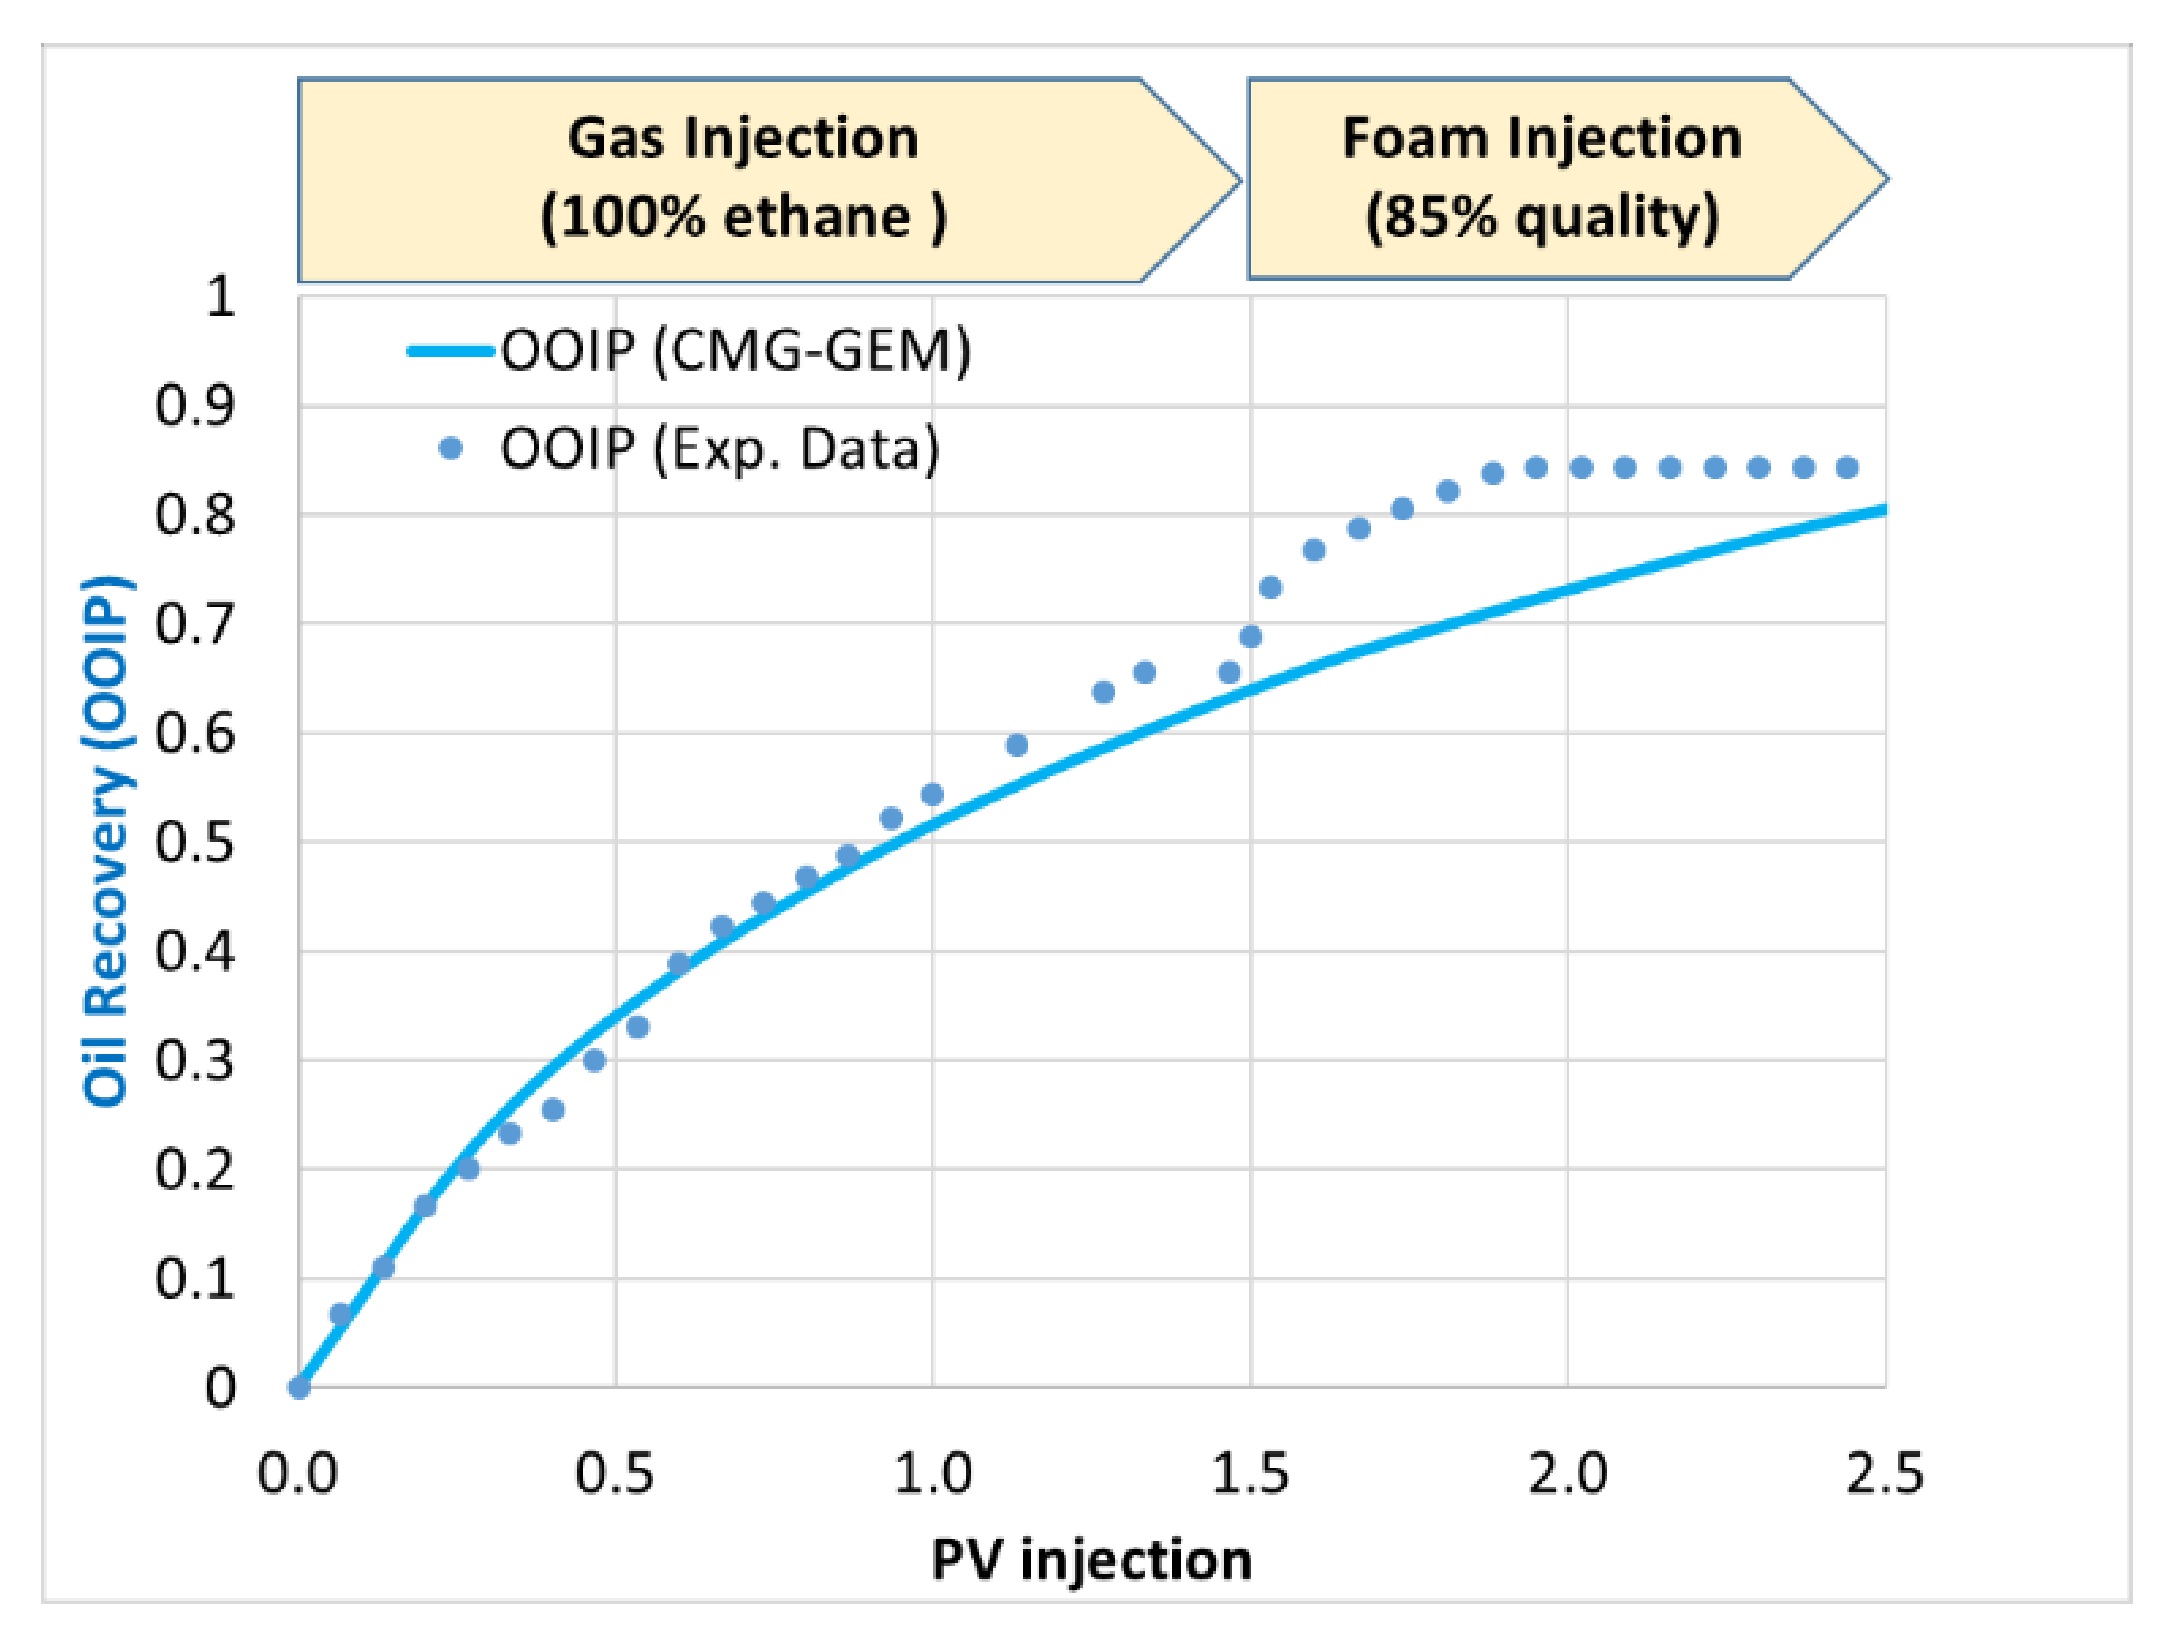
Figure 12 plots the oil recovery from simulation compared to the experimental data (note that there were no pressure data for this case). A good match is observed during the gas flooding process until 1.5 PV injection.
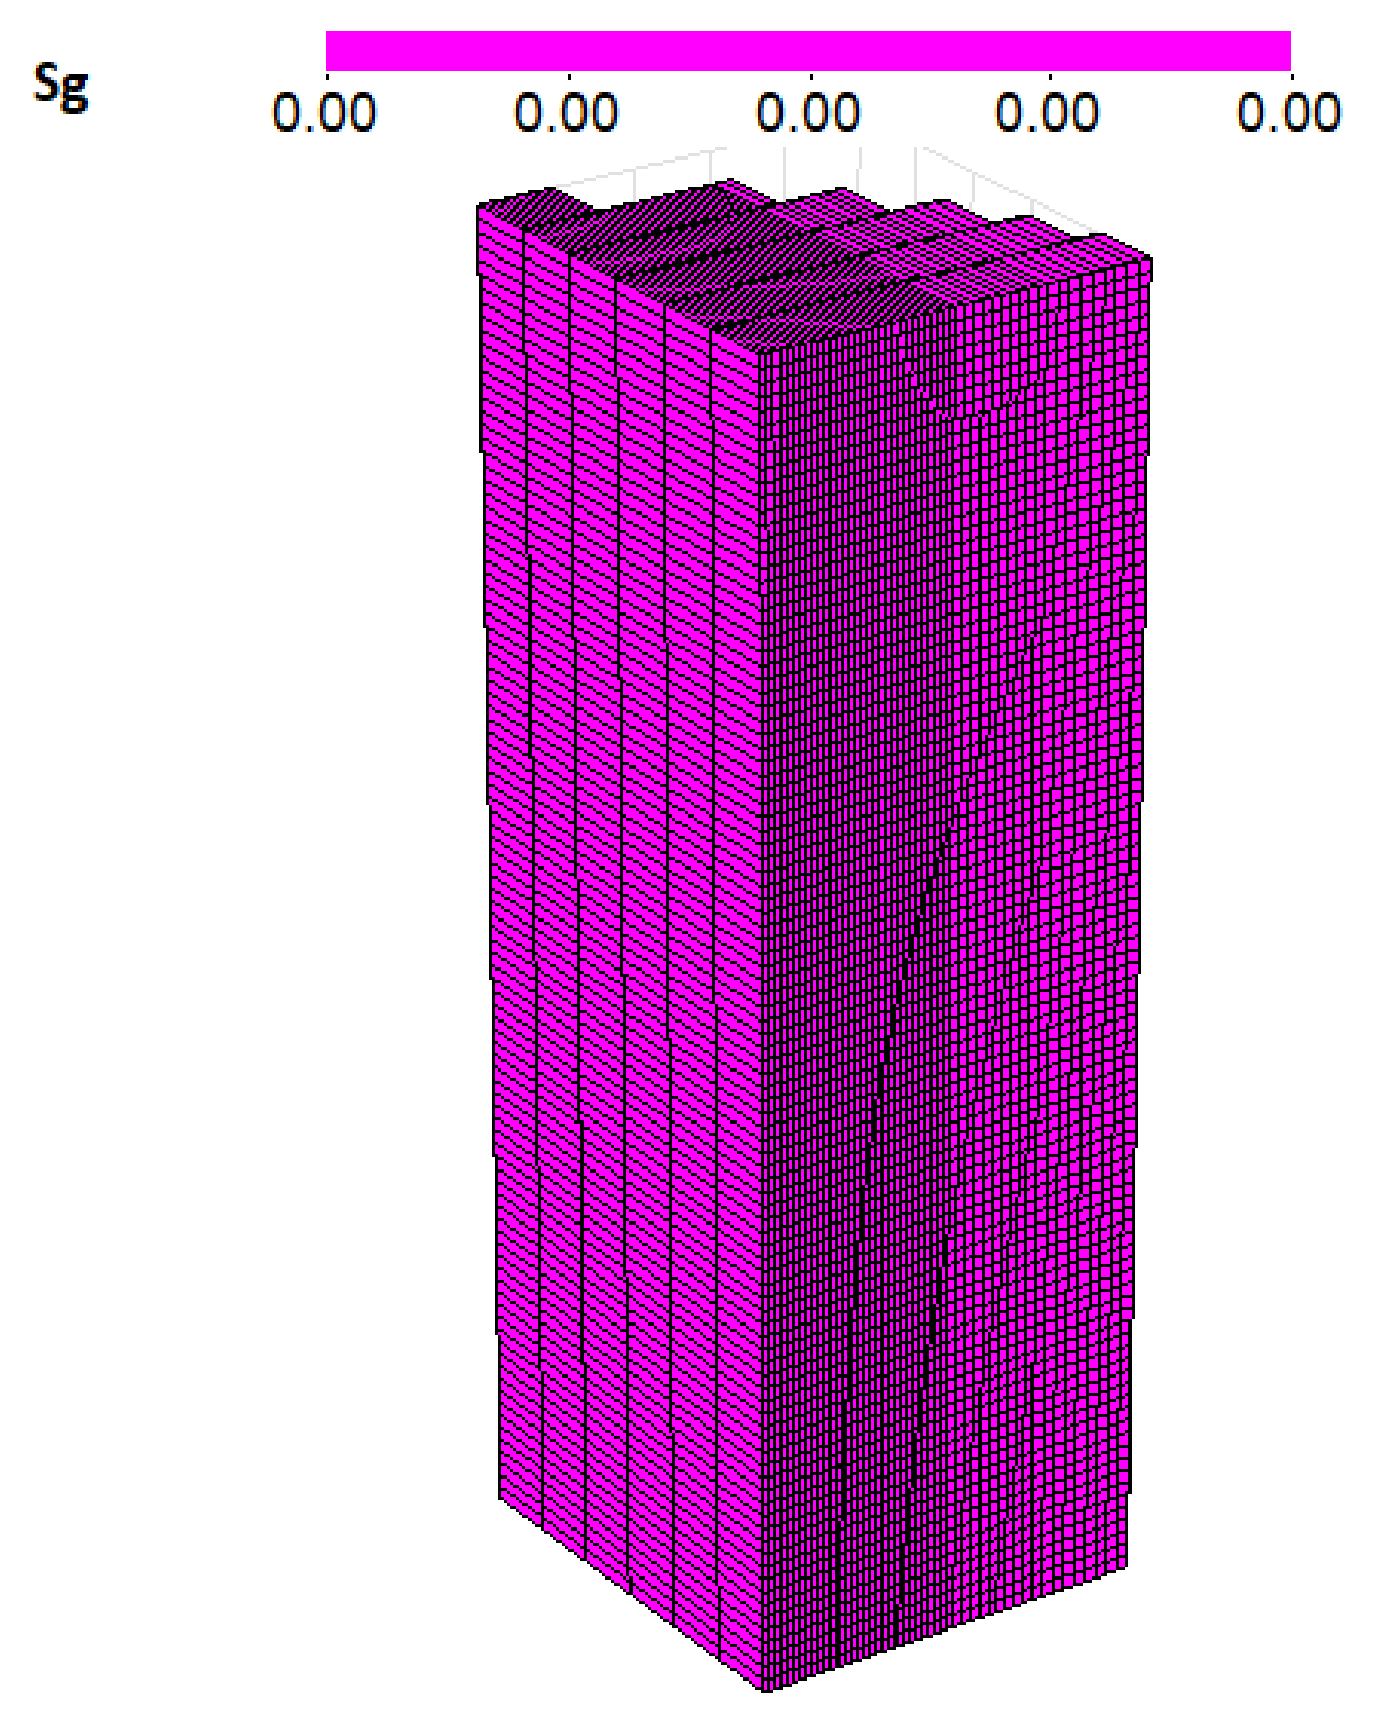
However, it is shown in Figure 13 that gas saturation is zero everywhere in the core during the foam injection. As indicated by Equations (1)–(5), the CMG-GEM foam model modifies the gas relative permeability to account for foam effect. Since there is no gas in the simulation, then no foam can be modeled. This simulation was apparently problematic. In addition, it was not successful to modify the gas-oil phase identification option to address this issue. A comprehensive discussion about the challenge is presented in the next section.

4. Discussion

We have demonstrated that the simulations are reasonable for near miscible gas foam injection processes. However, we have seen great challenges when it comes to modeling miscible foam processes, as the oil and gas phases cannot be distinguished and the fluid mixture above MMP is identified as the oil phase. This same issue has been reported in other references [24,39]. Foams with other similar solvents such the CO2 foam should also encounter this problem. From a physics point of view, solvent-rich phase should belong to the dispersed phase in foam or emulsion and act like a gas phase. As a result, the foam model should incorporate the effect of composition to identify if the relative permeability of the relevant fluids should be modified or not. There have been a couple of preliminary studies on this topic [40]. It was found out that both solvent-rich and decane-rich regions generated high apparent foam viscosity while the lowest foam strength was observed in-between in the solvent quality scan experiment [40]. This study could be helpful to develop a foam model that account for the effect of compositional variations on the foam mobility. For example, a more reasonable foam model should first judge if the oil phase in the absence of a gas phase is solvent-rich or heavy-component-rich according to a threshold of the solvent mole fraction. If the oil phase is solvent-rich, then it acts like a dispersed phase in the foam and the oil relative permeability should be modified like a gas relative permeability in a classical foam model. The equations could possibly be written as below:
k r o f = k r o F M o , i f x s o l > = t h r e s h o l d   v a l u e
where kro is the oil relative permeability in the absence of foam, krof is the oil relative permeability in the presence of foam, FMo is the mobility reduction factor for oil relative permeability, and xsol is the mole fraction of the solvent in the oil phase. FMo is a function of various factors that can be similar to the FM expressed by Equation (2).
The observation in [40] that a decane-rich region could enhance foam viscosity is somehow contradictory to the common view that oil is detrimental to foam stability [10]. One possible reason is that the oil type used for testing foam stability is also important. As a whole, modeling the miscible gas foam is very complex. It should be a focus for future studies of miscible gas foams that have gained more attention in the industry.

5. Conclusions

In this paper, we have demonstrated an approach to set up the simulation of near miscible or miscible gas foam injection coreflood experiments in fractured oil-wet rock. The following conclusions can be drawn.
  • Simulations were successfully carried out and able to match the experimental data of near miscible gas foam injection corefloods with respect to both oil recovery and pressure drop. Molecular diffusion of different components from fracture to matrix rock helped the displacement of in-situ oil. Water was diverted to the matrix with the help of foam that created higher pressure gradients. Invasion of both water and gas enforced in-situ oil from the matrix into the lower side of the facture.
  • Simulation results indicate that increasing the foam strength can moderately improve the oil recovery. Modifying the injected gas composition towards higher miscibility with in-situ oil is very helpful to boost the oil recovery as evidenced by both simulations and experiments. For a specific reservoir pressure, there can be an optimal injection strategy for gas and foam injection depending on the gas availability.
  • Miscible gas-foam injection leads to a high oil recovery, but the foam is not properly modeled in this process due to the difficulties in distinguishing the oil and gas in the simulator. Since gas phase in not present above MMP, the foam model fails to modify the mobility of the fluids that has high flow resistance. A few preliminary references attempted to investigate the effect of composition variations on foam strength.
As a whole, this paper provides a successful framework to simulate three-dimensional gas and foam flow in fractured cores using a commercial simulator. However, it would have less restrictions to model the foam behavior with an in-house developed code. In simulation of a practical foam process, the miscibility could vary with space and time depending on the variations of pressure and composition. Therefore, it is of great importance to understand and simulate near-miscible and miscible flows. The paper advocates focusing on studying the effect of composition variations on foam mobility in both experimental and modeling aspects. A more sophisticated foam model is needed that is able to identify the dispersed phase in foam and assign proper foam resistance to miscible regions.

Author Contributions

Methodology, software, validation, formal analysis, investigation, data curation, writing—original draft preparation, visualization, H.L.; Conceptualization, resources, writing—review and editing, supervision, project administration, funding acquisition, K.K.M. All authors have read and agreed to the published version of the manuscript.

Funding

This research was funded by UT Gas-EOR IAP.

Acknowledgments

The authors would like to acknowledge the sponsorship of the UT Gas-EOR IAP. Jimin Zhou is acknowledged for initializing the simulation work. The simulator CMG-GEM is provided by CMG Ltd.

Conflicts of Interest

The authors declare no conflict of interest.

References

  1. Akbar, M.; Vissapragada, B.; Alghamdi, A.H.; Allen, D.; Herron, M.; Carnegie, A.; Dutta, D.; Olesen, J.R.; Chourasiya, R.D.; Logan, D.; et al. A snapshot of carbonate reservoir evaluation. Oilfield Rev. 2000, 12, 20–21. [Google Scholar]
  2. Wardlaw, N.C. Factors affecting oil recovery from carbonate reservoirs and prediction of recovery. Dev. Pet. Sci. 1996, 44, 867–903. [Google Scholar]
  3. Hirasaki, G.; Zhang, D.L. Surface chemistry of oil recovery from fractured, Oil-Wet, Carbonate Formations. SPE J. 2003, 9, 151–162. [Google Scholar] [CrossRef] [Green Version]
  4. Manrique, E.J.; Muci, V.E.; Gurfinkel, M.E. EOR field experiences in carbonate reservoirs in the United States. SPE Reserv. Eval. Eng. 2006, 10, 667–686. [Google Scholar] [CrossRef]
  5. Rossen, W.R. Foams in Enhanced Oil Recovery. In Foams: Theory, Measurements, and Applications; Marcel Dekker: New York, NY, USA, 1996; Volume 57, pp. 413–464. [Google Scholar]
  6. Li, R.F.; Yan, W.; Liu, S.; Hirasaki, G.; Miller, C.A. Foam mobility control for surfactant enhanced oil recovery. SPE J. 2010, 15, 928–942. [Google Scholar] [CrossRef] [Green Version]
  7. Kovscek, A.R.; Radke, C.J. Fundamentals of Foam Transport in Porous Media. In Foams: Fundamentals and Applications in the Petroleum Industry; ACS: Washington, DC, USA, 1994. [Google Scholar]
  8. Kovscek, A.R.; Bertin, H.J. Foam mobility in heterogeneous porous media. Transp. Porous Media 2003, 52, 17–35. [Google Scholar] [CrossRef]
  9. Ma, K.; Liontas, R.; Conn, C.A.; Hirasaki, G.J.; Biswal, S.L. Visualization of improved sweep with foam in heterogeneous porous media using microfluidics. Soft Matter 2012, 8, 10669–10675. [Google Scholar] [CrossRef]
  10. Myers, T.J.; Radke, C.J. Transient foam displacement in the presence of residual oil: Experiment and simulation using a population-balance model. Ind. Eng. Chem. Res. 2020, 39, 2725–2741. [Google Scholar] [CrossRef]
  11. Yan, W.; Miller, C.A.; Hirasaki, G.J. Foam sweep in fractures for enhanced oil recovery. Colloids Surf. A Physicochem. Eng. Asp. 2006, 282, 348–359. [Google Scholar] [CrossRef]
  12. Buchgraber, M.; Castanier, L.M.; Kovscek, A.R. Microvisual investigation of foam flow in ideal fractures: Role of fracture aperture and surface roughness. In Proceedings of the SPE Annual Technical Conference and Exhibition, San Antonio, TX, USA, 8–10 October 2012. [Google Scholar]
  13. Seethepalli, A.; Adibhatla, B.; Mohanty, K.K. Physicochemical interactions during surfactant flooding of fractured carbonate reservoirs. SPE J. 2004, 9, 411–418. [Google Scholar] [CrossRef]
  14. Singh, R.; Mohanty, K.K. Foams with wettability-altering capabilities for oil-wet carbonates: A synergistic approach. SPE J. 2016, 21, 1–26. [Google Scholar] [CrossRef]
  15. Szlendak, S.M.; Nguyen, N.M.; Nguyen, Q.P. Laboratory investigation of low-tension-gas flooding for improved oil recovery in tight formations. SPE J. 2013, 15, 851–866. [Google Scholar] [CrossRef]
  16. Hahn, R.; Spilker, K.; Alexis, D.; Linnemeyer, H.; Malik, T.; Dwarakanath, V. Low tension foam flooding for chemical enhanced oil recovery in heterogeneous systems. In Proceedings of the SPE Annual Technical Conference and Exhibition, Dallas, TX, USA, 24–26 September 2018. [Google Scholar]
  17. Dong, P.; Puerto, M.; Ma, K.; Mateen, K.; Ren, G.; Bourdarot, G.; Morel, D.; Biswal, S.L.; Hirasaki, G. Ultralow-Interfacial-Tension foam injection strategy inverstigation in high temperature Ultra-High Salinity fractured carbonate reservoirs. In Proceedings of the SPE Improved Oil Recovery Conference, Tulsa, OK, USA, 14–18 April 2018. [Google Scholar]
  18. Chevallier, E.; Bouquet, S.; Gland, N.; Douarche, F.; Batôt, G. Advanced EOR Foam in Naturally Fractured Carbonates Reservoirs: Optimal Balance between Foam and Interfacial Tension Properties. In Proceedings of the SPE Middle East Oil and Gas Show and Conference, Manama, Bahrain, 18–21 March 2019. [Google Scholar]
  19. Farajzadeh, R.; Andrianov, A.; Zitha, P.L. Investigation of immiscible and miscible foam for enhancing oil recovery. Ind. Eng. Chem. Res. 2010, 169, 1910–1919. [Google Scholar] [CrossRef]
  20. Ren, G.; Nguyen, Q.P.; Lau, H.C. Laboratory investigation of oil recovery by CO2 foam in a fractured carbonate reservoir using CO2-Soluble surfactants. J. Pet. Sci. Eng. 2018, 169, 277–296. [Google Scholar] [CrossRef]
  21. Cui, L.; Klimenko, A.; Dubos, F.; Lagorse, M.; Bourrel, M. Novel Switchable Alkyl-Amine Surfactants for CO2 Emulsion. In Proceedings of the SPE Improved Oil Recovery Conference, Tulsa, OK, USA, 14–18 April 2018. [Google Scholar]
  22. Mukherjee, J.; Nguyen, Q.P.; Scherlin, J.; Vanderwal, P.; Rozowski, P. CO2 Foam Pilot in Salt Creek Field, Natrona County, WY: Phase III: Analysis of Pilot Performance. In Proceedings of the SPE Improved Oil Recovery Conference, Tulsa, OK, USA, 11–13 April 2016. [Google Scholar]
  23. Fredriksen, S.B.; Alcorn, Z.P.; Frøland, A.; Viken, A.; Rognmo, A.U.; Seland, J.G.; Graue, A. Surfactant prefloods during carbon dioxide foam injection for integrated enhanced oil recovery in fractured oil-wet carbonates. SPE J. 2019, 24, 1139–1153. [Google Scholar] [CrossRef]
  24. Zhou, J.; Sharma, H.; Mohanty, K. Improved gravity drainage by gas in fractured, oil-wet carbonate rocks using mobility control agents. In Proceedings of the SPE Annual Technical Conference and Exhibition, Dallas, TX, USA, 24 September 2018. [Google Scholar]
  25. Jian, G.; Zhang, L.; Da, C.; Puerto, M.; Johnston, K.P.; Biswal, S.L.; Hirasaki, G.J. Evaluating the transport behavior of CO2 foam in the presence of crude oil under high-temperature and high-salinity conditions for carbonate reservoirs. Energy Fuels 2019, 33, 6038–6047. [Google Scholar] [CrossRef]
  26. Sharma, M.; Alcorn, Z.P.; Fredriksen, S.B.; Rognmo, A.U.; Fernø, M.A.; Skjæveland, S.M.; Graue, A. Model calibration for forecasting CO2-foam enhanced oil recovery field pilot performance in a carbonate reservoir. Pet. Geosci. 2020, 26, 141–149. [Google Scholar] [CrossRef]
  27. Eide, Ø.; Fernø, M.; Bryant, S.; Kovscek, A.; Gauteplass, J. Population-balance modeling of CO2 foam for CCUS using nanoparticles. J. Nat. Gas Sci. Eng. 2020, 80, 103378. [Google Scholar] [CrossRef]
  28. Zuta, J.; Fjelde, I.; Berenblyum, R. Experimental and simulation of CO2-foam flooding in fractured chalk rock at reservoir conditions: Effect of mode of injection on oil recovery. Proceedings of SPE EOR Conference at Oil & Gas West Asia, Muscat, Oman, 11–13 April 2010. [Google Scholar]
  29. Farajzadeh, R.; Wassing, B.M.; Boerrigter, P.M. Foam assisted gas–oil gravity drainage in naturally-fractured reservoirs. J. Pet. Sci. Eng. 2012, 94, 112–122. [Google Scholar] [CrossRef]
  30. Ren, G.; Yu, W. Numerical investigations of key aspects influencing CO2 foam performance in fractured carbonate system using CO2 soluble surfactants. J. CO2 Util. 2019, 33, 96–113. [Google Scholar] [CrossRef]
  31. Cheng, L.; Reme, A.B.; Shan, D.; Coombe, D.A.; Rossen, W.R. Simulating foam processes at high and low foam qualities. In Proceedings of the SPE/DOE Improved Oil Recovery Symposium, Tulsa, OK, USA, 3–5 April 2000. [Google Scholar]
  32. CMG GEM. GEM User Guide; Computer Modelling Group Ltd.: Calgary, AB, Canada, 2017. [Google Scholar]
  33. Chen, Q.; Gerritsen, M.; Kovscek, A.R. Modeling foam displacement with the local-equilibrium approximation: Theory and experimental verification. SPE J. 2010, 15, 171–183. [Google Scholar] [CrossRef]
  34. Kam, S.I. Improved mechanistic foam simulation with foam catastrophe theory. Colloids Surf. A Physicochem. Eng. Asp. 2008, 318, 62–77. [Google Scholar] [CrossRef]
  35. Luo, H.; Mateen, K.; Ma, K.; Ren, G.; Neillo, V.; Blondeau, C.; Dong, P.; Puerto, M.; Biswal, S.; Hirasaki, G. In-Depth understanding of the ultra-low-interfacial-tension foam flood in oil-wet fractured media through simulation with an integrative mechanistic foam model. In Proceedings of the SPE Annual Technical Conference and Exhibition, Calgary, AB, Canada, 23 September 2019. [Google Scholar]
  36. Ma, K.; Ren, G.; Mateen, K.; Morel, D.; Cordelier, P. Modeling techniques for foam flow in porous media. SPE J. 2015, 20, 453–470. [Google Scholar] [CrossRef]
  37. CMG WinProp. WinProp User Guide; Computer Modelling Group Ltd.: Calgary, AB, Canada, 2017. [Google Scholar]
  38. Sigmund, P.M. Prediction of molecular diffusion at reservoir conditions. Part II—Estimating the effects of molecular diffusion and convective mixing in multicomponent systems. JCPT 1976, 15, 53–62. [Google Scholar] [CrossRef]
  39. Tang, J. The Effect of Oil on Foam for Enhanced Oil Recovery: Theory and Measurements. Ph.D. Thesis, Delft University of Technology, Delft, The Netherlands, 2019. [Google Scholar]
  40. Kahrobaei, S.; Li, K.; Bonnieu, S.V.; Farajzadeh, R. Effects of compositional variations on CO2 foam under miscible conditions. AIChE J. 2018, 64, 758–764. [Google Scholar] [CrossRef]
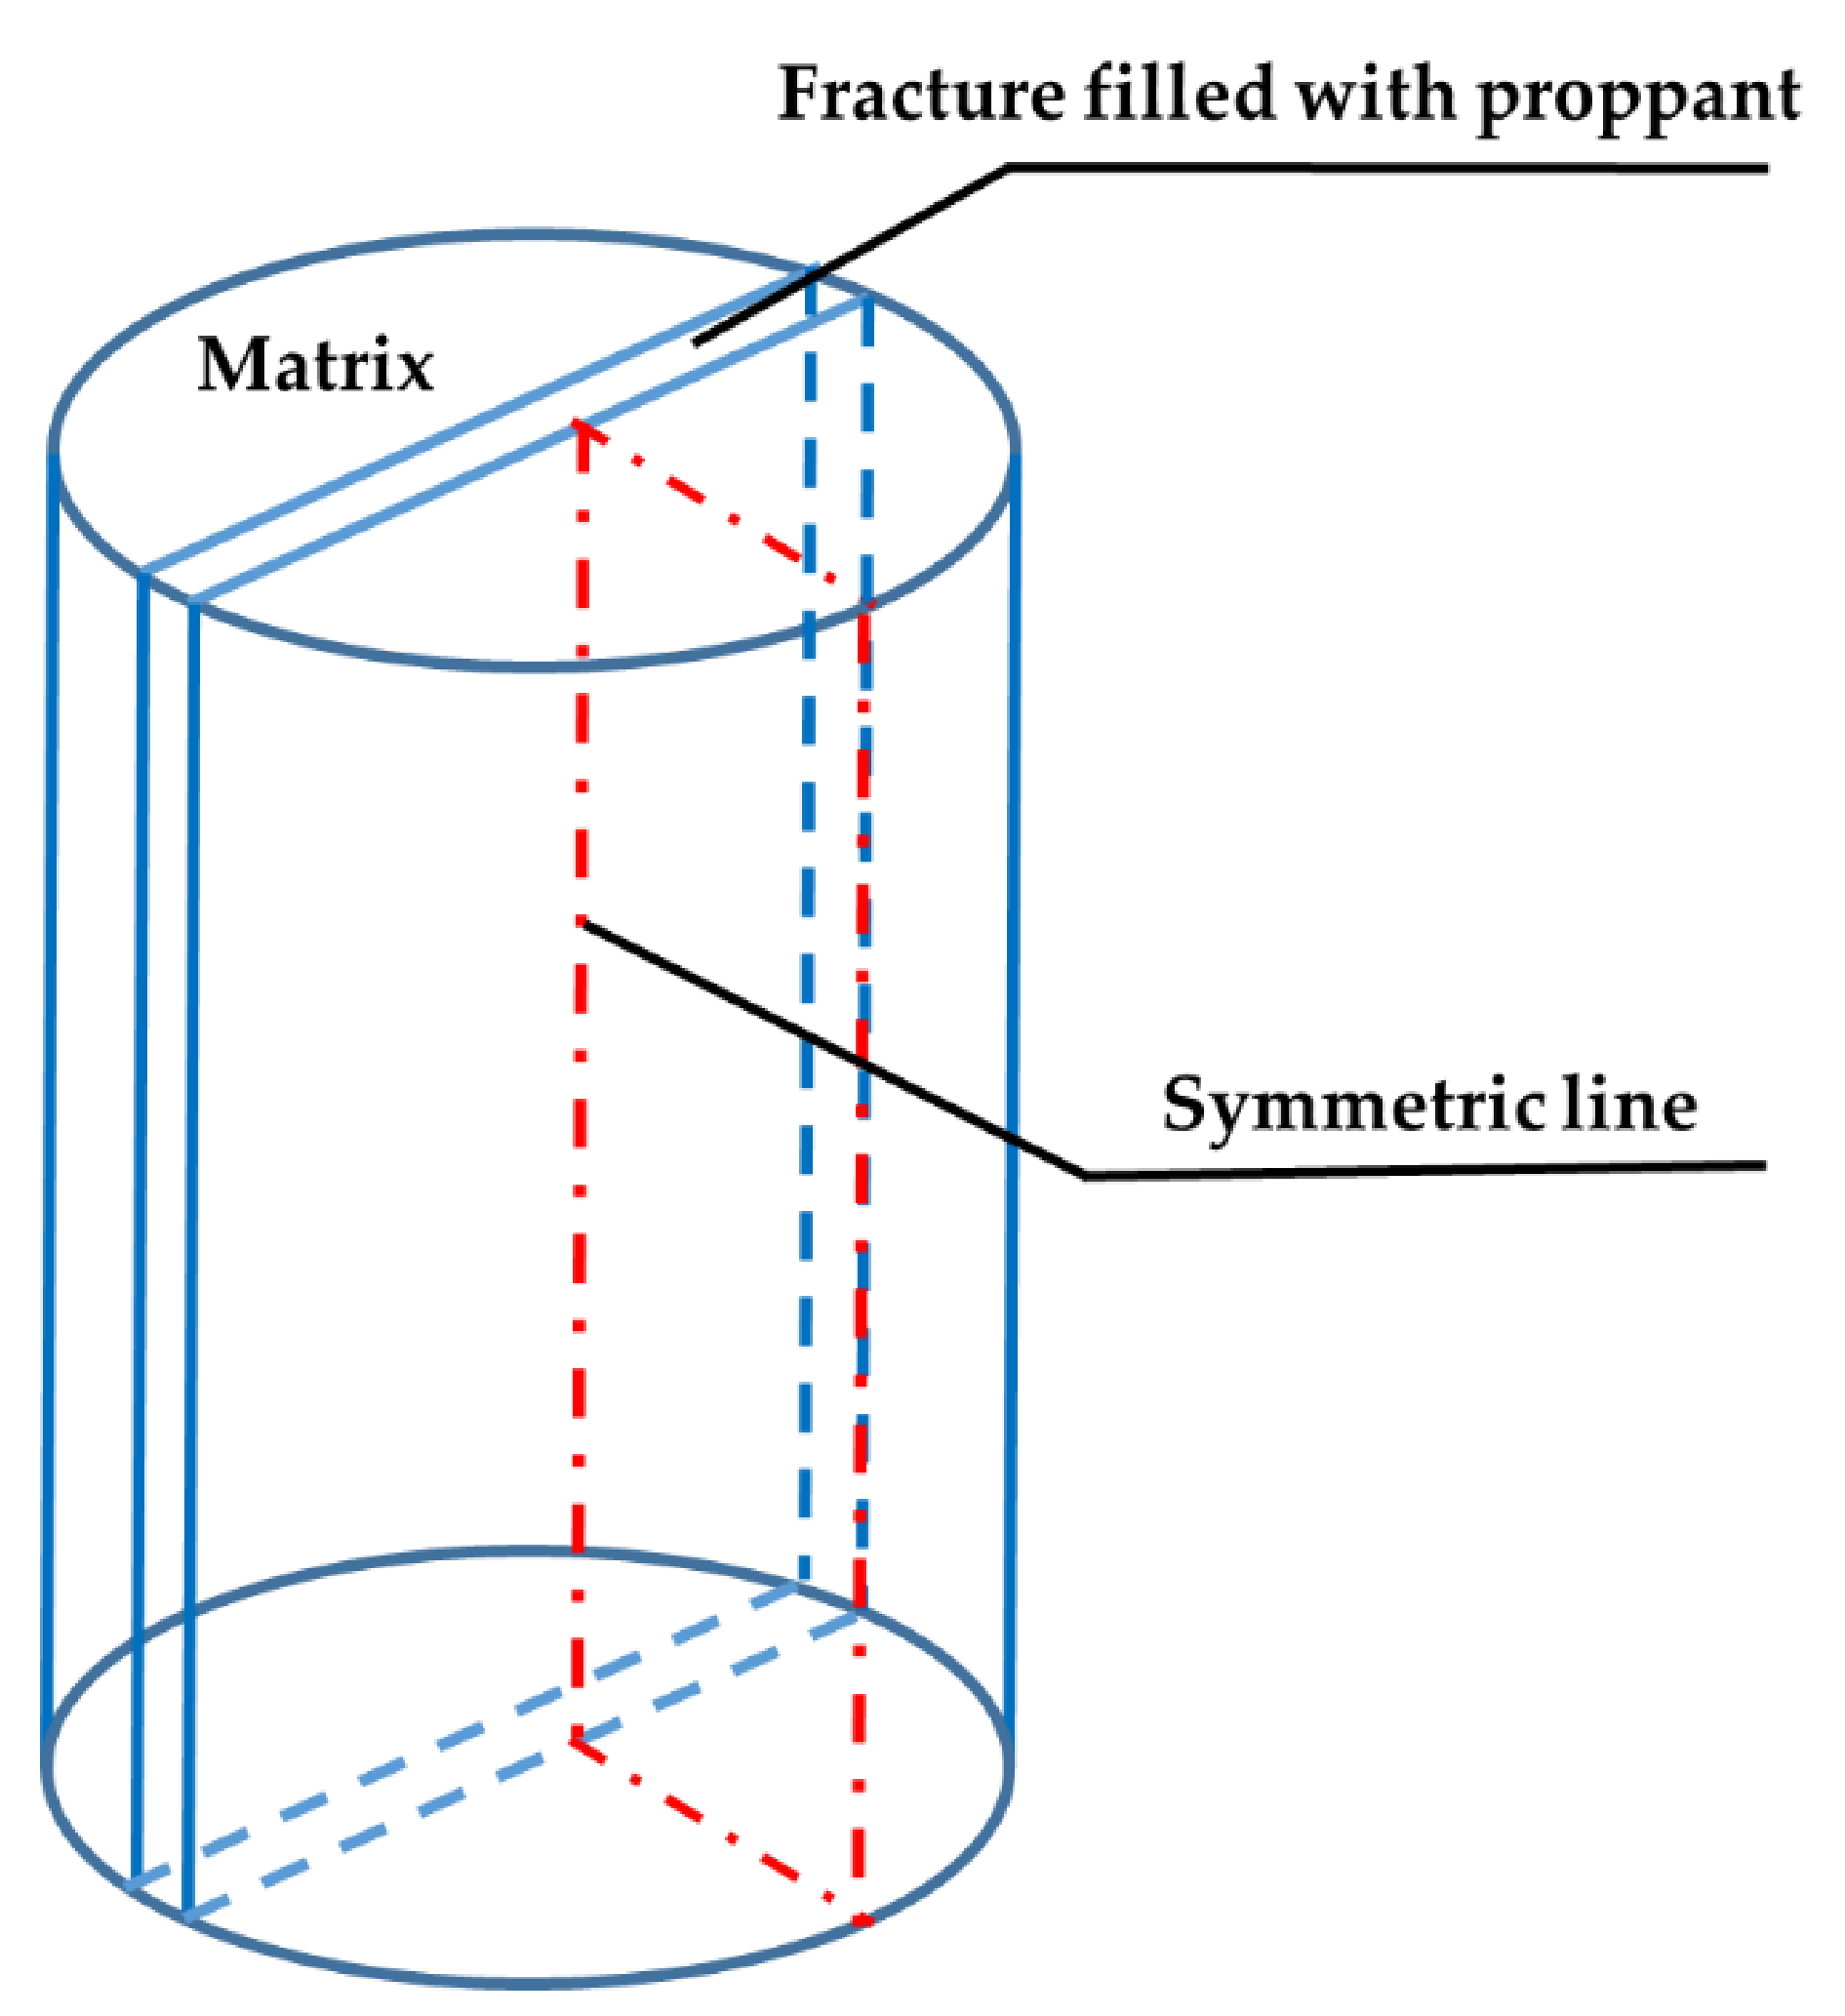
Figure 1. Geometry of fractured core model with a quarter cylinder.
Energies 14 01998 g001
Figure 2. Grid of the quarter cylinder geometry.
Energies 14 01998 g002
Figure 3. Simulated oil recovery and pressure drop compared to the experimental data for 50% ethane 50% methane injection.
Energies 14 01998 g003
Figure 4. Profiles of ethane mole fraction at 0.5 PV and 1.0 PV of gas flooding.
Energies 14 01998 g004
Figure 5. Profiles of methane mole fraction at 0.5 PV and 1.0 PV of gas flooding.
Energies 14 01998 g005
Figure 6. Profiles of gas saturation at 0.5 PV and 1.0 PV of gas flooding.
Energies 14 01998 g006
Figure 7. Profiles of oil and water saturations at the end of foam injection (3.2 PV).
Energies 14 01998 g007
Figure 8. Sensitivity study for the oil recovery and pressure drop by increasing fmmob by 10 times.
Energies 14 01998 g008
Figure 9. Profiles of the reciprocal of the foam mobility reduction factor (FM) in fracture at the end of foam injection (3.2 PV) for the base case (left) and the studied case (right).
Energies 14 01998 g009
Figure 10. Simulated oil recovery and pressure drop compared to the experimental data for 75% ethane 25% methane injection.
Energies 14 01998 g010
Figure 11. Profiles of water saturation and gas saturation at the end of foam injection (3.0 PV).
Energies 14 01998 g011
Figure 12. Simulated oil recovery compared to the experimental data for 100% ethane injection.
Energies 14 01998 g012
Figure 13. Profiles of gas saturation at the end of foam injection (2.5 PV).
Energies 14 01998 g013
Table 1. Rock and fluid properties for the simulation case.
PropertyValue
Fracture Permeability2250 mD
Fracture Porosity0.8
Matrix Permeability10 mD
Matrix Porosity0.28
Initial oil saturation1.0
Swr in matrix0.2
Sorw in matrix0.2
Sorg in matrix0.2
Sgc in matrix0.08
Water capillary entry pressure0.1 psi
Gas capillary entry pressure0.2 psi
Resistivity (Sigmund model)4.8
fmmob110
fmoil0.2
floil0.1
epoil1
sfdry0.01
sfbet100
Publisher’s Note: MDPI stays neutral with regard to jurisdictional claims in published maps and institutional affiliations.