Article

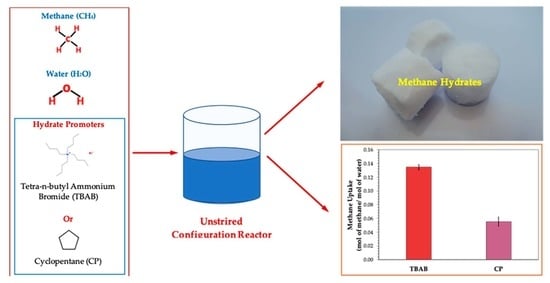
Comparative Study of Tetra-N-Butyl Ammonium Bromide and Cyclopentane on the Methane Hydrate Formation and Dissociation

by
Warintip Chanakro
1,
Chutikan Jaikwang
1,
Katipot Inkong
1,
Santi Kulprathipanja
2 and
Pramoch Rangsunvigit
1,3,*
1
The Petroleum and Petrochemical College, Chulalongkorn University, Bangkok 10330, Thailand
2
Honeywell UOP, Des Plaines, IL 60017, USA
3
Center of Excellence in Petrochemical Materials Technology (PETROMAT), Research Building, Chulalongkorn University, Bangkok 10330, Thailand
*
Author to whom correspondence should be addressed.
Energies 2020, 13(24), 6518; https://doi.org/10.3390/en13246518
Submission received: 9 November 2020 / Revised: 3 December 2020 / Accepted: 8 December 2020 / Published: 10 December 2020

Abstract

:
Two widely investigated methane hydrate promoters, tetra-n-butyl ammonium bromide (TBAB) and cyclopentane (CP), for methane hydrate formation and dissociation were comparatively investigated in the quiescent reactor at 2.5 °C and 8 MPa. The results indicated that the increase in the mass fraction TBAB decreased the induction time. However, it did not significantly affect the methane uptake. In the presence of CP, the increase in the CP concentration resulted in an increase in the induction time due to the increasing thicknesses of the CP layer in the unstirred reactor. Moreover, the methane uptake was varied proportionally with the CP concentration. The addition of TBAB resulted in a higher methane uptake than that of CP, since the presence of TBAB provided the cavities in the hydrate structure to accommodate the methane gas during the hydrate formation better than that of CP. On the contrary, the presence of CP significantly increased the induction time. Although the methane recovery remained relatively the same regardless of TBAB and CP concentrations, the recovery was higher in the presence of TBAB.

Graphical Abstract

1. Introduction

In recent years, the global energy demand has been continually increasing due to the growth of human society. More than 76% of energy come from carbon-based sources such as gas, oil, and coal. Among these three carbon-based energy sources, natural gas is present at the appropriate ratio compared to other sources of fossil energy [1,2]. Natural gas hydrates play an important role in the largest resource of methane gas on Earth and are a possible energy resource for the coming age due to the demand for clean energy sources. Moreover, the gas hydrates have acquired increasing attention as an excellent novel technology for the storage and transportation of gases in large quantities. The transportation cost of natural gas hydrates is expected to be 18–24% lower than that of liquefied natural gas (LNG) [3,4]. However, the main challenges to use hydrates technology for natural gas storage and transportation in industrial processes include the slow kinetics of hydrate formation with a longer hydrate nucleation time and low hydrate formation rate during the hydrate growth, and low conversion of gas to methane hydrates leading to poor storage capacity [5].
Therefore, scientific methods that can increase the formation rate as well as gas uptake have been studied [6]. The magnetic stirring apparatus is often used, which advances the interaction of water and gas and increases the hydrate growing speed with the help of the stepless speed-adjusting stirring. However, there are some problems in the magnetic stirring system, such as increased energy consumption [7,8]. Some researchers applied water spraying into a guest–gas phase as a practical means of rapid hydrate formation, but the sizes of these reactors are still small, and the dehydration and palletizing operations to extract the hydrates from the slurry require additional labor, capital equipment, and maintenance costs [9]. Hydrate promoters are one of the alternative choices that may overcome these problems [10].
Several additives especially chemical promoters are being investigated for the safer application of hydrates for engineering applications. One of several additives, which thermodynamically promotes the formation is the class of tetra-n-alkyl ammonium halides-like tetra-n-butyl ammonium bromide (TBAB) [11]. TBAB can form a semiclathrate hydrate crystal with water molecules. In TBAB semiclathrate hydrates, Br ion forms cage structures with water molecules, and the tetra-n-butyl ammonium (TBA) cation occupies four cages [12]. The empty cavities of dodecahedral (512) can encage small gas molecules (e.g., N2, CH4, H2S, and CO2). Such a hydrate is called a semiclathrate hydrate crystal since a part of the cage structure is broken to enclose the large TBA molecule. This characteristic of the semiclathrate hydrates leads them to have a high gas storage capacity similar to other thermodynamic promoters such as tetrahydrofuran (THF) [13].
TBAB has become particularly attractive as an environmentally friendly hydrate promoter for gas separation, gas storage, and transportation [14]. Duc et al. [15] presented the thermodynamic data showing that the addition of 0.29 mol% TBAB considerably reduced the pressure for the CO2/N2 hydrate formation. Li et al. [12] also reported that TBAB can reduce the formation pressure of gas hydrates. Fan et al. [16] presented the kinetic data showing that the addition of 0.293 mol% TBAB improved the hydrate formation of CO2/N2 by decreasing the time for hydrate nucleation and increasing the hydrate formation rate for the mixture. Li et al. [14] proposed a gas hydrate formation process for CO2 captured from fuel gas mixtures in the presence of TBAB. They found that the presence of TBAB not only shortened the induction time and accelerated the hydrate formation rate during the hydrate growth, but also enhanced the engagement of CO2 into the lattice of hydrate. Zhong and Englezos [17] investigated the possibility of hydrate technology for CH4 separation from a low concentration coal mine methane gas (30 mol% CH4/N2) by using TBAB as the promoter and indicated that CH4 was preferentially encaged into the TBAB hydrates.
Moreover, cyclopentane (CP) is another important thermodynamic promoter. Many publications reported that CP has the potential to store gas. Zheng et al. [18] found that 0.01 molar ratios of CP/water can be used as the optimal case of a thermodynamic promoter in the CO2 hydrates. Increasing the CP concentration significantly changed the CO2 hydrate equilibrium by essentially decreasing the pressure of the hydrate equilibrium. Lim et al. [19] researched the morphology of mixed CO2/H2/CP hydrates in an unstirred system. They proposed the mechanism of mixed hydrates that the hydrates began to grow upwards at the interface and continuously grew radially inwards towards the center of the reactor. Moreover, they reported that 0.9 mL of the CP solution showed the higher gas uptake about 2.3 times than that 0.45 mL of the CP solution at 2.5 and 4.5 °C and the same experimental pressure. Li et al. [20] studied the synergic effect of CP and TBAB on the hydrate based CO2. They proposed that the CP molecules encapsulated in the hollow centers of the large cavities together with TBA+ cations make the semihydrate structure more stable. More TBAB participating in forming the semihydrate containing CP, TBAB, and mixture gas, led to a remarkable increase in the gas uptake.
However, many studies focused on reporting the kinetic data of methane hydrate formation in the TBAB and CP solution in the stirring system. In this work, the effects of TBAB and CP on the kinetics of methane hydrate formation and dissociation in a quiescent system were investigated and compared without any mechanical agitation.

2. Materials and Methods

2.1. Materials

Ultra-high purity methane (99.99%) was ordered from Linde Public Company, Samut Prakan, Thailand, for using as the guest gas molecules to form hydrates with distilled deionized water. Tetra-n-butyl ammonium bromide (TBAB, 98% purity) was purchased from U&V Holding Co. Ltd., Nonthaburi, Thailand. Cyclopentane (CP, 95% purity) was obtained from Alfa Aesar, Massachusetts, UK.

2.2. Apparatus for the Hydrate Formation and Dissociation Experiments

The schematic of the gas hydrate experimental setup is presented in Figure 1. The details of the description were presented in the work of Siangsai et al. [21] and Siangsai et al. [22]. Briefly, the methane hydrate experimental apparatus contained the crystallizer. The hydrates were formed in 57.28 cm3 of the high-pressure crystallizer (CR) fabricated from stainless steel (Grad SS-316). An amount of 50 cm3 of the gas reservoir (R) was connected with the hydrate crystallizer. Both the crystallizer and reservoir were submerged in the temperature-controlled bath containing the mixed glycol/water at a ratio of 1:4. An external refrigerator (model LCB-R13, LabTech, Jaipur, Rajasthan, India) with an accuracy of ±0.5 K was used for regulating the temperature in the mixed glycol/water bath. The pressure during the experiments was measured by the pressure transmitters (Cole Parmer®, model 68073-18, Singapore) with the range of 0–21 MPa and 0.13% global error. The four K-type thermocouples at different positions, as indicated above, were used to obtain the temperature in the crystallizer. A data logger (AI210, Wisco Industrial Instruments, Nonthaburi, Thailand) that was connected to a personal computer was used to record the pressure and temperature during the experiments. All the experiments were fixed and carried out in the quiescent condition under the closed system.

2.3. Hydrate Formation

The experiments were carried out with different TBAB mass fractions (0.025, 0.05, 0.01, and 0.02) and different CP in %v/v (0, 5, 10, 15, and 20) in a closed system at the desired temperature and pressure (2.5 °C and 8 MPa). After the solution was injected into the crystallizer, the vacuum pump was used to evacuate the air in the crystallizer. An amount of 0.5 MPa of methane was pressurized into the crystallizer and then depressurized to atmospheric pressure twice to eliminate residual air in the crystallizer. Methane gas was injected into the crystallizer until the desired experimental pressure (8 MPa). The pressure and temperature during the hydrate formation were then recorded every 10 s. The pressure in the crystallizer would decrease during the hydrate formation due to the conversion of gas to hydrate. The experiments continued until there was no significant change in the pressure. The methane uptake was calculated using the pressure and temperature data recorded during the hydrate formation experiment. The detail of the calculation of gas consumption during the hydrate formation was presented in the works of Inkong et al. [23], Inkong et al. [24], and Siangsai et al. [22].

2.4. Hydrate Dissociation

After the completion of methane hydrate formation, the experiment was switched to the hydrate dissociation experiment to recover methane from the hydrates by thermal stimulation. The temperature was increased from the formation temperature to 25 °C. This point was marked as time zero for the dissociation experiment. During the hydrate dissociation, when the temperature in the crystallizer crosses the hydrate phase equilibrium, the methane hydrates start to dissociate and continue to dissociate until the temperature inside the crystallizer reaches the set dissociation temperature. The pressure transducer and data logger were utilized for measuring the pressure and temperature, respectively. When the pressure in the system was constant at the set dissociation temperature for about 1 h, the experiments were stopped. The pressure and temperature recorded during the hydrate dissociation experiment were used to calculate the moles of methane released from the hydrates at any time. The detail of hydrate dissociation calculation and equation for calculating gas during the hydrate dissociation was followed from the work of Inkong et al. [23], Inkong et al. [24], and Siangsai et al. [22].

3. Results and Discussion

In the first step of this work, fresh water without a promoter was examined in order to comprehend the fresh water effects on the methane hydrate formation kinetics. In the fresh water system, the hydrate formation experiment was performed at 2.5 °C and 8 MPa. However, the hydrate formation was not observed for the fresh water system at this condition after 48 h. It is probable that the thin hydrate film could form along the gas-water interface that impedes the diffusion of methane gas to the liquid phase for further hydrate nucleation and growth [25]. Another plausibility is the formation of a needle-like dendritic crystal at the interface of the liquid phase resulting in no development downwards and no changing of the pressure in the crystallizer (or gas uptake) [26]. To overcome the limitation of the thin hydrate film between the interface, subsequently, tetra-n-butyl ammonium bromide (TBAB) and cyclopentane (CP) were used as promoters to enhance methane hydrate formation at 2.5 °C and 8 MPa. Moreover, to ensure the performance of the chosen promoters in the recovery of methane after methane hydrate formation, the thermal stimulation method was utilized by increasing the experimental temperature to 25 °C. It should be noted that to ensure its reproducibility, each experiment was repeated at least three times.

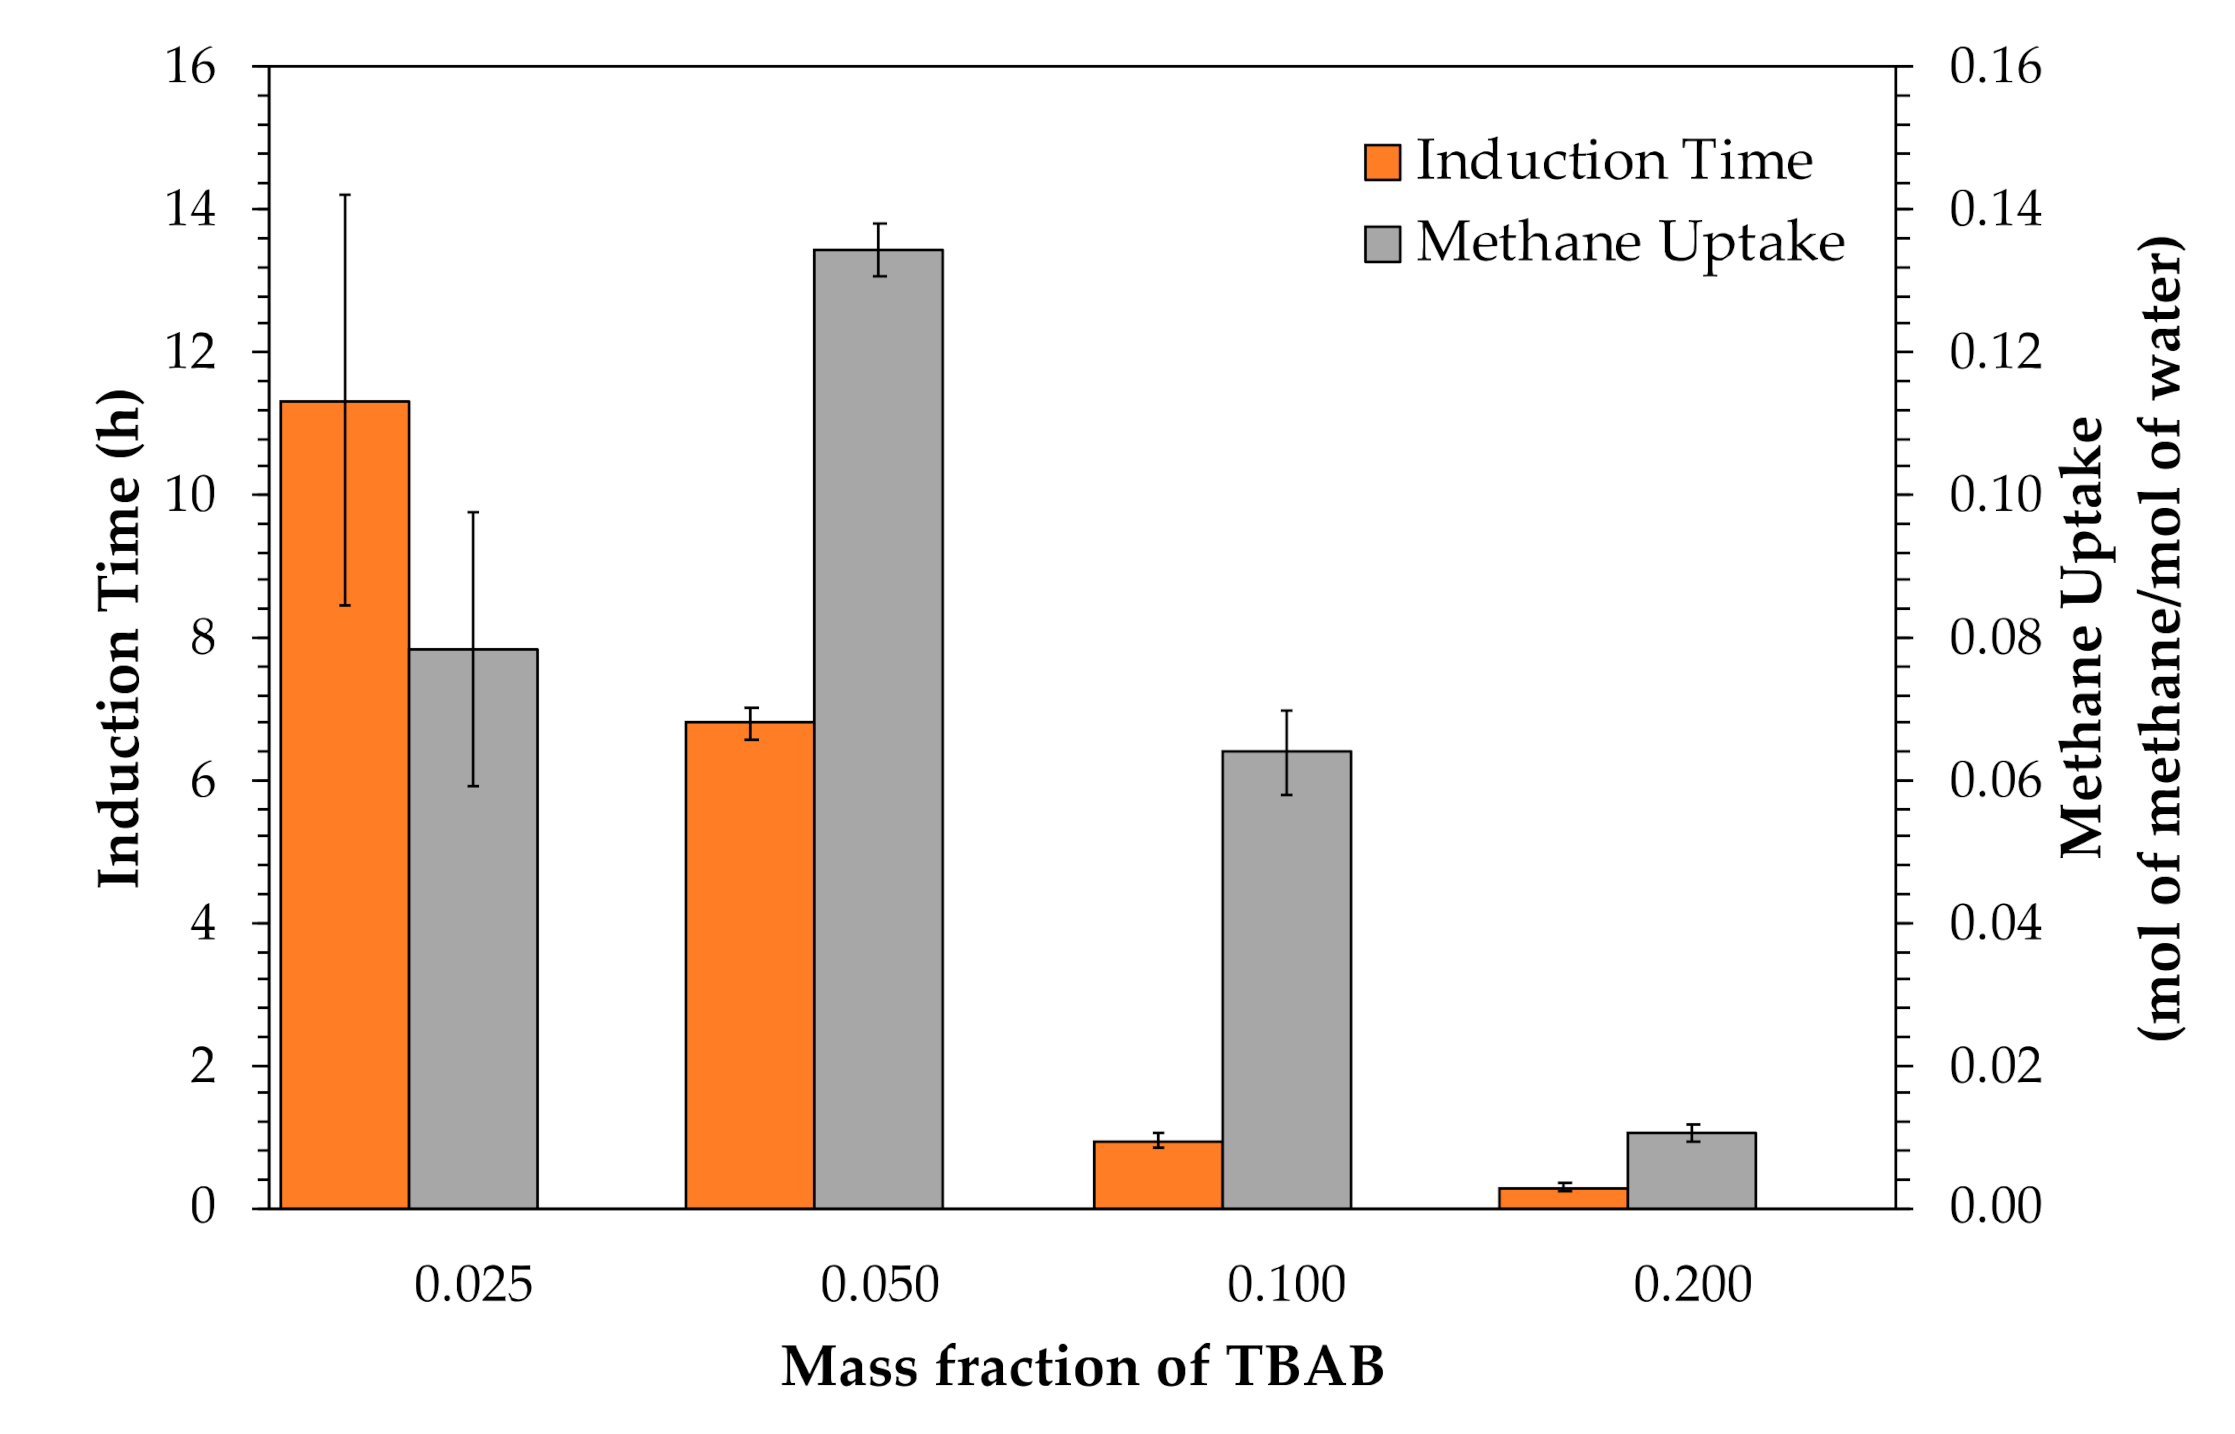
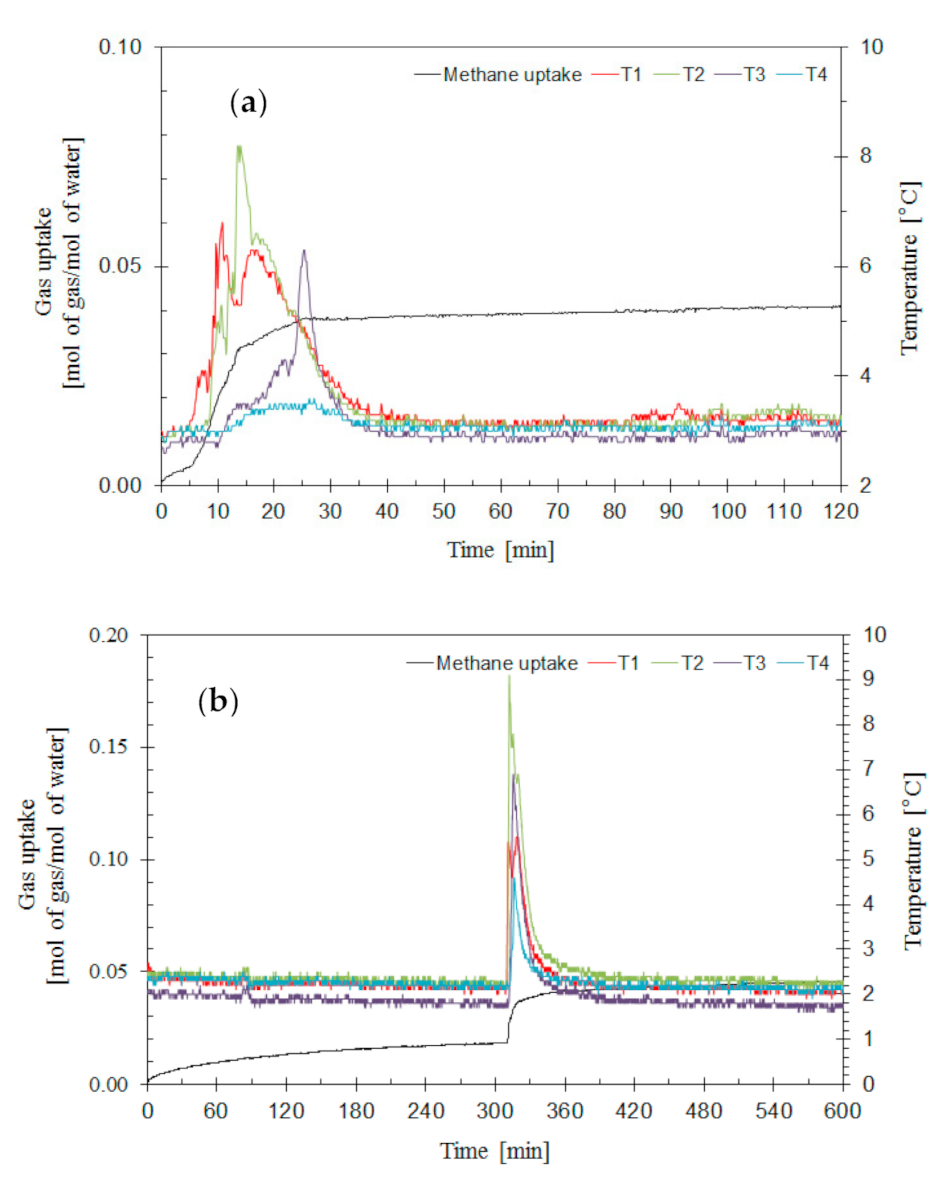
3.1. Effects of Tetra-N-Butyl Ammonium Bromide (TBAB)

Table 1 provides information concerning the experimental conditions for methane hydrate formation with the TBAB solution at 2.5 °C and 8 MPa. The data are clear that the hydrates form in TBAB solutions at low concentrations (based on mass fraction). The induction time in Table 1 indicates the time taken for the first hydrate nucleation from the start of the experiment. Figure 2 illustrates the effects of TBAB concentration on the induction time. As seen from the figure, the increase in the mass faction of TBAB decreases the induction time. The lowest average induction time comes from the system with the 0.20 mass fraction of the TBAB solution, accounting for 0.29 h. However, this does not mean that a higher TBAB mass fraction would result in a higher gas consumption. Figure 2 shows the effects of TBAB concentration on methane uptake. It can be noted that the average methane uptake increases with an increase in the TBAB mass fraction in the lower mass fraction range. However, it decreases with an increase in the TBAB mass fraction when the TBAB mass fraction is higher than 0.05. The results almost disappear with the 0.20 mass fraction of TBAB. These results are due to the fact that the methane hydrates form rapidly and agglomerate at the gas and liquid interface with a high TBAB concentration. The rapid and expanded hydrate formation and crystal agglomeration at the gas and water interface hinder more gas from the gas phase coming into contact with the water [14].
The gas uptake and temperature profiles of the formation of TBAB semiclathrate hydrate with the 0.05 mass fraction of the TBAB solution are presented in Figure 3. It can be seen from the figure (Experiment 5, Table 1) that the gas uptake profile can be divided into three stages according to the variation of slope of the gas uptake profile. The first stage is the gas dissolution and the hydrate nucleation. This stage starts from time zero to the beginning of the first hydrate nucleation (7 h). The second stage is the TBAB semiclathrate hydrate growth, which takes approximately 9 h. In this stage, the temperature in the crystallizer suddenly rises and then gradually decreases to the desired experimental temperature. As methane gas and water were converted to semiclathrate hydrates with the release of hydrate formation heat (exothermic process) to the surroundings, resulting in the abrupt increase in the system temperature. The slope of the methane uptake profile at the second stage is steeper than that of the first and third stages, and the methane uptake sharply increased. It implies that at this stage the TBAB semiclathrate hydrates show the fastest growth. Additionally, from the methane uptake profile in the second stage, it can be observed that the mass transfer resistance gradually increases over time. This is due to the fact that the formation of solid semichathrate hydrates constructed from water, dissolved methane gas, the Br ions, and tetra-n-butyl ammonium cause the reduction of the concentrations of the Br ion and tetra-n-butyl ammonium in the TBAB solution. For this reason, the gradual decrease in the number of the free ions, both Br ions and tetra-n-butyl ammonium, in the TBAB solution and the increase in the amount of the solid semiclathrate hydrate slurry during the hydrate formation will be the cause of the diminution of the mass transfer between the gas and liquid phase [14]. In the last stage of hydrate formation, the temperature and methane uptake show an insignificant change with time. This demonstrates that the hydrate formation completed due to the fact that there is a substantial hydrate mass in the crystallizer [17].
Figure 4 presents the methane uptake and temperature profiles of the TBAB semiclathrate hydrate formation at 2.5 °C and 8 MPa (w = 0.025) (Experiment 2, Table 1). It can be clearly observed from the figure that the experiment performed with the 0.025 mass fraction of the TBAB solution takes a longer time to form hydrates than that with the 0.05 mass fraction. For instance, the hydrate nucleation forms around 24 h after the initiation of the hydrate formation experiment, which can be seen from the increase in the temperature profiles in the crystallizer (exothermic process), and takes around 18 h to partly form the hydrates. The completion of hydrate formation takes approximately 44 h. However, the amount of methane uptake is smaller than that conducted with the 0.05 mass fraction of TBAB solution. Arjmandi et al. [27] reported that the small guest gas molecules such as CH4 and CO2 can be enveloped into the small cage (the dodecahedral cavities (S-cage, 512)) of the semicathate hydrates of TBAB at desirable stability conditions. From the results, it is due to the fact that the higher concentration of TBAB solution diminishes the small cavities or the dodecahedral cavities (S-cage, 512) of the TBAB semicathrate hydrates, hence, the lower amount of methane consumed. Furthermore, it can be distinctly observed from Table 1 that in each experiment of hydrate formation in the presence of various TBAB mass fractions, the induction time is random. This is due to the fact that the hydrate nucleation is stochastic in nature [23]. Moreover, Linga et al. [28] reported that it is not possible to predict the time for the hydrate nucleation, which is consistent with this work.
Figure 5 shows the methane uptake and temperature profiles during the methane hydrate formation experiment with the TBAB solution at 2.5 °C. It can be observed from the figure that the hydrate formation of the experiments conducted with the 0.10 mass fraction of TBAB solution is faster than that with 0.05, while the methane consumption is lower. This might be the result of crystal agglomeration at the gas/water interface [29,30]. In addition, heat generated during the formation of methane hydrate is released due to the exothermic reaction, which can be indicated from the temperature profiles in the figure. As seen from Figure 5 (insert figure), it can be found that the first temperature increases in the different positions since the hydrates may randomly form anywhere in the crystallizer. The rise in the first temperature during the semicatharte hydrate formation of the experiment with the 0.05 TBAB mass fraction is recorded at T2 followed by T1, T3, and T4, respectively. For the experiment with the 0.10 mass fraction of TBAB solution, the increase in the temperature profile starts from T1 followed by T2, T3, and T4, respectively. From these two temperature profiles of both cases, it can be forecasted that the semicathrate hydrate formation pattern during the formation of methane hydrate form from the top to the bottom of the crystallizer in all experiments with the presence of TBAB as the promoter.

3.2. Effects of Cyclopentane (CP)

Table 2 presents the results of the methane hydrate formation in the presence of 5, 10, 15, and 20% v/v at experimental conditions of 2.5 °C and 8 MPa. The induction time in the table indicates the time for the first crystal of hydrate nucleation starting to generate. Figure 6 presents the effects of CP concentration on the induction time. As seen from the figure, the induction time increases with the increase in the concentration of CP. It may be noted that the presence of different amounts of CP results in the different thicknesses of the CP layer in the unstirred reactor. This is due to the fact that CP is immiscible (at a higher CP concentration) and has a lower density than water, resulting in forming a clear layer above the water. Therefore, the increase in the CP concentration will result in a greater thickness of the CP layer above the water. For this reason, the gas molecules potentially increase the diffusion time for coming into contact with the water for hydrate nucleation and growth [31].
Figure 7 shows typical methane hydrate formation experiments with 10% v/v CP solution at 2.5 °C. The temperature profiles in the crystallizer, recorded by the four thermocouples (different positions), indicate that the temperature in the crystallizer rises at T1 first, followed by T2, T3, and T4, before the gas uptake increases rapidly. It can be deduced that the hydrates form from the top to the bottom of the crystallizer. Lim et al. [19] proposed for the mechanism of methane hydrate formation that the nucleation occurred at the interface of CP and water. The hydrates grew upward along the wall of the crystallizer and radially generated inward toward the center of the crystallizer. Finally, the bottom layer is completely covered with hydrates whereas, in the layer of the top gas phase, the quantity of the hydrates that filled up was lower.
Moreover, Figure 6 shows the effects of CP concentration on methane uptake. As clearly observed from the figure, the increase in the CP concentration increase the average methane uptake. However, it decreases when the amount of CP is increased higher than 15% v/v. Again, the CP layer prevents the gas diffusion from coming into the structure of the hydrate as the experiment proceeds [32]. The experiment conducted with 15% v/v of the CP solution, takes a longer time to form hydrates than that with 10% v/v of the CP solution, as seen in Figure 8, but the amount of methane uptake of 15% v/v is higher than for 5% and 10% v/v of the CP solution. Lv et al. [32] reported that the large cages (51264) of structure II of the hydrate (sII hydrate) are occupied by CP molecules, while small cages (512) in the sII hydrate are filled up by methane gas molecules. With the increase in the amount of CP in the liquid phase, the vast amount of CP molecules in the liquid phase improves the ability of an entrance of CP molecules into the large cavities of the sII hydrate. Moreover, the effect of hydrates stabilization on hydrate formation is enhanced with the increase of the amount of CP in the liquid phase. However, the excess CP molecules lead to the decrease in the sII hydrate formation and gas diffusion due to the decrease in the volume of water.
Methane uptake is an important parameter for methane hydrate storage and transport applications for methane gas production after the methane gas was stored in the solid hydrates. As seen from Figure 6, the highest average methane consumption in the hydrate formed is the system of 15% v/v CP followed by 10% v/v, 20% v/v, and 5% v/v CP, respectively. Based on these results, the methane consumed of 10% v/v and 20% v/v CP is about the same, while 15% v/v CP is significantly higher. From the results in this work, it can be noted that there is an optimum concentration for using CP as the hydrate promoter. Lim et al. [19] reported that the distinctive characteristic of using the unstirred reactor in the hydrate-based gas separation process (HBGS) for carbon dioxide capture over the stirred reactor was the presence of an immiscible CP layer above the water. Since in the unstirred reactor, the CP layer aided in the diffusion of the guest gas (CO2) to the bulk solution phase for converting to gas hydrates, while in the stirred configuration reactor, CP was dispersed in the bulk solution phase. Furthermore, the utilization of CP and an unstirred reactor configuration is advantageous especially in terms of saving both capital and operating costs [31]. However, not only is the methane hydrate yield required but also the methane dissociation for recovering methane gas in the hydrate structure for utilization in the natural gas storage and transport applications.
Moreover, CP is reported as the one of the effective thermodynamic promoters to improve the hydrate stability by extending the hydrate phase equilibrium to a moderate condition (higher temperatures and lower pressures). In this work, it is necessary to try an experimental temperature by slightly increasing to 4 °C. Table 3 provides information concerning the experimental conditions for methane hydrate formation with 15% v/v CP at 4 °C and 8 MPa. The table clearly indicates that the increasing experimental temperature significantly decreases the induction time. These results may be due to the increase in the formation temperature (from 2.5 to 4 °C) decreasing the gas diffusion into the CP layer, which results in the ease of diffusion in the solution and ease of conversion to the hydrate formation. The comparison results between the methane hydrate formation at different experimental temperatures, 4 and 2.5 °C, indicate that the total methane uptake decreases with the increases in the experimental temperature. This result is consistent with the research by Lim et al. [19], who reported that the methane gas consumption increased with the increase in the driving forces. The increase in the number of the moles of methane gas diffusing into the solution correlates with the enhancement of the rate of methane hydrate growth, which also means that the gas consumption rate was enhanced.
The comparison of hydrate formation in the presence of different hydrate promoters between TBAB and CP from the results is clearly presented in Figure 2 and Figure 6. In terms of the hydrate formation kinetics, this work focuses on the induction time, for which it clearly seems that the hydrate formation presence of CP at all concentrations allows the faster formation of hydrate nucleation than is the case for TBAB. It can be explained that the presence of CP slightly decreases the surface tension between the interface of the gas and liquid phases since CP dissolves only to an insignificant extent in water [33]. Moreover, methane gas and CP are nonpolar substances. From these two reasons, the methane gas was promoted to dissolve and diffuse into the liquid phase easily. However, the presence of TBAB in the hydrate results in a longer duration required to start the formation of the nucleation of the first hydrate crystal. This is due to the fact that the structure of TBAB is bulky, resulting in the obstruction of the diffusion of methane gas in the liquid phase. On the contrary, the hydrate formation in the presence of low concentrations of TBAB (the 0.025, 0.05, and 0.10 mass fractions) shows a higher methane uptake than the case for CP. It can be deduced that in the semiclathrate hydrate structure, the presence of low TBAB concentrations provides higher dodecahedral cavities (S-cage, 512) caused by methane gas molecules, resulting in increased methane consumption [27]. Moreover, CP is a nonpolar chemical resulting in the mostly dissolved gas being in the CP layer and a minority of methane being converted to the gas hydrate.

3.3. Hydrate Dissociation

After the hydrate formation completion, the methane hydrates were dissociated by increasing temperature from the formation temperature to the desired temperature (25 °C). The temperatures in the crystallizer were increased at the same heating rate (1 °C/min) for all experiments. Figure 8 shows the typical methane release and temperature profiles during the dissociation process of the methane hydrates in the presence of the 0.05 mass fraction of theTBAB solution (Experiment 6, Table 1), as shown in Figure 9a, and the presence of 15% v/v CP solution (Experiment 16, Table 2), as presented in Figure 9b. From the figures, during the hydrate dissociation, the methane release curve and temperature profiles of both experiments are about the same. After the hydrate dissociation experiment starts for approximately half of the first hour, the methane release is insignificant, and the temperature profiles of both experiments are similar. From this period, it can be inferred that the temperatures at different locations inside the crystallizer remain below the equilibrium dissociation temperature, resulting in no methane being released from the hydrate cage. After about 30 min, the temperatures in the crystallizer increase with the increase in the water temperature and cross the equilibrium temperature with the hydrates starting to dissociate. Methane starts to be released at around 5 °C for the presence of TBAB and 9 °C for the presence of CP, which can be observed by the alteration of the temperature profiles in the crystallizer (T1, T2, T3, and T4). This is due to the fact that the heat released from the endothermic process of hydrate dissociation inside the crystallizer was balanced with the heat transfer from the external heater [21]. The temperature at this point is noted as the dissociation temperature (Td). After this point, the methane hydrates are decomposed to the liquid and gas phases, and the methane released dramatically soars until it reaches a plateau. The methane released reaches a constant at around 2 h.
However, from Figure 9, it can be evidently seen that the temperature profile patterns during the hydrate dissociation of two promoters are totally different. From the presence of TBAB in the hydrate formation experiment, the hydrates at a temperature of T1 reach the temperature of the water, followed by the temperature of T2, T3, and T4. From the temperature profiles of the presence of TBAB during the hydrate dissociation, the semicathrate hydrate was dissociated from the top to the bottom of the crystallizer. On the contrary, for the presence of CP in the hydrate formation experiment, the temperature increases at T2, T3, and T4 simultaneously before T1. It can be implied that the hydrates start to dissociate from the bottom of the crystallizer to the top of the crystallizer. This result can demonstrate that the methane hydrates in each region could decompose several times. Furthermore, the termination of the methane hydrate dissociation takes place when the temperatures at all the different locations inside the crystallizer get to the set point of the desired dissociation experiment at 25 °C. From Figure 8a,b, the methane release in the presence of TBAB is higher than that with CP. This is due to the fact that the presence of TBAB has a higher methane uptake of TBAB (Table 1) than that of CP (Table 2), so that the methane released from the hydrates formed from the presence of TBAB is higher. The recovery of methane from the TBAB semichatrate hydrate is higher than 90%, while the recovered methane from the sII hydrates in the presence of CP is in the range of 78–82%, as presented in Table 1 and Table 2. It can seem that the presence of CP hinders the methane recovery. It can be deduced that most of the methane gas is dissolved in the CP layer since CP and methane gas are nonpolar substances, and therefore requires higher energy to dissociate the hydrates in this condition [33]. The result from the final methane recovery is lower than the reports in the presence of other promoters, which are mostly higher than 95% [23,24,34,35]. This is due to the fact that the desired dissociation temperature in this work (25 °C) is lower than that of other publications, which were mostly higher than 30 °C. However, the advantage of this work is the reduction in energy consumption during the recovery of the methane, while achieving methane recovery in excess of 80%.

4. Conclusions

The formation and dissociation of methane hydrate in the presence of different promoters, TBAB and CP, and different concentrations of promoters were investigated. The formation was performed at 2.5 °C and 8 MPa in the quiescent reactor. The results showed that the presence of both promoters outstandingly enhanced the methane hydrate formation by improving the hydrate formation kinetics—induction time and methane hydrate formation rate—and methane consumption in comparison with pure water (no formation of hydrate after 48 h). Moreover, the increase in the TBAB mass fraction decreased the induction time. However, it did not mean that the higher TBAB mass fraction would result in the higher gas consumed. The average methane uptake corresponded with the increasing TBAB mass fraction in the low or narrow range of the TBAB mass fraction. However, when the TBAB mass fraction was higher than 0.05, the methane consumption decreased. For the presence of CP in the hydrate formation system, the induction time increased with the increasing CP concentration due to the different thicknesses of the CP layer in the unstirred reactor. The average methane uptake increased with the increasing concentration of CP. Moreover, it can be found from this result that the presence of TBAB showed a higher methane uptake than that of CP. Since the addition of TBAB generated large dodecahedral cavities, which were occupied by methane gas molecules resulting in more methane uptake in the presence of TBAB than the presence of CP. On the contrary, the presence of CP significantly decreased the induction time due to the decreased interfacial surface tension. The methane recovery was insignificantly different with the different TBAB and CP concentrations.

Author Contributions

Conceptualization, W.C., C.J., K.I., S.K. and P.R.; methodology, W.C. and C.J.; validation, W.C., C.J., K.I. and P.R.; formal analysis, W.C., C.J., K.I. and P.R.; investigation, W.C. and C.J.; resources, K.I. and P.R.; writing—original draft preparation, W.C., C.J. and K.I.; writing—review and editing, K.I. and P.R.; visualization, K.I. and P.R.; supervision, S.K. and P.R.; project administration, S.K. and P.R.; funding acquisition, P.R. All authors have read and agreed to the published version of the manuscript.

Funding

This research was funded by The 90th Anniversary of Chulalongkorn University Fund and Grant for International Integration: Chula Research Scholar, Ratchadaphiseksomphot Endowment Fund, Chulalongkorn University Thailand.

Acknowledgments

The authors extend their sincere thanks to The 90th Anniversary of Chulalongkorn University Fund and Grant for International Integration: Chula Research Scholar, Ratchadaphiseksomphot Endowment Fund, Chulalongkorn University Thailand; The Royal Golden Jubilee Ph.D. Program (2.P.CU/58/J.1), Thailand Research Fund; The Petroleum and Petrochemical College (PPC), Chulalongkorn University, Thailand; Center of Excellence on Petrochemical and Materials Technology (PETROMAT), Thailand; and UOP, A Honeywell Company, USA.

Conflicts of Interest

The authors declare no conflict of interest.

References

  1. IGU. Global Gas Report 2018; International Gas Union: Washington, DC, USA, 2018; p. 60. [Google Scholar]
  2. EIA. International Energy Outlook 2019 with Projections to 2050; U.S. Energy Information Administration, U.S. Department of Energy: Washington, DC, USA, 2019; p. 170.
  3. Demirbas, A. Methane hydrates as potential energy resource: Part 1–Importance, resource and recovery facilities. Energy Convers. Manag. 2010, 51, 1547–1561. [Google Scholar] [CrossRef]
  4. Englezos, P.; Lee, J.D. Gas hydrates: A cleaner source of energy and opportunity for innovative technologies. Korean J. Chem. Eng. 2005, 22, 671–681. [Google Scholar] [CrossRef]
  5. Makogon, Y.F. Natural gas hydrates–A promising source of energy. J. Nat. Gas Sci. Eng. 2010, 2, 49–59. [Google Scholar] [CrossRef]
  6. Zarenezhad, B.; Varaminian, F. A unified approach for description of gas hydrate formation kinetics in the presence of kinetic promoters in gas hydrate converters. Energy Convers. Manag. 2013, 73, 144–149. [Google Scholar] [CrossRef]
  7. Mech, D.; Gupta, P.; Sangwai, J.S. Kinetics of methane hydrate formation in an aqueous solution of thermodynamic promoters (THF and TBAB) with and without kinetic promoter (SDS). J. Nat. Gas Sci. Eng. 2016, 35, 1519–1534. [Google Scholar] [CrossRef]
  8. Verrett, J.; Posteraro, D.; Servio, P. Surfactant effects on methane solubility and mole fraction during hydrate growth. Chem. Eng. Sci. 2012, 84, 80–84. [Google Scholar] [CrossRef]
  9. Hao, W.; Wang, J.; Fan, S.; Hao, W. Evaluation and analysis method for natural gas hydrate storage and transportation processes. Energy Convers. Manag. 2008, 49, 2546–2553. [Google Scholar] [CrossRef]
  10. Veluswamy, H.P.; Kumar, A.; Seo, Y.; Lee, J.D.; Kumar, A. A review of solidified natural gas (SNG) technology for gas storage via clathrate hydrates. Appl. Energy 2018, 216, 262–285. [Google Scholar] [CrossRef]
  11. Sangwai, J.S.; Oellrich, L. Phase equilibrium of semiclathrate hydrates of methane in aqueous solutions of tetra-n-butyl ammonium bromide (TBAB) and TBAB–NaCl. Fluid Phase Equilibria 2014, 367, 95–102. [Google Scholar] [CrossRef]
  12. Li, D.; Du, J.-W.; Fan, S.-S.; Liang, D.-Q.; Li, X.-S.; Huang, N.-S. Clathrate Dissociation Conditions for Methane + Tetra-n-butyl Ammonium Bromide (TBAB) + Water. J. Chem. Eng. Data 2007, 52, 1916–1918. [Google Scholar] [CrossRef]
  13. Mohammadi, A.H.; Eslamimanesh, A.; Belandria, V.; Richon, D. Phase Equilibria of Semiclathrate Hydrates of CO2, N2, CH4, or H2 + Tetra-n-butylammonium Bromide Aqueous Solution. J. Chem. Eng. Data 2011, 56, 3855–3865. [Google Scholar] [CrossRef]
  14. Li, X.-S.; Xia, Z.-M.; Chen, Z.; Yan, K.-F.; Li, G.; Wu, H.-J. Gas Hydrate Formation Process for Capture of Carbon Dioxide from Fuel Gas Mixture. Ind. Eng. Chem. Res. 2010, 49, 11614–11619. [Google Scholar] [CrossRef]
  15. Duc, N.H.; Chauvy, F.; Herri, J.-M. CO2 capture by hydrate crystallization–A potential solution for gas emission of steelmaking industry. Energy Convers. Manag. 2007, 48, 1313–1322. [Google Scholar] [CrossRef]
  16. Fan, S.; Li, S.; Wang, J.; Lang, X.; Wang, Y. Efficient Capture of CO2 from Simulated Flue Gas by Formation of TBAB or TBAF Semiclathrate Hydrates. Energy Fuels 2009, 23, 4202–4208. [Google Scholar] [CrossRef]
  17. Zhong, D.-L.; Englezos, P. Methane Separation from Coal Mine Methane Gas by Tetra-n-butyl Ammonium Bromide Semiclathrate Hydrate Formation. Energy Fuels 2012, 26, 2098–2106. [Google Scholar] [CrossRef]
  18. Zheng, J.-N.; Yang, M.; Liu, Y.; Wang, D.; Song, Y.-C. Effects of cyclopentane on CO2 hydrate formation and dissociation as a co-guest molecule for desalination. J. Chem. Thermodyn. 2017, 104, 9–15. [Google Scholar] [CrossRef]
  19. Lim, Y.-A.; Babu, P.; Kumar, R.; Linga, P. Morphology of Carbon Dioxide–Hydrogen–Cyclopentane Hydrates with or without Sodium Dodecyl Sulfate. Cryst. Growth Des. 2013, 13, 2047–2059. [Google Scholar] [CrossRef]
  20. Li, X.-S.; Cai, J.; Chen, Z.; Xu, C.-G. Hydrate-Based Methane Separation from the Drainage Coal-Bed Methane with Tetrahydrofuran Solution in the Presence of Sodium Dodecyl Sulfate. Energy Fuels 2012, 26, 1144–1151. [Google Scholar] [CrossRef]
  21. Siangsai, A.; Rangsunvigit, P.; Kitiyanan, B.; Kulprathipanja, S.; Linga, P. Investigation on the roles of activated carbon particle sizes on methane hydrate formation and dissociation. Chem. Eng. Sci. 2015, 126, 383–389. [Google Scholar] [CrossRef]
  22. Siangsai, A.; Inkong, K.; Kulprathipanja, S.; Kitiyanan, B.; Rangsunvigit, P. Roles of Sodium Dodecyl Sulfate on Tetrahydrofuran-Assisted Methane Hydrate Formation. J. Oleo Sci. 2018, 67, 707–717. [Google Scholar] [CrossRef] [Green Version]
  23. Inkong, K.; Rangsunvigit, P.; Kulprathipanja, S.; Linga, P. Effects of temperature and pressure on the methane hydrate formation with the presence of tetrahydrofuran (THF) as a promoter in an unstirred tank reactor. Fuel 2019, 255, 115705. [Google Scholar] [CrossRef]
  24. Inkong, K.; Veluswamy, H.P.; Rangsunvigit, P.; Kulprathipanja, S.; Linga, P. Investigation on the kinetics of methane hydrate formation in the presence of methyl ester sulfonate. J. Nat. Gas Sci. Eng. 2019, 71, 102999. [Google Scholar] [CrossRef]
  25. Fandiño, O.; Ruffine, L. Methane hydrate nucleation and growth from the bulk phase: Further insights into their mechanisms. Fuel 2014, 117, 442–449. [Google Scholar] [CrossRef] [Green Version]
  26. Ohmura, R.; Matsuda, S.; Uchida, T.; Ebinuma, T.; Narita, H. Clathrate Hydrate Crystal Growth in Liquid Water Saturated with a Guest Substance: Observations in a Methane + Water System. Cryst. Growth Des. 2005, 5, 953–957. [Google Scholar] [CrossRef]
  27. Arjmandi, M.; Chapoy, A.A.; Tohidi, B. Equilibrium Data of Hydrogen, Methane, Nitrogen, Carbon Dioxide, and Natural Gas in Semi-Clathrate Hydrates of Tetrabutyl Ammonium Bromide. J. Chem. Eng. Data 2007, 52, 2153–2158. [Google Scholar] [CrossRef]
  28. Linga, P.; Haligva, C.; Nam, S.C.; Ripmeester, J.A.; Englezos, P. Recovery of Methane from Hydrate Formed in a Variable Volume Bed of Silica Sand Particles. Energy Fuels 2009, 23, 5508–5516. [Google Scholar] [CrossRef]
  29. Du, J.; Li, H.; Wang, L. Effects of ionic surfactants on methane hydrate formation kinetics in a static system. Adv. Powder Technol. 2014, 25, 1227–1233. [Google Scholar] [CrossRef]
  30. Zhang, J.; Lee, S.; Lee, J.W. Does SDS micellize under methane hydrate-forming conditions below the normal Krafft point? J. Colloid Interface Sci. 2007, 315, 313–318. [Google Scholar] [CrossRef]
  31. Ho, L.C.; Babu, P.; Kumar, R.; Linga, P. HBGS (hydrate based gas separation) process for carbon dioxide capture employing an unstirred reactor with cyclopentane. Energy 2013, 63, 252–259. [Google Scholar] [CrossRef]
  32. Lv, Q.; Li, L.; Li, X.-S.; Chen, Z. Formation Kinetics of Cyclopentane + Methane Hydrates in Brine Water Systems and Raman Spectroscopic Analysis. Energy Fuels 2015, 29, 6104–6110. [Google Scholar] [CrossRef]
  33. Yaws, C.L.; Richmond, P.C. Chapter 21-Surface tension—Organic compounds. In Thermophysical Properties of Chemicals and Hydrocarbons; Yaws, C.L., Ed.; William Andrew Publishing: Norwich, NY, USA, 2009; pp. 686–781. [Google Scholar]
  34. Veluswamy, H.P.; Chen, J.Y.; Linga, P. Surfactant effect on the kinetics of mixed hydrogen/propane hydrate formation for hydrogen storage as clathrates. Chem. Eng. Sci. 2015, 126, 488–499. [Google Scholar] [CrossRef]
  35. Veluswamy, H.P.; Chin, W.I.; Linga, P. Clathrate hydrates for hydrogen storage: The impact of tetrahydrofuran, tetra-n-butylammonium bromide and cyclopentane as promoters on the macroscopic kinetics. Int. J. Hydrogen Energy 2014, 39, 16234–16243. [Google Scholar] [CrossRef]
Figure 1. Schematic diagram of gas hydrate apparatus; (a) schematic diagram, (b) cross-section of a crystallizer [21,22].
Energies 13 06518 g001
Figure 2. Effects of TBAB concentrations (mass fraction) on the induction time and methane uptake.
Energies 13 06518 g002
Figure 3. Gas uptake and temperature profiles of forming the TBAB semiclathrate hydrate at 2.5 °C and 8 MPa in the batch operation (w = 0.05) (Experiment 5, Table 1).
Energies 13 06518 g003
Figure 4. Gas uptake and temperature profiles of forming the TBAB semiclathrate hydrate at 2.5 °C and 8 MPa in the batch operation (w = 0.025) (Experiment 2, Table 1).
Energies 13 06518 g004
Figure 5. Methane uptake and temperature profiles during the methane hydrate formation experiment performed with the TBAB solution at 2.5 °C: (a) w = 0.05 (Experiment 4, Table 1), (b) w = 0.10 (Experiment 9, Table 1).
Energies 13 06518 g005
Figure 6. Effects of CP concentrations (%v/v) on the induction time of hydrate formation with CP at 2.5 °C and 8 MPa in the batch operation.
Energies 13 06518 g006
Figure 7. Methane uptake and temperature profiles during the methane hydrate formation experiments performed with 10% v/v at 2.5 °C (Experiment 16, Table 2).
Energies 13 06518 g007
Figure 8. Methane uptake and temperature profiles during the methane hydrate formation experiments performed with CP at 2.5 °C: (a) 10% v/v (Experiment 16, Table 2), (b) 15% v/v (Experiment 20, Table 2).
Energies 13 06518 g008
Figure 9. Typical methane released and temperature profiles during the methane hydrate dissociation with the presence of (a) 0.05 mass fraction of the TBAB solution (Experiment 6, Table 1), and (b) 15% v/v CP (Experiment 20, Table 2).
Energies 13 06518 g009
Table 1. Methane hydrate formation in the presence of different tetra-n-butyl ammonium bromide (TBAB) concentrations at 2.5 °C and 8 MPa.
Exp. No.TBAB(Mass Fraction)Induction Time *(h)Methane Uptake(mol of Methane/mol of H2O)%Recovery
1 110.051490.69
2w = 0.025 150.095692.89
3 80.088291.28
Avg11.33 ± 2.870.0784 ± 0.019391.62 ± 0.93
4 6.50.129890.17
5w = 0.05 70.135288.25
6 6.90.138690.53
Avg6.80 ± 0.220.1345 ± 0.003689.65 ± 1.00
7 0.80.055989.38
8w = 0.10 10.070294.39
9 10.065894.55
Avg0.93 ± 0.090.0639 ± 0.006092.77 ± 2.40
10 0.20.009590.67
11w = 0.20 0.30.012088.95
12 0.360.009790.93
Avg0.29 ± 0.060.0104 ± 0.001190.18 ± 0.88
* Induction time is the time from the first hydrate formation.
Table 2. Methane hydrate formation in the presence of different cyclopentane (CP) concentrations at 2.5 °C and 8 MPa.
Exp. No.CP (%v/v)Induction Time * (min)Methane Uptake (mol of Methane/mol of H2O)%Recovery
13 5.000.021680.59
14515.000.024282.67
15 4.800.027981.98
Avg8.27 ± 4.760.0246 ± 0.002589.65 ± 1.00
16 4.800.044680.35
17109.600.041378.58
18 9.000.039280.90
Avg7.13 ± 2.130.0417 ± 0.002279.94 ± 0.99
19 170.000.062879.61
2015300.000.047281.41
21 120.000.055780.45
Avg196.68 ± 75.860.0552 ± 0.006380.49 ± 0.73
22 126.000.043880.67
2320100.020.039578.75
24 210.000.038680.93
Avg145.34 ± 46.930.0406 ± 0.002380.12 ± 0.97
* Induction time is the time for the first hydrate formation.
Table 3. Experimental conditions for methane hydrate formation with 15% v/v of CP at 2.5 °C and 4 °C (8 MPa).
Exp. No.Experimental Temperature (°C)Induction Time (min)Methane Uptake (mol of Methane/mol of H2O)
16 170.000.0628
172.5300.000.0472
18 120.000.0557
Avg.196.67 ± 75.860.0417 ± 0.0027
25 110.200.0367
264109.000.0336
27 110.800.0344
Avg.110.00 ± 0.920.0349 ± 0.0016
Publisher’s Note: MDPI stays neutral with regard to jurisdictional claims in published maps and institutional affiliations.

