Development of a Twenty-Two-Point Multichannel Temperature Data Logger Specially Customized and Coupled to a 160Wpeak Hybrid Photovoltaic/Thermal (PV/T) Flat Plate Solar Air Heater †


Abstract
:1. Introduction
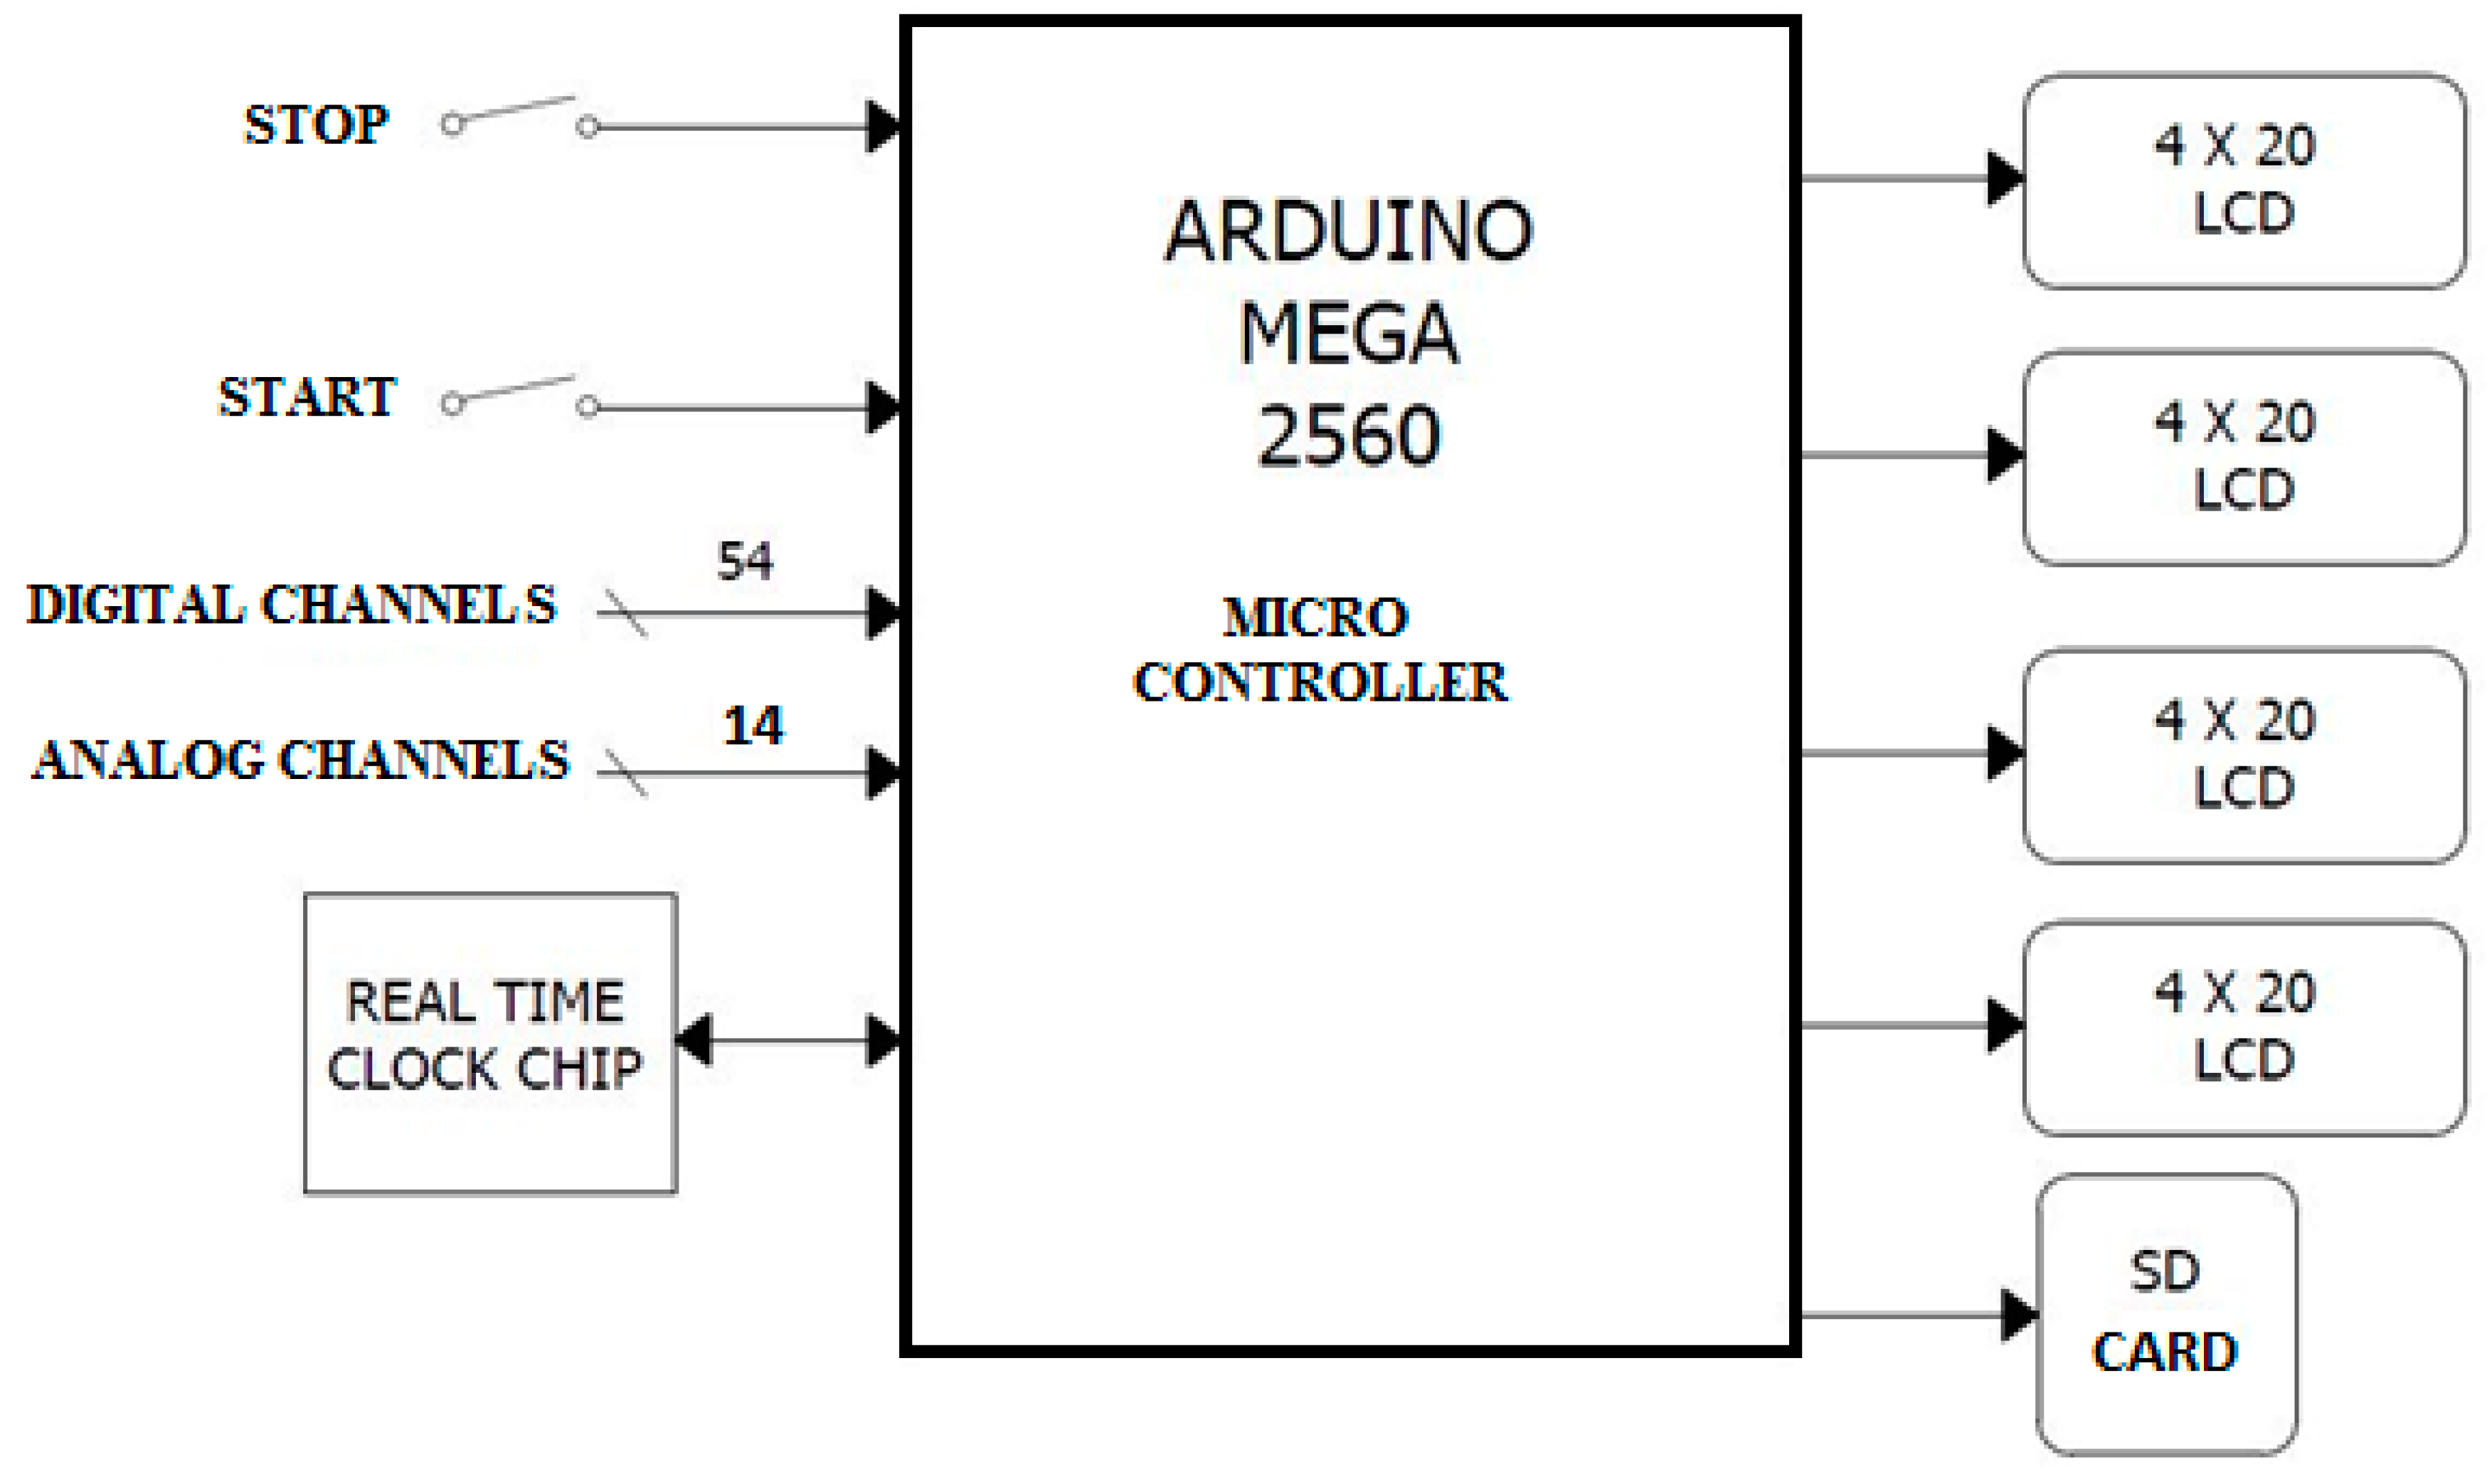
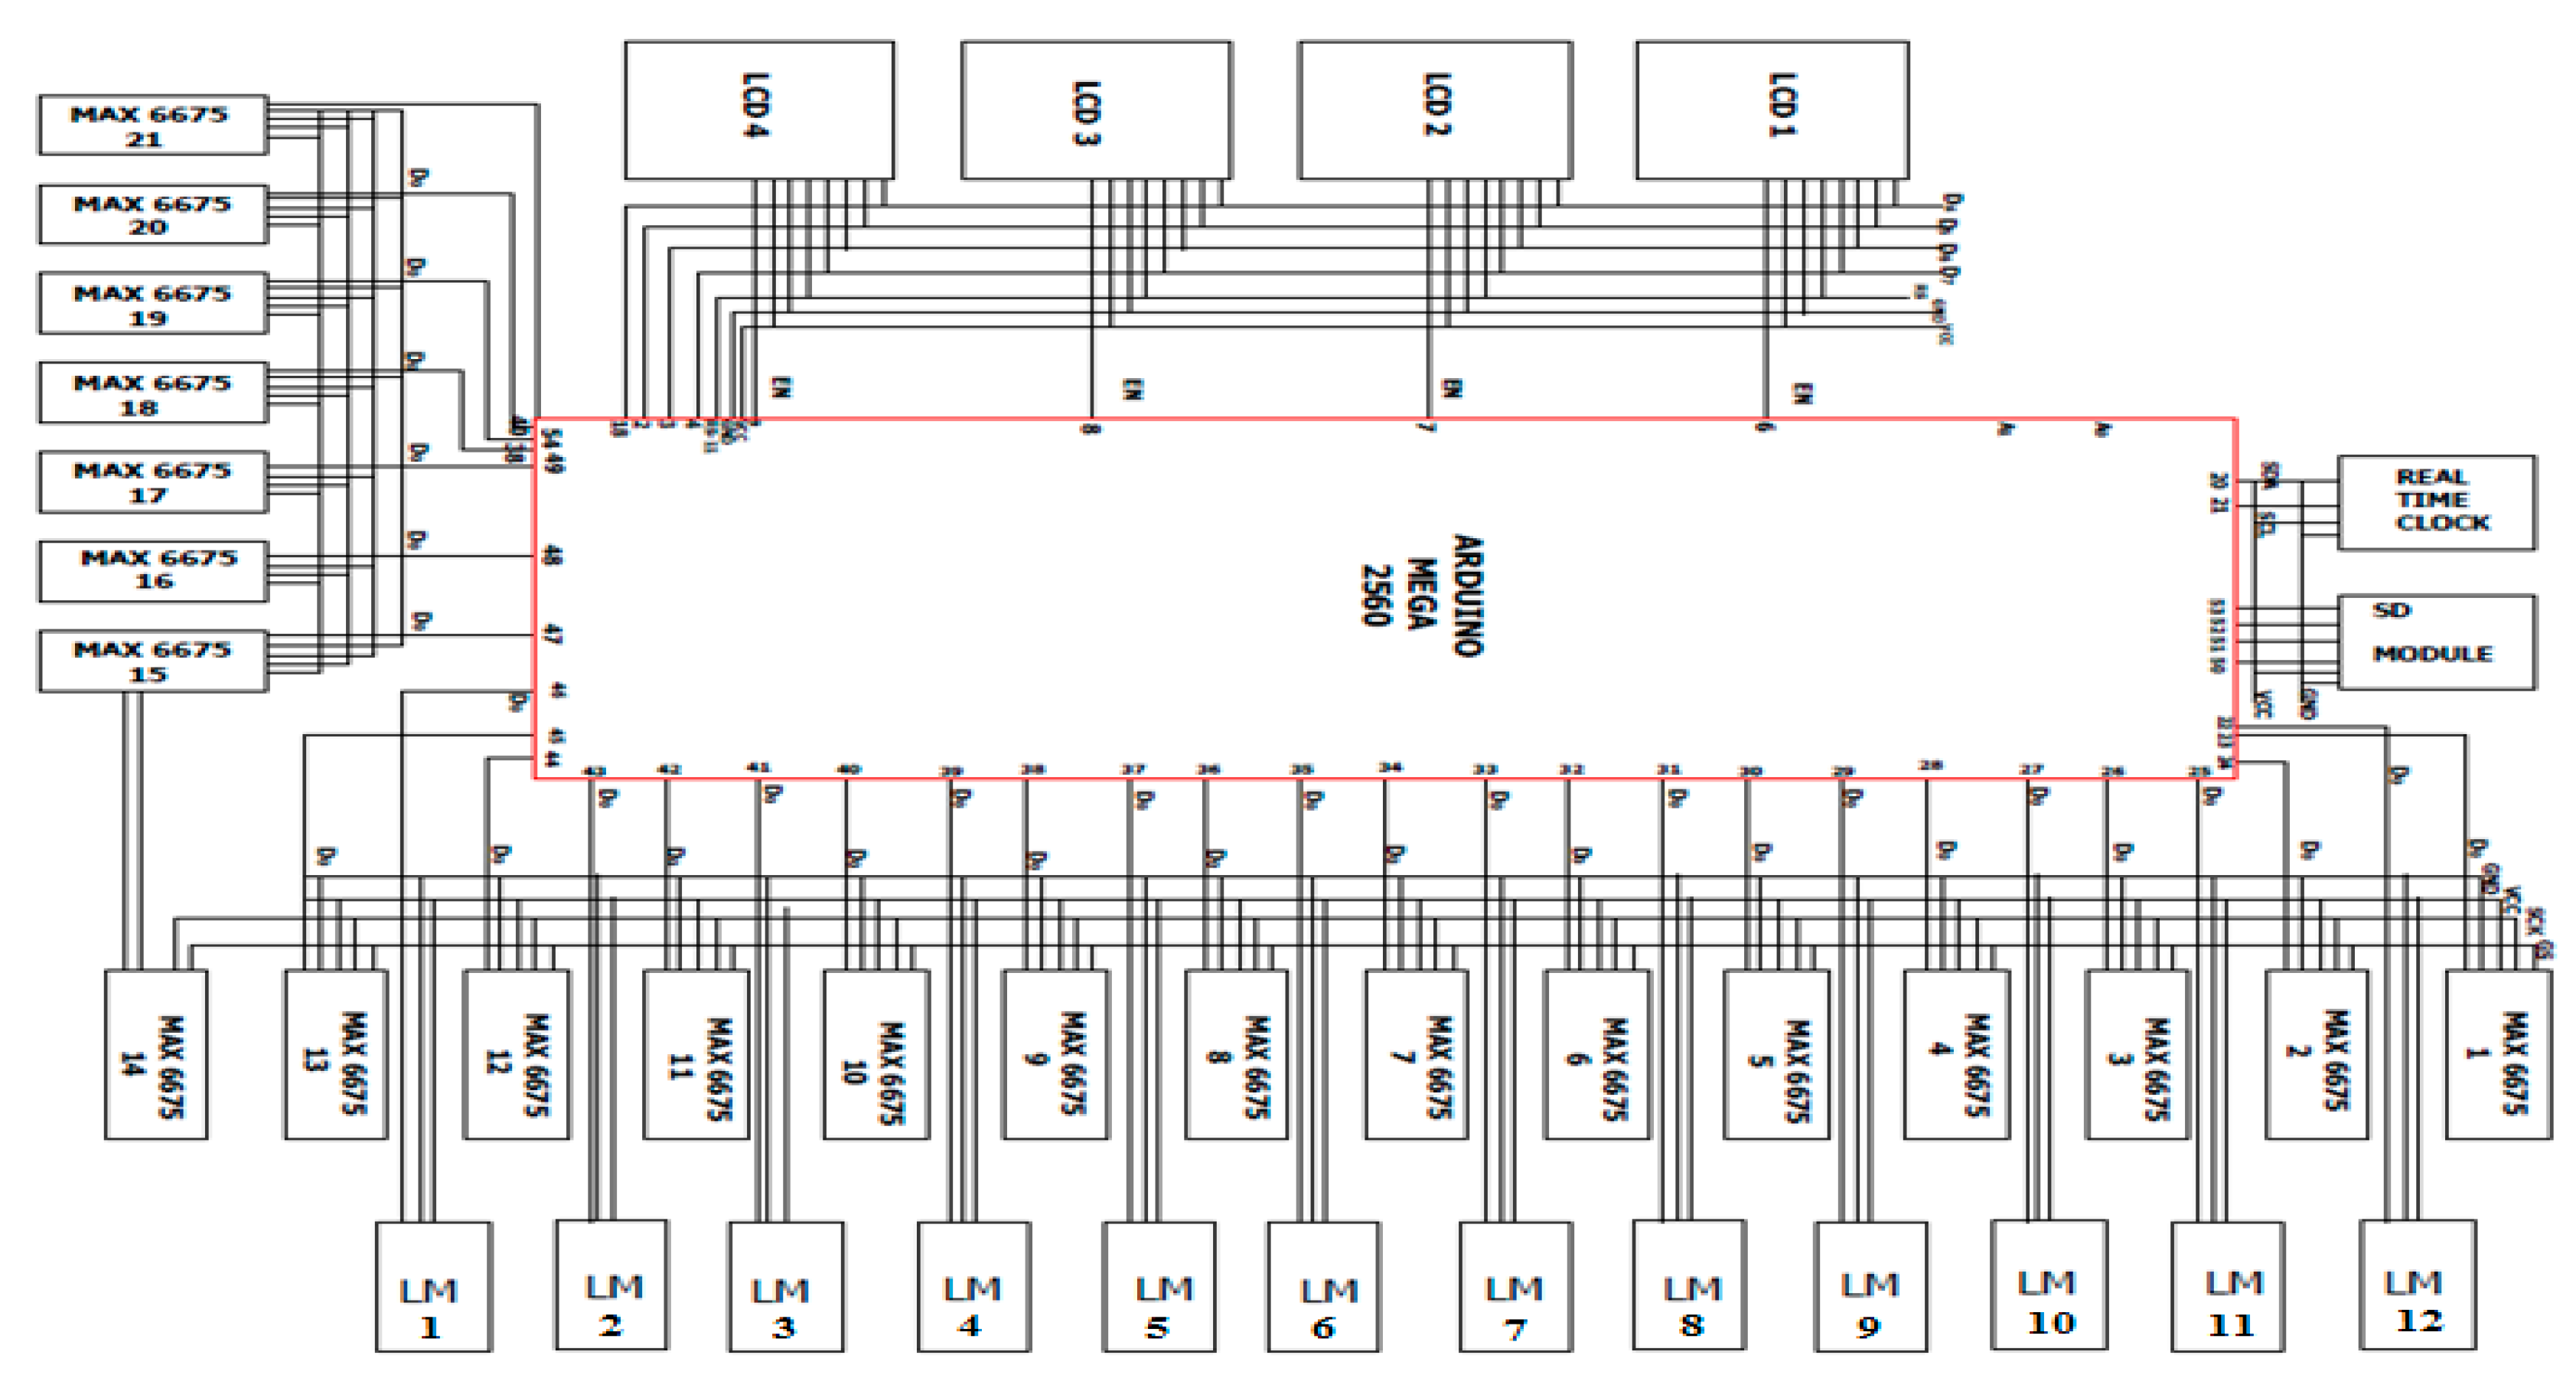
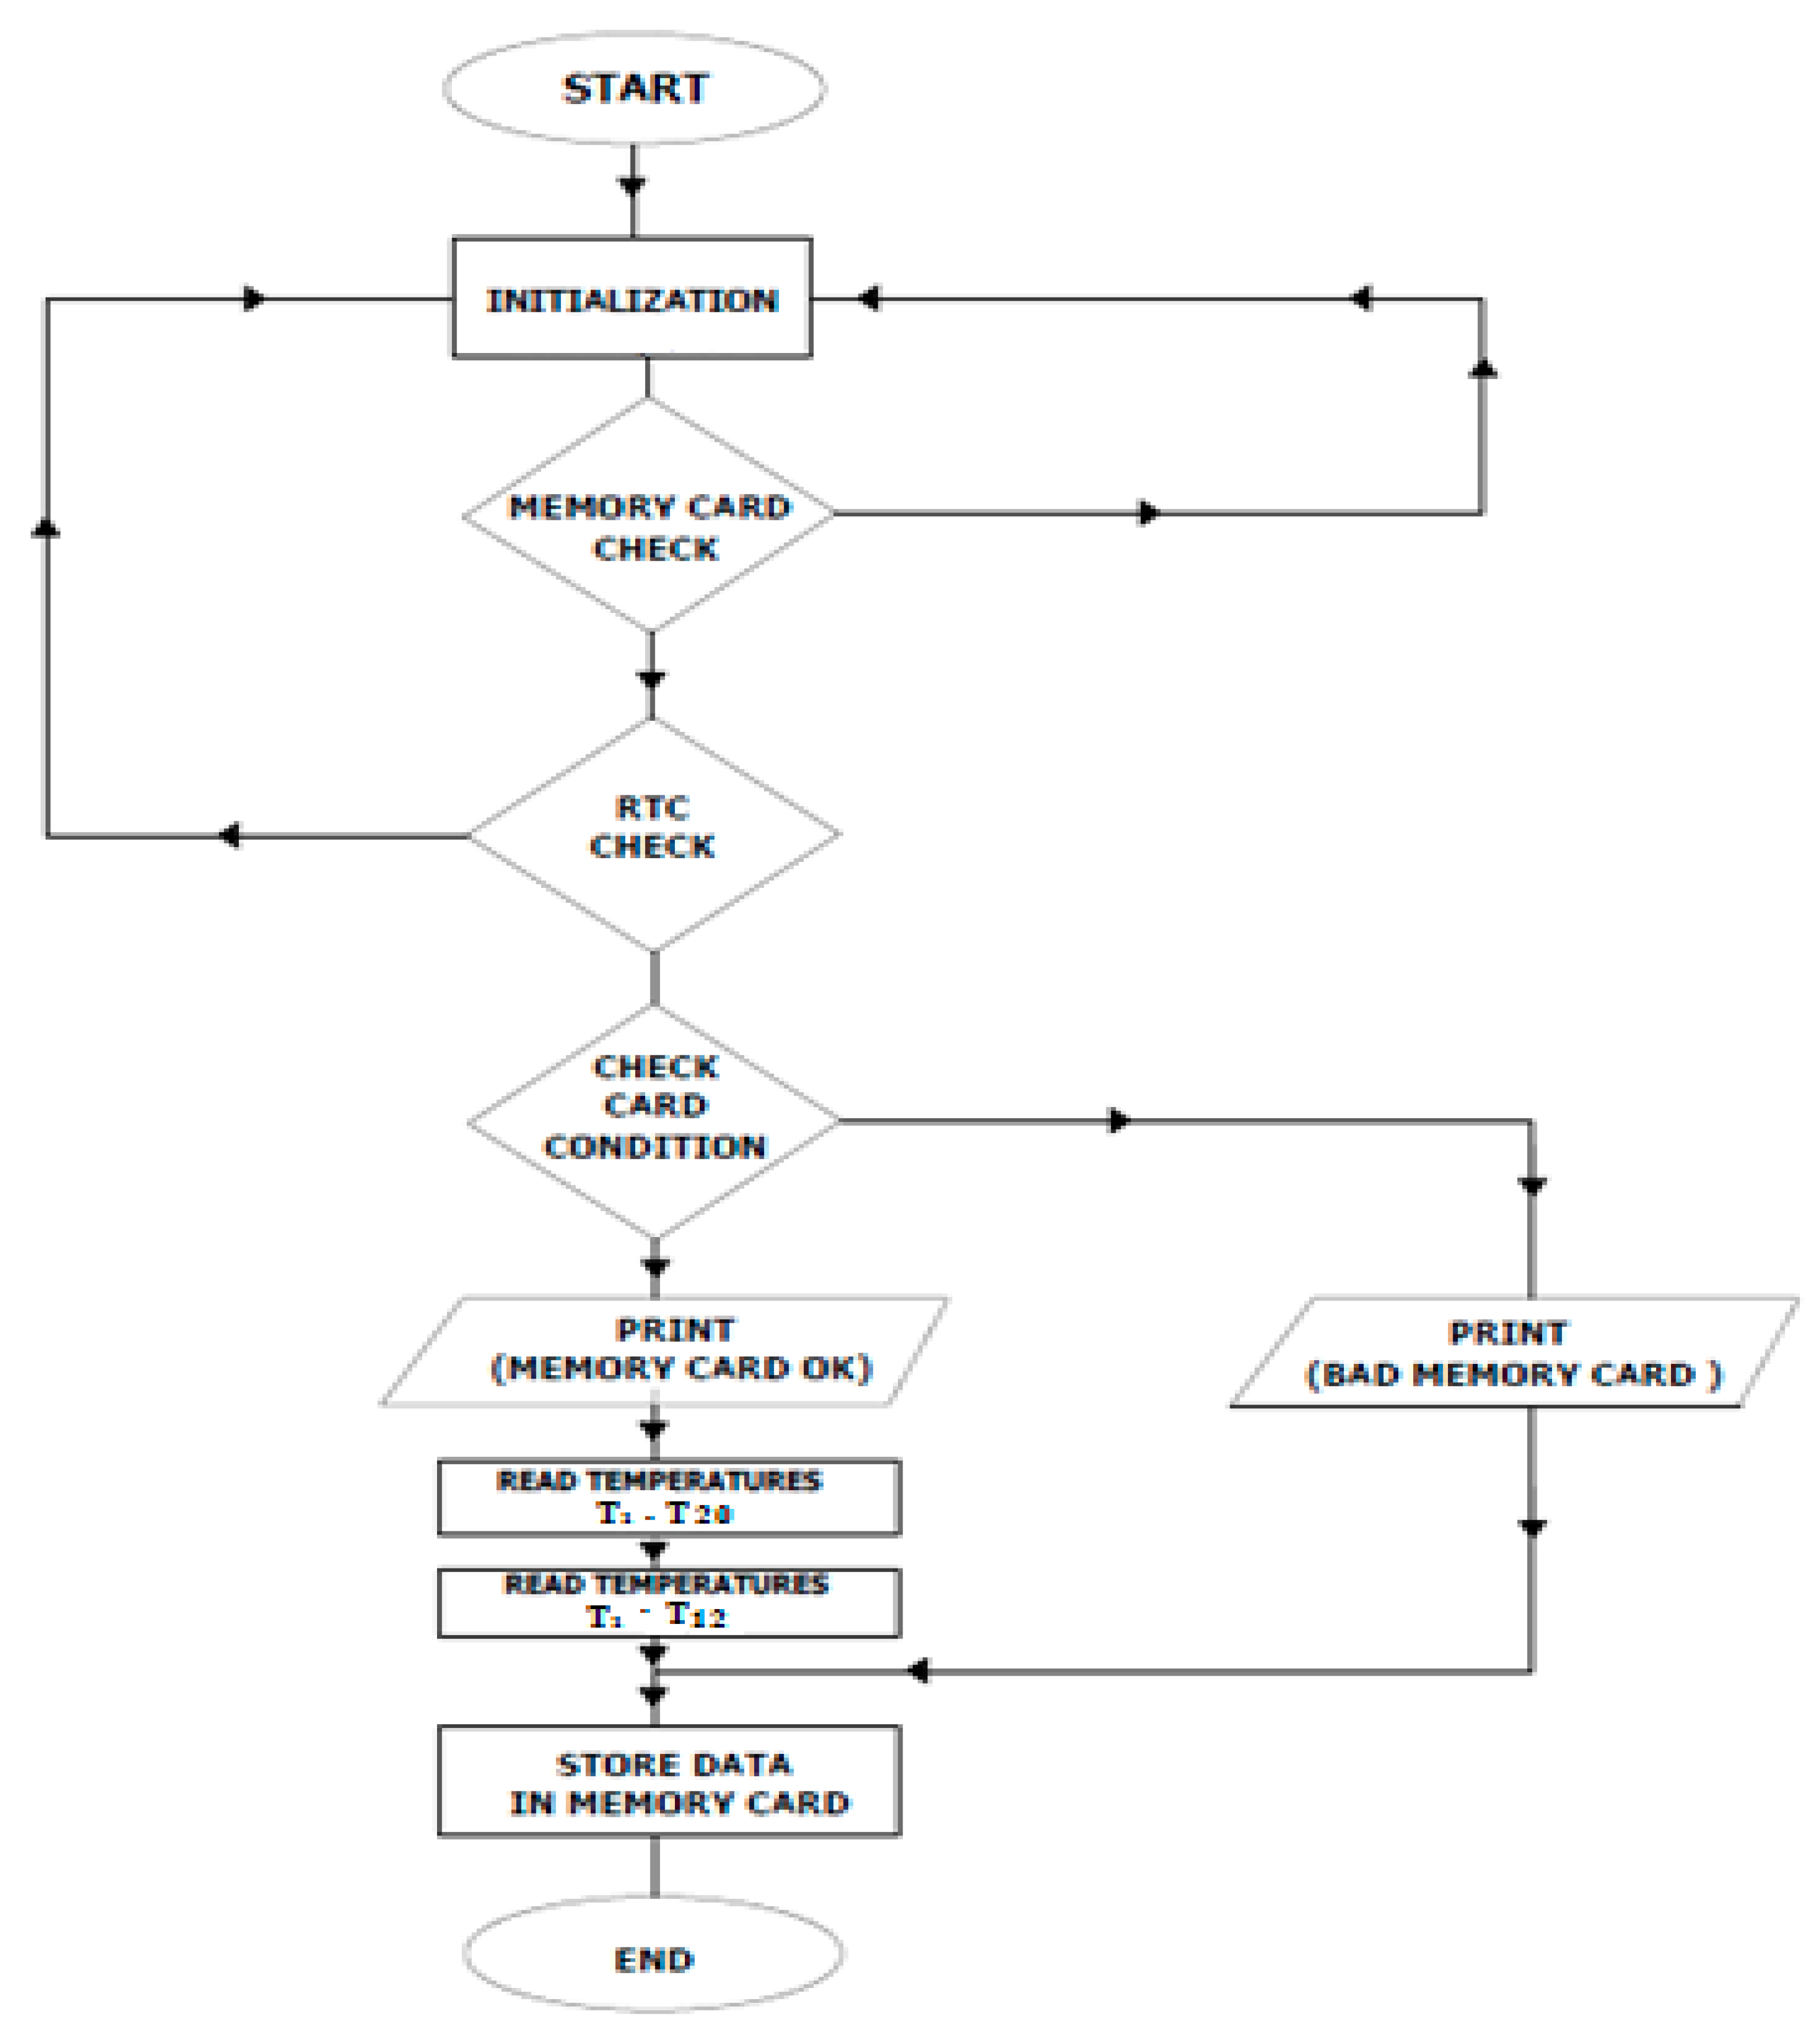
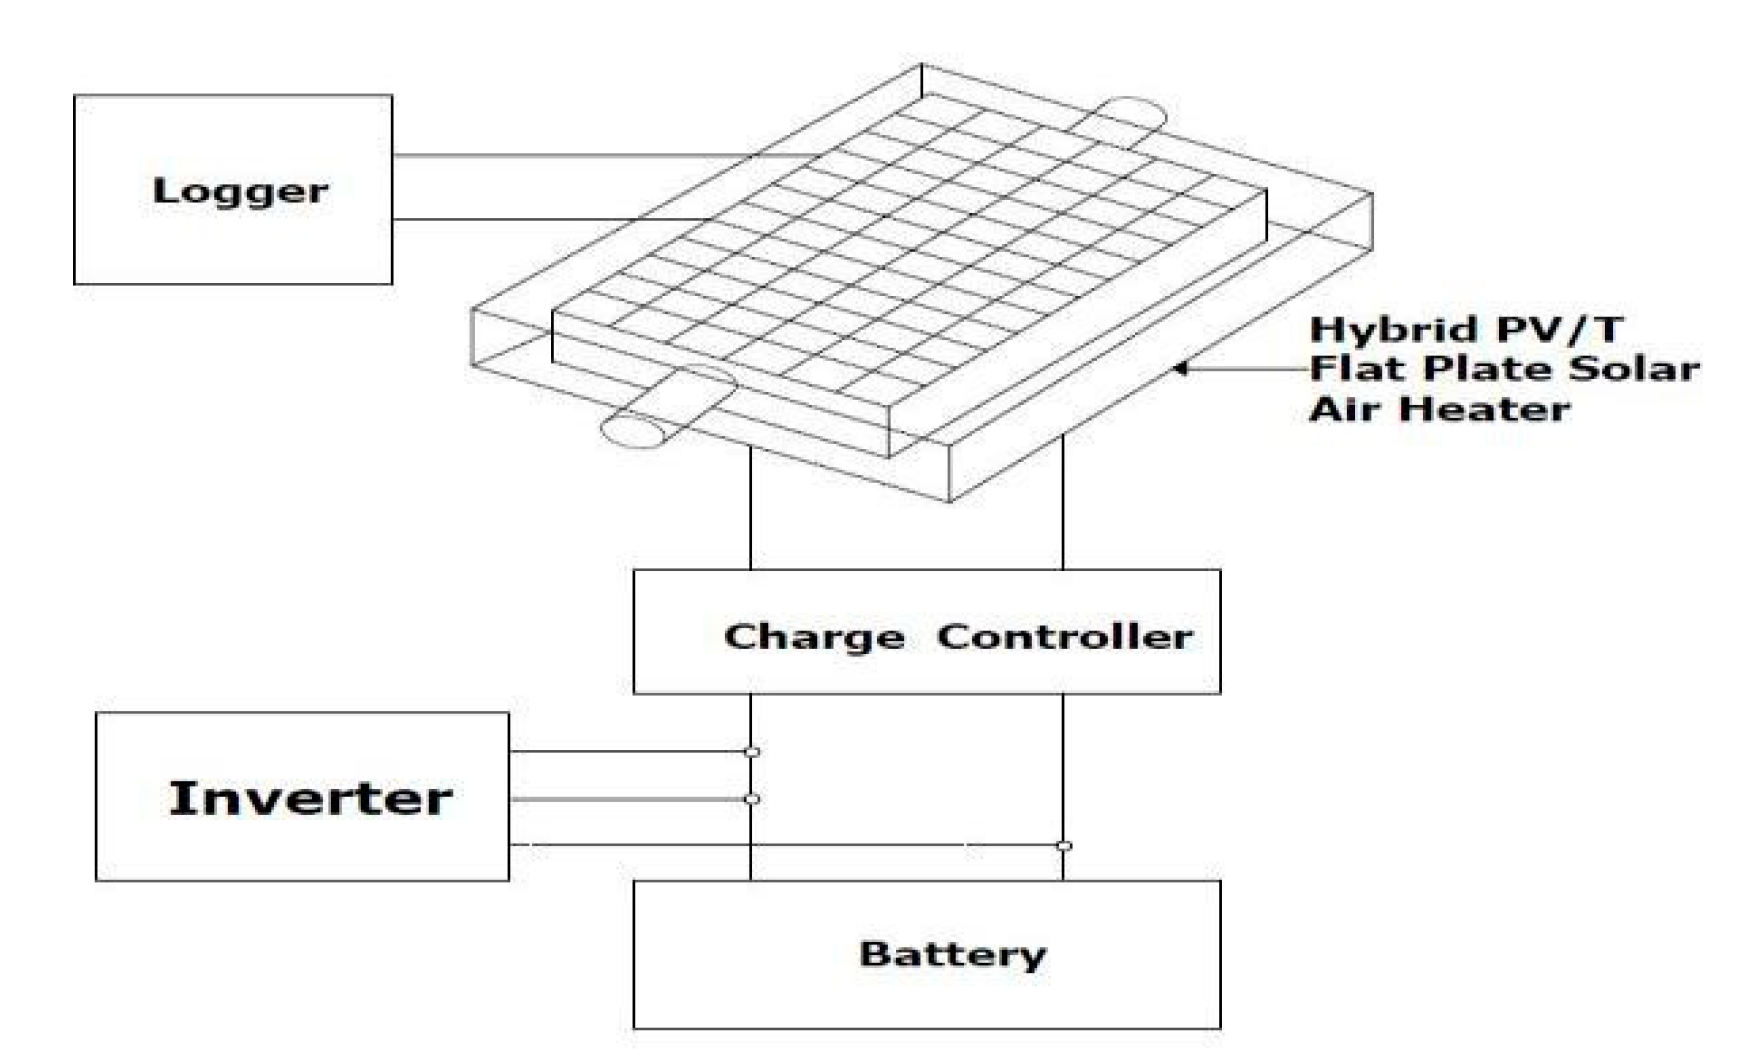
2. System Design
3. Materials and Methods
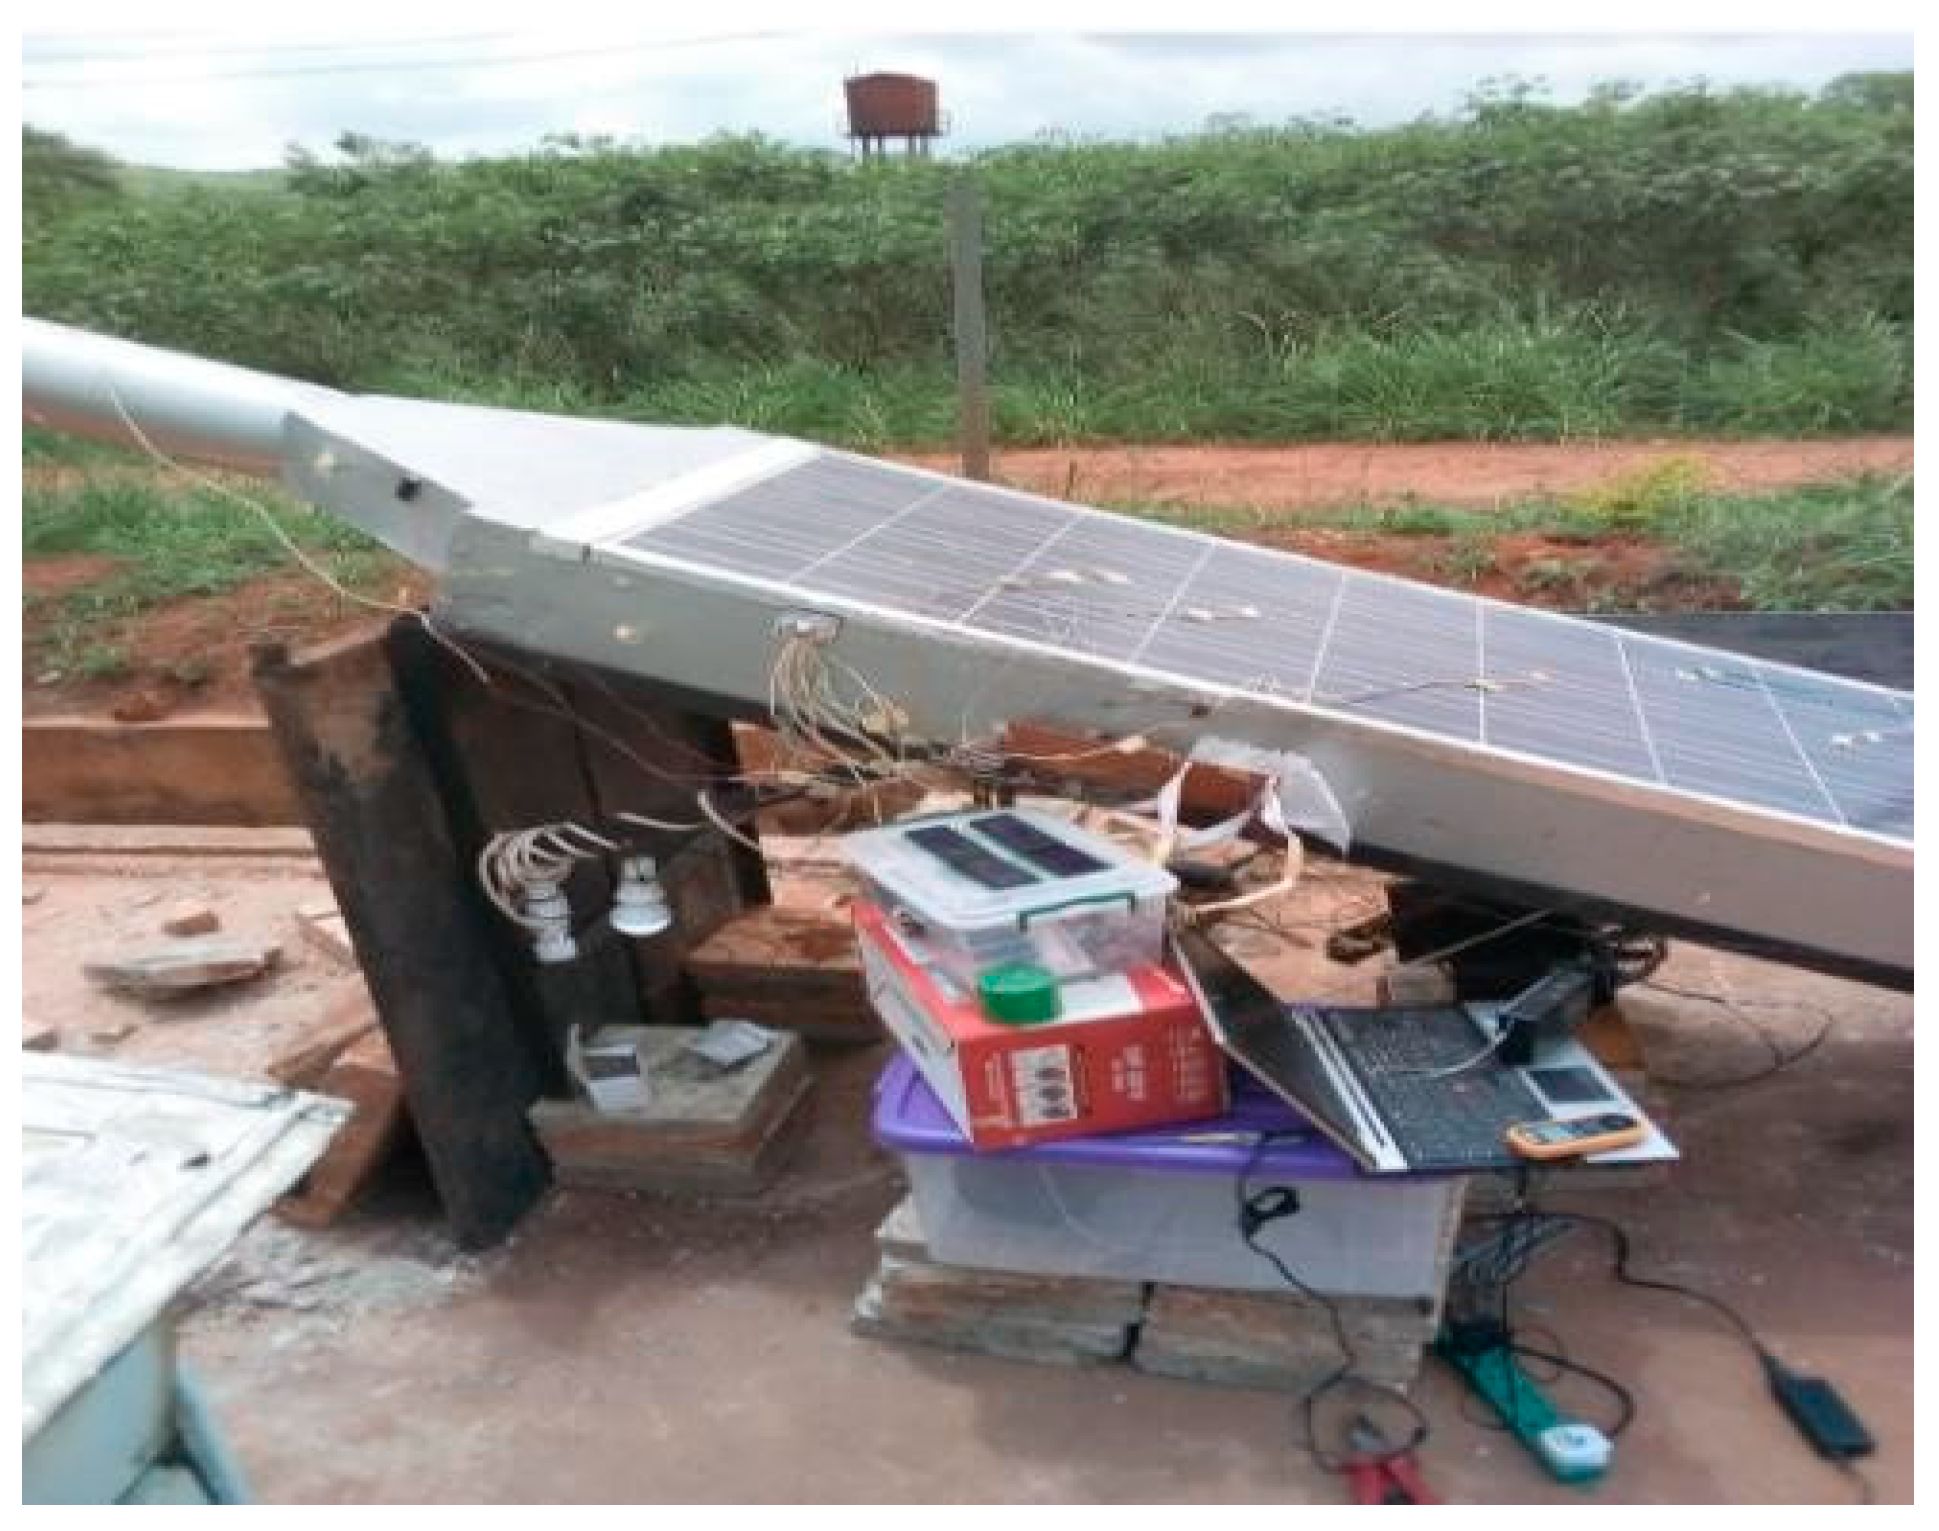
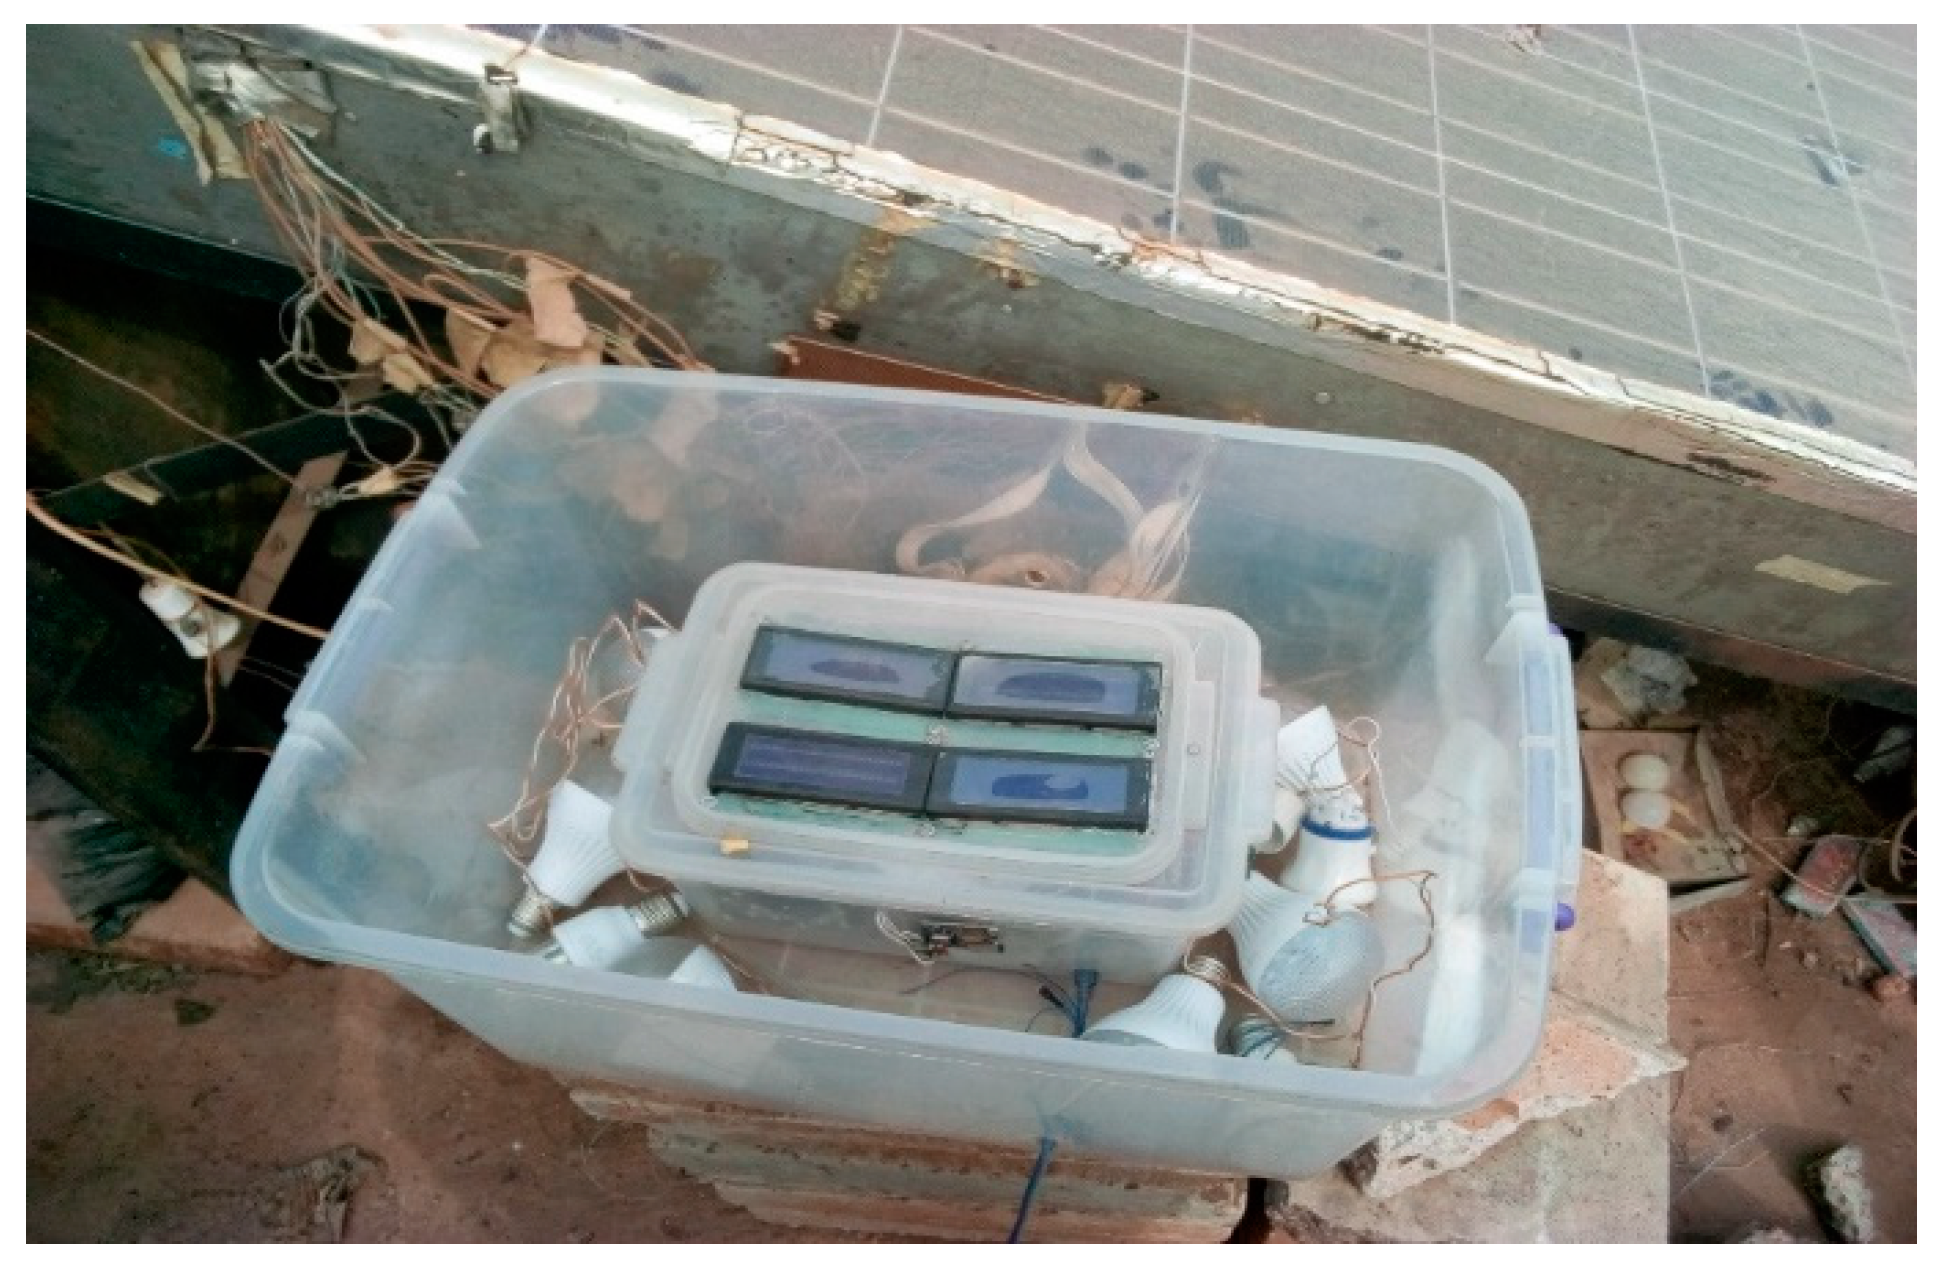
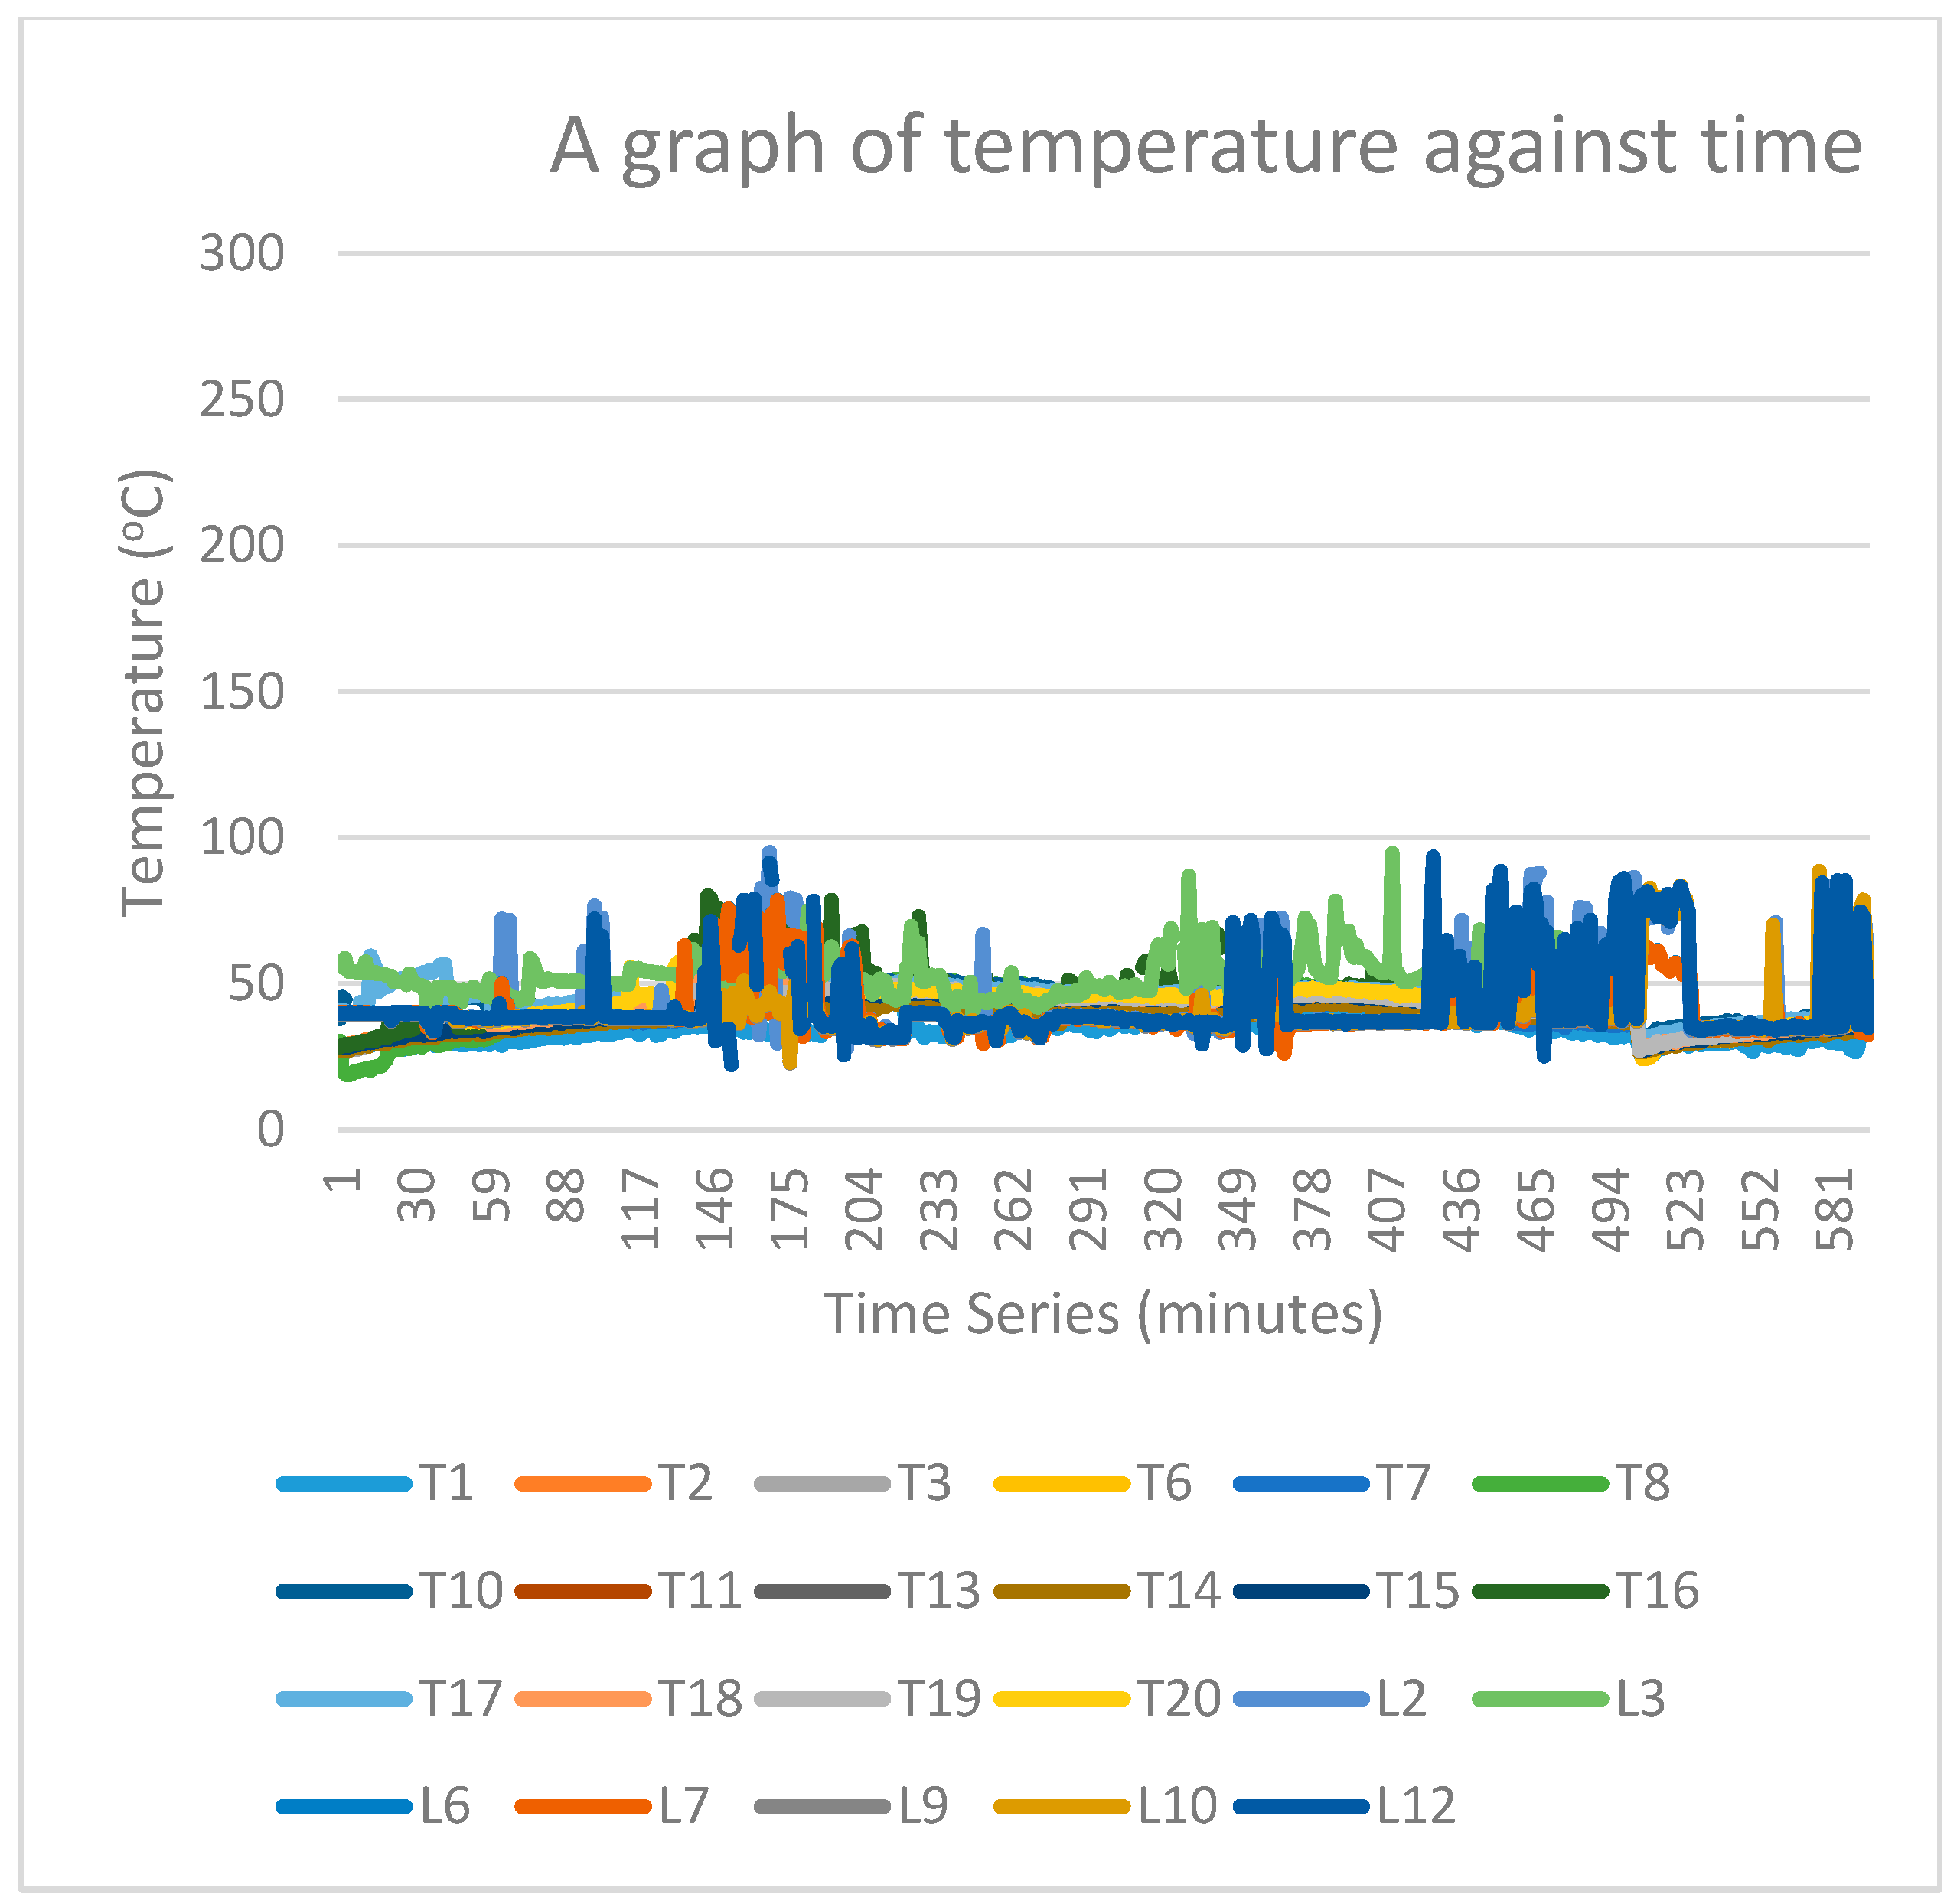
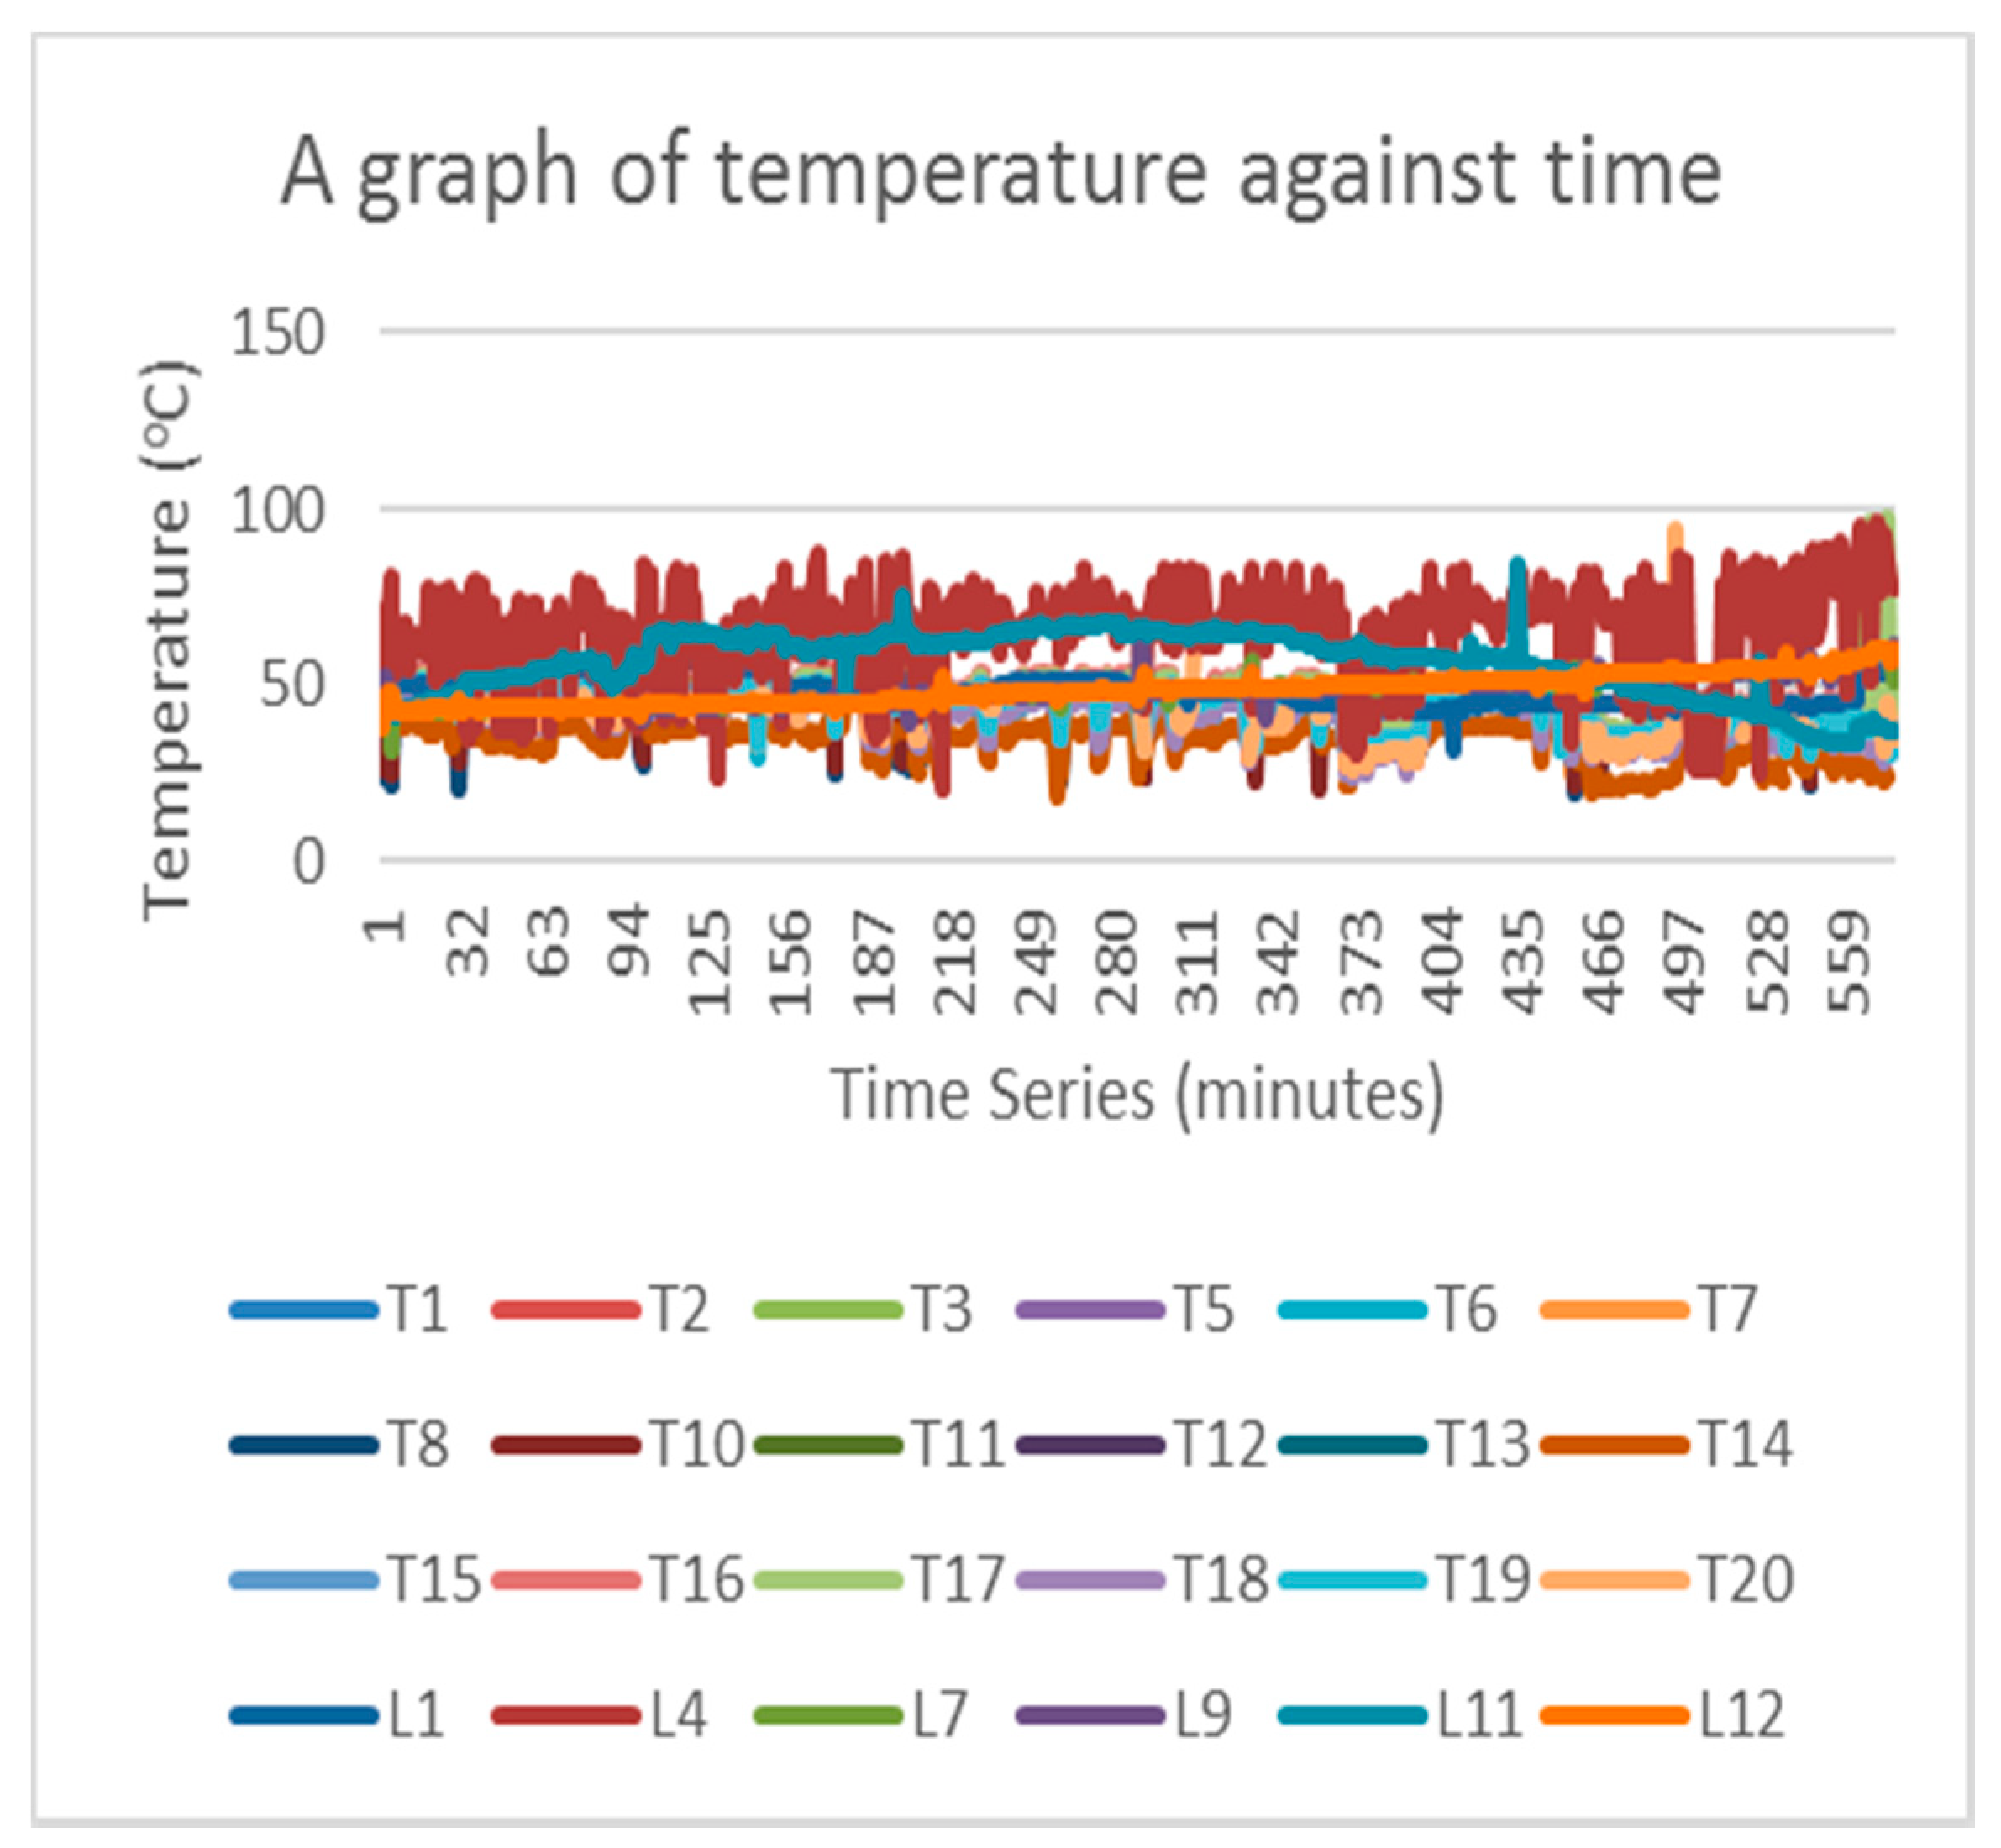
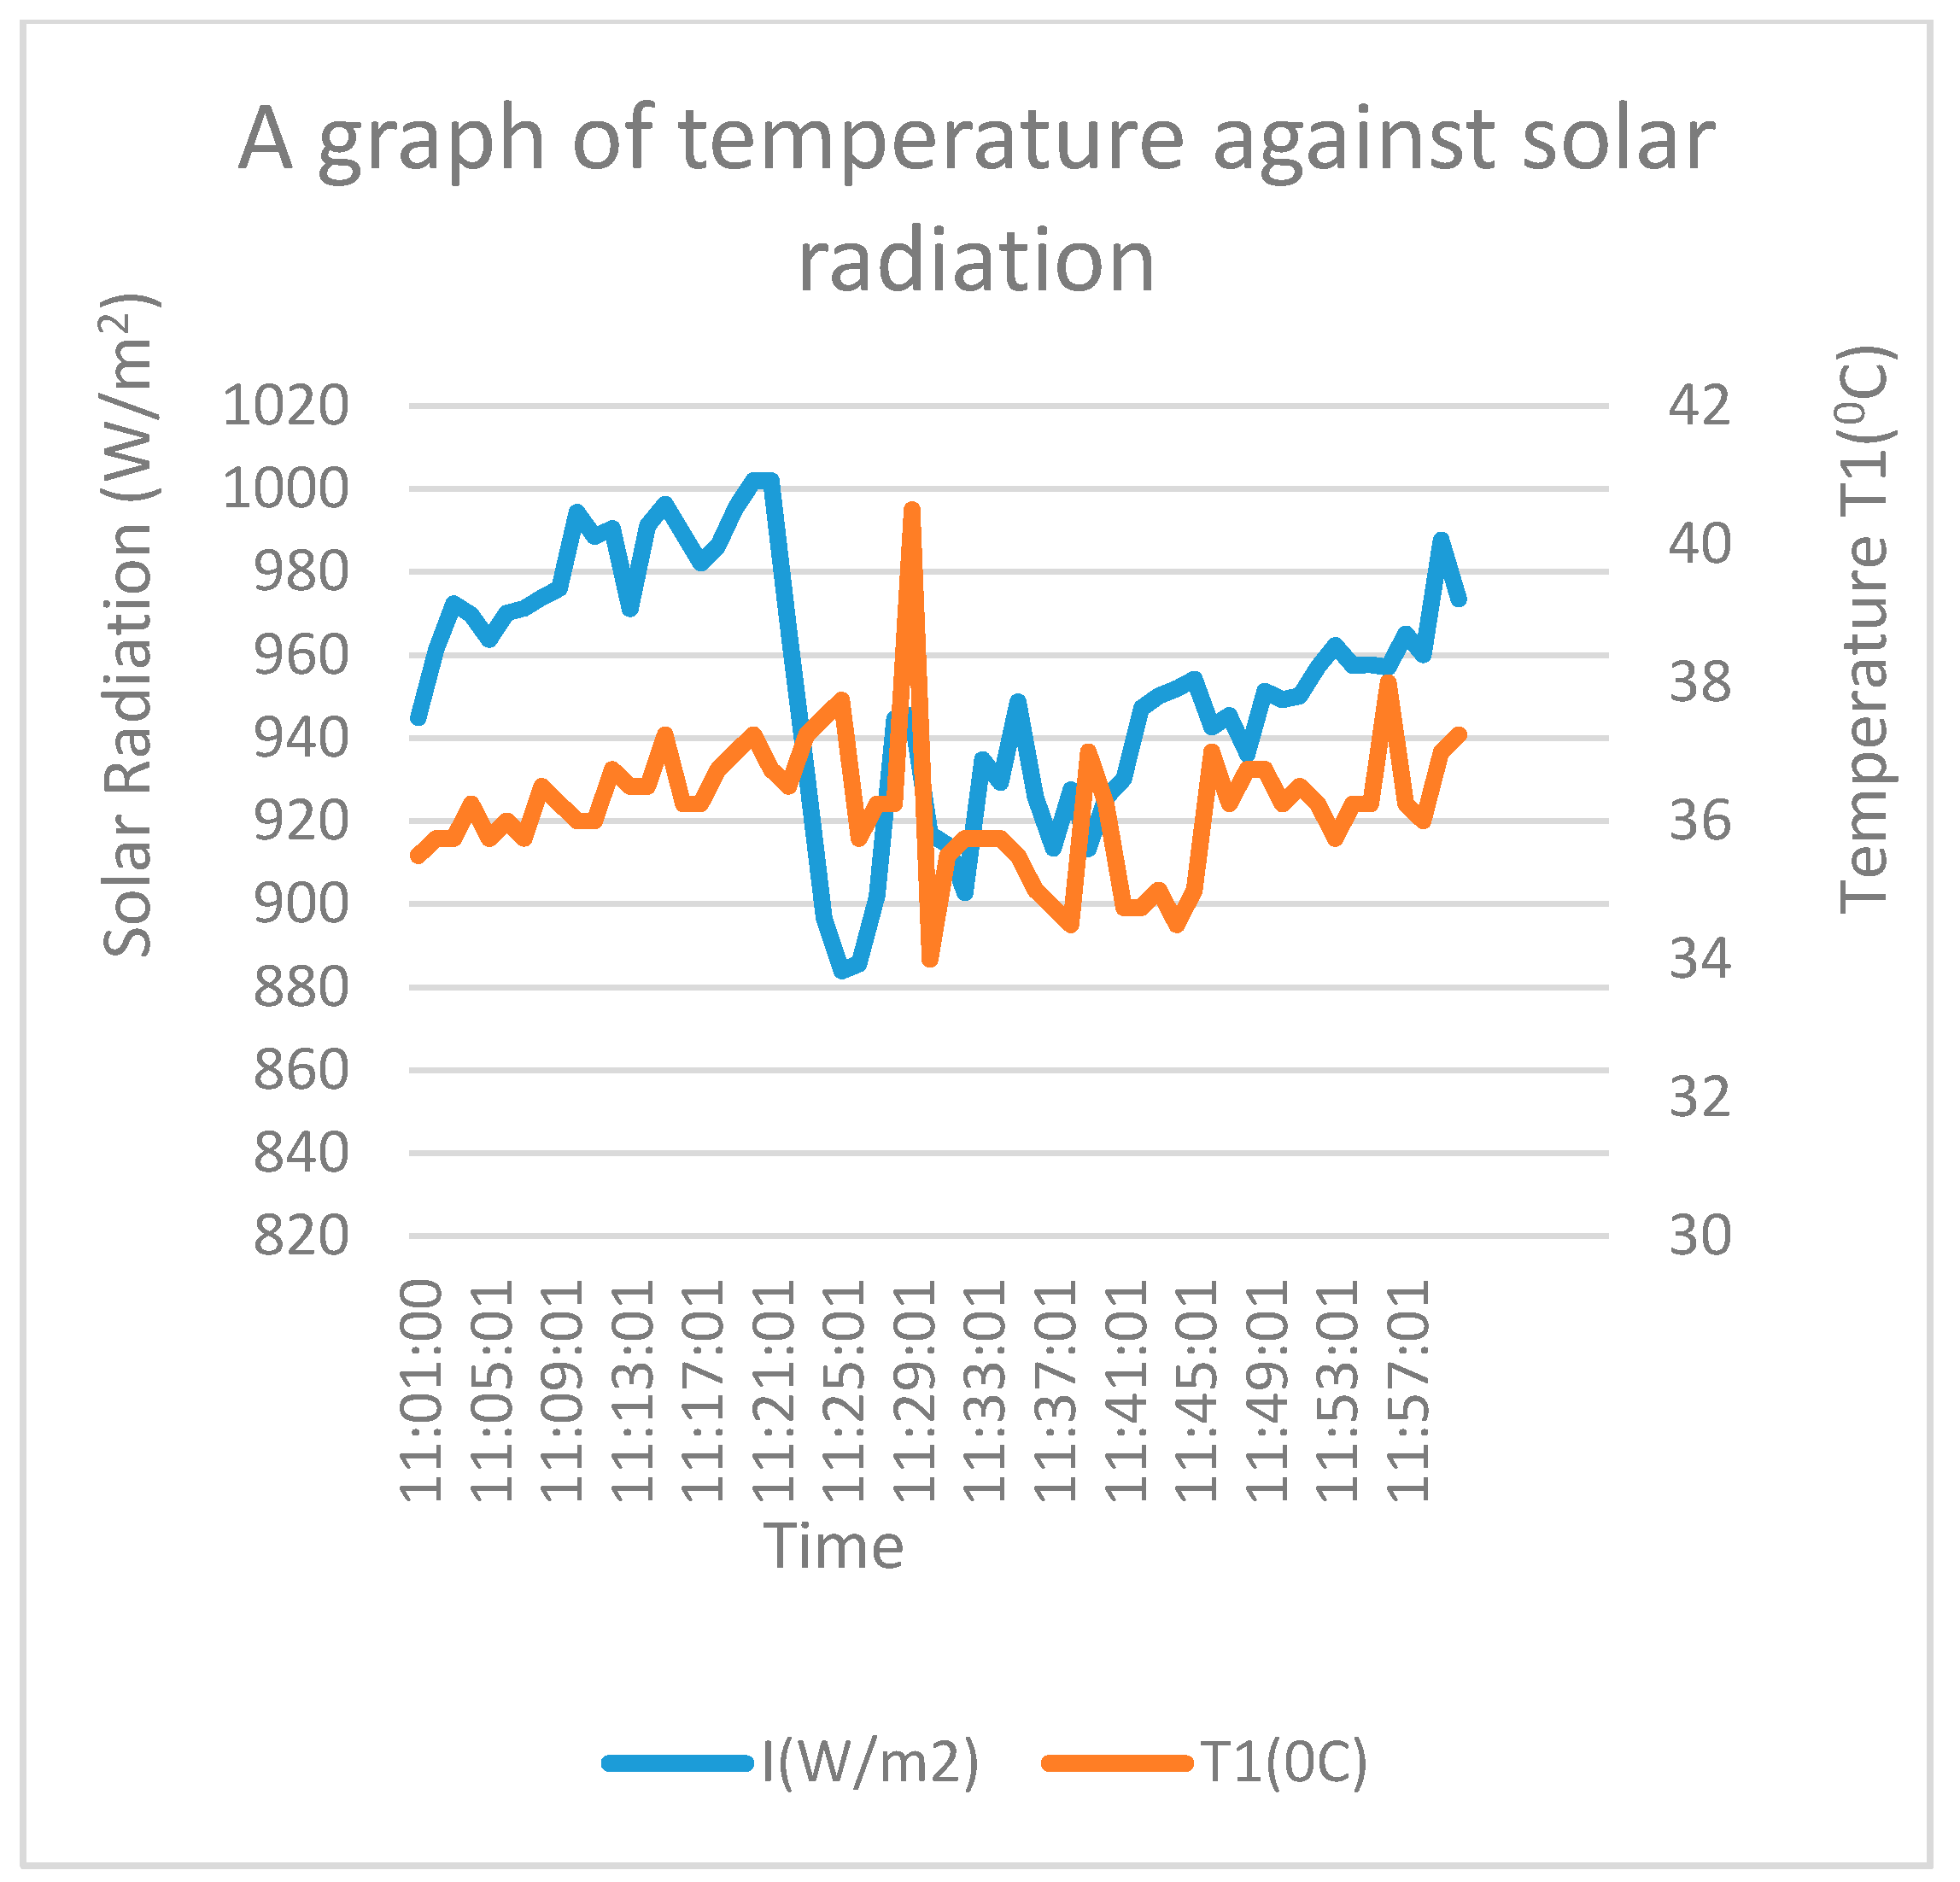
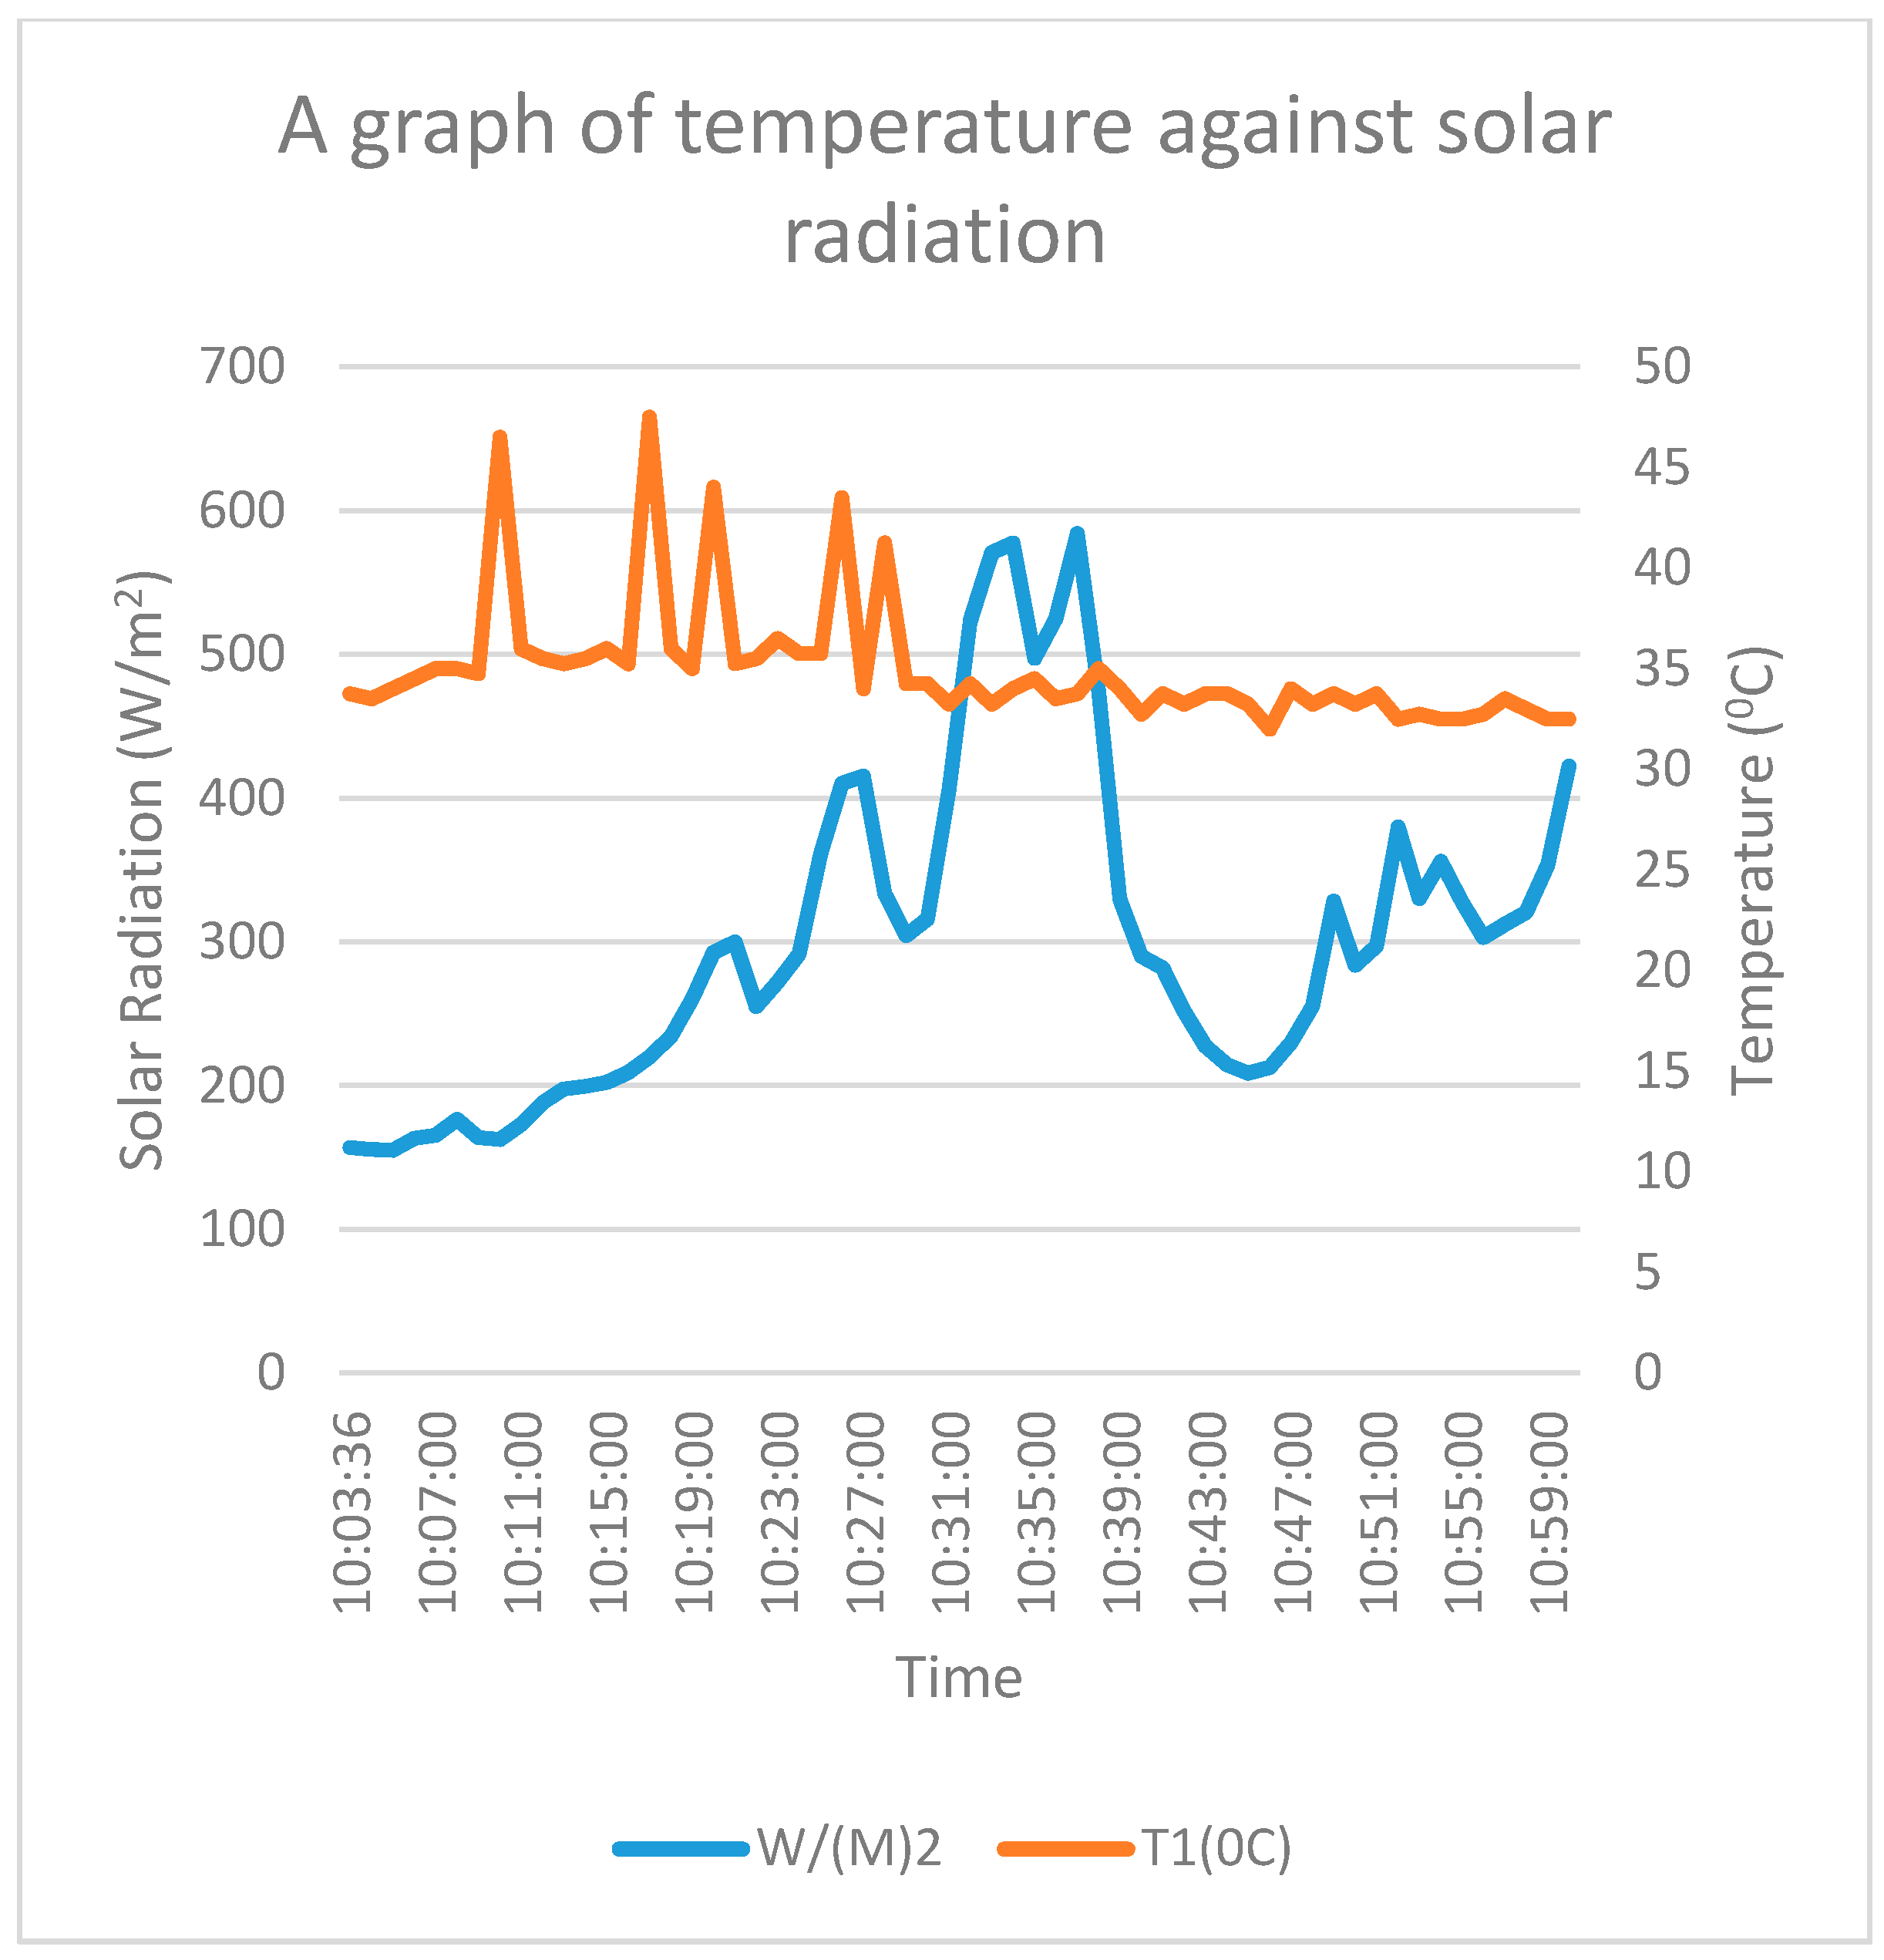
4. Field Testing Results
5. Conclusions
Appendix A

| Number of modules | 1 |
| Nominal Voltage | 12 |
| Maximum Power | 160 WP |
| Voltage Max (Pmax) | 17.5 V |
| I max P(max) | 9.15 ampere |
| Short Circuit Current, Isc | 10.07 ampere |
| Open Circuit Voltage | 21.5 V |
| Diode | Blocking and Bypass |
| Charging Method | PWM (Pulse Width Modulation) |
|---|---|
| Solar input capacity | 20 ampere |
| Load capacity | 20 ampere |
| Regulator Voltage | 14.2 V |
| Overload Capacity | 20 ampere |
| Self-Consumption | 10 mA |
| Operating Temperature | −35 °C–+50 °C |
| Acid | H2SO4 |
|---|---|
| Capacity | 100 Ah |
| Nominal Voltage | 12 volt |
| Output Waveform | Modified Sine Wave |
|---|---|
| Output Power | 1000 watt |
| Output Voltage | 220 VAC |
References
- Daly, G.M.; Flye, H.J. The Use of Low-Cost Data Logger in Monitoring Building System Performance. Energy Eng. 2000, 97, 33–42. [Google Scholar] [CrossRef]
- Ojike, O.; Mbajiorgu, C.C.; Anoliefo, E.; Okonkwo, W.I. Design and Analysis of a Multipoint Temperature Data Logger. Niger. J. Technol. (NIJOTECH) 2016, 35, 458–464. [Google Scholar] [CrossRef]
- Abrar, M.D.; Patil, R.R. Multipoint Temperature Data Logger and Display on PC through Zigbee using PSoC. Int. J. Adv. Res. Comput. Commun. Eng. 2013, 2, 3382–3391. [Google Scholar]
- Badhiye, S.S.; Chatur, P.N.; Wakode, B.V. Data Logger System: A Survey. Int. J. Comput. Technol. Electron. Eng. 2008, 4, 24–26. [Google Scholar]
- Aneja, B.; Singh, S.; Chandna, U.; Maheshwari, V. Review of Temperature Measurement and Control. Int. J. Electr. Electron. Eng. 2011, 3, 29–37. [Google Scholar]
- Purwadi, A.; Haroen, Y.; Ali, F.Y.; Heryana, N.; Nurafiat, D.; Assegaf, A. Prototype Development of a Low Cost Data Logger for PV Based LED Street Lighting System. In Proceedings of the 2011 International Conference on Electrical Engineering and Informatics, Bandung, Indonesia, 17–19 July 2011. [Google Scholar]
- Arduino, cc. “ARDUINO AND GENUINO PRODUCTS Arduino MEGA 2560 & Genuino MEGA 2560”. Available online: https://www.arduino.cc/en/Main/arduinoBoardMega2560/? (accessed on 20 December 2019).
- Obi, A.I.; Iloeje, O.C.; Anyaoha, C.O. Design, Fabrication and Testing of Prototype Microcontroller Based Multipurpose Multichannel Electric Logger. In Proceedings of the Second NIEEE Nsukka Chapter Conference on Sustainable Infrastructure Development in Developing Nations, Nsukka, Nigeria, 26–29 February 2020; Volume 1, pp. 44–50. [Google Scholar]
- Obi, A.I. Performance Analysis of Hybrid Photovoltaic/Thermal Flat Plate Solar Air Heater with Double Layered Flow. Unpbl. Ph.D. Thesis, Department of Mechanical Engineering, University of Nigeria, Nsukka, Nigeria. in view.
- Duffie, J.A.; Beckman, W.A. Solar Engineering of Thermal Processes, 3rd ed.; John Wiley and Sons, Inc.: Hoboken, NJ, USA, 2006. [Google Scholar]
- Guerrero, J.; Munoz, Y.; Ibanez, F.; Ospino, A. Analysis of Mismatch and Shading Effects in a Photovoltaic Array Using Different Tecnologies. In IOP Conference Series: Material Science and Engineering; IOP Publishing: Bristol, UK, 2014. [Google Scholar]
- Dolara, A.; Lazaroiu, G.C.; Leva, S.; Manzolini, G. Experimental Investigation of Partial Shading Scenarios on Photovoltaic (PV) Modules. Energy 2013, 55, 466–475. [Google Scholar] [CrossRef]
- Cha, S.T.; Jeon, D.H.; Bae, I.S.; Lee, R.; Kim, J.O. Reliability evaluation of distribution system connected photovoltaic generation considering weather effects. In Proceedings of the 8th International Conference on Probabilistic Methods Applied to Power System, Iowa State University, Ames, IA, USA; 2004; pp. 451–456. [Google Scholar]
- Patel, M.R. Wind and Solar Power Systems: Design, Analysis and Operation, 2nd ed.; Taylor & Francis: Boca Raton, FL, USA, 2006. [Google Scholar]
- Obi, A.I.; Udosen, A.N.; Anyaoha, C.O. Design, Construction and Testing of Multipoint Humidity, Temperature Data Logger. In Proceedings of the 1st International Multidisciplinary Conference on Technology, Nsukka, Nigeria, December 2019; Volume 1, pp. 101–109. [Google Scholar]


Publisher’s Note: MDPI stays neutral with regard to jurisdictional claims in published maps and institutional affiliations. |
© 2020 by the authors. Licensee MDPI, Basel, Switzerland. This article is an open access article distributed under the terms and conditions of the Creative Commons Attribution (CC BY) license (https://creativecommons.org/licenses/by/4.0/).
Share and Cite
Obi, A.; Iloeje, O.; Anyaoha, C.; Ojike, O. Development of a Twenty-Two-Point Multichannel Temperature Data Logger Specially Customized and Coupled to a 160Wpeak Hybrid Photovoltaic/Thermal (PV/T) Flat Plate Solar Air Heater. Eng. Proc. 2020, 2, 48. https://doi.org/10.3390/ecsa-7-08276
Obi A, Iloeje O, Anyaoha C, Ojike O. Development of a Twenty-Two-Point Multichannel Temperature Data Logger Specially Customized and Coupled to a 160Wpeak Hybrid Photovoltaic/Thermal (PV/T) Flat Plate Solar Air Heater. Engineering Proceedings. 2020; 2(1):48. https://doi.org/10.3390/ecsa-7-08276
Chicago/Turabian StyleObi, Amarachukwu, Onwuamaeze Iloeje, Chukwuemeka Anyaoha, and Onyekwere Ojike. 2020. "Development of a Twenty-Two-Point Multichannel Temperature Data Logger Specially Customized and Coupled to a 160Wpeak Hybrid Photovoltaic/Thermal (PV/T) Flat Plate Solar Air Heater" Engineering Proceedings 2, no. 1: 48. https://doi.org/10.3390/ecsa-7-08276
APA StyleObi, A., Iloeje, O., Anyaoha, C., & Ojike, O. (2020). Development of a Twenty-Two-Point Multichannel Temperature Data Logger Specially Customized and Coupled to a 160Wpeak Hybrid Photovoltaic/Thermal (PV/T) Flat Plate Solar Air Heater. Engineering Proceedings, 2(1), 48. https://doi.org/10.3390/ecsa-7-08276