Article

Influence of Climate Variability on Soybean Yield in MATOPIBA, Brazil

by
Layara Reis
1,2,*,
Cláudio Moisés Santos e Silva
1,3,
Bergson Bezerra
1,3,
Pedro Mutti
1,4,
Maria Helena Spyrides
1,
Pollyanne Silva
1,
Thaynar Magalhães
1,
Rosaria Ferreira
1,
Daniele Rodrigues
1,5 and
Lara Andrade
1,3
1
Programa de Pós Graduação em Ciências Climáticas, Universidade Federal do Rio Grande do Norte (UFRN), Natal 59078-970, Brazil
2
Instituto Federal de Educação, Ciência e Tecnologia do Piauí (IFPI), Campus Floriano, Floriano, Piauí 64800-000, Brazil
3
Departamento de Ciências Atmosféricas e Climáticas, Universidade Federal do Rio Grande do Norte, Natal 59078-970, Brazil
4
COSTEL LETG, UMR 6554 CNRS, University of Rennes 2, 35000 Rennes, Bretagne, France
5
Department of Statistics, Federal University of Piauí, Teresina, Piauí 64049-550, Brazil
*
Author to whom correspondence should be addressed.
Atmosphere 2020, 11(10), 1130; https://doi.org/10.3390/atmos11101130
Submission received: 18 August 2020 / Revised: 3 September 2020 / Accepted: 21 September 2020 / Published: 21 October 2020
(This article belongs to the Section Climatology)

Abstract

:
The objective of this study was to analyze the influence of large-scale atmospheric–oceanic mechanisms (El Niño–Southern Oscillation—ENSO and the inter-hemispheric thermal gradient of the Tropical Atlantic) on the spatial–temporal variability of soy yield in MATOPIBA. The following, available in the literature, were used: (i) daily meteorological data from 1980 to 2013 (Xavier et al., 2016); (ii) (chemical, physical, and hydric) properties of the predominant soil class in the area of interest, available at the World Inventory of Soil Emission Potentials platform; (iii) genetic coefficients of soybean cultivar with Relative Maturity Group adapted to the conditions of the region. The simulations were performed using the CROPGRO-Soybean culture model of the Decision Support System for Agrotechnology Transfer (DSSAT) system, considering sowing dates between the months of October and December of 33 agricultural years, as well as for three meteorological scenarios (climatology, favorable-wet, and unfavorable-dry). Results showed that the different climate scenarios can alter the spatial patterns of agricultural risk. In the favorable-wet scenario, there was a greater probability of an increase in yield and a greater favorable window for sowing soybean, while in the unfavorable-dry scenario these values were lower. However, considering the unfavorable-dry scenario, in some areas the reduction in yield losses will depend on the chosen planting date.

Graphical Abstract

1. Introduction

Soybean (Glycine max (L.) Merrill) is the main rainfed crop that can be cultivated in a wide range of latitudes [1]. In recent decades, the soybean has gained great importance in the global market and has become an important agricultural commodity due to the increase in its consumption as a staple food. This increase has been greatly induced by the growing global demand for food [2]. In traditional Asian cuisine, soy has been used for thousands of years. In Western countries, it was introduced about a hundred years ago and has recently been used mainly for the production of substitute foods in vegetarian diets (meat analogues and milk replacers), due to its high protein content [3]. To meet the growing worldwide demand for staple foods, including soybeans, crops depend on vast areas and enormous amounts of water resources [2,4].
In this context, the soybean became an extremely important product for Brazil’s economy by the end of the 1960s. In the mid-1970s, its increasing production boosted investments in technology by producers and the government in order to adapt it to Brazilian conditions. Until the mid-1970s, the three states of Southern Brazil—a humid subtropical zone [5]—accounted for approximately 80% of the national production. Throughout the 1980s and 1990s, production expanded towards central-west Brazil, and also towards the states of Minas Gerais, Bahia, Maranhão, Piauí, Tocantins, and Amazônia, in the tropical zone [5,6].
This expansion was crucial for Brazil to reach the second global position in production and exportation of this commodity, accounting for 32.4% of total global production, with almost 115 million tons, occupying an area of 35.8 million hectares, in the 2018/19 crop year, according to the Brazilian National Supply Company [7]. In light of this expansion scenario, the region that covers part of the states of MAranhão, TOcantins, PIauí, and BAhia (MATOPIBA) stands out. This region has a warm climate all year round, a well-defined wet season, and highly homogeneous spatial and temporal rainfall patterns. These characteristics led to the intensification of agricultural activities, making the region currently the main frontier for new agribusiness investments in Brazil [8,9,10]. In crop year 2018/19, MATOPIBA was responsible for approximately 11% of the national production of soybeans, which corresponds to 13.3 million tons [7].
However, the increase in soybean yield is subject to risks associated with climate variability and several studies indicate impacts on yield as well as a new geography of production due to climate change [11,12,13,14]. Regarding the influence of climate variability on soybean production, studies show that the El Niño–Southern Oscillation (ENSO) is the most investigated large-scale phenomenon. The alternation of its warm (El Niño) and cold (La Niña) phases displaces the ascending and descending branches of the Walker’s circulation and has a direct influence on the hydrological and thermal regimes in several regions of South America and Northeast Brazil [15,16,17,18], being responsible for severe agriculture losses in many regions of the globe [19,20,21]. In Brazil, the areas most affected by the ENSO are the eastern Amazon (tropical zone), northern portion of Northeast Brazil (tropical climate with dry winter—Aw, according to Köppen’s classification [5]), and the extratropical zone of South Brazil. In the Northeast and North Brazil, ENSO warm phases are usually associated with the occurrence of droughts while during its cold phases there is an increase in precipitation [22,23,24,25].
In addition, variations in sea surface temperature (SST) in the Tropical Atlantic modulate the north–south displacement of the Intertropical Convergence Zone, which also plays an important role in the occurrence of rainfall over the North and Northeast regions of Brazil [26,27,28]. Studies show that the ENSO and the variability of Tropical Atlantic SST directly affect agricultural activities [29,30,31,32] due to their impact on weather conditions, especially rainfall intensity and air temperature. Crop models can be a useful tool to assess the influence of climatic and other environmental factors on the development and yield of a crop [33,34], as shown by several studies in Brazil for soybeans [35,36,37,38].
The interactions between rainfall, solar radiation, air temperature, and genotype–environment parameters are of great importance in determining the best development condition for soybean crops regarding yield [39,40]. These interactions can be impacted when large-scale atmospheric–oceanic phenomena are taken into consideration, limiting yields [41,42,43,44] due to the increase in air temperature and alternating rainfall patterns which affect the development of the crop. According to references [45,46], under moderate or intense water shortage, soybean crops usually accelerate maturation and shorten the pod-filling period, which may hamper productivity as reported by reference [47]. Furthermore, severe water deficit (mainly during the critical period of flowering and pod-filling) reduces leaf expansion and leaf area, and accelerates senescence, altering the interception of solar radiation, and reducing carbon dioxide uptake and photosynthesis rate [48,49,50]. These issues may be further amplified if air temperature increases at the same time [51]. Thus, considering the vulnerability of soybeans to water deficit conditions and extreme temperatures [37,47,52,53], there is a clear need to determine its best sowing period, taking into account the assessment of risks to yield [37,54,55,56,57], especially when the region is under the influence of large-scale atmospheric phenomena. Studies on the influence of climate variability on soybean yield in producing regions of Brazil are scarce, as reported by reference [44]. However, there are no studies aimed at identifying these characteristics under the influence of different large-scale atmospheric circulation mechanisms, notably the combination of Atlantic and Pacific climate variability drivers, which allows a better understanding of the modulation of climate parameters.
Therefore, the objective of this study was to analyze the influence of large-scale atmospheric–oceanic mechanisms on the spatial and temporal variability of soybean yield in MATOPIBA, from the perspective of favorable and unfavorable climatic conditions to the occurrence of rainfall, in order to determine the best sowing period regarding climate variability. To this end, we used objective criteria for the definition of these scenarios, based on the occurrence of warm and cold phases of the ENSO and the interhemispheric gradient of SST in the Tropical Atlantic (also known as the Atlantic Meridional Mode). In addition, we analyzed the temporal variability of different meteorological factors and delimited areas at agroclimatic risk given the probability of occurrence of water deficits during the most critical period for soybean cultivation (flowering/pod-filling), considering different meteorological scenarios.
Thus, we expect to provide valuable information for the elaboration of public policies, agricultural planning, guidelines for exportation, research, changes in production models, definitions for the access to agricultural credit and insurance, and adaptation measures for soybean cultivars in the MATOPIBA region.

2. Material and Methods
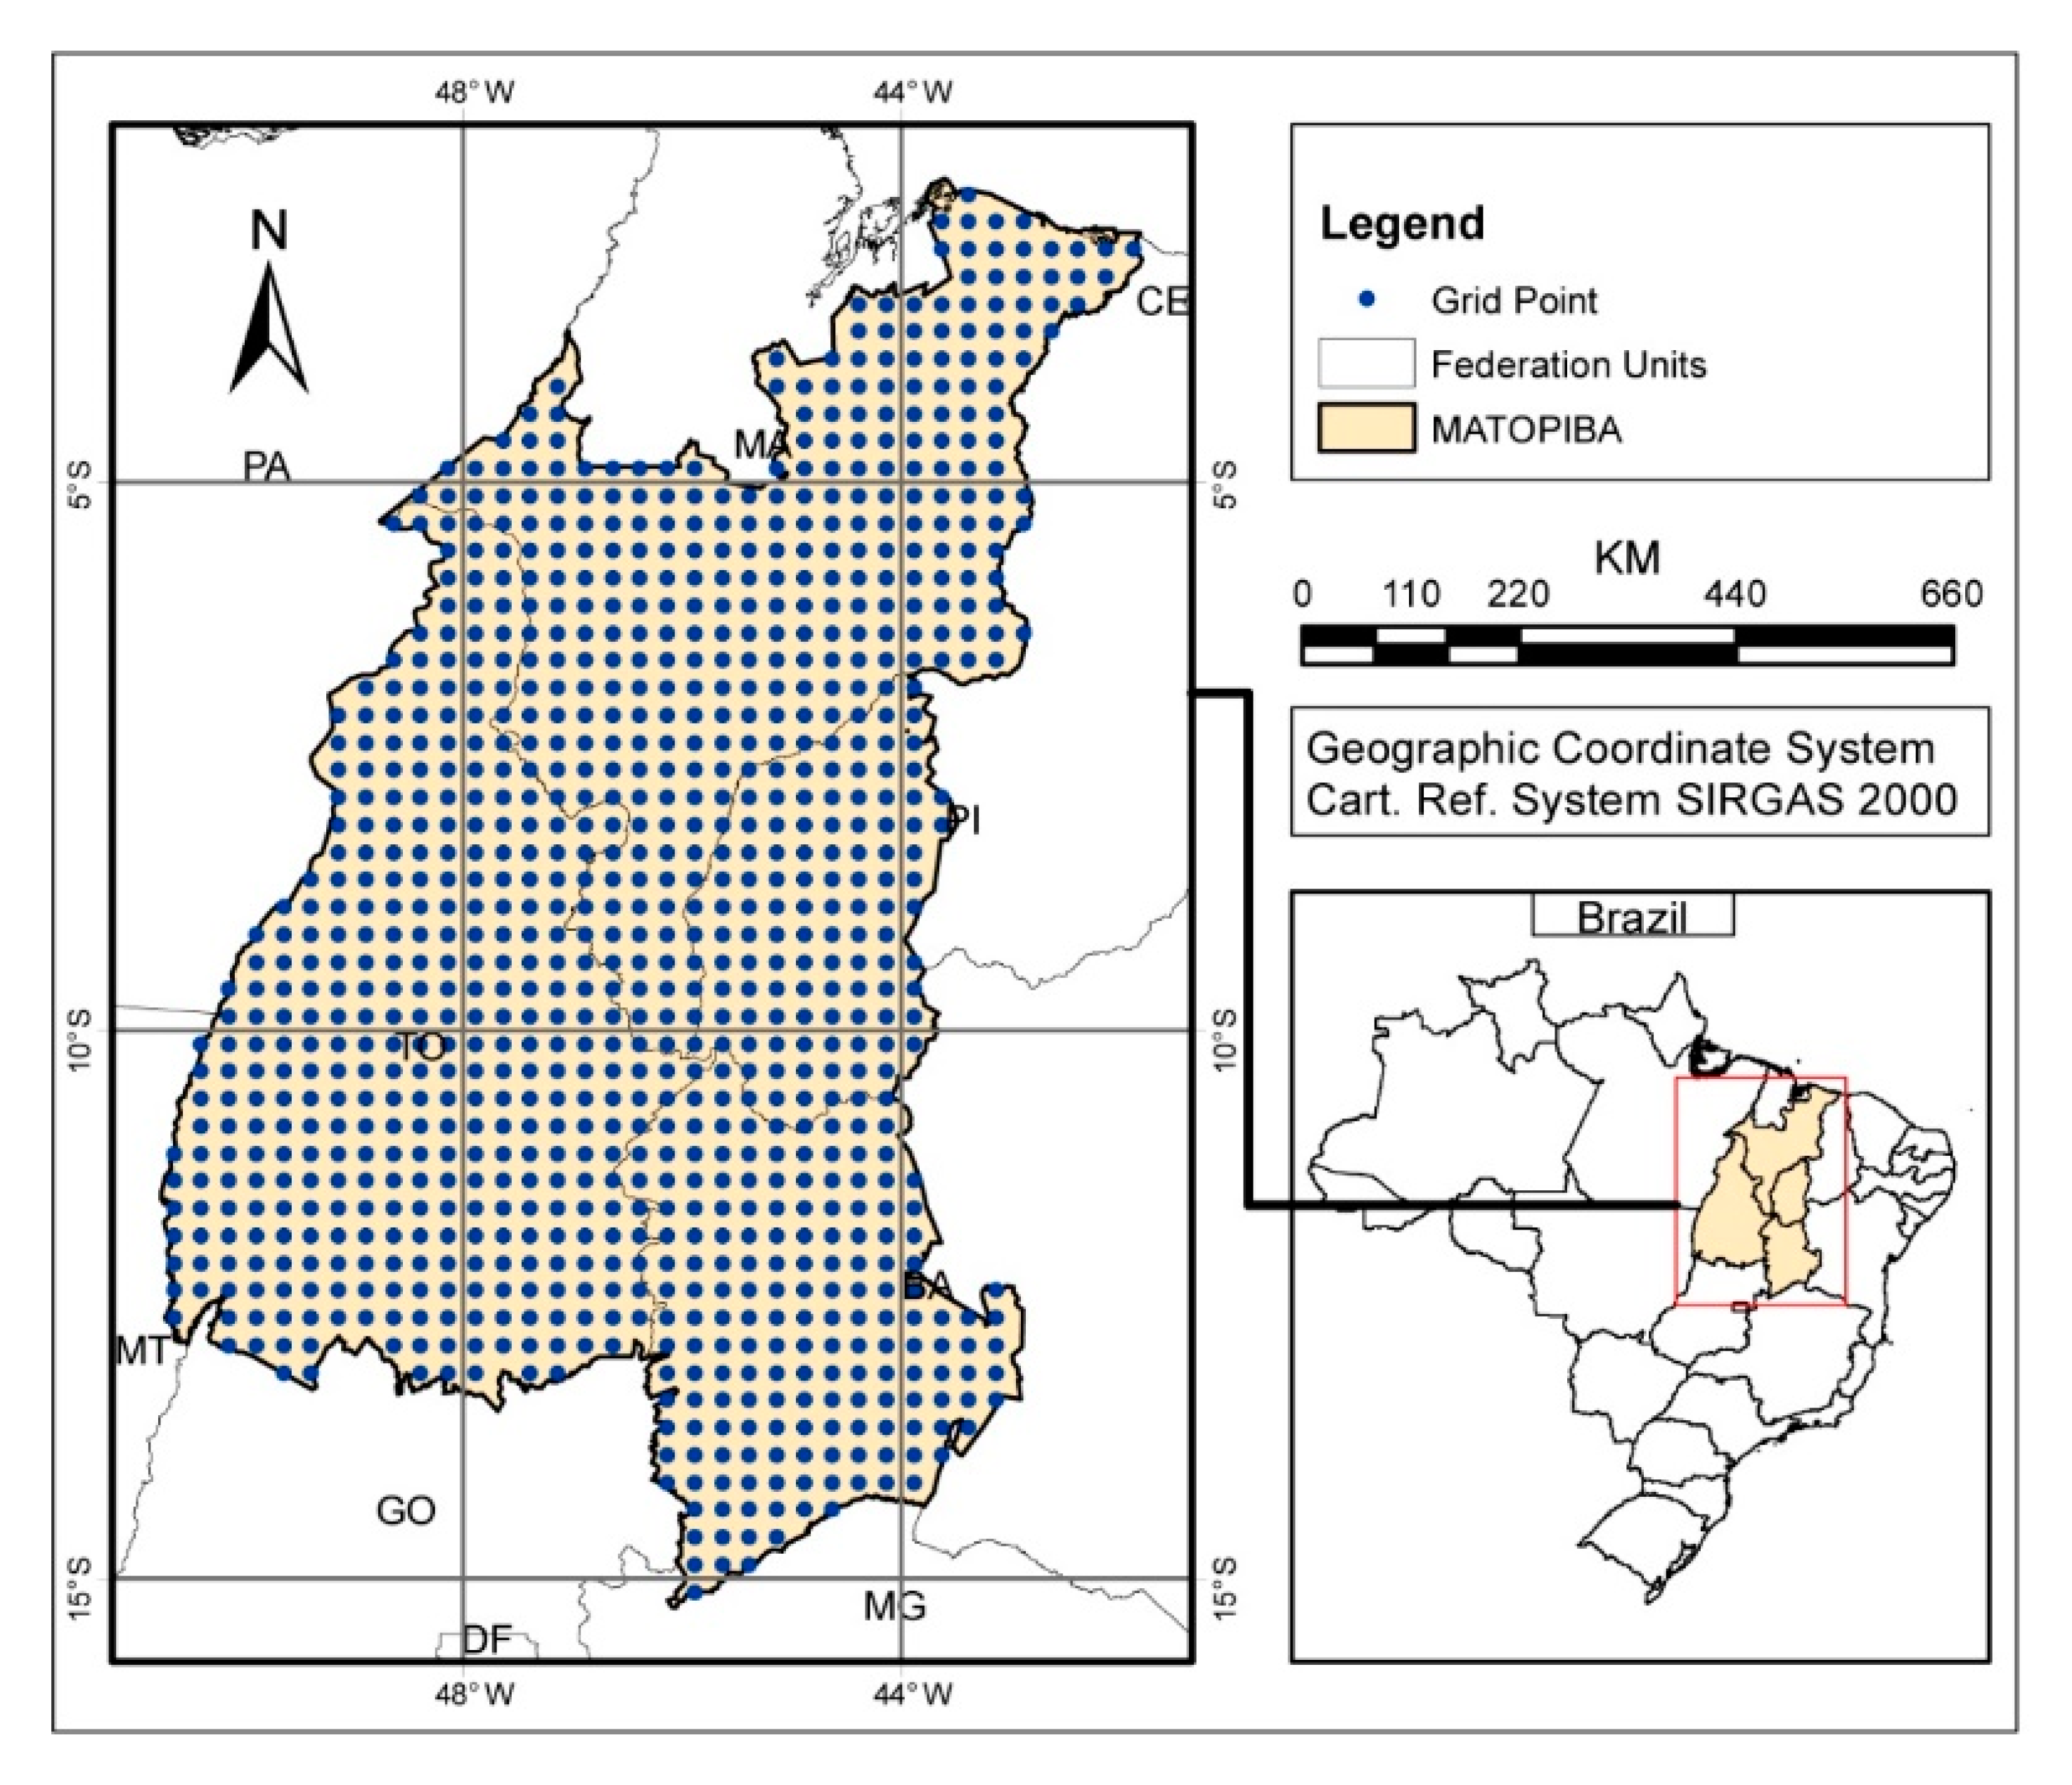
2.1. Study Area

The MATOPIBA region is located in the North and Northeast regions of Brazil, between the Amazon and the Brazilian Semiarid. Its total area is almost 74 million ha and covers most of the states of Maranhão (MA—33%) and Tocantins (TO—38%), the southwestern portion of Piauí (PI—11%), and northwestern Bahia (BA—18%) [58,59] (Figure 1).
The climate of MATOPIBA is tropical humid with dry winter (Aw), according to the Köppen classification (1948), with mean temperatures above 25 °C during all months of the year, and mean annual rainfall between 800 and 2000 mm, distributed in two well-defined seasons: the dry season, which extends from May to September, and the wet season, from October to April [5]. The predominant vegetation in the region is the Cerrado biome, which covers 91% of its total area [60]. MATOPIBA also encompasses areas of Amazon remnants (approximately 7.0%) and Caatinga (~2%). The predominant soil in the region is the yellow latosol [60], which is preferably occupied for soybean cultivation. Latosols are deep and well-developed soils, with a remarkably low fertility, high permeability, and high porosity.

2.2. Dataset

2.2.1. Meteorological Data

The meteorological data used in this study are daily incident solar radiation (Rs—MJ m−2 day1), rainfall (mm), maximum and minimum temperature (Tmax and Tmin—°C), relative air humidity (RH—%), and reference evapotranspiration (ETo—mm day1) covering the period from 1980 to 2013 and available in a 0.25° × 0.25° horizontal grid [55], encompassing a total of 963 points over the MATOPIBA region (Figure 1), available at the website <https://utexas.box.com/Xavier-etal-IJOC-DATA>. These data were used to define the climatological patterns of the region. We also used daily Tmax and Tmin (°C), rainfall (mm), and Rs (MJ m−2 day1) data to calibrate the CROPGRO-Soybean model of the Decision Support System for Agrotechnology Transfer (DSSAT), allowing the simulation of 33 sowing seasons.
The dataset of reference [61] has previously excelled when used in the simulation of soybean growth, development, and yield in Brazil, limited by water availability (yield under dryland conditions), as shown in the study by reference [37] and validated by reference [62].

2.2.2. Soil Data

Yellow latosol pedological parameters, which are described in Table 1, were used to calibrate the model. These input data refer to physical and hydraulic information obtained from the World Inventory of Soil Emission Potentials (WISE) platform of the International Soil Reference and Information Centre (ISRIC—https://www.isric.org/). They have already been validated and adopted in previous studies [35,63]. According to reference [63], soils with low- and medium-water-holding capacity are predominant in the study area.

2.2.3. Crop Data

The studied crop was soybeans, for which phenological parameters refer to the cultivar of the Relative Maturity Group 8.5 (RMG 8.5), which is the most commonly indicated maturation group for cultivation in the region [6,64,65,66].
The DSSAT-CROPGRO-Soybean model was calibrated by reference [67], which was replicated in the studies by authors of [37,44,62] with a root mean square error lower than 550 kg ha−1 in Brazilian regions. Detailed descriptions of the calibrated genetic coefficients are shown in Table 2.

2.3. Methods

2.3.1. Meteorological Data

Climate suitability for soybean cultivation was defined for three scenarios with the following weather conditions: (i) climatology, (ii) favorable (wet), and (iii) unfavorable (dry). The climatology scenario refers to the mean values of the meteorological variables in the period from 1980 to 2013. The favorable and unfavorable scenarios were defined based on the occurrence of the ENSO phases and the interhemispheric gradient of SST in the Tropical Atlantic and their effects on rainfall over the North and Northeast regions of Brazil, as defined by references [26,69,70,71]. In this method, a favorable year (wet) is defined if the ENSO cold phase (La Niña) and the interhemispheric gradient of SST pointing towards the South Tropical Atlantic are established at the same time. On the other hand, an unfavorable scenario (dry) is defined when the ENSO warm phase (El Niño) and the interhemispheric gradient of SST pointing towards the North Tropical Atlantic are established. The years resulting from these configurations were defined according to the study in reference [72].
We calculated the mean of each meteorological variable between the months of October to April (period recommended by the Brazilian Agricultural Research Corporation—Embrapa—for soybean cultivation in the region) for the crop years from climatology, the crop years of favorable conditions and for crop years unfavorable conditions.
Subsequently, in order to test the hypotheses on the equality of the medians of each scenario, the Dunn’s test [73] of multiple comparisons following a significant Kruskal–Wallis test [74] was applied at the 5% and 10% significance levels. In addition, the Mann–Kendall non-parametric test was applied in order to verify linear trends in the annual time series from 1980 to 2013.

2.3.2. Crop Simulation Model

Simulations of soybean growth and yield were performed using the CROPGRO—Soybean model [68,75] of the DSSAT system [76] v4.7, for 33 years of cultivation. The model has been widely used in several regions of the globe [1,76,77,78,79,80,81].
The CROPGRO—Soybean model presented the best performance among five other models analyzed in reference [67] for the simulation of soybean yield under Brazilian environmental conditions. Regarding the methods for estimating crop development, the model considered the Ritchie tipping bucket method for determining soil water balance [82], the Suleiman–Ritchie method for soil evaporation simulation [83], the soil curve number method to define water infiltration [84,85], and the FAO 56/Penman–Monteith method for estimating photosynthetic response at the leaf level and evapotranspiration [86,87]. The model further established simulations for a rainfed crop with nitrogen in the soil resulting from biological fixation.
The processing of meteorological data was performed using the WeatherMan software, which is part of the DSSAT platform. The parameters of the crop genetic coefficients were obtained from reference [67] for soybean maturity group 8.5, as previously mentioned. The simulations resulted in a mean cultivation cycle of approximately 125 days. The sowing period was defined between October and December, with dates every 10 days considering the crop years from 1980/81 to 2012/13. The choice of this period took into consideration the wet season in the region, since in rainfed systems the sowing window directly depends on rainwater. In the simulations, a row spacing of 0.45 m and a population of 28 plants by m2 was adopted, as commonly recommended by reference [88] and previously adopted in the study in reference [37]. For the beginning of the simulation, we considered the initial available water soil content prior to 30 days from the sowing date.
Afterward, based on crop maximum evapotranspiration (ETc) and actual evapotranspiration (ETa) values simulated by the model, we calculated the water requirement satisfaction index (WRSI) [89] which is defined as the ratio between ETa and ETc. The WRSI has been used to define climate risk patterns for the cultivation of different crops in various regions of Brazil and the globe [90,91,92,93,94,95].
The analyses were performed for the mid-stage of soybean culture (phases R1–R5) with the [96] phenology being adopted in the model. The mid-stage was chosen because it is the most critical phenological phase regarding water deficit [54,97,98,99]. In this phase, the crop is at the apex of its physiological and metabolic functions, because it is the period of flowering and pod development and requires the highest water demand of all growth and development phases [100]. Table 3 displays the criteria used in the definition of the agroclimatic risk for soybean crops. To that end, water deficit conditions were classified based on the WSRI categories defined by references [54,101,102].
For the definition of these categories, a minimum frequency of occurrence of 80% was considered for each site and planting date as suggested by references [54,102]. Subsequently, by means of geographic information systems and geostatistical techniques, areas with different occurrences of water deficit were mapped and identified as favorable, intermediary, and unfavorable, according to the sowing period, water consumption in the mid-stage, soil properties, and phenological characteristics of the cultivar.
The simulated soybean yield was analyzed for 10 locations distributed among the 10 MATOPIBA mesoregions (Northern Maranhão, Central Maranhão, Eastern Maranhão, Western Maranhão, Southern Maranhão, Southwestern Piauí, Extreme-western Bahia, São Francisco Valley Bahia, Eastern Tocantins, and Western Tocantins) through the perspective of the three aforementioned meteorological scenarios. We deem that these 10 sample locations are enough to analyze the soybean yield behavior under the different environmental characteristics of the MATOPIBA region. The result of the simulated yield was used to determine the best sowing date, considering the three meteorological conditions, since the final yield comprises the influence of all soil and climatic factors on crop development. Thus, as a criterion for determining the best sowing period, the method described in reference [44] was used, where the appropriate sowing window takes place when the simulated yield for each crop-year is higher than the average yield (considering the 33 years of cultivation) in at least 60% of the years.

2.3.3. Assessment of Modeling Performance

The assessment of the model performance was carried out through statistical comparison between the observed yield values obtained by the Municipal Agricultural Production (Produção Agrícola Municipal—PAM) database of the Brazilian Institute of Geography and Statistics (Instituto Brasileiro de Geografia e Estatística—IBGE) and those simulated by the CROPGRO—Soybean model, for 33 cultivation seasons in four locations distributed in the study area. The locations (Grajaú—MA, Uruçuí—PI, São Desidério—BA, and Figueirópolis—TO) were chosen because they present different characteristics regarding the climate variability scenarios, as well as a relevant availability of data on soy yield. The statistical metrics used were (i) correlation coefficient—r (Equation (1)), (ii) mean error (ME) or bias (Equation (2)), (iii) root mean square error—RMSE (Equation (3)), as previously described by references [35,36,62,103,104]:
r = i = 1 n [ ( S i S ¯ ) ( O i O ¯ ) ] i = 1 n [ ( S i S ¯ ) 2 ]   i = 1 n [ ( O i O ¯ ) 2 ]
B i a s = 1 N   i = 1 n ( O i     S i )
R M S E = i = 1 n O i S i   2 n
where O i is the observed value, S i is the simulated value, O ¯ is the mean of observed values, and n is the number of events.

3. Results

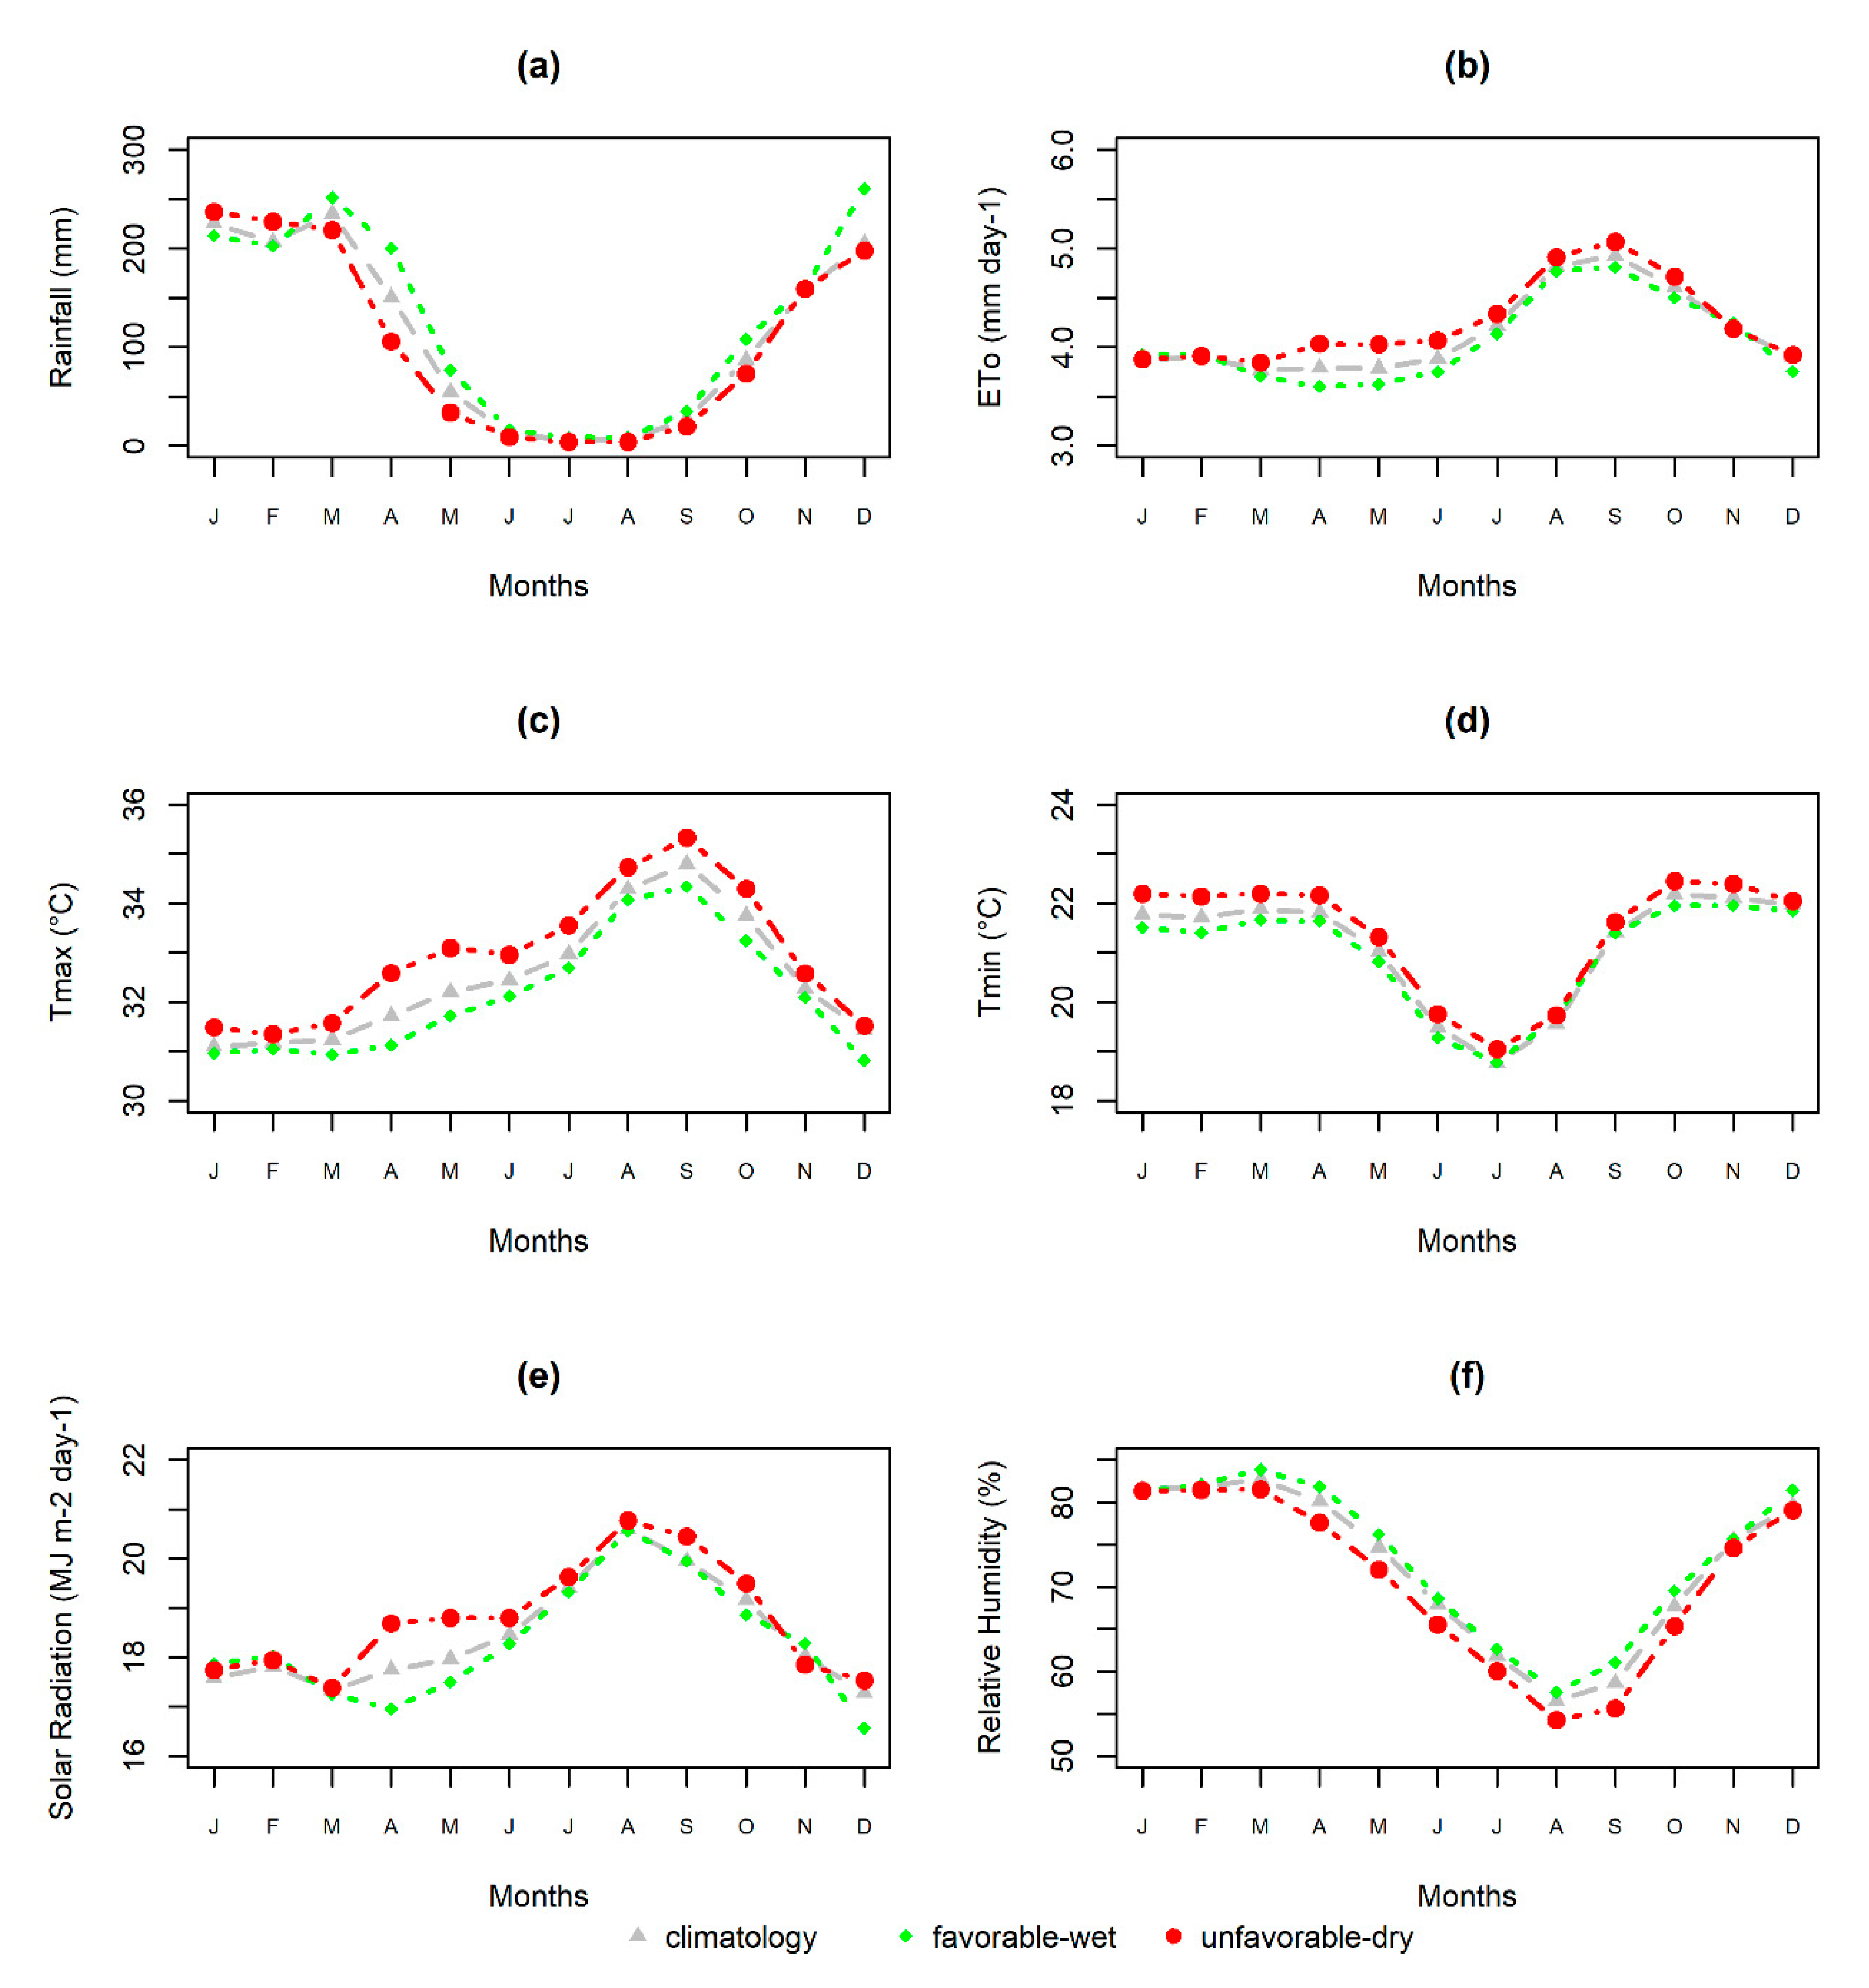
3.1. Monthly Analysis of Meteorological Variables

Figure 2 shows the mean monthly values of Rs (MJ m−2 day−1), rainfall (mm), ETo (mm day−1), Tmax and Tmin (°C), and RH (%) from 1980 to 2013 for the MATOPIBA region, considering the climatology of the period, the favorable scenario (wet), and the unfavorable scenario (dry).
Rainfall (Figure 2a) has similar seasonal behavior in both wet and dry scenarios, with two well-defined seasons: a wet period between October and April, with a climatological average above 250 mm, and a dry period between May and September, with averages close to zero in July and August. In January and February of the dry scenario, rainfall is higher (maximum of 237.1 mm in January) than the climatology and wet scenario. On the other hand, mean monthly values during the other months of the dry season are predominantly lower than the mean monthly climatological and wet scenario values. In the wet scenario, rainfall is better distributed with intensities equal to or greater than the climatology in the period from October to May. Therefore, it can be observed that in the dry scenario, there are very high rainfall rates (January and February) that take place in a shorter period if compared to the climatology or wet scenario.
Reference evapotranspiration (Figure 2b) has a temporal pattern similar to that of Tmax (Figure 2c), reaching mean values around 5.0 mm day−1 in September. It can be noticed that throughout the year (except in January and February) ETo is higher in the dry scenario, when rainfall is lower. This behavior of ETo is consistent with the variability of RH (Figure 2f), which is predominantly lower in the dry scenario, and represents a higher atmospheric demand for water. Air relative humidity presents minimum values in August with a climatological average around 55%.
Regarding Tmax (Figure 2c), the highest mean values were registered in August, September, and October, and the climatological mean was around 35.0 °C in September. This maximum coincides with the months of higher ETo and minimum rainfall rates. The highest values are verified in the dry scenario throughout the entire year. Minimum temperature (Figure 2d) presents lower values in July, with a climatological mean around 18.5 °C and consistently higher values throughout the entire year during the dry scenario.
August is the month with the highest solar radiation intensity (Figure 2e), regardless of the scenario, with an average of 20.3 MJ m−2 day−1. The difference between scenarios is more pronounced in the period from January to June, when, in the first three months, Rs is lower in the dry scenario than the climatology and the wet scenario. On the other hand, in the March–April–May period, radiation is higher in the dry scenario, reaching values above 18.0 MJ m−2 day−1. The most likely explanation for this behavior is the higher occurrence of rainfall associated with stratiform clouds, which are well distributed in the March–April–May period during the wet scenario, corroborating with the observed rainfall distribution (Figure 2a). On the other hand, during January and February, Rs is higher due to the occurrence of convective and discontinuous rains, incurring in a higher incidence of solar radiation at the surface.

3.2. Differences between Scenarios

Table 4 presents the statistical analysis of the comparison between the medians of the meteorological variables in each scenario. For this purpose, only the medians from October to April (crop year) were considered. The table presents mean values, deviations, and the Dunn’s test result at the 5% and 10% significance levels. Comparing the dry scenario with the climatology, only Tmax and Tmin were significantly different (p-value < 0.5). Regarding the wet scenario, Tmax and Tmin were significantly lower than the climatology (p-value < 0.5). On the other hand, all wet scenario variables were significantly different in relation to the dry scenario, with the exception of ETo. Therefore, there is statistical evidence that the soybean crop period in the MATOPIBA region during the wet scenario is wetter (p-value < 0.10), more humid (p-value < 0.05), and colder (p-value < 0.05) than during the dry scenario.

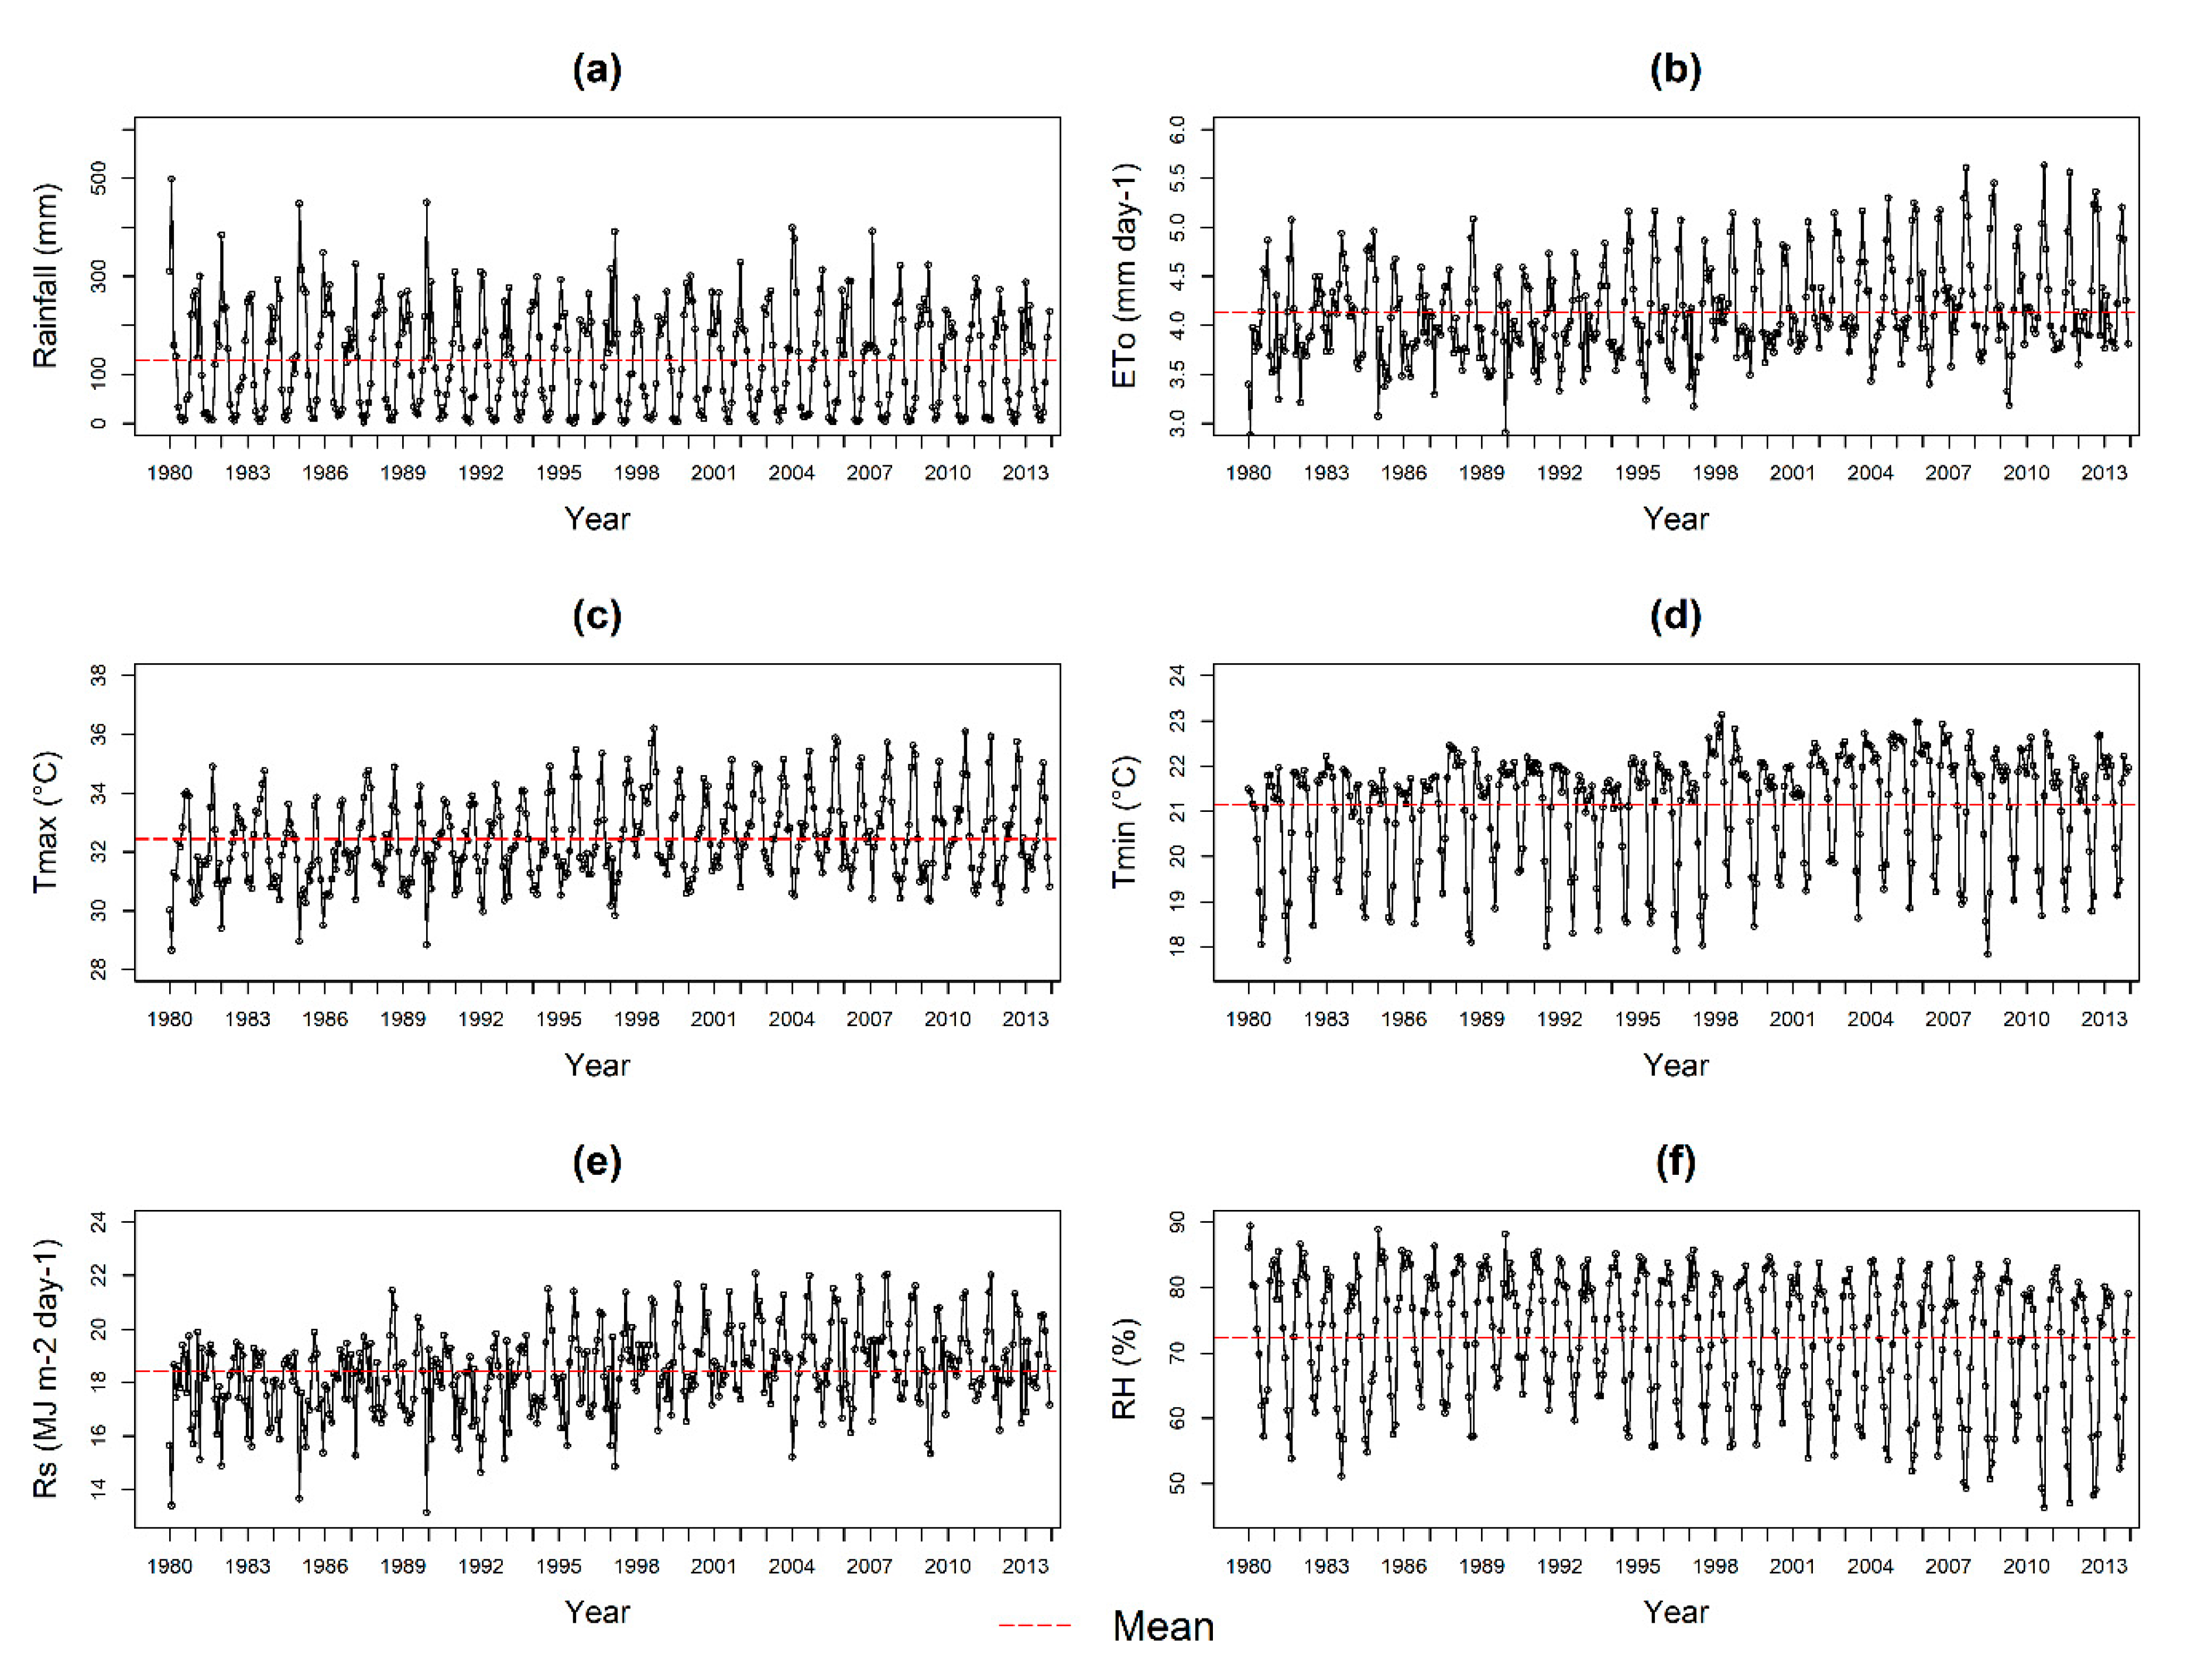
3.3. Interannual Variability and Linear Trend

According to Figure 3, we observe that the MATOPIBA region has a high monthly variability with accumulated rainfall values ranging from 280 mm (1990) to 500 mm (1985) in February, in the dry and wet scenarios, respectively. The values of Rs, Tmax, and Tmin vary in a similar way, with the lowest values of Rs (17 MJ m−2 day−1) and Tmax (31.0 °C) being reached in 1985. The year of 1998 (dry scenario) was characterized by a strong El Niño event and strong Tropical Atlantic gradient of SST oriented towards the north, with severe weather consequences. The highest temperatures of the series were reached that year, recording the maximum Tmax value of 36.2 °C and Tmin of 23.1 °C (Figure 3c,d), although rainfall rates were not the lowest of the series, reaching a maximum of 255 mm in January. Despite the pronounced interannual variability, it can be noted that the positive trends of Tmax and Tmin are significant at the 1% level (Table 5), with increases of 3.63 °C and 3.41 °C, respectively, as determined by the Z-test.
Relative humidity acts as a temperature regulator given the water vapor’s ability to absorb infrared radiation. Thus, the results point to a statistically significant reduction (at the level of 0.01%) of RH (Figure 3f and Table 5) and a significant increase in water demand in the atmosphere (accounted for by ETo—Figure 3b and Table 5), which may be associated with a decrease in soil moisture in the region, which is linked to the occurrence of weaker rains and increased seasonality. Regarding precipitation, the results did not show trends in annual precipitation rates.

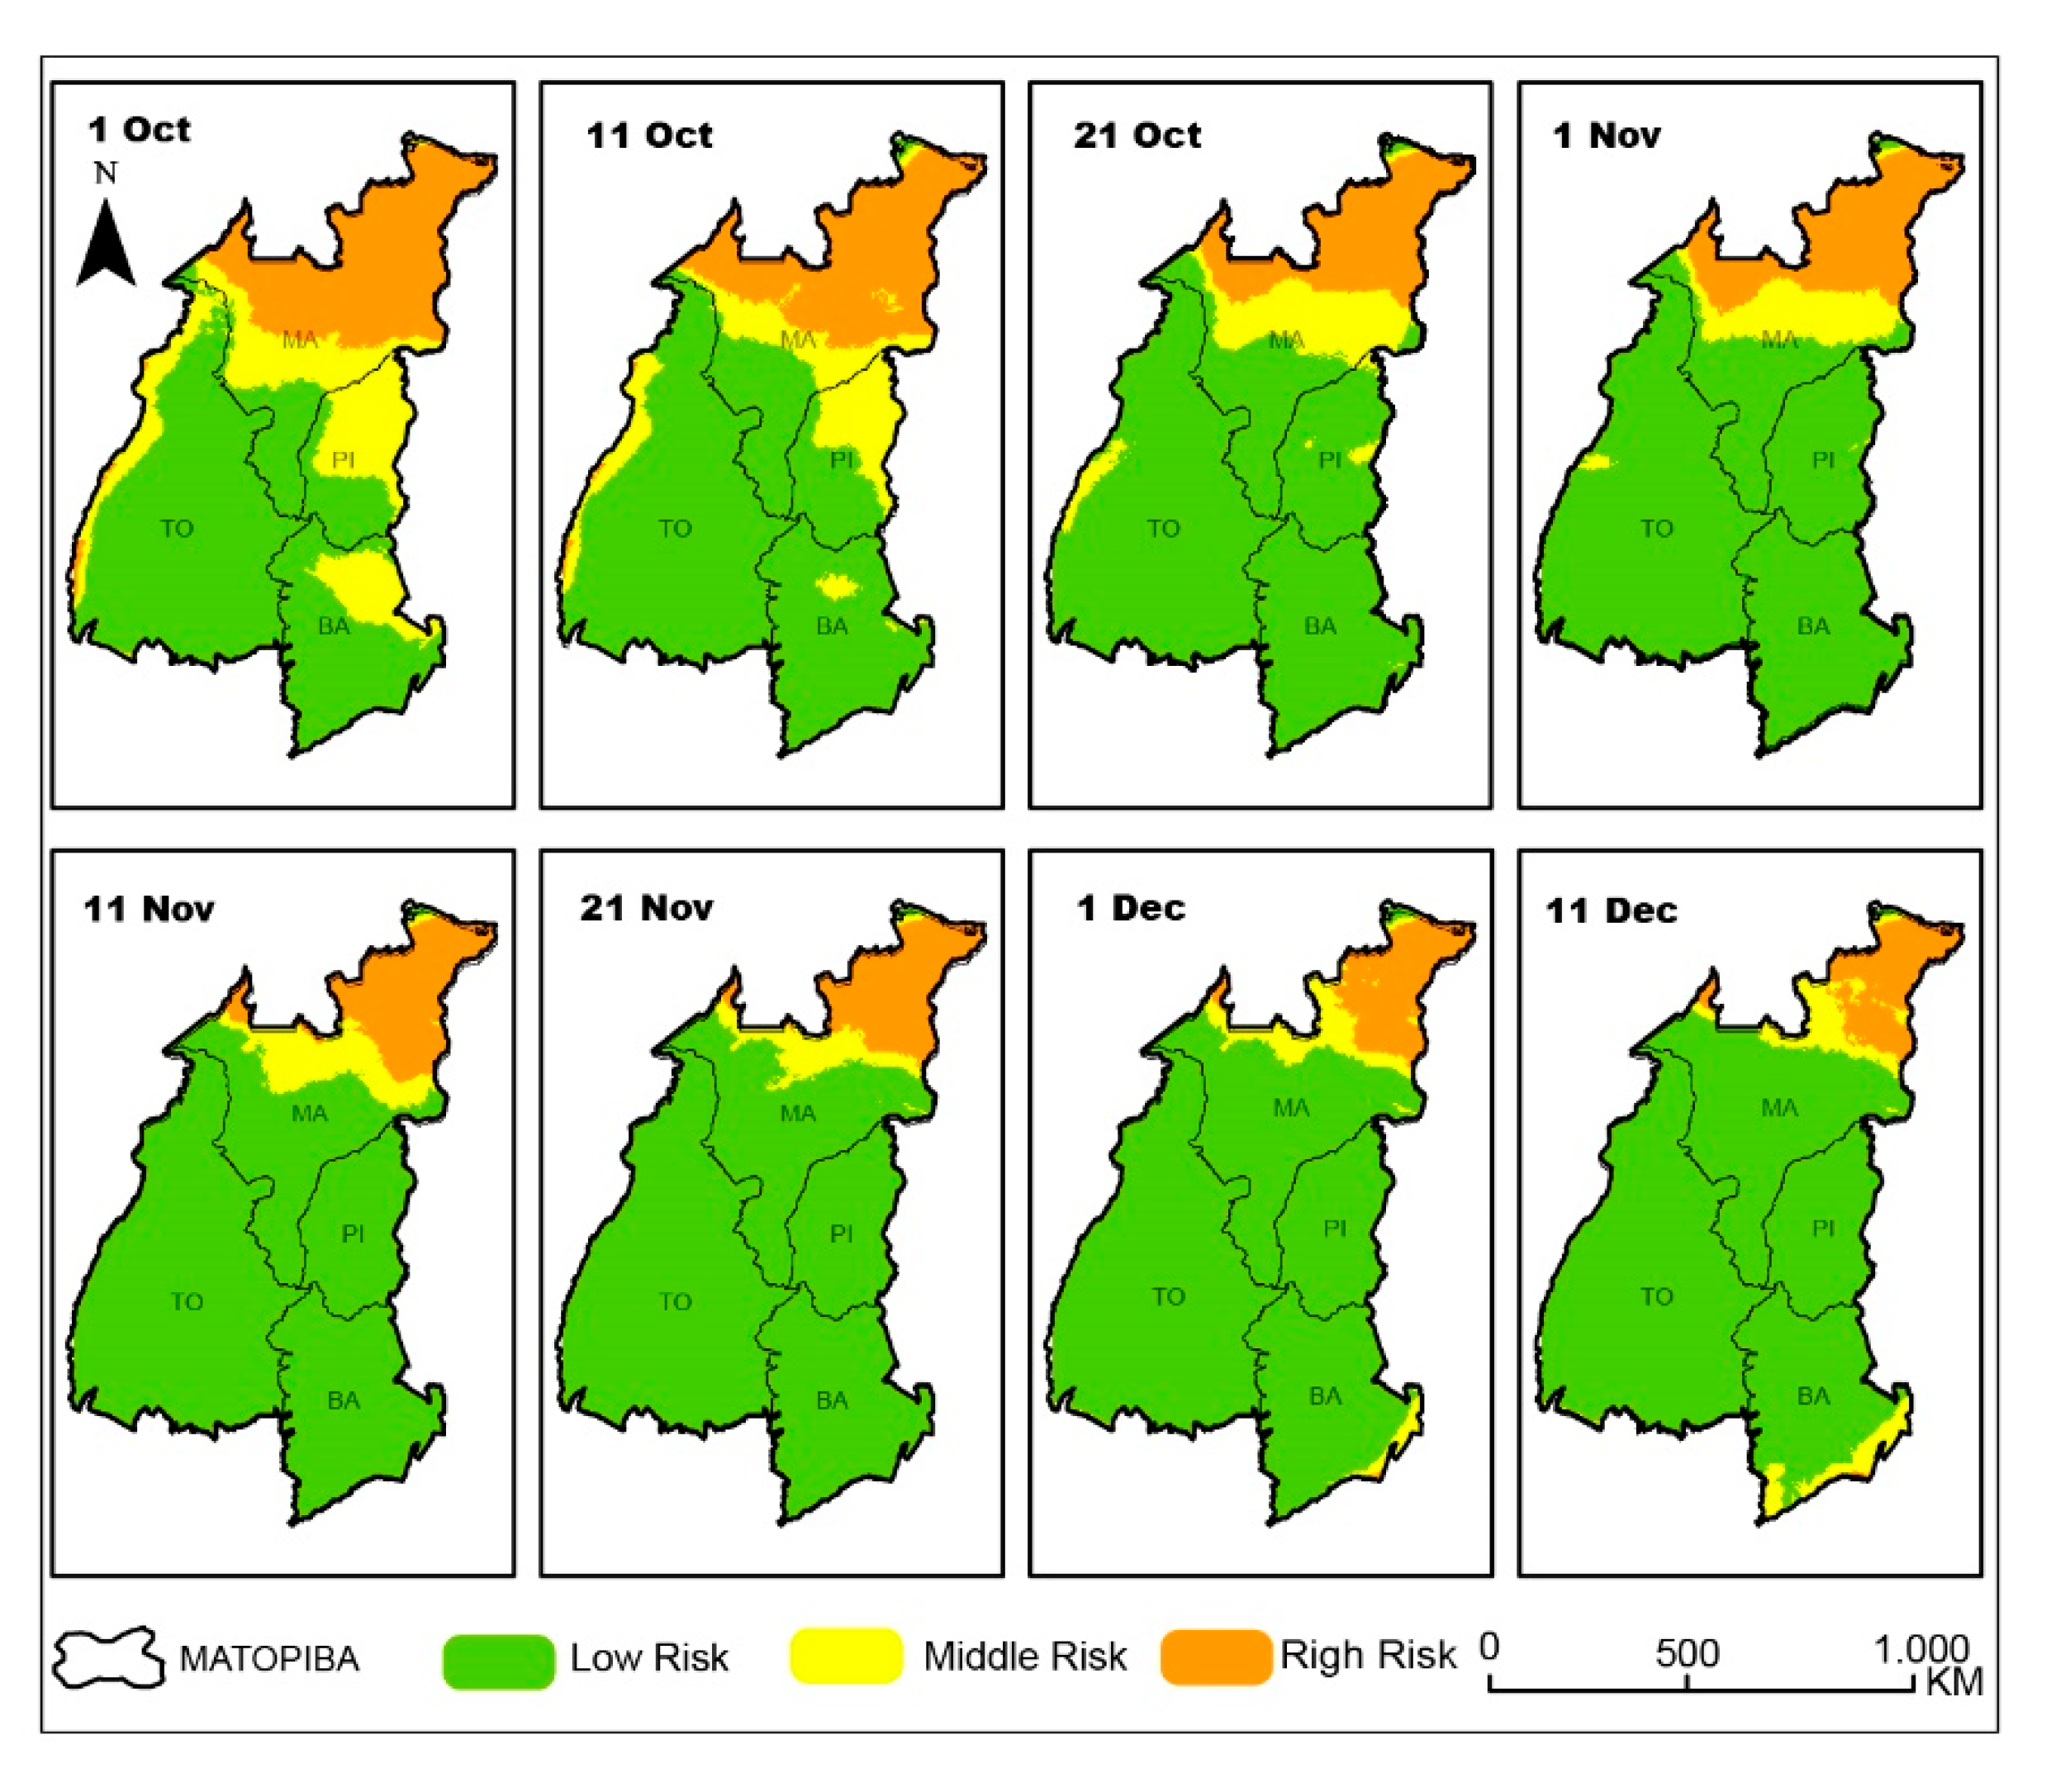
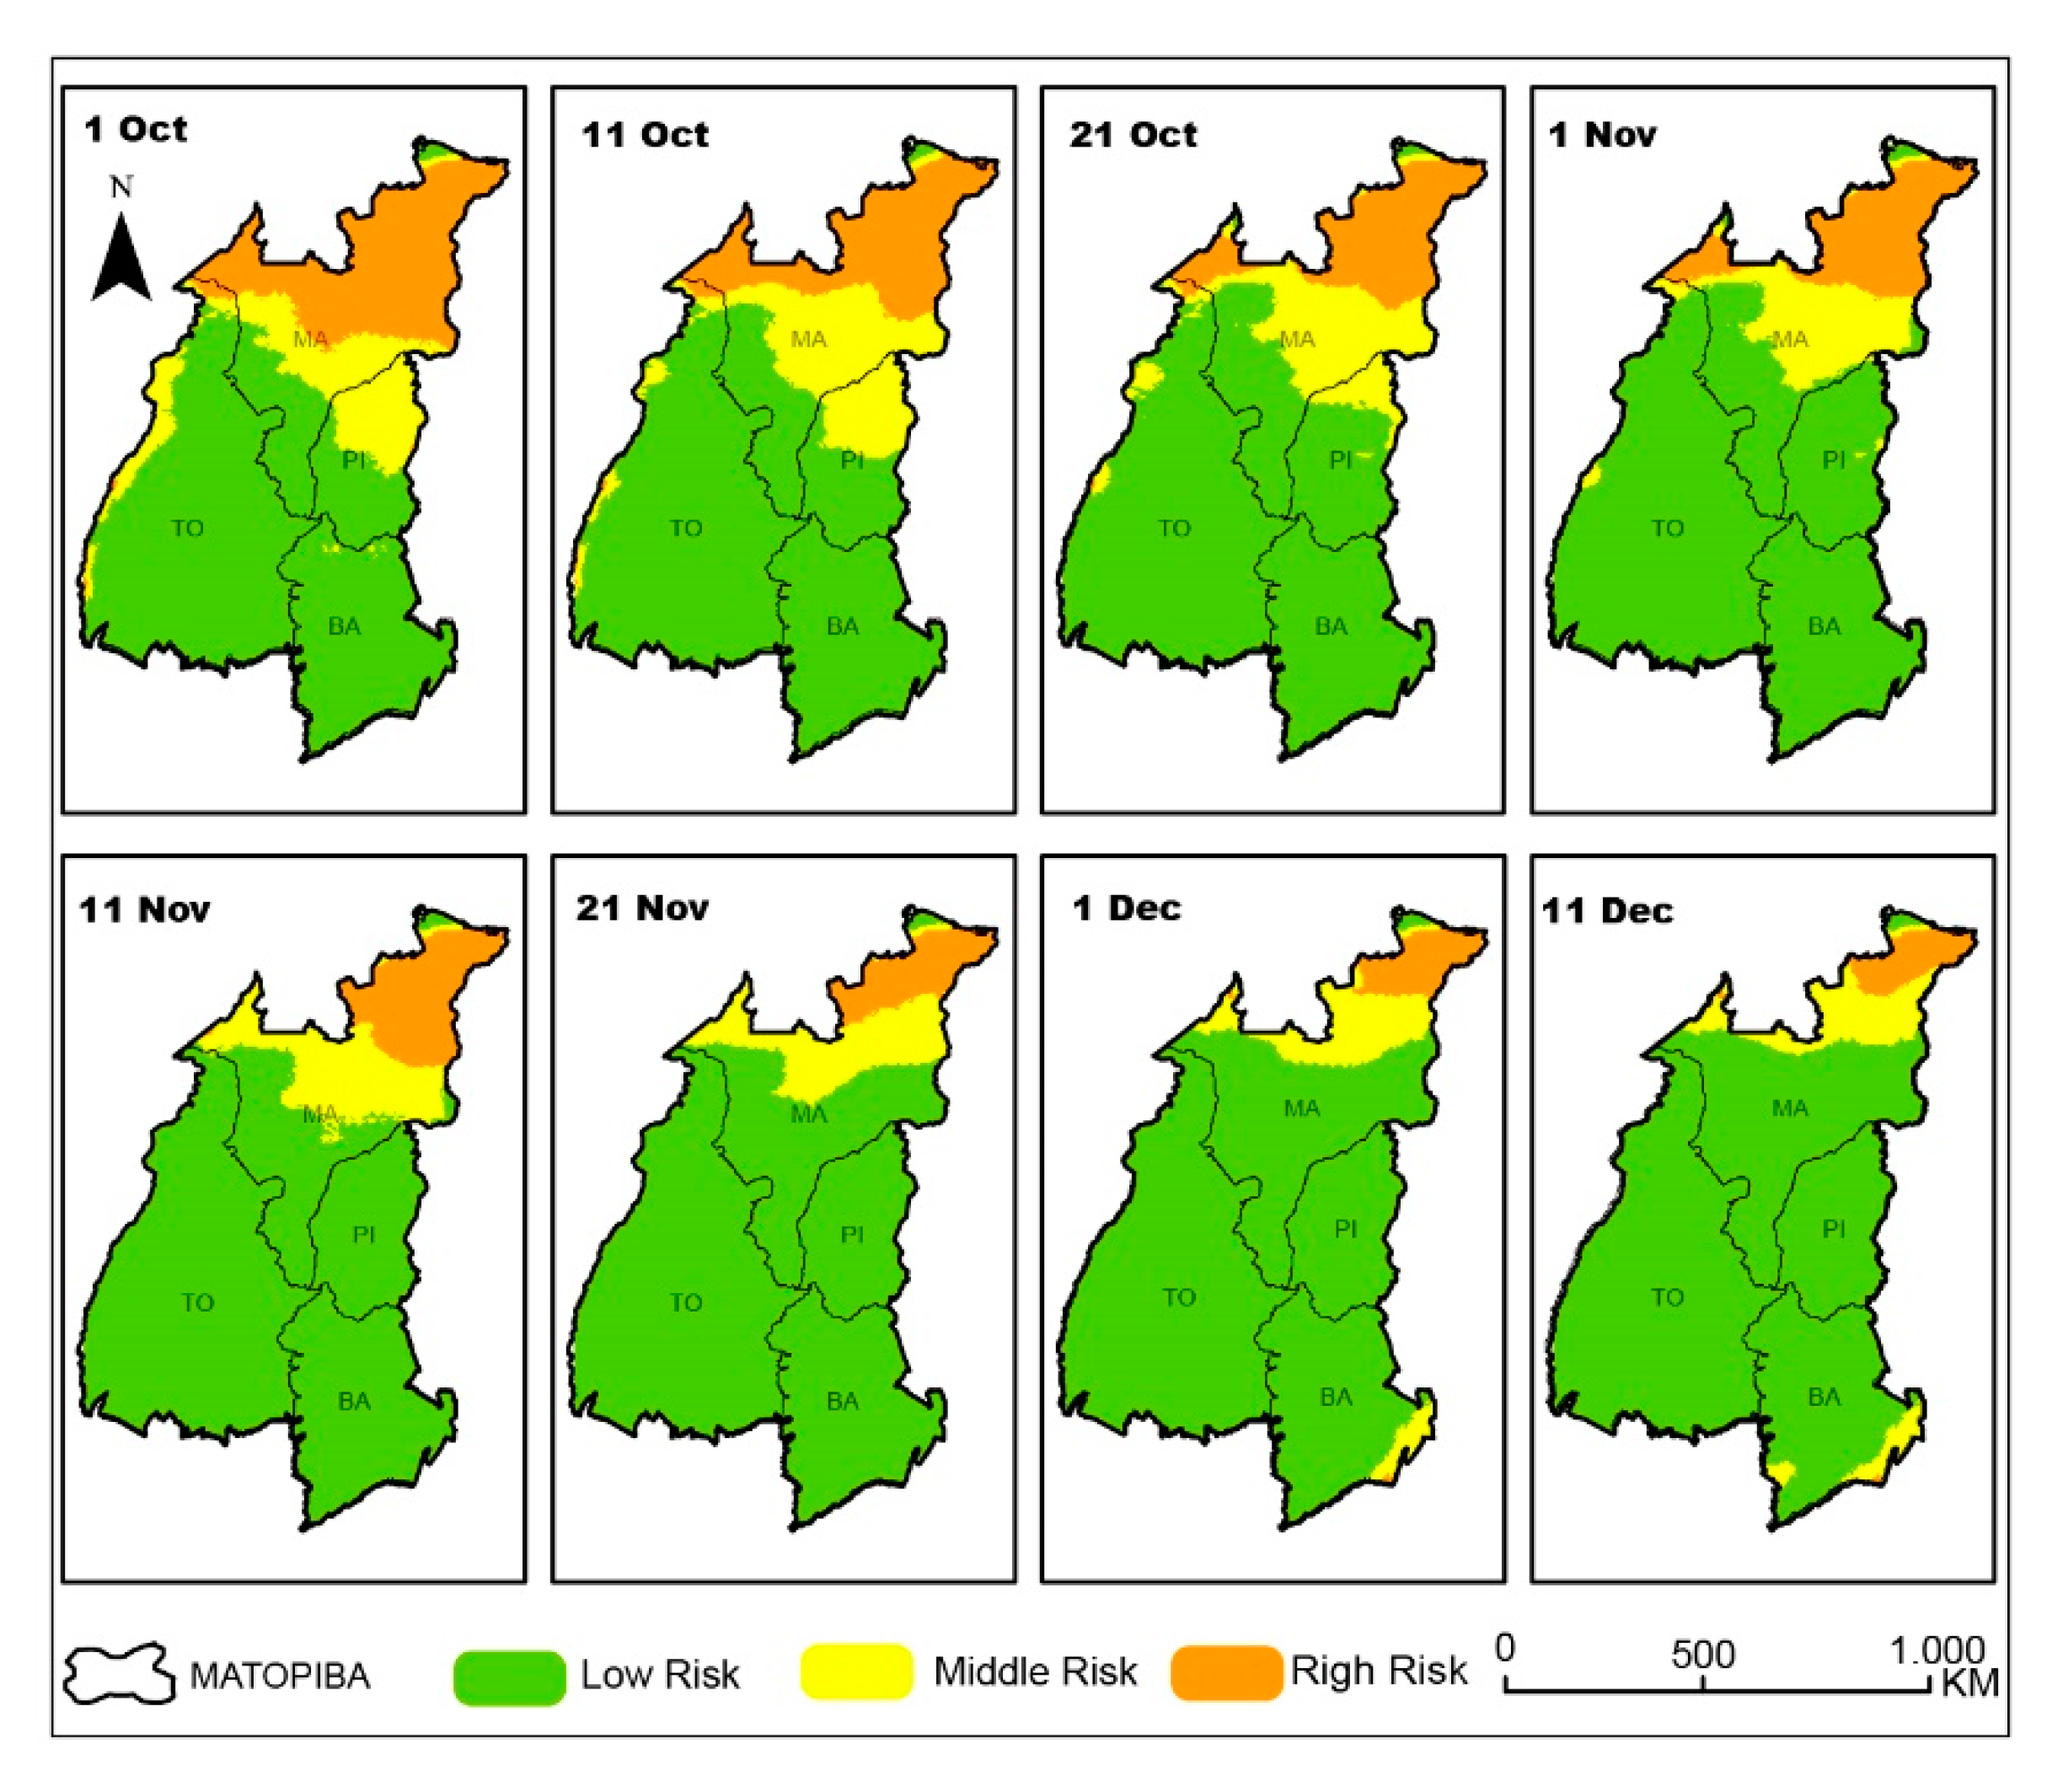
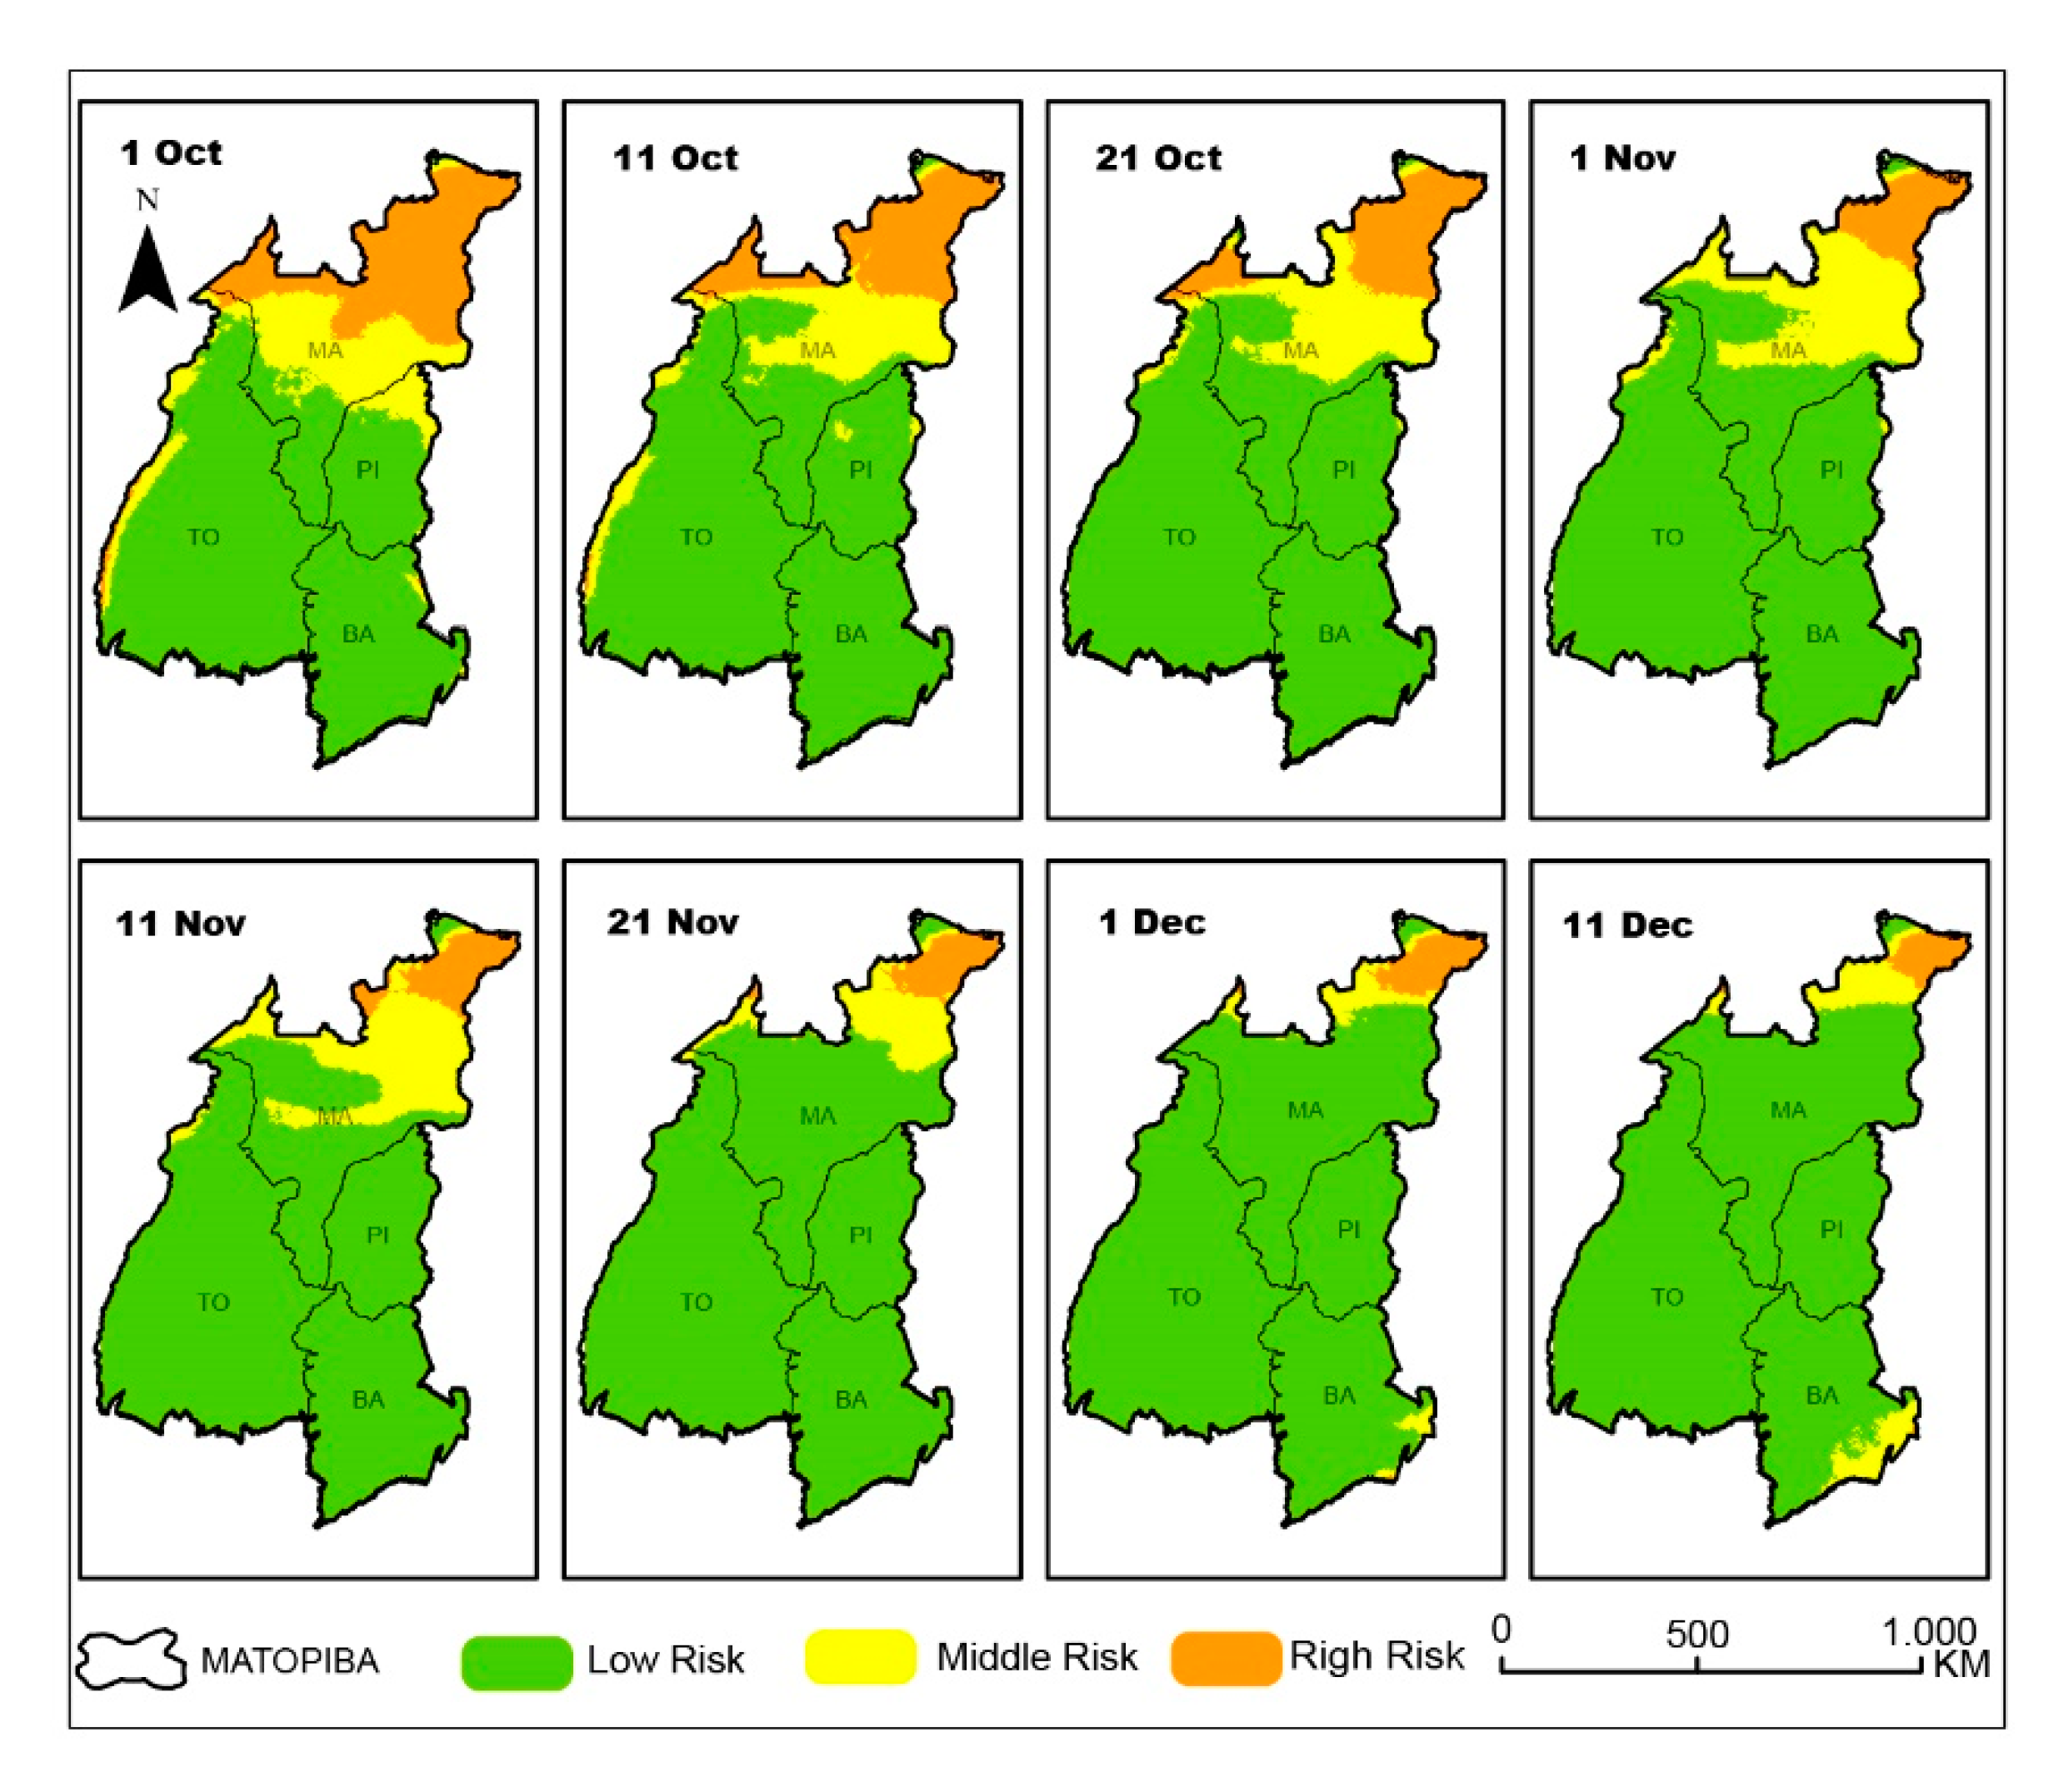
3.4. Soybean Agroclimatic Risk in the MATOPIBA Region
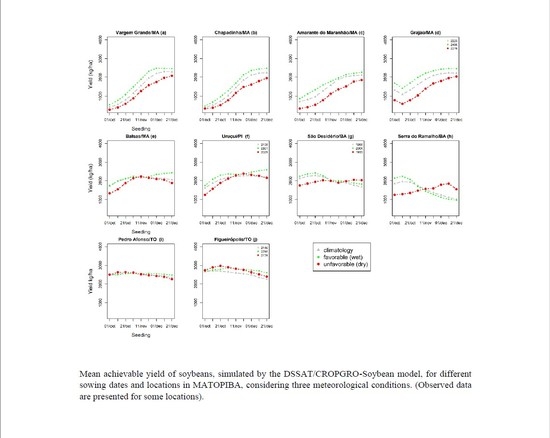
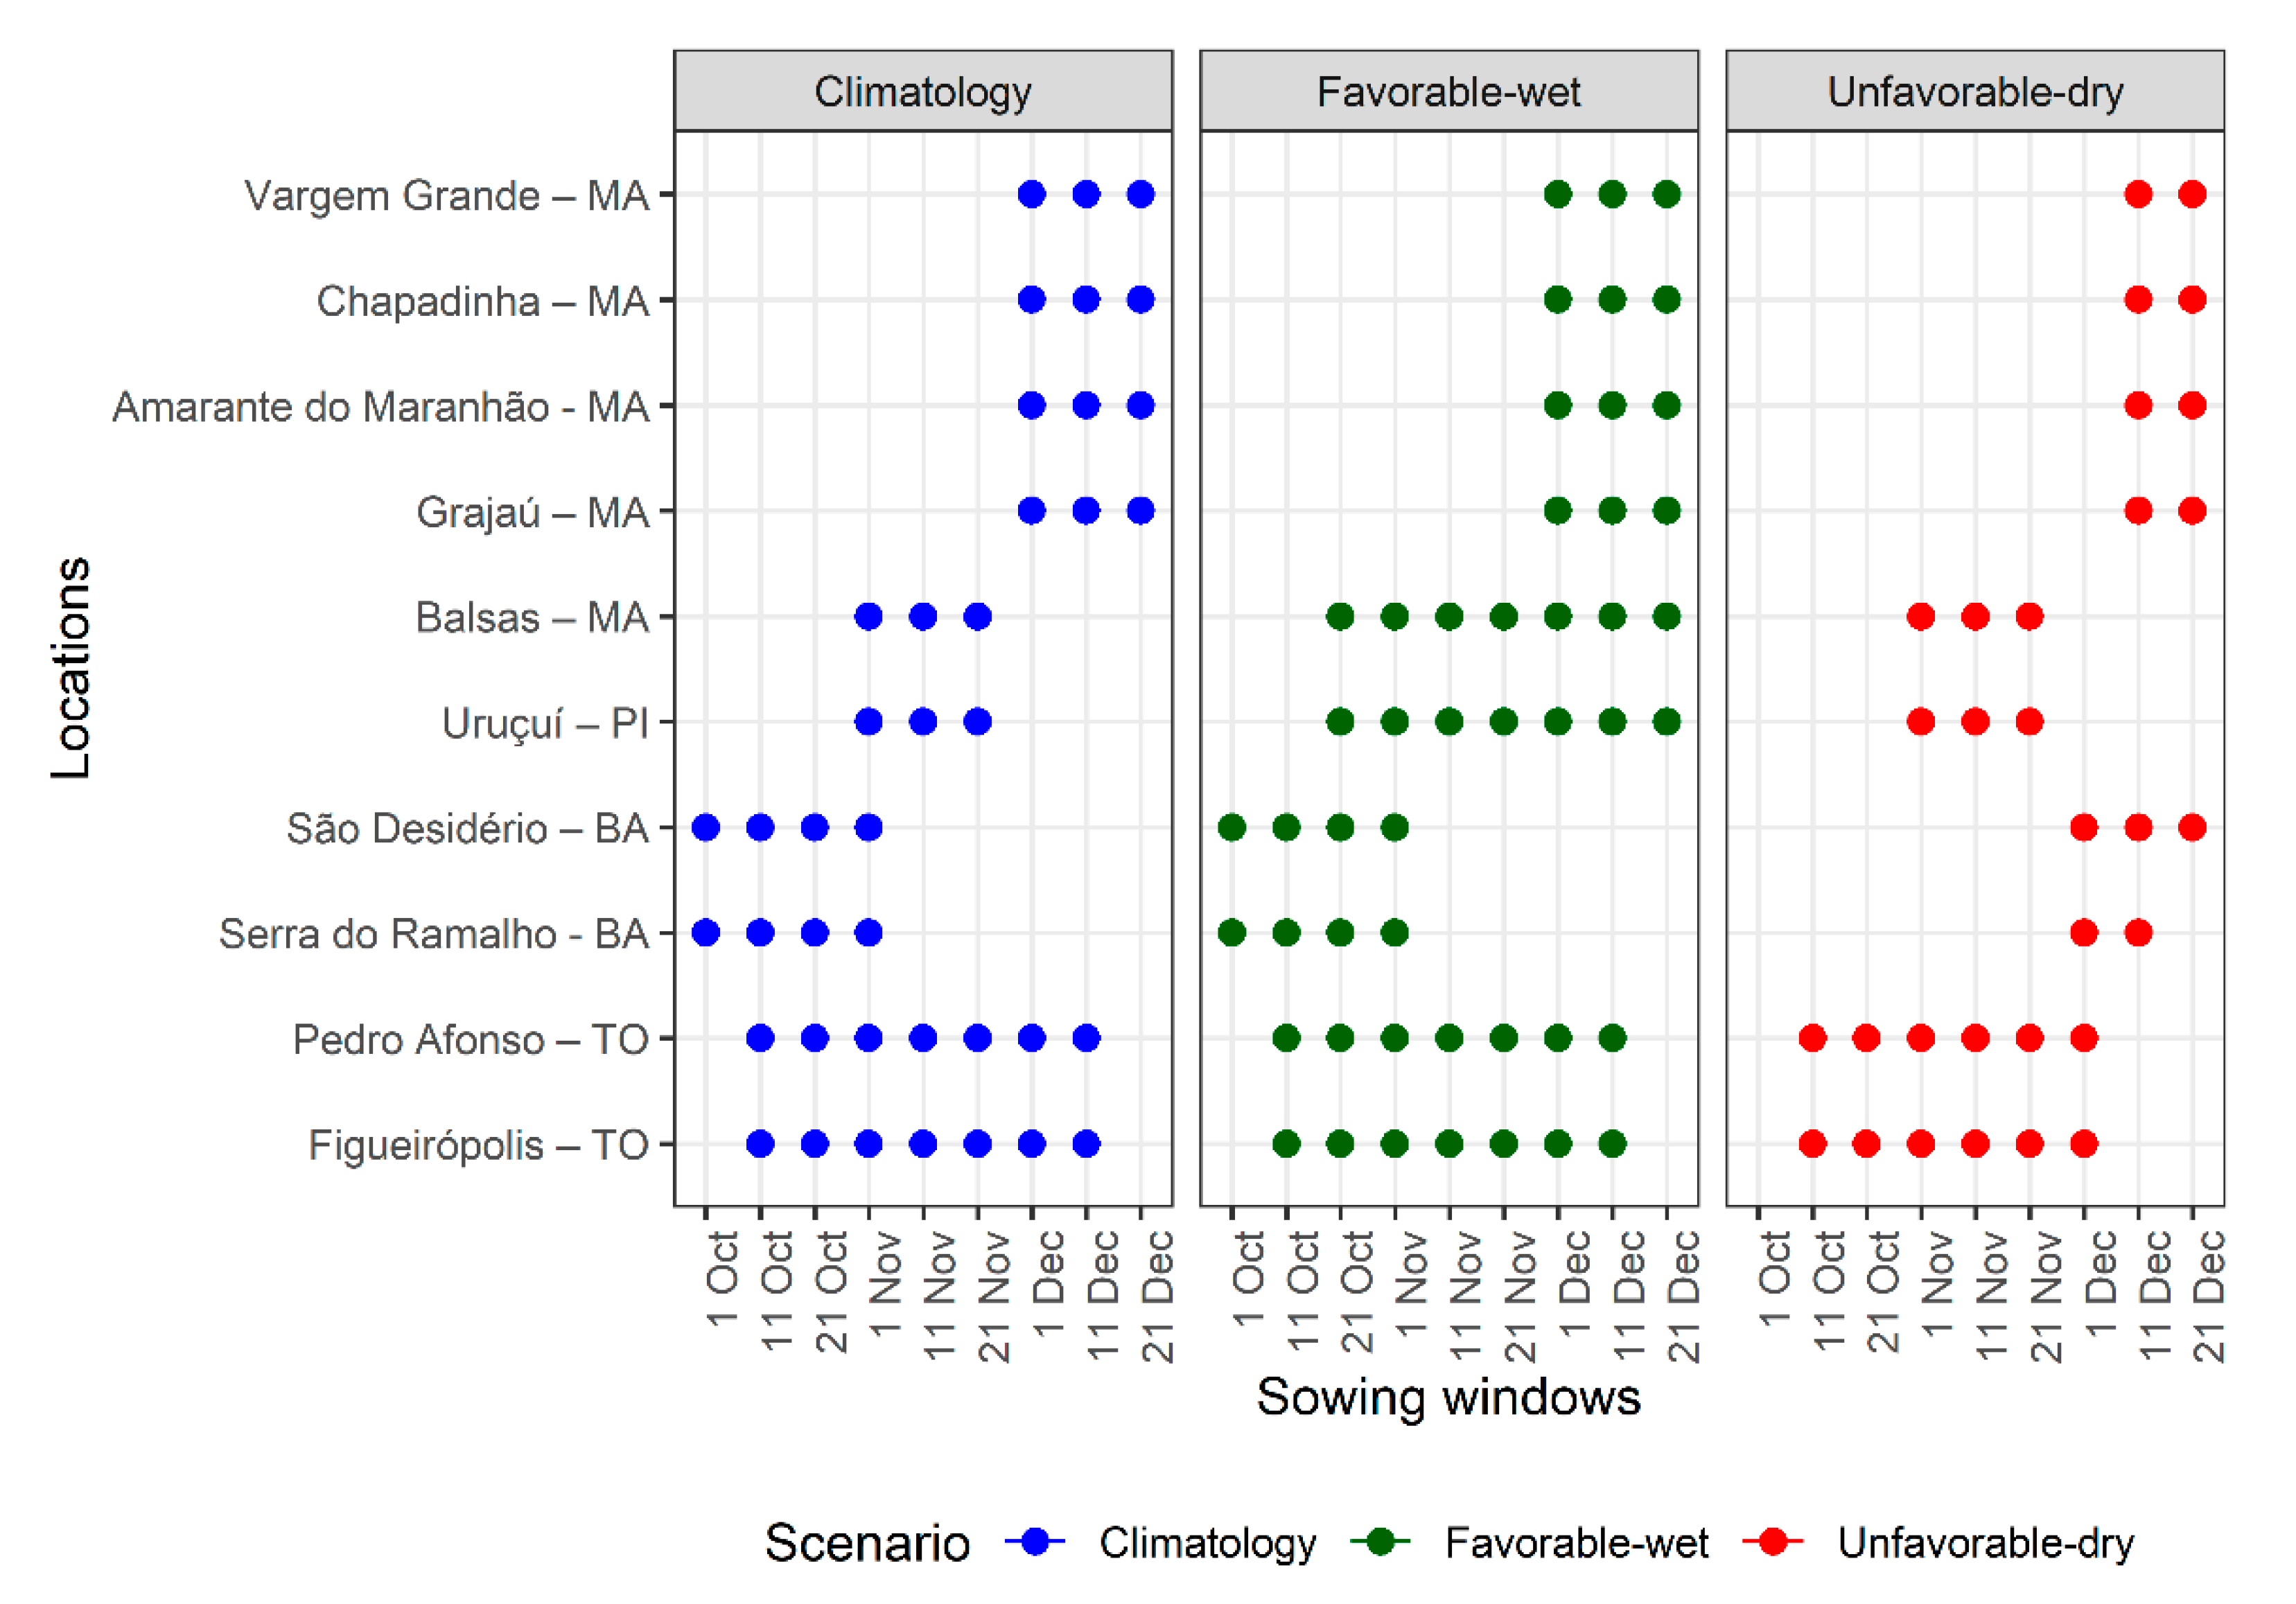
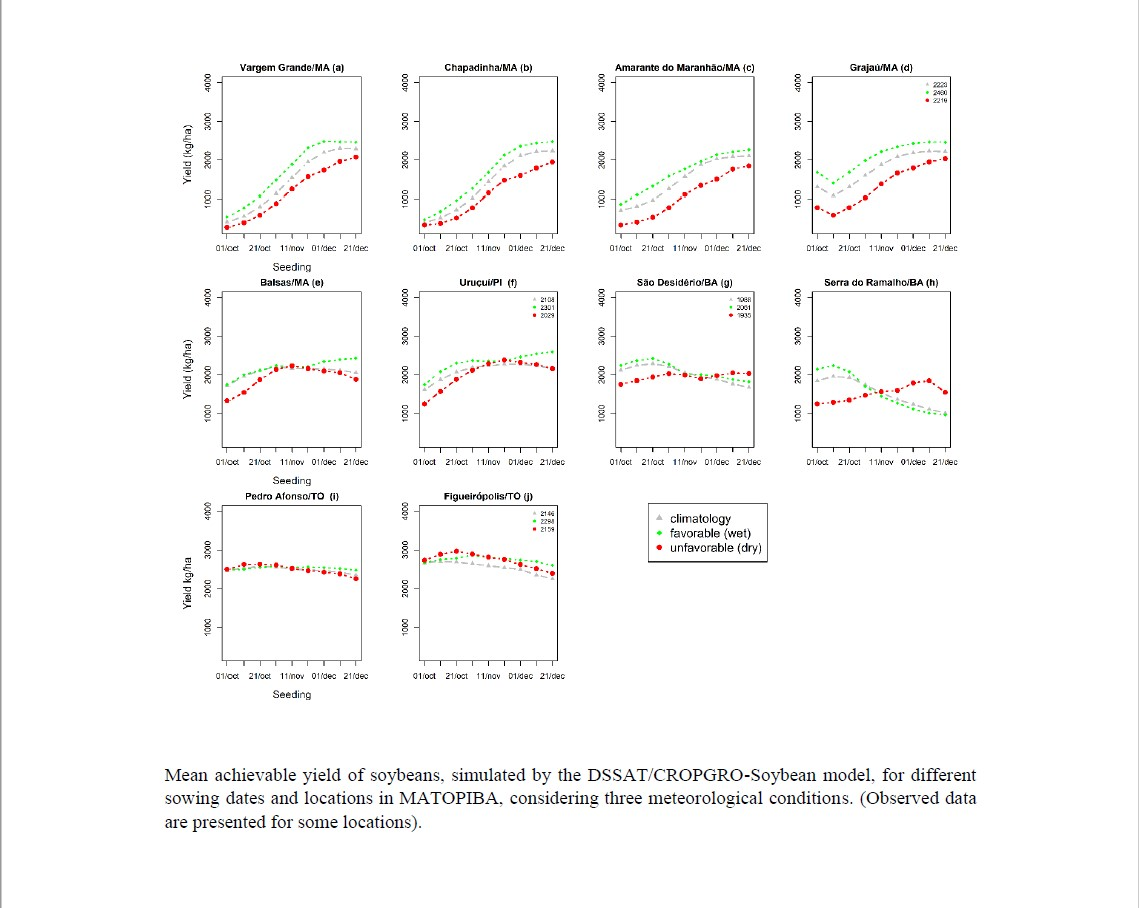
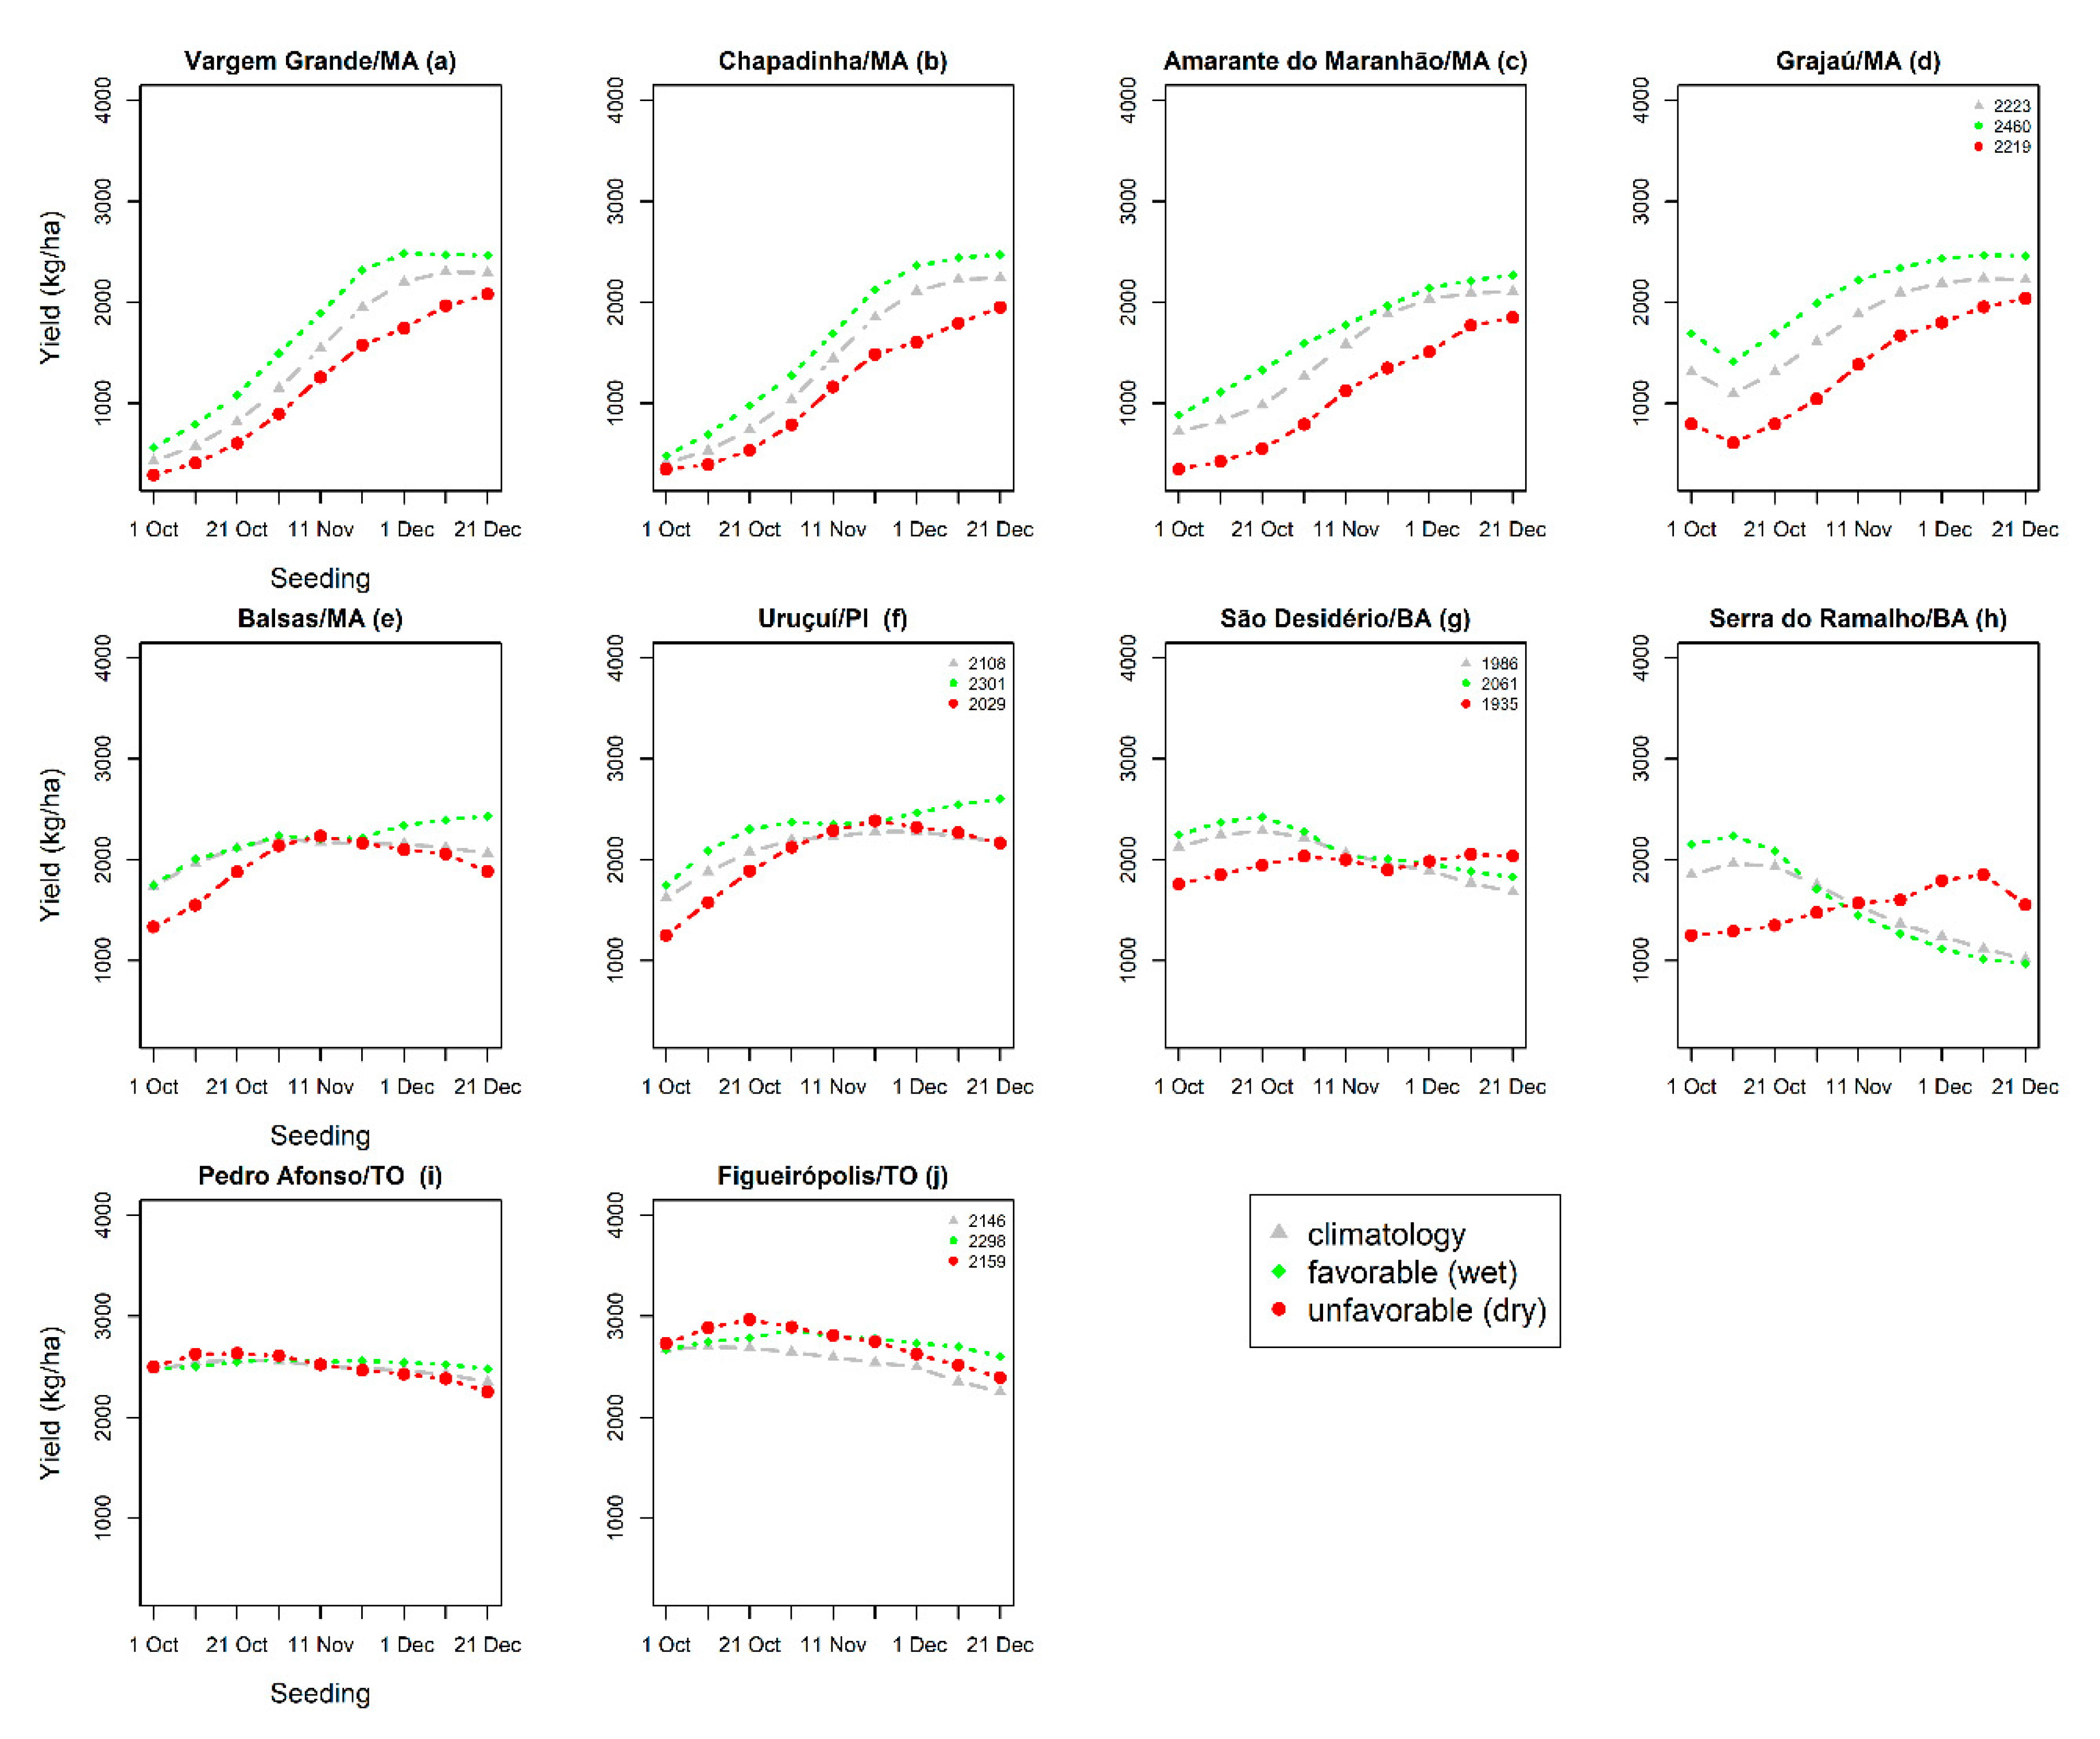
Figure 4 shows the regionalization of risks for soybean cultivation in MATOPIBA considering the WRSI values estimated for the crop years of the climatology scenario. The extreme north of MATOPIBA, near the coastal zone of the Maranhão state, is unfavorable to soybean cultivation regardless of the sowing date. However, the unsuitable area is reduced if sowing starts in December.
Intermediary risk areas also vary according to the date of sowing. These areas occur predominantly in the central-eastern part of MATOPIBA, encompassing the central-southern part of Maranhão state, the southwestern part of Piauí state, and the extreme western part of Tocantins state. These areas occupy larger portions of the territory when sowing is carried out during the month of October. Areas of intermediary risk are also identified when sowing is done late (during the month of December) in the southernmost part of the MATOPIBA region (southwest of Bahia state).
The areas favorable to soybean cultivation are predominant in the entire MATOPIBA region, regardless of the date of sowing. However, sowing from November 21 to early December ensures a more spatially homogeneous crop throughout the MATOPIBA region.
Figure 5 shows the characterization of agroclimatic risk under favorable conditions (wet). It was observed, in comparison with the climatological scenario, that the areas classified as unfavorable and intermediary risks are reduced, which implies a lower risk of yield loss due to the occurrence of water deficit. In this scenario, favorable areas did not change in relation to the climatology scenario for the sowing dates between mid-November and early December.
Similar to the climatology scenario, the medium- and high-risk areas were concentrated in the north of the region, regardless of the date of sowing, and in the southernmost portion of MATOPIBA when sowing is done late (December). It is worth noting that the unfavorable areas to the north reduce in extension in later sowing dates.
For the unfavorable scenario (Figure 6), one can observe that there is an expansion of both medium- and high-risk areas in relation to the climatology scenario, especially for the sowing carried out in October. It is also noted that regardless of the sowing dates, unfavorable areas to soybean cultivation increase in the northernmost part of the MATOPIBA region in relation to the other scenarios. On the other hand, most of the central-southern portion of the MATOPIBA region remains suitable for soybean cultivation regardless of the date of sowing, except for the southernmost part, which presented restrictions for sowing carried out in December. Nonetheless, the same restrictions were observed in the other scenarios for this particular portion of the study area during December sowing dates.

3.5. Soybean Yield

In general, results show that the mean achievable yields of simulated soybean during 33 cultivation seasons in nine sowing dates for the 10 locations distributed in the MATOPIBA region were similarly affected in the three analyzed meteorological conditions, presenting higher mean values in the favorable (wet) scenario and lower ones in the unfavorable (dry) scenarios (Figure 7). Considering the yield behavior in the nine sowing windows, four distinct patterns were observed among locations. The first encompasses the municipalities of Vargem Grande, Chapadinha, Amarante do Maranhão, and Grajaú, located in the state of Maranhão in the northern portion of the MATOPIBA region; the second comprises the municipalities of Balsas (MA) and Uruçuí (PI) covering the central-eastern part of MATOPIBA; the third encompasses areas of the municipalities of São Desidério and Serra do Ramalho, both in Bahia comprising the southeastern portion of the MATOPIBA region; and the fourth encompasses locations in the Pedro Afonso and Figueirópolis municipalities, both located in the state of Tocantins, comprising the central-western part of MATOPIBA. Among these groups, we noted that the highest yields were retrieved in the central-western portion of the MATOPIBA region, with an average of approximately 2800 kg ha−1, mainly for sowing carried out in late October and mid-November. Meanwhile, the lowest averages were retrieved in the northern part of the region, with mean values of approximately 1500 kg ha−1.
When the influence of the large-scale atmospheric–oceanic mechanisms of the Pacific and Atlantic are combined, one can note that the northern portion of the MATOPIBA (Figure 7a–d) can be considered the most impacted region among the analyzed locations. The vulnerability of this area is evidenced by the remarkable yield losses for all sowing dates in the unfavorable scenario while the favorable scenario resulted in significantly larger yields. The maximum amount of soybean produced was obtained with the sowings carried out at the beginning and middle of December in the three climatic scenarios, with accentuated losses during the unfavorable scenario, with decreasing production rates of approximately 600 kg ha−1.
In relation to the central-eastern region of the MATOPIBA (Figure 7e,f), we can observe that higher yield values are reached when soybeans are sown during the month of November, both in the climatology and the dry scenarios. However, in the dry scenario, the sowing window is shorter. Alternatively, in the wet scenario, in addition to the increase in the number of soybeans produced (sown in November and December), we can also observe a larger favorable sowing window. In the southeast region of MATOPIBA (Figure 7g,h) the best sowing dates were during the months of October and November in the climatology and the wet scenarios. On the other hand, in dry years, the highest soybean yield values were obtained when sowing was carried out in December. In other words, during unfavorable years, the delay of sowing until December will cause gains in yield that may exceed 400 kg ha−1. Regarding the mid-western portion of MATOPIBA (Figure 7i,j), results indicated that the effects of combined large-scale mechanisms on soybean yield are not clearly perceived. In this region, the best sowing window is large (October to December), with low variability of soybean yield in the nine sowing dates.
Regarding the analysis of water deficit conditions during the period of pod-filling for the different sowing dates of the 10 locations in MATOPIBA (Figure 8), it was observed that the water deficit patterns have a similar behavior if compared to the achievable yield.
Overall, water availability changes according to the analyzed meteorological conditions, with lower values during the dry scenario and higher values during the wet scenario. However, in the southeast portion of the region, represented by the locations of São Desidério (BA) and Serra do Ramalho (BA) (Figure 8g,h), there was an increase in water availability during the sowing carried out in mid-December in the unfavorable scenario. Furthermore, it was observed that in the western portion of the region (Pedro Afonso—TO and Figeirópolis—TO) there were no variations in WRSI values considering the three scenarios. In addition, the high WRSI values were observed in all analyzed sowing windows in these locations. These results indicate a direct relationship between water deficit and achievable yield, i.e., the low yield is a result of the reduction of water availability during the pod-filling period of soybeans. This relationship highlights the importance of adjusting the sowing date to the current meteorological scenario in order to optimize production according to the water deficit pattern in the region.
Figure 7 also shows that the simulated yields agree with the observed values (mean of the 33 crop years) in the locations taken into consideration. However, in order to further validate this statement, the model’s performance was statistically evaluated through the estimation of three statistical measures. Table 6 presents the results of these tests, considering the estimated soybean yield for the agricultural years 1980/81 to 2012/13, in four locations of the MATOPIBA region. The yield observed in the climatology scenario varied from 1986 kg ha−1 to 2223 kg ha−1 in all locations, in the wet scenario it varied from 2061 kg ha−1 to 2460 kg ha−1, and in the dry scenario, it ranged from 1935 kg ha−1 to 2219 kg ha−1.
The model adequately simulated achievable yield in all locations and under all meteorological conditions, with a correlation coefficient higher than 0.90 in the wet scenario, and varying from 0.78 to 0.81 (climatology) and 0.84 to 0.98 (dry) in the other scenarios. The bias values ranged from −21 kg ha−1 (Grajaú—MA) to 152 kg ha−1 (Figueirópolis—TO) in the climatology scenario. In the wet scenario, bias values varied from –113 kg ha−1 to 140 kg ha−1, in the locations Grajaú—MA and São Desidério—BA, respectively. In the dry scenario, the bias ranged from −161 kg ha−1 (São Desidério—BA) to 153 kg ha−1 (Grajaú—MA). Regarding the RMSE, the São Desidério—BA location presented the lowest value, of 57.6 kg ha−1 in the wet scenario, while Uruçuí—PI presented the highest RMSE in the climatology scenario, of 310.5 kg ha−1.

4. Discussion

The results obtained in this study show that large-scale atmospheric–oceanic mechanisms in the Pacific and Atlantic oceans play a fundamental role in the alternation between dry and wet years over the MATOPIBA region, as well as in the spatial coverage of drought, which is in agreement with recent analyses [105]. The higher rainfall rates observed in the favorable (wet) years are mainly related to a better distribution of rains in the course of the wet season and not to the occurrence of excess rainfall in a few months (January and February). The maximum values observed in these months during dry years are possibly associated with extreme rainfall events in Northeast Brazil and in the Cerrado areas, which have been documented in recent studies [106,107].
The results of the trend analysis point out that the soybean sowing seasons in the MATOPIBA region, from the 1980s on, are increasingly exposed to higher temperatures, with a sharp increase in exposure to climate risk, consistent with the analyses performed in references [23,59,107,108,109] in areas with agricultural potential in Brazil. The increase in air temperature causes physiological damage to soybean plants, which is further accentuated by the occurrence of water deficits [23,54]. In addition, this increase shortens the crop cycle due to the faster accumulation of energy (growing degree-day—GDD) [110]. Regarding precipitation, the results corroborate the studies in references [107,111] which show no trends in precipitation rates in several regions of the North and Northeast of Brazil.
For much of the region, the exposure of soybeans to the risk caused by water deficit is minimized with the establishment of the wet season (late October to mid-November). These results are consistent with several studies [39,40,55,112,113,114,115] that demonstrated that the amount of rainfall is positively correlated with the WRSI, contributing to the reduction of yield loss due to the water deficit.
In the wet years, low-risk areas were more frequent in the central portion of the region, regardless of the sowing date. In addition, there was a decrease in high-risk areas in the northern portion of the region for sowings taking place in the month of November. This situation is associated with the increase in the total volume of rainfall in the region as identified in previous studies [26,69,70,71], which show that rainfall in most of Northeast Brazil is modulated by the combination of the effects of ocean–atmosphere interaction mechanisms in the Pacific and Atlantic oceans. In contrast, in dry years, there was an increase in areas with high-risk patterns, mainly in the northern portion of the region, corroborating the references [116,117] which verified significant correlation patterns between the hot phase of the ENSO and the seasonal rainfall regime in South America, particularly in the northern portion of Northeast Brazil.
Considering the achievable yield of soybean crops, the simulated results showed a certain homogeneity in the region, basically due to climatic conditions, with a regular distribution of rainfall during the sowing season (October to April), typical of the “Aw” climate type according to the Köppen classification [5]. Based on the two contrasting climatic scenarios (wet and dry), it could be noted that the region faces yield losses in dry years and yield increases in wet years, which is more clearly observed in the locations in the northern portion of the region, which in turn is consistent with the results of the agroclimatic risk delimitation. In addition, it was found that yield varied according to water deficit conditions during the flowering/pod-filling phase in the 10 analyzed locations, corroborating the studies in references [47,62,118].
In the central-eastern region of MATOPIBA, more precisely in the Balsas (MA) and Uruçuí (PI) locations, there is an increase in soybean yield during favorable (wet) conditions, with a larger best sowing window. Alternatively, in the dry years, there is a shortening of this window, agreeing with the study in reference [44]. It should be noted that the reduction in soybean yield during unfavorable weather conditions may be aggravated by the reduction in rainfall rates and by the increase in air temperature [16,119,120]. The severity of droughts is more pronounced when the hot phase of the ENSO is associated with the occurrence of negative SST anomalies in the South Atlantic—dry scenario [26,28,120,121]. Meteorological droughts can be devastating for soybean cultivation, being amplified by the combination of low rainfall and warmer temperatures, damaging the physiology of the plants [23,99,122,123], and impacting soil moisture due to the increase in crop evapotranspiration [124].
Although results are more positive for the wet years, some exceptions were clearly observed in the southeastern part of the region (São Desidério/BA and Serra do Ramalho/BA), when positive effects on yield were identified during unfavorable (dry) years. This result highlights the importance of adjusting the sowing date in order to optimize the success of yield by choosing the period with the highest water availability for the development of the crop [12,114,118,125].
Results are less conclusive for the central-western portion of the region (Pedro Afonso/TO and Figueirópolis/TO), where all analyzed sowing dates provide positive results for soybean yield in all three weather conditions. This indicates that large-scale climate variability does not necessarily lead to negative anomalies in the meteorological conditions over this region and, consequently, does not compromise final soybean yield. It was possible to observe that the ideal condition for the success of yield in this region is related to the availability of rainfall, demonstrated by its regular distribution during the period of soybean cultivation, from October to April [5], and confirmed by the results of water availability in these locations. Favorable climatic conditions minimize the effects of limiting factors for soybean cultivation, optimizing the development of the crop by improving its vegetative and productive capacity [126,127].
Regarding the performance of the model, results were similar or better than those obtained in other studies, such as references [67,68,128], in which RMSE values of 226 to 650 kg ha−1, 201 to 413 kg ha−1, and 548 kg ha−1, respectively, were found.

5. Conclusions

The DSSAT/CROPGRO-Soybean model showed a good predictive capacity, confirmed by the statistical parameters, indicating high applicability for the environmental conditions of MATOPIBA. The approach used in this study showed that the effects of climate variability and the interactions between different sowing dates and genotype–environment characteristics of the analyzed region can result in different levels of yield, as well as regional patterns of agroclimatic risk, depending on the probability of occurrence of water deficit in the flowering/pod-filling phase.
The trends of yield associated with large-scale atmospheric–oceanic mechanisms varied according to the sowing dates and locations, since the choice of the best sowing period may minimize the effects of climate variability. In addition, strong evidence was found regarding the reduction of yield as a function of the intensity of the water deficit. In relation to the sowing dates, it was verified that in most of the region, yield gains are more substantial for the sowings carried out from the month of November to the beginning of December.
In general, during the wet years, there was a clear tendency for an increase in the average values of achievable yield. In the dry scenario, these values were lower. Among the analyzed areas, the northern region of MATOPIBA was the most affected, registering positive and negative impacts (wet and dry scenarios, respectively) in all the analyzed dates. In the central-eastern and southeastern portions of the MATOPIBA region, the effects of climate variability were clear and directly related to the choice of the sowing window, with a shortening and a delay of the best window considering the dry scenario. Furthermore, it was found that the delay of the best sowing window in the southeast region increases the yield values in relation to other meteorological conditions, i.e., when choosing the best sowing period, the potentially negative anomalies produced by the dry scenario conditions may generate positive effects in soybean yield in this area. In the central-eastern portion of the MATOPIBA region, the effects of the analyzed weather conditions were barely noticeable, since variations in the yield behavior were small in all the sowing windows.
These results are unprecedented as they are the first to address the influence of large-scale mechanisms in the Pacific and the Atlantic oceans on the achievable yield of soybeans in an area of great agricultural potential, currently considered the main frontier for new investments in large-scale agriculture in Brazil. In general, most farmers in the MATOPIBA region sow at the onset of the wet period (mid-October to November) in order to try to minimize the effects of climate variability on productivity. However, our results show that these effects, particularly in the unfavorable-dry scenario, may be minimized by selecting the best sowing window (mid-December). Furthermore, no negative impacts on productivity were observed in some locations, regardless of the climate variability scenario. Thus, the study provides relevant information that can support and guide agribusiness agents (producers, researchers, credit institutions, policy makers) in making decisions for the better planning of their activities; in adopting strategic actions that take into account climate conditions, especially the occurrence of rainfall; and finding the best sowing window and location as a way to improve crop management for successful yield.
In Figure 9, we present the best sowing windows for soybean considering the three analyzed meteorological conditions in the different MATOPIBA locations.

Author Contributions

Conceptualization, L.R., C.M.S.eS., B.B. and M.H.S.; Data curation, P.S. and T.M.; Formal analysis, L.R., C.M.S.eS., M.H.S., P.S., D.R. and L.A.; Investigation, L.R., C.M.S.eS., B.B., M.H.S. and D.R.; Methodology, L.R., C.M.S.eS., B.B., M.H.S. and D.R.; Project administration, C.M.S.eS., B.B., M.H.S. and L.A.; Software, L.R., P.S. and T.M.; Supervision, B.B., M.H.S. and L.A.; Validation, L.R., C.M.S.eS., B.B. and D.R.; Visualization, C.M.S.eS. and P.M.; Writing—original draft, P.M. and R.F.; Writing—review & editing, P.M. and R.F. All authors have read and agreed to the published version of the manuscript.

Funding

This research received no external funding.

Acknowledgments

To the National Council for Scientific and Technological Development (CNPq) for the research yield grant of the second author (Processes no 303802/2017-0).

Conflicts of Interest

The authors declare no conflict of interest. The funders had no role in the design of the study; in the collection, analyses, or interpretation of data; in the writing of the manuscript; or in the decision to publish the results.

References

  1. Mercau, J.L.; Dardanelli, J.L.; Collino, D.J.; Adriani, J.M.; Irogoyen, A.; Satorre, E.H. Predicting on–farm soybean yields in the pampas using CROPGRO–soybean. Field Crops Res. 2007, 100, 200–209. [Google Scholar] [CrossRef]
  2. Taherzadeh, O.; Caro, D. Drivers of water and land use embodied in international soybean trade. J. Clean. Prod. 2019, 223, 83–93. [Google Scholar] [CrossRef]
  3. Rizzo, G.; Baroni, L. Soy, soy Foods and Their Role in Vegetarian Diets. Nutrients 2018, 10, 43. [Google Scholar] [CrossRef] [PubMed] [Green Version]
  4. St–Marseille, A.F.G.; Bourgeois, G.; Brodeur, J.; Mimee, B. Simulating the impacts of climate change on soybean cyst nemoted and distribution of soybean. Agric. For. Meteorol. 2019, 264, 178–187. [Google Scholar] [CrossRef]
  5. Alvares, C.A.; Stape, J.L.; Sentelhas, P.C.; de Moraes, G.; Leonardo, J.; Sparovek, G. Köppens climate classification map for Brazil. Meteorol. Z. 2014, 22, 711–728. [Google Scholar] [CrossRef]
  6. Alliprandini, L.F.; Abatti, C.; Bertagnolli, P.F.; Cavassim, J.E.; Gabe, H.L.; Kurek, A.; Matsumoto, M.N.; Oliveira, M.A.R.; Pitol, C.; Prado, L.C.; et al. Understanding soybean maturity groups in Brazil: Environment, cultivar classification and stability. Crop Sci. 2009, 49, 801–808. [Google Scholar] [CrossRef]
  7. Conab—Companhia Nacional de Abastecimento. Acompanhamento da Safra Brasileira de Grãos, Safra 2018/19—Oitavo Levantamento. 2009; pp. 1–135. Available online: https://www.conab.gov.br/info–agro/safras/graos/boletim–da–safra–de–graos (accessed on 28 October 2019).
  8. Anderson, M.C.; Zolin, C.A.; Sentelhas, P.C.; Hain, C.R.; Semmens, K.; Yilmaz, M.T.; Gao, F.; Otkin, J.A.; Tetrault, R. The Evaporative Stress Index as an indicator of agricultural drought in Brazil: An assessment based on crop yield impacts. Remote Sens. Environ. 2016, 174, 82–99. [Google Scholar] [CrossRef]
  9. Spera, S.A.; Galford, G.L.; Coe, M.T.; Macedo, M.N.; Mustard, J.F. Land–use change affects water recycling in Brazil’s last agricultural frontier. Glob. Chang. Biol. 2016, 22, 3405–3413. [Google Scholar] [CrossRef]
  10. Araújo, M.L.S.; Sano, E.E.; Bolfe, É.L.; Santos, J.R.N.; Santos, J.L.; Silva, F.B. Spatiotemporal dynamics of soybean crop in the Matopiba region, Brazil (1990–2015). Land Use Policy 2019, 80, 57–67. [Google Scholar] [CrossRef]
  11. Bhatia, V.S.; Singh, P.; Wani, S.P.; Chauhan, G.S.; Kesava Rao, A.V.R.; Mishra, A.K.; Srinivas, K. Analysis of potential yields and yield gaps of rainfed soybean in India using CROPGRO–Soybean model. Agric. For. Meteorol. 2008, 148, 1252–1265. [Google Scholar] [CrossRef] [Green Version]
  12. Assad, E.D.; Marin, F.R.; Evangelista, S.R.; Pilau, F.G.; Farias, J.R.B.; Pinto, H.S.; Zullo Júnior, J. Sistema de previsão da safra de soja para o Brasil. Pesquisa Agropecuária Brasileira 2007, 42, 615–625. [Google Scholar] [CrossRef]
  13. Rodrigues, R.Á.; Pedrini, J.E.; Fraisse, C.W.; Fernandes, J.M.C.; Justino, F.B.; Heinemann, A.B.; Costa, L.C.; Vale, F.X.R. Utilization of the cropgro–soybean model to estimate yield loss caused by Asian rust in cultivars with different cycle. Bragantia 2012, 71, 308–317. [Google Scholar] [CrossRef]
  14. Pinto, H.S.; Assad, E.D. Aquecimento Global e a Nova Geografia da Produção Agrícola no Brasil. 2008. Available online: https://www.agritempo.gov.br/climaeagricultura/CLIMA_E_AGRICULTURA_BRASIL_300908_FINAL.pdf (accessed on 27 January 2018).
  15. Kayano, M.T.; Andreoli, R.V. Relations of South American summer rainfall interannual variations with the Pacific Decadal Oscillation. Int. J. Climatol. 2007, 27, 531–540. [Google Scholar] [CrossRef]
  16. Marengo, J.A.; Bernasconi, M. Regional differences in aridity/drought conditions over Northeast Brazil: Present state and future projections. Clim. Chang. 2015, 129, 103–115. [Google Scholar] [CrossRef]
  17. Costa, D.D.; Pereira, T.A.S.; Fragoso, C.R., Jr.; Madani, K.; Uvo, C.B. Understanding drought dynamics during dry season in Eastern Northeast Brazil. Front. Earth Sci. 2016, 4, 69. [Google Scholar] [CrossRef]
  18. Rau, P.; Bourrel, L.; Labat, D.; Melo, P.; Dewitte, B.; Frappart, F.; Lavado, W.; Felipe, O. Regionalization of rainfall over the Peruvian Pacific slope and coast. Int. J. Climatol. 2016, 37, 143–158. [Google Scholar] [CrossRef]
  19. Farooq, M.; Wahid, A.; Kobayashi, N.; Fujita, D.; Basra, S.M.A. Plant drought stress: Effects, mechanisms and management. Agron. Sustain. Dev. 2009, 29, 185–212. [Google Scholar] [CrossRef] [Green Version]
  20. Carleton, T.A.; Hsiang, S.M. Social and economic impacts of climate. Science 2016, 353, 9837. [Google Scholar] [CrossRef] [Green Version]
  21. Liang, X.Z.; Wu, Y.; Chambers, R.G.; Schmoldt, D.L.; Gao, W.; Liu, C.; Liu, Y.A.; Sun, C.; Kennedy, J.A. Determining climate effects on US total agricultural productivity. Proc. Natl. Acad. Sci. USA 2017, 114, 2285–2292. [Google Scholar] [CrossRef] [Green Version]
  22. Grimm, A.M. The El Niño impact on the summer monsoon in Brazil: Regional processes versus remote influences. J. Clim. 2003, 16, 263–280. [Google Scholar] [CrossRef]
  23. Ferreira, D.B.; Rao, V.B. Recent climate variability and its impacts on yields in Southern Brazil. Theor. Appl. Climatol. 2011, 105, 83–97. [Google Scholar]
  24. Penalba, O.C.; Rivera, J.A. Precipitation response to El Niño/La Niña events in southern South America—emphasis in regional drought occurrences. Adv. Geosci. 2016, 42, 1–14. [Google Scholar] [CrossRef] [Green Version]
  25. Moura, M.M.; dos Santos, A.R.; Pezzopane, J.E.M.; Alexandre, R.S.; da Silva, S.F.; Pimentel, S.M.; de Andrade, M.S.S.; Silva, F.G.R.; Branco, E.R.F.; Moreira, T.R.; et al. Relation of El Niño and La Niña phenomena to precipitation, evapotranspiration and temperature in the Amazon basin. Sci. Total Environ. 2019, 651, 1639–1651. [Google Scholar] [CrossRef] [PubMed]
  26. Souza, E.B.; Kayano, M.T.; Ambrizzi, T. Intraseasonal and submonthly variability over the Eastern Amazon and Northeast Brazil during the autumn rainy season. Theor. Appl. Climatol. 2005, 81, 177–191. [Google Scholar] [CrossRef]
  27. Tedeschi, R.G.; Grimm, M.; Cavalcanti, I.F.A. Influence of Central and East ENSO on precipitation and its extreme events in SouthAmerica during austral autumn and winter. Int. J. Climatol. 2016, 36, 4797–4814. [Google Scholar] [CrossRef]
  28. Timmermann, A.; An, S.I.; Kug, J.S.; Jin, F.F.; Cai, W.; Capotondi, A.; Cobb, K.M.; Lengaigne, M.; McPhaden, M.J.; Stuecker, M.F.; et al. El Niño—Southern Oscillation complexity. Nature 2018, 559, 535–545. [Google Scholar] [CrossRef]
  29. Gelcer, E.; Fraisse, C.W.; Dzotsi, K.; Hu, Z.; Mendes, R.; Zotarelli, L. Effects of El Niño Southern Oscillation on the space–time variability of Agricultural Reference Index for Drought in midlatitudes. Agric. For. Meteorol. 2013, 174–175, 110–128. [Google Scholar] [CrossRef]
  30. Gelcer, E.; Fraisse, C.W.; Zotarelli, L.; Stevensd, F.R.; Perondi, D.; Barreto, D.D.; Malia, H.A.; Ecole, C.C.; Montone, V.; Southworth, J. Influence of El Niño–Southern oscillation (ENSO) on agroclimatic zoning for tomato in Mozambique. Agric. For. Meteorol. 2018, 248, 316–328. [Google Scholar] [CrossRef]
  31. Ramirez–Rodrigues, M.; Asseng, S.; Fraisse, C.; Stefanova, L.; Eisenkolbi, A. Tailoring wheat management to ENSO phases for increased wheat production in Paraguay. Clim. Risk Manag. 2014, 3, 24–38. [Google Scholar] [CrossRef] [Green Version]
  32. Woli, P.; Ortiz, B.V.; Johnson, J.; Hoogenboom, G. El Niño–Southern Oscillation effects on winter wheat in the Southeastern United States. Agron. J. 2015, 107, 2193–2204. [Google Scholar]
  33. Sinclair, T.R.; Messina, C.D.; Beatty, A.; Samples, M. Assessment across the United States of the benefits of altered soybean drought traits. Agron. J. 2010, 102, 475–482. [Google Scholar] [CrossRef]
  34. Boote, K.J. Improving soybean cultivars for adaptation to climate change and climate variability. In Crop Adaptation to Climate Change; Yadav, S.S., Redden, R.J., Hatfield, R.J., Lotze–Campen, J.L., Hall, H., Eds.; Wiley–Blackwell: West Sussex, UK, 2011; pp. 370–395. [Google Scholar]
  35. Silva, E.H.F.M. Simulações de Cenários Agrícolas Futuros Para a Cultura da Soja no Brasil, Com Base em Projeções de Mudanças Climáticas. Master’s Thesis, Universidade de São Paulo—Escola Superior de Agricultura “Luiz de Queiroz”, Piracicaba, Brazil, 2018; 95p. [Google Scholar]
  36. Battisti, R.; Sentelhas, P.C.; Boote, K.J.; De, G.M.; Câmara, S.; Farias, J.R.B.; Basso, C.J. Assessment of soybean yield with altered water–related genetic improvement traits under climate change in southern Brazil. Eur. J. Agron. 2017, 83, 1–14. [Google Scholar] [CrossRef]
  37. Battisti, R.; Sentelhas, P.C. Characterizing Brazilian soybean–growing regions by water deficit patterns. Field Crops Res. 2019, 240, 95–105. [Google Scholar] [CrossRef]
  38. Teixeira, W.W.R.; Battisti, R.; Sentelhas, P.C.; Moraes, M.D.; Oliveira Junior, A. Uncertainty assessment of soya bean yield gaps using DSSAT–CSM–CROPGROSoybeancalibrated by cultivar maturity groups. J. Agron. Crop. Sci. 2019, 1–12. [Google Scholar] [CrossRef]
  39. Hu, M.; Wiatrak, P. Effect of planting date on soybean growth, yield, and grain quality: Review. Agron. J. 2012, 104, 785–790. [Google Scholar] [CrossRef]
  40. Pierozan Junior, C.; Kawakami, J.; Schwarz, K.; Umburanas, R.C.; Del Conte, M.V.; Müller, M.M.L. Sowing dates and soybean cultivars influence seed yield, oil and protein contents in subtropical environment. J. Agric. Sci. 2017, 9, 188. [Google Scholar]
  41. Blain, G.C.; Kayano, M.T.; Sentelhas, P.C.; Lulu, J. Possible influences of pacific decadal oscillation in the ten day based radio between actual and potential evapotranspiration in the region of Campinas, São Paulo State, Brazil. Bragantia 2009, 68, 797–805. [Google Scholar] [CrossRef]
  42. Da Rocha, R.P.; Reboita, M.S.; Dutra, L.M.M.; Llopart, M.P.; Coppola, E. Variability associated with ENSO: Present and future climate projections of RegCM4 for South America–CORDEX domain. Clim. Chang. 2014, 125, 95–109. [Google Scholar] [CrossRef]
  43. Erasmi, S.; Schucknecht, A.; Barbosa, M.; Matschullat, J. Vegetation greenness in Northeastern Brazil and its relation to ENSO warm events. Remote Sens. 2014, 6, 3041–3058. [Google Scholar] [CrossRef] [Green Version]
  44. Nóia Junior, R.D.S.; Sentelhas, P.C. Soybean–maize off–season double crop system in Brazil as affected by El Niño Southern Oscillation phases. Agric. Syst. 2019, 173, 254–267. [Google Scholar] [CrossRef]
  45. Ruíz-Nogueira, B.; Boote, K.J.; Sau, F. Calibration and use of CROPGRO-soybean model for improving soybean management under rainfed conditions. Agric. Syst. 2001, 68, 151–173. [Google Scholar] [CrossRef]
  46. Specht, J.E.; Chase, K.; Macrander, M.; Graef, G.L.; Chung, J.; Markwell, J.P.; Germann, M.; Orf, J.H.; Lark, K.G. Soybean response to water: A QTL analysis of drought tolerance. Crop Sci. 2001, 41, 493–509. [Google Scholar] [CrossRef]
  47. Sentelhas, P.C.; Battisti, R.; Câmara, G.M.S.; Farias, J.R.B.; Hampf, A.; Nendel, C. The soybean yield gap in Brazil—Magnitude, causes and possible solutions for a sustainable production. J. Agric. Sci. 2015, 153, 1394–1411. [Google Scholar] [CrossRef] [Green Version]
  48. Kao, W.Y.; Forseth, I.N. Responses of gas Exchange and phototropic leaf orientation in soybean to soil water availability, leaf water potential, air temperature, and photosynthetic photon flux. Environ. Exp. Bot. 1992, 32, 153–161. [Google Scholar] [CrossRef]
  49. Casaroli, D.; Fagan, E.B.; Simon, J.; Medeiros, S.P.; Manfron, P.A.; Dourado Neto, D.; Van Lier, W.D.J.; Muller, L.; Martin, T.N. Radiação solar e aspectos fisiológicos na cultura de soja: Uma revisão. Revista da FZVA 2007, 14, 102–120. [Google Scholar]
  50. Gilbert, M.E.; Holbrook, N.M.; Zwieniecki, M.A.; Sadok, W.; Sinclair, T.R. Field confirmation of genetic variation in soybean transpiration response to vapor pressure deficit and photosynthetic compensation. Field Crops Res. 2011, 124, 85–92. [Google Scholar] [CrossRef]
  51. Farias, J.R.B.; Neumaier, N.; Nepomuceno, A.L. Soja. In Monteiro, JEBA Agrometeorologia dos Cultivos: O Fator Meteorológico na Produção Agrícola; INMET: Brasília, Brazil, 2009; pp. 261–278. [Google Scholar]
  52. Battisti, R.; Sentelhas, P.C.; Pascoalino, J.A.L.; Sako, H.; de Sá Dantas, J.P.; Moraes, M.F. Soybean yield gap in the areas of yield contest in Brazil. Int. J. Plant Prod. 2018. [Google Scholar] [CrossRef]
  53. Nóia Júnior, R.D.S.; Sentelhas, P.C. Soybean–maize succession in Brazil: Impacts of sowing dates on climate variability, yields and economic profitability. Eur. J. Agron. 2019, 103. [Google Scholar] [CrossRef]
  54. Farias, J.R.B.; Assad, E.D.; Almeida, I.R.; Evangelista, B.A.; Lazzaratto, C.; Neumaier, N.; Nepomuceno, A.L. Caracterização de risco de déficit hídrico nas regiões produtoras de soja no Brasil. Rev. Bras. Agromet. 2001, 9, 415–421. [Google Scholar]
  55. Cunha, G.R.; Barni, N.A.; Haas, J.C.; Maluf, J.R.T.; Matzenauer, R.; Pasinato, A.; Pimentel, M.B.M.; Pires, J.L.F. Zoneamento agrícola e época de semeadura para soja no Rio Grande do Sul. Rev. Bras. Agromet. 2001, 9, 446–459. [Google Scholar]
  56. Ribeiro, C.A.D.; Pezzopane, J.R.M.; Pezzopane, J.E.M.; Loos, R. Delimitação de microrregiões agroclimáticas e suas relações com o potencial produtivo da cultura do eucalipto. Floresta 2011, 41, 779–786. [Google Scholar]
  57. Silva, V.P.R.; Oliveira, S.D.; Santos, C.A.C.; Silva, M.T. Risco climático da cana–de–açúcar cultivada na região Nordeste do Brasil. Revista Brasileira de Engenharia Agrícola e Ambiental 2013, 17, 180–189. [Google Scholar]
  58. Miranda, E.E.; Magalhães, L.A.; Carvalho, C.A. Proposta de delimitação territorial do Matopiba. Nota técnica 1. EMBRAPA. Grupo de Inteligência Territorial Estratégica (GITE). 2014. Available online: https://www.embrapa.br/gite/publicacoes/NT1_DelimitacaoMatopiba.pdf (accessed on 19 March 2019).
  59. Salvador, M.A.; Brito, J.I.B. Trend of annual temperature and frequency of extreme events in the MATOPIBA region of Brazil. Theor. Appl. Climatol. 2018, 133, 253–261. [Google Scholar] [CrossRef]
  60. Magalhães, L.A.; Miranda, E.E. MATOPIBA: Quadro Natural. Nota técnica 5. EMBRAPA. Grupo de Inteligência Territorial Estratégica (GITE). 2014. Available online: https://www.embrapa.br/gite/publicacoes/NT5_Matopiba_Quadro_Natural.pdf (accessed on 19 March 2019).
  61. Xavier, A.C.; King, C.W.; Scanlon, B.R. Daily gridded meteorological variables in Brazil (1980–2013). Int. J. Climatol. 2016, 36, 2644–2659. [Google Scholar]
  62. Battisti, R.; Bender, F.D.; Sentelhas, P.C. Assessment of different gridded weather data for soybean yield simulations in Brazil. Theor. Appl. Climatol. 2018, 1–11. [Google Scholar] [CrossRef]
  63. Vianna, M.S.; Sentelhas, P.C. Simulação do risco de deficit hídrico em regiões de expansão do cultivo de cana–de–açúcar no Brasil. Pesquisa Agropecuária Brasileira 2014, 49, 237–246. [Google Scholar]
  64. Cavassim, J.E.; Filho, J.C.B.; Alliprandini, L.F.; de Oliveira, R.A.; Daros, E.; Guerra, E.P. Stability of soybean genotypes and their classification into relative maturity groups in Brazil. Am. J. Plant Sci. 2013, 4, 2060–2069. [Google Scholar]
  65. Sentelhas, P.C.; Battisti, R.; Sako, H.; Zeni, R.; Rodrigues, L.A. Clima e Produtividade da Soja: Variabilidade Climática Como Fator Controlador da Produtividade. Boletim de Pesquisa, 2017/2018. 2018. Available online: https://edisciplinas.usp.br/mod/resource/view.php?id=2221718 (accessed on 26 April 2019).
  66. Embrapa—Empresa Brasileira de Pesquisas Agropecuárias. Tecnologias de Produção de Soja—Região Central do Brasil 2014. Embrapa Soja. 2013. Available online: http://ainfo.cnptia.embrapa.br/digital/bitstream/item/95489/1/SP–16–online.pdf (accessed on 24 August 2019).
  67. Battisti, R.; Sentelhas, P.C.; Boote, K.J. Inter–comparison of performance of soybean crop simulation models and their ensemble in southern Brazil. Field Crops Res. 2017, 200, 28–37. [Google Scholar] [CrossRef]
  68. Boote, K.J.; Jones, J.W.; Batchelor, W.D.; Nafziger, E.D.; Myers, O. Genetic coefficients in the CROPGRO–Soybean model: Link to field performance and genomics. Agron. J. 2003, 95, 32–51. [Google Scholar]
  69. Pezzi, L.P.; Cavalcanti, I.F.A. The relative importance of ENSO and tropical Atlantic sea surface temperature anomalies for seasonal precipitation over South America: A numerical study. Clim. Dyn. 2001, 17, 205–212. [Google Scholar]
  70. Kayano, M.T.; Andreoli, R.V.; Souza, R. Evolving anomalous SST patterns leading to ENSO extremes: Relations between the tropical Pacific and Atlantic Oceans and the influence on the South American rainfall. Int. J. Climatol. 2011, 31, 1119–1134. [Google Scholar] [CrossRef]
  71. Kayano, M.T.; Andreoli, R.V.; Souza, R. Relations between ENSO and the South Atlantic SST modes and their effects on the South American rainfall. Int. J. Climatol. 2012. [Google Scholar] [CrossRef]
  72. Mutti, P.R.; Abreu, L.P.; Andrade, L.M.B.; Spyrides, M.H.C.; Lima, C.K.; de Oliveira, C.P.; Dubreuil, V.; Bezerra, B.G. A detailed framework for the characterization of rainfall climatology in semiarid watersheds. Theor. Appl. Climatol. 2019, 109–125. [Google Scholar] [CrossRef]
  73. Dunn, O.J. Multiple Comparisons Using Rank Sums. Technometrics 1964, 6, 241. [Google Scholar] [CrossRef]
  74. Hollander, M.; Wolfe, D.A.; Chicken, E. Nonparametric Statistical Methods; John Wiley & Sons: Hoboken, NJ, USA, 2013; Volume 751. [Google Scholar]
  75. Hoogenboom, G.; Jones, J.W.; Wilkens, P.W.; Batchelor, W.D.; Bowen, W.T.; Hunt, L.A.; Pickering, N.B.; Singh, U.; Godwin, D.C.; Baer, B.; et al. Crop Models; DSSAT Version 3; Tsuji, G.Y., Uehara, G., Balas, S., Eds.; University of Hawaii: Honolulu, HI, USA, 1994; pp. 95–244. [Google Scholar]
  76. Jones, J.; Hoogenboom, G.; Porter, C.; Boote, K.; Batchelor, W.; Hunt, L.; Wilkens, P.; Singh, U.; Gijsman, A.; Ritchie, J. The DSSAT cropping system model. Eur. J. Agron. 2003, 18, 235–265. [Google Scholar] [CrossRef]
  77. Boote, K.J.; Jones, J.W.; Pickering, N.B. Potential uses and limitations of crop models. Agron. J. 1998, 88, 704–716. [Google Scholar] [CrossRef]
  78. Irmak, A.; Jones, J.W.; Mavromatis, T.; Welcj, S.M.; Boote, K.J.; Wilkerson, G.G. Evaluating Methods for Simulating Soybean Cultivar Responses Using Cross Validation. Agron. J. 2000, 92, 1140–1449. [Google Scholar] [CrossRef]
  79. Alagarswamy, G.; Singh, P.; Hoogenboom, G.; Wani, S.P.; Pathak, P.; Virmani, S.M. Evaluating and application of the CROPGRO–Soybean simulation model in a VerticInceptisol. Agric. Syst. 2000, 63, 19–32. [Google Scholar] [CrossRef] [Green Version]
  80. Dallacort, R.; Freitas, P.S.L.; Faria, R.T.; Gonçalves, A.C.A.; Rezende, R.; Bertonha, A. Utilização do modelo Cropgrp–soybean na determinação das melhores épocas de semeadura da cultura da soja, na região de Palotina, Estado do Paraná. Acta Sci. Agron. 2006, 28, 583–589. [Google Scholar] [CrossRef] [Green Version]
  81. Salmerón, M.; Purcell, L.C. Simplifying the prediction of phenology with the DSSAT–CROPGRO–soybean model based on relative maturity group and determinacy. Agric. Syst. 2016, 148, 178–187. [Google Scholar] [CrossRef] [Green Version]
  82. Ritchie, J.T. Soil water balance and plant water stress. In Understanding Options of Agricultural Production; Tsuji, G.Y., Hoogenboom, G., Thornton, K., Eds.; Kluwer Academic Publishers and International Consortium for Agricultural Systems Applications: Dordrecht, The Netherlands, 1998; pp. 41–53. [Google Scholar] [CrossRef]
  83. Suleiman, A.A.; Ritchie, J.T. Modeling soil water redistribution during–stage evaporation. Soil Sci. Soc. Am. J. 2003, 67, 377–386. [Google Scholar] [CrossRef]
  84. Soil Conservation Service (SCS). National Engineering Handbook; Hydrology Section 4; Soil Conservation Service, U.S.D.A.: Washington, DC, USA, 1972; Chapter 4/10. [Google Scholar]
  85. Boote, K.J.; Pickering, N.B. Modeling photosynthesis of row crop canopies. Hort. Sci. 1994, 29, 1423–1434. [Google Scholar] [CrossRef] [Green Version]
  86. Doorenbos, J.; Pruitt, W.D. Guidelines for Predicting Crop Water Requirements; Food and Agriculture Organization of the United Nations: Rome, Italy, 1977; p. 24. [Google Scholar]
  87. Allen, G.R.; Pereira, L.S.; Raes, D.; Smith, M. Crop Evapotranspiration–Guidelines for Computing Crop Water Requirements; Food and Agriculture Organization of the United Nations: Rome, Italy, 1998; p. 56. [Google Scholar]
  88. Embrapa—Empresa Brasileira de Pesquisas Agropecuárias. Sistema de Produção de Soja; EMBRAPA: Londrina, Brazil, 2011. [Google Scholar]
  89. Doorenbos, J.; Kassam, A.H. Yield Response to Water; FAO Irrigation and Drainage Paper Series; Series ID 1979, 33; FAO: Rome, Italy, 1979; 139p. [Google Scholar]
  90. Verdin, J.; Klaver, R. Grid–cell–based crop water accounting for famine early warning system. Hydol. Process. 2012, 16, 1617–6130. [Google Scholar] [CrossRef]
  91. Senay, G.B.; Verdin, J.P.; Rowland, J. Developing an operational rangeland water requirement satisfaction index. Int. J. Remote Sens. 2011, 32, 6047–6053. [Google Scholar] [CrossRef]
  92. Moeletsi, M.E.; Walker, S. A simple agroclimatic index to delineate suitable growing areas for rainfed maize production in the Free Province of South Africa. Agric. For. Meteorol. 2012, 162–163, 63–70. [Google Scholar] [CrossRef]
  93. Assad, E.D.; Martins, S.C.; Beltrão, N.E.M.; Pinto, H.S. Impacts of climate change on the agricultural zoning of climate risk for cotton cultivation in Brazil. Pesquisa Agropecuária Brasileira 2013, 48, 1–8. [Google Scholar] [CrossRef]
  94. Massignam, A.M.; Pandolfo, C.; Santi, A.; Caramori, P.H.; Vicari, M.B. Impact of climate change on climatic zoning of common bean in the South of Brazil. Agrometeros 2017, 25, 313–321. [Google Scholar] [CrossRef]
  95. Tarnavsky, E.; Chavez, E.; Boogaard, H. Agro–meteorological risks to maize production in Tanzania: Sensitivity of an adapted Water Requirements Satisfaction Index (WRSI) model to rainfall. Int. J. Appl. Earth Obs. Geoinf. 2018, 73, 77–87. [Google Scholar] [CrossRef]
  96. Fehr, W.R.; Caviness, C.E. Stages of soybean development. Spec. Rep. 1977, 80, 2–11. [Google Scholar]
  97. Neumaier, N.; Nepomuceno, A.L.; Farias, J.R.B.; Oya, T. Estresses de ordem ecofisiológica. In Estresses em Soja; Bonato, E.R., Ed.; Embrapa Trigo: Passo Fundo, Brazil, 2000; pp. 45–64. [Google Scholar]
  98. Brevedan, R.E.; Egli, D.B. Short periods of water stress during seed filling, leaf senescence, and yield of soybean. Crop Sci. 2003, 43, 2083–2088. [Google Scholar] [CrossRef]
  99. Farias, J.R.B.; Nepomuceno, A.L.; Neumaier, N. Ecofisiologia da soja. Londrina, Embrapa Soja. 2007. Available online: http://ainfo.cnptia.embrapa.br/digital/bitstream/CNPSO–2009–09/27615/1/circtec48.pdf (accessed on 14 November 2019).
  100. Bezerra, B.G.; Bezerra, J.R.C.; Silva, B.B.; Santos, C.A.C. Surface energy exchange and evapotranspiration from cotton crop under full irrigation conditions in the Rio Grande do Norte State, Brazilian Semi–Arid. Bragantia 2015, 74, 120–128. [Google Scholar]
  101. Steinmetz, S.; Reyniers, F.N.; Forest, F. Evaluation of the climatic risk on upland rice in Brazil. In Colloque Resistance a la RecherchesemMillien Intertropical: QuellesRecherches and Yield Pour le Moyen Terme? Dakar. Proceedings; CIRAD: Paris, France, 1985; pp. 43–54. [Google Scholar]
  102. Mapa—Ministério da Agricultura, Pecuária e Abastecimento [Documento Eletrônico]. Risco Agrícola—Zoneamento Agrícola de Risco Climático. 2018. Available online: http://www.agricultura.gov.br/politica–agricola/zoneamentoagricola (accessed on 16 June 2019).
  103. Krause, P.; Boyle, D.P.; Base, F. Comparison of different efficiency criteria for hidrological model assessment. Adv. Geosci. 2005, 5, 89–95. [Google Scholar]
  104. Salmerón, M.; Purcell, L.C.; Vories, E.D.; Shannon, G. Simulation of genotype–by–environment interactions on irrigated soybean yields in the U.S. Midsouth. Agric. Syst. 2017, 150, 120–129. [Google Scholar] [CrossRef]
  105. Cunha, A.P.M.A.; Tomasella, J.; Ribeiro–Neto, G.G.; Brown, M.; Garcia, S.R.; Brito, S.B.; Carvalho, M.A. Changes in the spatial–temporal patterns of droughts in the Brazilian Northeast. Atmos. Sci. Lett. 2018, 19, 855. [Google Scholar]
  106. Oliveira, P.T.; Santos e Silva, C.M.; Lima, K.C. Climatology and trend analysis of extreme precipitation in subregions of Northeast Brazil. Theor. Appl. Climatol. 2017, 130, 77–90. [Google Scholar]
  107. Da Silva, P.E.; Santos e Silva, C.M.; Spyrides, M.H.C.; Andrade, L.M.B. Precipitation and air temperature extremes in the Amazon and northeast Brazil. Int. J. Climatol. 2019, 39, 579–595. [Google Scholar]
  108. Blain, G.C. Considerações estatísticas relativas a seis séries mensais de temperatura do ar da secretaria de agricultura e abastecimento do estado de São Paulo. Revista Brasileira Meteorologia 2011, 26, 279–296. [Google Scholar]
  109. Avila, L.F.; Mello, C.R.; Yanagi, S.N.M.; Sacramento Neto, O.B. Tendências de temperaturas mínimas e máximas do ar no Estado de Minas Gerais. Pesquisa Agropecuária Brasileira 2014, 49, 247–256. [Google Scholar]
  110. Mavi, H.S.; Tupper, G.J. Agrometeorology: Principles and Applications of Climate Studies in Agriculture; Food Products Press: New York, NY, USA, 2004; 364p. [Google Scholar]
  111. Bezerra, B.G.; Silva, L.; Santos e Silva, C.M.; Carvalho, G.G. Changes of precipitation extremes indices in São Francisco River Basin, Brazil from 1947 to 2012. Theor. Appl. Climatol. 2019, 135, 565–576. [Google Scholar]
  112. Barni, N.A.; Matzenauer, R. Ampliação do calendário de semeadura da soja no Rio Grande do Sul pelo uso de cultivares adaptados aos distintos ambientes. Pesquisa Agropecuária Gaúcha 2000, 6, 189–203. [Google Scholar]
  113. Waha, K.; Van Bussel, L.G.J.; Müller, C.; Bondeau, A. Climate–driven simulation of global crop sowing dates. Glob. Ecol. Biog. 2012, 21, 247–259. [Google Scholar] [CrossRef]
  114. Heinemann, A.B.; Ramirez–Villegas, J.; Souza, T.L.P.O.; Didonet, A.D.; Di Stefano, J.G.; Boote, K.J.; Jarvis, A. Drought impact on rainfed common bean production areas in Brazil. Agric. For. Meteorol. 2016, 225, 57–74. [Google Scholar] [CrossRef] [Green Version]
  115. Spangler, K.R.; Lynch, A.H.; Spera, S.A. Precipitation drivers of cropping frequency in the Brazilian cerrado: Evidence and implications for decision–making. Weather Clim. Soc. 2017, 9, 201–213. [Google Scholar] [CrossRef]
  116. Aceituno, P. On the functioning of the Southern Oscillation in the South American sector. Surface climate, Mon. Weather Rev. 1988, 116, 505–524. [Google Scholar]
  117. Rao, V.B.; Hada, K. Characteristics of rainfall over Brazil: Annual and variations and connections with the Southern Oscillation. Theor. Appl. Climatol. 1990, 42, 81–91. [Google Scholar]
  118. Battisti, R.; Sentelhas, P.C. New agroclimatic approach for soybean dates recommendation: A case study. Revista Brasileira de Engenharia Agrícola e Ambiental 2014, 18, 1149–1156. [Google Scholar] [CrossRef] [Green Version]
  119. Li, D.; Li, H.; Qiao, Y.; Wang, Y.; Cai, Z.; Dong, B.; Shi, C.; Liu, Y.; Li, X.; Liu, M. Effects of elevated CO2 on the growth, seed yield, and water use efficiency of soybean (Glycine max (L.) Merr.) under drought stress. Agric. Water Manag. 2013, 129, 105–112. [Google Scholar] [CrossRef]
  120. Marengo, J.A.; Alves, L.M.; Alvala, R.C.S.; Cunha, A.P.; Brito, S.; Moraes, O.L.L. Climatic characteristics of the 2010–2016 drought in the semiarid Northeast Brazil region. Anais da Academia Brasileira de Ciências 2018, 90, 1973–1985. [Google Scholar] [CrossRef]
  121. Kayano, M.T.; Andreoli, R.V. Relationships between rainfall anomalies over northeastern Brazil and the El Nino–Southern Oscillation. J. Geophys. Res. 2006, 111, D13101. [Google Scholar] [CrossRef] [Green Version]
  122. Puteh, A.B.; ThuZar, M.; Mondal, M.M.A.; Abdllah, N.A.P.B.; Halim, M.R.A. Soybean [Glycine max (L.) Merril] seed yield response to high temperatures stress during reproductive growth stages. Aust. J. Crop Sci. 2013, 10, 1472–1479. [Google Scholar]
  123. Nóia Júnior, R.S.; do Amaral, G.C.; Pezzopane, J.E.M.; Toledo, J.V.; Xavier, T.M.T. Ecophysiology of C3 and C4 plants in terms of responses to extreme soil temperatures. Theor. Exp. Plant Physiol. 2018, 7, 261–274. [Google Scholar] [CrossRef]
  124. Zhu, X.; Troy, T.J. Agriculturally Relevant Climate Extremes and Their Trends in the World’s Major Growing Regions. Earth’s Future 2018, 6, 656–672. [Google Scholar] [CrossRef]
  125. Evangelista, B.A.; Silva, F.A.M.; Silva Neto, S.P. Uso das informações agrometeorológicas no monitoramento das culturas agrícolas, tendo como referência a soja. In Anuário. ABRASEM; Becker & Peske: Pelotas, Brazil, 2013; pp. 38–42. [Google Scholar]
  126. Sinclair, T.R.; Purcell, L.C.; King, C.A.; Sneller, C.H.; Chen, P.; Vadez, V. Drought tolerance and yield increase of soybean resulting from improved symbiotic N2 fixation. Field Crops Res. 2007, 101, 68–71. [Google Scholar] [CrossRef] [Green Version]
  127. Van Roekel, R.J.; Purcell, L.C.; Salmerón, M. Physiologicaland management factors contributing to soybean potential yield. Field Crops Res. 2015, 182, 86–97. [Google Scholar] [CrossRef]
  128. Bao, Y.; Hoogenboom, G.; Mcclendon, R.W.; Paz, J.O. Potential for rainfed soybean production in the south–eastern USA underclimate change based on the CSM–CROPGRO–soybean model. J. Agric. Sci. 2015, 153, 798–824. [Google Scholar] [CrossRef]
Figure 1. Geographical location of MATOPIBA in relation to Brazil (lower right map) and spatial distribution of data points referring to meteorological variables (left map).
Atmosphere 11 01130 g001
Figure 2. Mean monthly values of the meteorological variables in the period from 1980 to 2013 in the MATOPIBA region regarding the climatology, the favorable scenario (wet), and the unfavorable scenario (dry). (a) Rainfall, (b) ETo: Reference Evapotranspiration, (c) Tmax: Maximum Temperature, (d) Tmin: Minimum Temperature, (e) Solar Radiation and (f) Relative Humidity.
Atmosphere 11 01130 g002
Figure 3. Monthly frequency distribution of the meteorological variables in the period from 1980 to 2013 in the MATOPIBA region. (a) Rainfall, (b) ETo: Reference Evapotranspiration, (c) Tmax: Maximum Temperature, (d) Tmin: Minimum Temperature, (e) Rs: Solar Radiation and (f) RH: Relative Humidity.
Atmosphere 11 01130 g003
Figure 4. Agroclimatic risk of soybean culture in the MATOPIBA region for the climatology scenario.
Atmosphere 11 01130 g004
Figure 5. Agroclimatic risk of soybean culture in the MATOPIBA region for the favorable (wet) scenario.
Atmosphere 11 01130 g005
Figure 6. Agroclimatic risk of soybean culture in the MATOPIBA region for the unfavorable (dry) scenario.
Atmosphere 11 01130 g006
Figure 7. Mean achievable yield of soybeans, simulated by the DSSAT/CROPGRO-Soybean model, for different sowing dates and locations in MATOPIBA, considering three meteorological conditions. (Observed data are presented for some locations.)
Atmosphere 11 01130 g007
Figure 8. Simulated Water Requirements Satisfaction Index (WRSI) of soybean crops for different sowing dates and locations in MATOPIBA, considering three meteorological conditions.
Atmosphere 11 01130 g008
Figure 9. Best sowing windows for soybean yield in different MATOPIBA locations according to the three meteorological scenarios.
Atmosphere 11 01130 g009
Table 1. Properties of the yellow latosol used for calibration of the Decision Support System for Agrotechnology Transfer (DSSAT)/CROPGRO-Soybean model.
DepthPWPSFCSBSRGFSHCSODOCBCLASILPHWCEC
cm-cm3 cm−3--cm h−1g cm−3-%-cmolc kg−1
YELLOW LATOSOL
0–200.1440.3090.4521.01.021.303.1415.07.05.79.0
20–400.0690.2190.3990.62.631.501.5722.06.05.95.0
40–600.1540.2890.4180.40.851.481.5731.05.06.03.0
Soil classification according to the International Soil Reference and Information Centre (ISRIC)—World Inventory of Soil Emission Potentials (WISE) platform. Depth (soil depth), PWP (permanent wilting point), SFC (field capacity), SBS (base saturation), RGF (root growth factor), SHC (hydraulic conductivity), SOD (soil density), OCB (organic carbon), CLA (clay ratio), SIL (silt ratio), PHW (pH water), CEC (cation exchange capacity).
Table 2. Genetic coefficients for the soybean cultivar of the Relative Maturity Group 8.5 used for calibration of the DSSAT-CROPGRO-Soybean model.
TraitCoefficientsDefinition a/Units
CSDL13.0Critical short day length below which reproductive development progresses with no daylength effect (for short day plants)/(h)
PPSEN0.369Slope of the relative response of development to photoperiod with time (positive for short day plants)/(1/h)
EM-FL24.7Time between plant emergence and flower appearance (R1)/(ph. days b)
FL-SH6.5Time between first flower and first pod (R3)/(ph. days)
FL-SD18.5Time between first flower and first seed (R5)/(ph. days)
SD-PM30.0Time between first seed (R5) and physiological maturity (R7)/(ph. days)
FL-LF26.0Time between first flower (R1) and end of leaf expansion/(ph. days)
LFMAX1.12Maximum leaf photosynthesis rate at 30 °C, 350 ppm CO2, and high light/(mg CO2, m−2 s−1).
SLAVR340Specific leaf area of cultivar under standard growth conditions/(cm2 g−1)
SIZLF185Maximum size of full leaf (three leaflets)/(cm2)
XFRT1.00Maximum fraction of daily growth that is partitioned to seed-shell
WTPSD0.21Maximum potential weight per seed/(g)
SFDUR23.0Seed filling duration for pod cohort at standard growth conditions/(ph. days)
SDPDV2.3Average seed per pod under standard growing conditions/(no. pod−1)
PODUR12.0Time required for cultivar to reach final pod load under optimal conditions/(ph. days)
THRSH74.0Threshing percentage, the maximum ratio of (seed)/(seed + shell) at maturity
SDPRO0.40Fraction protein in seeds/(g(protein)/g(seed))
SDLIP0.20Fraction oil in seeds/(g(oil)/g(seed))
FL-VS26.0Time from first flower to last leaf on main stem (photothermal days)
RHGHT1.00Relative height of this ecotype in comparison to the standard height per node defined in the species file
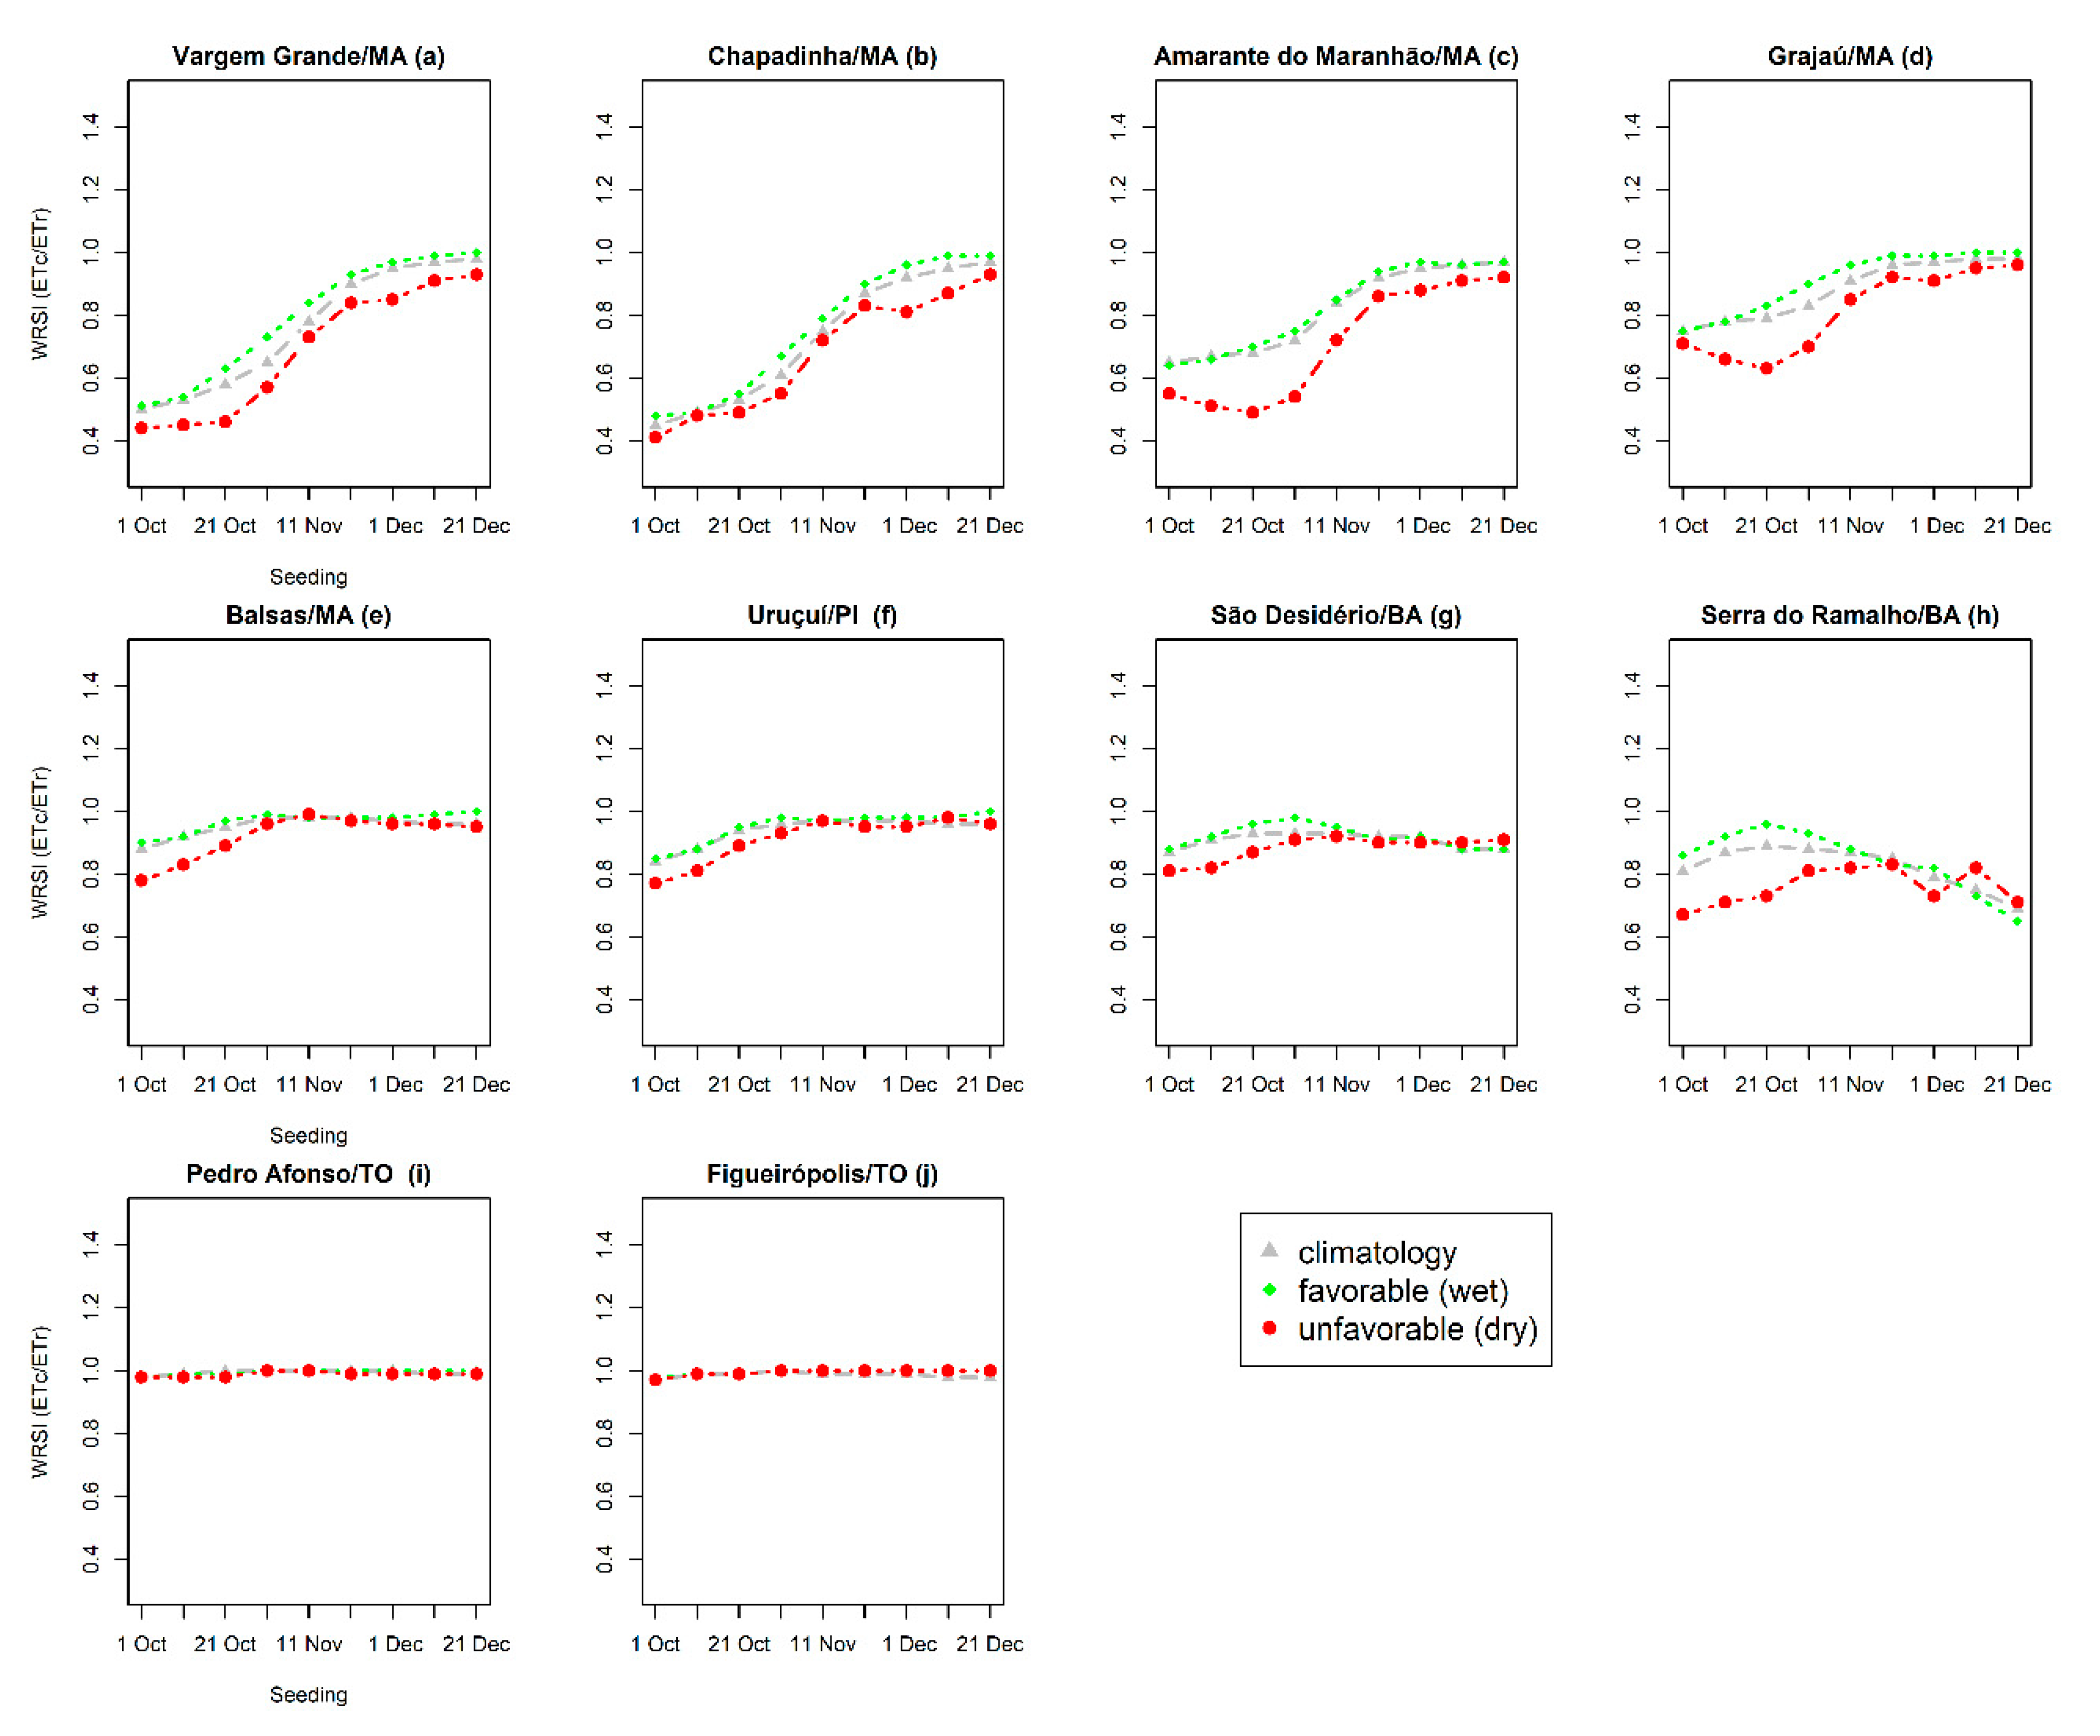
a [68] and b Photothermal days/Adapted from reference [67].
Table 3. Criteria for the definition of agroclimatic risk for soybean crops, according to water deficit conditions.
WRSI RangeCategories of Climate Risks
WRSI > 0.65Favorable, low risk
0.55 ≤ WRSI ≤ 0.65Intermediary, medium risk
WRSI < 0.55Unfavorable, high risk
WRSI: water requirement satisfaction index.
Table 4. Mean, standard deviation, and Dunn’s test result for the meteorological variables in the MATOPIBA region, considering the period from October to April of crop years from 1980/81 to 2012/13.
Variables Scenarios
ClimatologyFavorable (Wet)Unfavorable (Dry)
Rs (MJ m−2 day−1)17.86 ± 1.3717.72 ± 1.29 x18.15 ± 1.39
Rainfall (mm)1388.35 ± 131.781480.60± 141.54 x1335.19± 135.44
ETo (mm day−1)4.01 ± 0.404.00 ± 0.444.09 ± 0.41
Tmax (°C)31.83 ± 1.1831.57 ± 1.23 b,y32.18 ± 122 b
Tmin (°C)21.93 ± 0.4321.73 ± 0.38 b,y22.18 ± 0.41 b
RH (%)78.44 ± 5.8078.75 ± 6.66 x77.18 ± 6.05
b: p-value < 0.05 in relation to the climatology; x: p-value < 0.10 in relation to the unfavorable scenario (dry); y: p-value < 0.05 in relation to the unfavorable scenario (dry). Rs: solar radiation; RH: relative humidity.
Table 5. Summary of the results of the non-parametric Mann–Kendall test (Z-test) in the annual series of meteorological variables in the period from 1980 to 2013 in the MATOPIBA region.
VariablesZ-TestCoef. Angularp-Value
RS (MJ m−2 day−1)0.5904.920<0.001
RAINFALL (mm)0.0010.0100.988
ETO (mm day−1)0.5004.150<0.001
TMAX (°C)0.4303.630<0.001
TMIN (°C)0.4103.410<0.001
RH (%)−0.500−4.220<0.001
Table 6. Performance of the CROPGRO-Soybean crop model for soybean yield simulation in 33 crop seasons, considering three meteorological scenarios.
LocationsMsMorBiasRMSE
Climatology
Grajaú (MA)255022230.80−21224.3
Uruçuí (PI)219421080.78117310.5
São Desidério (BA)202719860.8138282.6
Figueirópolis (TO)225621460.8115268.4
Favorable-Wet
Grajaú (MA)260524600.95−113187.8
Uruçuí (PI)231623010.98−1578.3
São Desidério (BA)211520610.9814057.6
Figueirópolis (TO)260922980.93140104.4
Unfavorable-Dry
Grajaú (MA)237222190.92153242.0
Uruçuí (PI)204820290.93121198.0
São Desidério (BA)195119350.84−161144.1
Figueirópolis (TO)239721590.9811359.6
Ms: mean simulated achievable yield; Mo: mean observed achievable yield.
Publisher’s Note: MDPI stays neutral with regard to jurisdictional claims in published maps and institutional affiliations.

