Abstract
Piperine is a bioactive alkaloid compound which provides a unique spicy flavor derived from plants of the Piper nigrum L. Black pepper (n = 160) collected from Vietnam was studied using non-destructive near infrared spectroscopy (NIRS). The spectral acquisition ranged from 1100 to 2500 nm, and a chemometrics analysis program was performed to quantify the piperine contents. High performance liquid chromatography (HPLC) analysis was carried out to develop a chemometric model based on reference values. The black pepper samples were divided into two groups used for calibration (n = 120) and prediction (n = 40) sets. The optimum calibration model was developed by pretreatment of the spectra. The analyses results based on the prediction samples included a coefficient of determination (R2) of 0.914, a root mean square error of prediction (RMSEP) and a standard error of prediction (SEP) of about 0.220 g/100 g, and a ratio performance to deviation (RPD) value of 3.378 regarding the partial least square (PLS) regression model, and an R2 of 0.921, an RMSEP and SEP of 0.210 g/100 g, and an RPD of 3.571, with respect to the principal components (PC) regression model. These results indicate that NIRS can be applicable as a control, or as an alternative rapid and effective method to quantify piperine in P. nigrum L.
1. Introduction
Pepper (Piper nigrum L.) is a fruit of the family Piperaceae and native to southern India. As of the year 2018, the production of pepper (Piper spp.) was 690,698 tons all over the world. Production increased by 6.2% annually from 2012 to 2018. Vietnam is the largest producer, accounting for 34% of the global production, followed by Brazil and Indonesia, accounting for 13.1% and 11.5%, respectively [1]. Pepper is a typical spice that has been used for cooking since ancient times, and has a unique spicy taste that adds flavor and removes odor when cooking. Black pepper is the peppercorns dried and crushed with the flesh, and white pepper is the seeds of the ripe peppercorns dried after peeling the skin [2]. Piperine is an important bioactive compound and a major alkaloid component of pepper. The effects of piperine include immunomodulatory, anti-carcinogenic [3], antimicrobial [4], anti-inflammatory [5,6], anti-cancer [7,8] and anti-ulcer activities [9].
Traditionally, methods for analyzing the piperine content of pepper have included UV spectrophotometry [10], TLC-UV densitometry [11], high-performance thin-layer chromatography (HPTLC) [12], HPLC [13,14] and the electrochemical quantification method [15]. When analyzed using HPLC and HPTLC, the piperine content of pepper was reported to be 3% to 6% [16]. Piperine analysis using high performance liquid chromatography (HPLC) requires the pre-treatment of samples, such as extraction, separation and purification. Depending on the proficiency of the tester, it involves processes such as the error calculation of the result value generated in the analysis process, the handling of the solvent used for pretreatment harmful to the human body, the treatment of waste organic solvent and the manipulation of complex instruments. This analysis method is time-consuming, and the results are confirmed through all these processes.
Near infrared spectroscopy (NIRS) is a representative environmentally friendly non-destructive analysis method. When the wavelength of the near infrared region is irradiated to the sample, absorption of the wavelength occurs due to the vibration of molecules in the sample. NIRS measures the physical and chemical properties of a sample by recording changes in the absorbed wavelengths (in nm). The generated spectrum can be correlated with data obtained for the desired component through chemical experiments using chemometric analysis with statistical and mathematical processing. The advantages of NIRS compared to conventional piperine analyses methods include the following: (1) there is no need to extract piperine from the sample (non-destructive analysis), (2) no organic solvent is used for the extraction (eco-friendly), (3) there is a reduced analysis cost due to the omission of the pre-treatment process (cost-effective), (4) it gives highly reliable results due to minimized errors among testers, and (5) it involves a short analysis time compared to HPLC. Due to these advantages, NIR spectroscopy is widely used to analyze foods such as fruits and vegetables [17], cereals [18], bakery [19] and dairy products [20]. In addition, it is applied in the pharmaceutical industry, which requires higher accuracy for the quality control of end products and production lines [21]. Recently, in order to maximize the advantages of NIRS, portable system have also been applied in many fields, such as analyzing the quality of instant green tea [22], the internal quality of citrus fruit [23] and the quality of dairy farm forage [24].
This study aims to verify whether piperine, a representative active ingredient of pepper, can be analyzed using NIRS as a quality control tool combined with chemometric modeling.
2. Materials and Methods
2.1. Chemicals and Materials
The black pepper samples (n = 160) were imported from Vietnam during 2016–2018 by OTTOGI Sesame Co. (Umseoung, Korea). The samples were placed in a dark space at 22–26 °C prior to analysis, and the collected samples were subjected to quarterly piperine analysis. Samples were powdered with a blender (HR 2860, Philips, Shanghai, China) and transferred with 60 mesh sieves for obtaining a ground powder. An analytical grade reference standard of piperine (purity 98.5%) and citric acid as the mobile phase for HPLC were purchased from Sigma (St. Louis, MO, USA). The methanol and acetonitrile of HPLC grade were supplied by Fisher Scientific (Pittsburgh, PA, USA). Deionized water (18.2 MΩ) was purified using an ultra-pure water system (OmniaTap6, Stakpure, Niederahr, Germany).
2.2. Reference HPLC Method for Analyzing Piperine
The piperine profiling was performed as described below [25,26]. For quantitative analysis, approximately 0.1 g of homogenized sample was placed into a 50 mL conical tube to which 50 mL of methanol was added. The mixture was ultrasonically extracted at 50 °C for 20 min, cooled to 25 °C, and filtered through a 0.45 μm regenerated cellulose membrane syringe filter (Sartorius, Göttingen, Germany). HPLC analyses were carried out using an Agilent 1100 HPLC system (Agilent, Santa Clara, CA, USA) with a diode array detector (DAD, 340 nm). An Eclipse C18 plus column (4.6 × 150 mm, 5 μm, Agilent, Santa Clara, CA, USA) was utilized at 25 °C for piperine quantification. The mobile phase was acetonitrile/1% citric acid (45:55, isocratic). The sample injection volume was 10 μL, and the flow rate was 1 mL per minute with a run time of 20 min. ChemStation software Rev.A.10.02, (Agilent, Santa Clara, CA, USA) was applied for all analytical conditions and the chromatographic data processing. Sample qualification and quantification were conducted using the DAD spectra comparing the peak area of chromatograms analyzed with the external calibration curve from the standard solution (20–500 mg/100 g). The piperine content was represented as g/100 g of ground black pepper sample, and the contents determined by HPLC (as a reference data) were compared to the NIRS measurements (as experimental data). Before performing NIRS analysis, the piperine content in ground black pepper was analyzed using HPLC to obtain the reference data.
2.3. NIRS Measurement
The same black pepper sample used for HPLC was used for the NIRS analysis. The NIR equipment was optimized in the reflection mode using a ceramic standard before analysis, and the ground black pepper sample was analyzed in diffuse reflectance mode (model 5000 monochromator, FOSS NIRS Systems Inc., Silver Spring, MD, USA). A small ring cup with a diameter of 50 mm was employed for the sample, and about 3 g of ground black pepper was used for the measurement. The analysis wavelengths ranged between 1100 and 2500 nm, and data were collected from a total of 700 wavelengths at 2 nm intervals. To reduce the noise of each spectrum, 25 scans were averaged with a 2-min measuring time. The laboratory temperature and relative humidity were kept at 22–26 °C and 45–60%, respectively. The NIRS data was collected using WinSIS II software (Foss and Infrasoft International LLC, State College, PA, USA).
2.3.1. Data-Pretreatment
The NIRS spectra data were analyzed by multivariate statistical analysis using the Unscrambler® X, v10.5 (CAMO Software AS, Oslo, Norway). Prior to creating and verifying the chemometrics model, data pretreatment was performed on the obtained NIRS spectrum. Standard normal variate (SNV) is a method that corrects the scattering and dispersion of light in the spectrum and stabilizes the baseline of the spectrum [27]. De-trending (DT) adjusts the change in curvature of the baseline of the SNV that corrects the data by moving the data along the y-axis [28]. Using the Savitzky and Golay smoothing filter, the derivation and smoothing points were adjusted to increase the signal-to-noise ratio, reducing the interference between the medium that disperses light and other materials that absorb light [29].
2.3.2. Chemometrics Development and Evaluating the Prediction Model
The 160 NIRS profiles obtained from the whole samples set were divided into two groups. Group 1 (n = 120) was used for calibration and cross-validation, while group 2 (n = 40) was used for the prediction to be applied to an optimized chemometrics model. To construct the NIRS prediction calibration model, partial least squares (PLS) and principal component (PC) were applied as regression methods. Cross validation to verify the calibration curves was performed on 20 segments (6 samples per each segment) randomly extracted from the calibration set. The numbers of factors were adapted in an optimization process between over-fitting and under-fitting. The performance of the models was evaluated using the coefficient of determination (R2), the root mean square error of performance (RMSE), the standard error of calibration (SEC), the standard error of cross-validation (SECV) and the standard error of prediction (SEP), as well as the ratio performance to deviation (RPD) [30].
3. Results and Discussion
3.1. HPLC Reference Analysis of Piperine in Ground Black Pepper
The ground black pepper (n = 160) used in the experiment was randomly divided into two sets: a calibration set (n = 120, 75%) and a prediction set (n = 40, 25%). The HPLC analysis showed that the piperine content ranged between 3.128 and 6.494 g/100 g (calibration set: 3.289 to 6.169 g/100 g, prediction set: 3.128 to 6.494 g/100 g), and the mean and the standard deviation were 4.689 and 0.599 g/100 g (calibration set) and 4.693 and 0.750 g/100 g (prediction set), respectively. Table 1 is a summary of statistical parameters from the analysis of piperine in ground black pepper. The chemical structure of piperine contains functional groups that are absorbed by the NIR spectroscopy. In addition, the piperine contents, mean and standard deviation were similar between the calibration and prediction sets, as shown in the result of HPLC reference analysis. HPLC analysis results were used as reference data in the chemometric model development using NIRS.

Table 1.
Statistics for piperine in ground black pepper for the calibration and prediction set of the reference method.
Figure 1 shows a histogram with respect to the distribution of piperine contents in the calibration and prediction sets. Since the purpose of this study is to develop an analysis method for the piperine content of ground black pepper using NIRS, the HPLC method was not further considered.
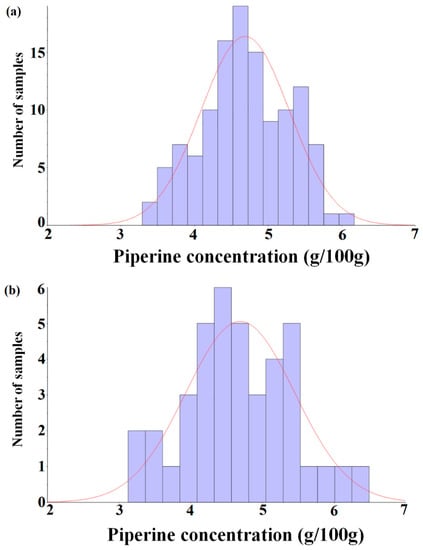
Figure 1.
Histogram of the piperine concentration of the calibration set (n = 120, (a)) and prediction set (n = 40, (b)).
3.2. NIR Spectral Characteristics of P. nigrum and Spectra Pre-Treatment
Figure 2a shows the raw NIR spectra in the 1100 to 2500 nm wavelength range of the ground black pepper (n = 120) used for calibration modeling. The shapes of all 120 spectra were very similar, and about four wavelengths with strong absorption were observed. It was observed that strong absorption occurs near 1450 nm (O-H stretch, first overtone) and 1950 nm (C=O stretch, second overtone). Strong absorption was also determined between 2100 nm and 2300 nm, but it was difficult to establish the exact absorption wavelength as a combination band region over 2100 nm, therefore it was not possible to identify a specific functional group. The spectrum was pre-treated using de-trending (DT), SNV and derivation to obtain a sharper peak shape by minimizing interference from surrounding wavelengths. Figure 2b shows the spectra processed with the DT treatment + SNV + Savitzky–Golay second derivation (polynomial order 2, smoothing point 11) of the raw spectra. As a result of correcting the scattering and dispersion of light in each spectrum, and adjusting the baseline and derivation, the peak shape became sharper than that of the raw spectra, and significant absorption occurred at eight wavelengths, including 1695 nm (C-H stretch, first overtone), 2060 nm (N-H bend, second overtone or N-H bend/N-H stretch, combination), 2280 nm (C-H stretch/CH2, deformation), 2300 nm (C-H bend, second overtone), 2352 nm (CH2 bend, second overtone) and 2470 nm (C-H bend, combination) [31]. These raw NIR spectra of the ground black pepper samples contain O-H bonds, C-H bonds and N-H bonds, but it was difficult to perform quantitative analysis with respect to the molecular structure of piperine due to the overtone and combination of the NIRS spectra.
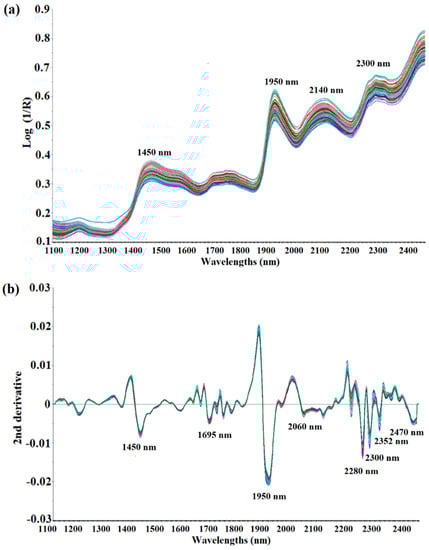
Figure 2.
Raw spectra (a) and second derivative spectra treated with SNV-DT (b) of ground black pepper samples in NIR measurement.
Therefore, a chemometrics model was designed to predict the exact piperine content of ground black pepper using the information of the NIR spectra after mathematical elaboration.
3.3. Development of Chemometrics Models
De-trending (DT) and standard normal variate (SNV) transformation of the mathematical treatments were applied for a better correlation and prediction. The mathematical elaborations were performed with first and second order derivatives, and smoothing points 11 (left 5, center, right 5) and 21 (left 10, center, right 10), applying a Savitzky–Golay smoothing filter.
The results of the partial least squares (PLS) regression modeling were the following: the R2 of the calibration set was in the range of 0.867 to 0.900, the root mean square error of calibration (RMSEC) was in the range from 0.190 to 0.218 g/100 g, and the standard error of calibration (SEC) was between 0.191 and 0.219 g/100 g. The R2 of the cross validation set was in the range of 0.848 to 0.869, the root mean square error of cross-validation (RMSECV) was between 0.218 and 0.236 g/100 g, and the standard error of cross-validation (SECV) ranged from 0.219 to 0.237 g/100 g. In modeling using PLS regression, the optimal conditions were a factor of 5, second derivative order and smoothing point 11. The results of the principal components (PC) regression chemometric modeling, R2, of the calibration set were confirmed to be in the range of 0.745–0.885, RMSEC was between 0.203 and 0.302 g/100 g, and SEC was in the range from 0.204 to 0.304 g/100 g. The R2 of the cross validation set was confirmed to be in the range of 0.733 to 0.868, RMSECV was between 0.219 and 0.312 g/100 g, and SECV ranged from 0.220 to 0.313 g/100 g. In the modeling using PC regression, the optimal conditions (conditions indicating high R2 and low RMSEC, SEC, RMSECV and SECV) were identified as factor 7, second derivative order and smoothing point 21 (Table 2).
Table 2.
Optimum calibration parameters according to partial least squares (PLS) and principal components (PC) regression analyses.
Figure 3 shows a correlation plot of the calibration and cross-validation sets for NIRS measurements of the reference values ((a) PLS, (b) PC). Comparing the PLS and PC values in the same mathematical treatment, the group modeled with PLS showed a better set of values (Table 2) and could be described as a calibration model without underfitting and overfitting with fever latent variables. However, there was no significant difference in the results at optimal conditions, and the prediction model was verified using both models.
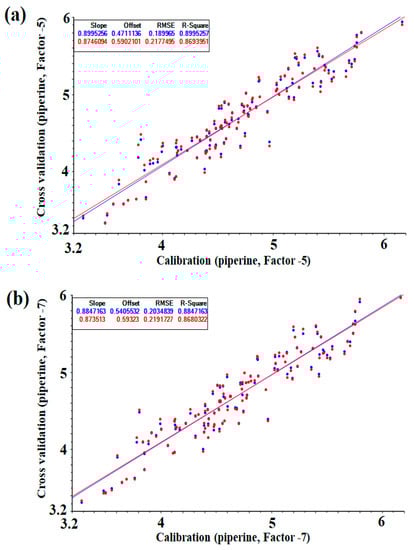
Figure 3.
Correlations plot of calibration and cross-validation values versus NIR predicted by the optimized PLS and PC model (g/100): (a) PLS regression, (b) PC regression.
3.4. Evaluation Parameters for Comparison between Cross-Validation and Prediction Set
After applying the prediction set to the optimized PLS and PC models, we evaluated the prediction against the cross-validation set. Figure 4 shows a correlation plot of reference values and prediction values ((a) PLS, (b) PC).
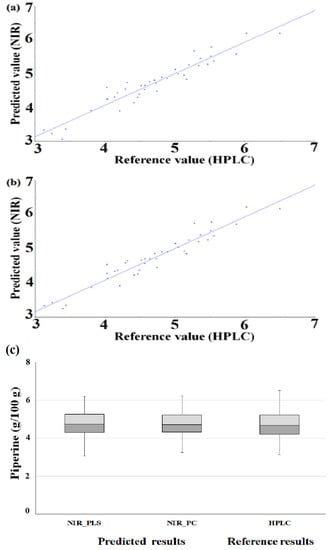
Figure 4.
Method accuracy of developed regression (scatter plot of prediction model by optimized PLS (a) and PC (b) regression (g/100 g), box plot (c)).
In the PLS model, the prediction set had higher R2, RMSEP and SEP values compared to the R2, RMSECV and SECV of the cross-validation set. The prediction set had, compared to the cross-validation set, a good R2 value, and the RMSE and standard error values were also slightly higher. The RPD value was higher than that of the cross-validation set. It was confirmed that the standard deviation of the piperine content of the prediction set was larger than that of the calibration set, thereby improving the RPD value, which is the standard deviation divided by the standard error value. In the PC model, the prediction set had higher R2, RMSEP and SEP vales compared to the R2, RMSECV and SECV of the cross-validation set. The prediction set had excellent R2, RMSE and standard error values, and the RPD value was also higher than that of the cross-validation set (Table 3). The method accuracy of developed regression was evaluated with the box plot. As a result of the box plot of HPLC value and prediction value, the lower and upper quartiles and whiskers of similar ranges were identified (Figure 4c).
Table 3.
Statistics of cross-validation and prediction set for piperine by PLS and PC regression.
Compared to the previous result of the piperine quantification in peppercorn studied by Schulz et al., the optimization of the calibration model was developed through various data-pretreatments in this study, and the statistical values of R2 and SEP were found to be superior to the existing research [32]. Furthermore, we compared these with NIR quantitative analysis results for other bioactive compounds using agricultural products. The results of quantifying the vitamin C content in apples were 0.80, 4.9 mg/100 g and 2.0 for R2, SEP and RPD, respectively [33], and those of quantifying the lycopene content in watermelons were 0.805, 16.19 mg/kg and 2.1 for R2, RMSEP and RPD, respectively [34]. When the total curcumin in turmeric was analyzed, R2 was 0.901, SEP was 0.067 g/100 g and RPD was 3.24 [35]. The R2 was > 0.8 and the RPD > 2.0, and the results of both the PLS and PC models obtained in this study were similar to those of other studies. In general, a higher RPD value indicates a better calibration model for an accurate prediction [36,37]. RPD values 1.5–2.0 show that the model can discriminate low from high values for the response variable. Rough quantitative predictions are possible when a value 2.0–2.5 is indicated, and a value in the range from 2.5 to 3 or above corresponds to an acceptable, up to excellent, prediction accuracy, respectively [38]. Moreover, Chang et al. (2001) defined an RPD < 1.4 as non-reliable, while a fair model is representative of 1.4 < RDP < 2.0, and an RPD > 2.0 is described as an excellent model [39]. Therefore, it was proven that the RPD value of 2.7 or higher (3.5 or higher for the prediction model) obtained in this study was sufficient reason to use NIRS instead of HPLC as a quantification tool for piperine.
4. Conclusions
This study confirmed that the piperine in ground black pepper can be analyzed using NIRS. The NIRS analysis was conducted within 2 min per sample, compared to the HPLC analysis time (20 min) (this is just simply a comparison of the run time of instrument). Considering the time consumption of the pretreatment of the sample and the result interpretation of the HPLC method, NIRS was confirmed to be the more efficient analysis method.
After the spectra treatment, this research identified that the shape of the peak became sharper, and more absorption wavelengths occurred. The development of the PLS and PC regression chemometrics models using NIR spectra was achieved. The mathematical elaborations greatly affected the RMSE, RMSECV and SEP values of the developed chemometric models. In particular, the higher the derivative order, the lower the RMSE, RMSECV and SEP values were, as identified in both the PLS and PC models.
To obtain a better result, it was confirmed that optimization is required. As a result of optimization, the performance parameters of the PLS and PC regressions, according to derivative order, determined that the second derivative order is better than the first derivative order.
The developed model was verified using a prediction set, and high R2, low RMSEP and SEP and excellent RPD values were observed. Comparing the PLS and PC methods in the optimal model, it was shown that PC regression gives better results in the prediction set. However, it was suggested that the PLS model can describe a model developed with fewer latent variables. It was further verified that NIR is an economical and eco-friendly analysis method that has many advantages compared to HPLC, such as a simple pre-treatment process, short analysis time and no use of organic solvents, while obtaining similar results. These results show that NIRS can be applicable as a promising quality control tool to quantify piperine in P. nigrum L. (black pepper).
Author Contributions
Conceptualization, J.-R.P.; Data curation, J.-R.P., and H.-H.K.; Formal analysis, J.-R.P. and H.-H.K.; Funding acquisition, Y.-J.K.; Investigation, H.-H.K.; Methodology, J.-K.C.; Project administration, Y.-J.K.; Supervision, K.-D.M. and Y.-J.K.; Validation, J.-K.C.; Writing—original draft, J.-R.P.; Writing—review and editing, K.-D.M., and Y.-J.K. All authors have read and agreed to the published version of the manuscript.
Funding
This study was supported by the Advanced Research Project (2020-0297) funded by the SeoulTech (Seoul National University of Science and Technology).
Conflicts of Interest
The authors declare that they have no conflict of interest.
References
- Food and Agriculture Organization of the United Nations. Available online: www.fao.org/faostat/en/#home (accessed on 10 March 2020).
- Meghwal, M.; Goswami, T. Piper nigrum and piperine: An update. Phytother. Res. 2013, 27, 1121–1130. [Google Scholar] [CrossRef] [PubMed]
- Sunila, E.; Kuttan, G. Immunomodulatory and antitumor activity of Piper longum Linn. and piperine. J. Ethnopharmacol. 2004, 90, 339–346. [Google Scholar] [CrossRef] [PubMed]
- Quijia, C.R.; Chorilli, M. Characteristics, biological properties and analytical methods of piperine: A review. Crit. Rev. Anal. Chem. 2020, 50, 62–77. [Google Scholar] [CrossRef] [PubMed]
- Priscilla, J.; Arul Dhas, D.; Hubert Joe, I.; Balachandran, S. Spectroscopic, quantum chemical, hydrogen bonding, reduced density gradient analysis and anti-inflammatory activity study on piper amide alkaloid piperine and wisanine. J. Mol. Struct. 2021, 1225, 129146. [Google Scholar] [CrossRef]
- Yu, S.; Liu, X.; Yu, D.; Yang, J. Piperine protects LPS-induced mastitis by inhibiting inflammatory response. Int. Immunopharmacol. 2020, 87, 106804. [Google Scholar] [CrossRef]
- Das, S.; Bera, D.; Pal, K.; Mondal, D.; Karmakar, P.; Das, S.; Dey, A. Guar gum micro-vehicle mediated delivery strategy and synergistic activity of thymoquinone and piperine: An in vitro study on bacterial and hepatocellular carcinoma cells. J. Drug Deliv. Sci. Technol. 2020, 60, 101994. [Google Scholar] [CrossRef]
- de Almeida Gracielle, C.; Danilo, P.; Fokoue, H.H.; Kuster, R.M.; Oliveira, F.L.; Mendes, F.A.; Abreu, J.G. Piperine suppresses the Wnt/β-catenin pathway and has anti-cancer effects on colorectal cancer cells. Sci. Rep. 2020, 10. [Google Scholar] [CrossRef]
- Boddupalli, B.M.; Ramani, R.; Subramaniam, B.; Anisetti, R.N. In vitro and invivo evaluation of hepato protection and anti ulcer activities of piperine gastro retentive micropspheres. Asian Pac. J. Trop. Biomed. 2012, 2, S1237–S1240. [Google Scholar] [CrossRef]
- Lupina, T.; Cripps, H. UV Spectrophotometry Determination of Piperine in Pepper Preparations: Collaborative Study. J. Assoc. Off. Anal. Chem. 1987, 70, 112–113. [Google Scholar] [CrossRef]
- Packiyasothy, E.; Balachandran, S.; Jansz, E. Effect of storage (in small packages) on volatile oil and piperine content of ground black pepper. J. Natl. Sci. Found. Sri Lanka 1983, 11, 111–122. [Google Scholar] [CrossRef]
- Rajopadhye, A.; Upadhye, A.; Mujumdar, A. HPTLC method for analysis of piperine in fruits of Piper species. JPC-J. Planar. Chromat. 2011, 24, 57–59. [Google Scholar] [CrossRef]
- Verzele, M.; Mussche, P.; Qureshi, S. High-performance liquid chromatographic analysis of the pungent principles of pepper and pepper extracts. J. Chromatogr. A 1979, 172, 493–497. [Google Scholar] [CrossRef]
- Rathnawathie, M.; Buckle, K. Determination of piperine in pepper (Piper nigrum) using high-performance liquid chromatography. J. Chromatogr. A 1983, 264, 316–320. [Google Scholar] [CrossRef]
- Wang, Y.; Chen, L.; Chaisiwamongkhol, K.; Compton, R.G. Electrochemical quantification of piperine in black pepper. Food Chem. 2020, 309, 125606. [Google Scholar] [CrossRef] [PubMed]
- Mukherjee, P.K. Quality Control of Herbal Drugs: An Approach to Evaluation of Botanicals; Business Horizons: New Delhi, India, 2002. [Google Scholar]
- Cortés, V.; Blasco, J.; Aleixos, N.; Cubero, S.; Talens, P. Monitoring strategies for quality control of agricultural products using visible and near-infrared spectroscopy: A review. Trends Food Sci. Technol. 2019, 85, 138–148. [Google Scholar] [CrossRef]
- Xie, L.; Tang, S.; Chen, N.; Luo, J.; Jiao, G.; Shao, G.; Wei, X.; Hu, P. Optimisation of near-infrared reflectance model in measuring protein and amylose content of rice flour. Food Chem. 2014, 142, 92–100. [Google Scholar] [CrossRef]
- Wang, H.; Lv, D.; Dong, N.; Wang, S.; Liu, J. Application of near-infrared spectroscopy for screening the potato flour content in Chinese steamed bread. Food Sci. Biotechnol. 2019, 28, 955–963. [Google Scholar] [CrossRef]
- Karoui, R.; De Baerdemaeker, J. A review of the analytical methods coupled with chemometric tools for the determination of the quality and identity of dairy products. Food Chem. 2007, 102, 621–640. [Google Scholar] [CrossRef]
- Sarraguça, M.C.; Lopes, J.A. Quality control of pharmaceuticals with NIR: From lab to process line. Vib. Spectrosc. 2009, 49, 204–210. [Google Scholar] [CrossRef]
- Sun, Y.; Wang, Y.; Huang, J.; Ren, G.; Ning, J.; Deng, W.; Li, L.; Zhang, Z. Quality assessment of instant green tea using portable NIR spectrometer. Spectrochim. Acta Part A 2020, 240, 118576. [Google Scholar] [CrossRef]
- Santos, C.S.P.; Cruz, R.; Gonçalves, D.B.; Queirós, R.; Bloore, M.; Kovács, Z.; Hoffman, I.; Casal, S. Non-destructive measurement of the internal quality of citrus fruits using a portable NIR device. J. AOAC Int. 2020. [Google Scholar] [CrossRef]
- Rego, G.; Ferrero, F.; Valledor, M.; Campo, J.C.; Forcada, S.; Royo, L.J.; Soldado, A. A portable IoT NIR spectroscopic system to analyze the quality of dairy farm forage. Comput. Eelectron. Agric. 2020, 175, 105578. [Google Scholar] [CrossRef]
- Santosh, M.; Shaila, D.; Rajyalakshmi, I.; Rao, I.S. RP-HPLC method for determination of piperine from Piper longum Linn. and Piper nigrum Linn. J. Chem. 2005, 2, 131–135. [Google Scholar]
- Lee, J.-G.; Kim, D.-W.; Shin, Y.; Kim, Y.-J. Comparative study of the bioactive compounds, flavours and minerals present in black pepper before and after removing the outer skin. LWT Food Sci. Technol. 2020, 125, 109356. [Google Scholar] [CrossRef]
- Rinnan, Å.; Van Den Berg, F.; Engelsen, S.B. Review of the most common pre-processing techniques for near-infrared spectra. TrAC Trends Anal. Chem. 2009, 28, 1201–1222. [Google Scholar] [CrossRef]
- Wu, W.; Walczak, B.; Massart, D.; Prebble, K.; Last, I. Spectral transformation and wavelength selection in near-infrared spectra classification. Anal. Chim. Acta 1995, 315, 243–255. [Google Scholar] [CrossRef]
- Savitzky, A.; Golay, M.J. Smoothing and differentiation of data by simplified least squares procedures. Anal. Chem. 1964, 36, 1627–1639. [Google Scholar] [CrossRef]
- Porep, J.U.; Kammerer, D.R.; Carle, R. On-line application of near infrared (NIR) spectroscopy in food production. Trends Food Sci. Technol. 2015, 46, 211–230. [Google Scholar] [CrossRef]
- Burns, D.A.; Ciurczak, E.W. Handbook of Near-Infrared Analysis; CRC Press: New York, NY, USA, 2001. [Google Scholar]
- Schulz, H.; Baranska, M.; Quilitzsch, R.; Schütze, W.; Lösing, G. Characterization of peppercorn, pepper oil, and pepper oleoresin by vibrational spectroscopy methods. J. Agric. Food. Chem. 2005, 53, 3358–3363. [Google Scholar] [CrossRef]
- Pissard, A.; Fernández Pierna, J.A.; Baeten, V.; Sinnaeve, G.; Lognay, G.; Mouteau, A.; Dupont, P.; Rondia, A.; Lateur, M. Non-destructive measurement of vitamin C, total polyphenol and sugar content in apples using near-infrared spectroscopy. J. Sci. Food Agric. 2013, 93, 238–244. [Google Scholar] [CrossRef]
- Tamburini, E.; Costa, S.; Rugiero, I.; Pedrini, P.; Marchetti, M.G. Quantification of lycopene, β-carotene, and Total soluble solids in intact red-flesh watermelon (Citrullus lanatus) using on-line Near-Infrared Spectroscopy. Sensors 2017, 17, 746. [Google Scholar] [CrossRef] [PubMed]
- Kim, Y.J.; Lee, H.J.; Shin, H.S.; Shin, Y. Near-infrared reflectance spectroscopy as a rapid and non-destructive analysis tool for curcuminoids in turmeric. Phytochem. Anal. 2014, 25, 445–452. [Google Scholar] [CrossRef] [PubMed]
- Roggo, Y.; Chalus, P.; Maurer, L.; Lema-Martinez, C.; Edmond, A.; Jent, N. A review of near infrared spectroscopy and chemometrics in pharmaceutical technologies. J. Pharm. Biomed. Anal. 2007, 44, 683–700. [Google Scholar] [CrossRef] [PubMed]
- Jamrógiewicz, M. Application of the near-infrared spectroscopy in the pharmaceutical technology. J. Pharm. Biomed. Anal. 2012, 66, 1–10. [Google Scholar] [CrossRef] [PubMed]
- Nicolai, B.M.; Beullens, K.; Bobelyn, E.; Peirs, A.; Saeys, W.; Theron, K.I.; Lammertyn, J. Nondestructive measurement of fruit and vegetable quality by means of NIR spectroscopy: A review. Postharvest Biol. Technol. 2007, 46, 99–118. [Google Scholar] [CrossRef]
- Chang, C.-W.; Laird, D.A.; Mausbach, M.J.; Hurburgh, C.R. Near-infrared reflectance spectroscopy–principal components regression analyses of soil properties. Soil Sci. Soc. Am. J. 2001, 65, 480–490. [Google Scholar] [CrossRef]


© 2020 by the authors. Licensee MDPI, Basel, Switzerland. This article is an open access article distributed under the terms and conditions of the Creative Commons Attribution (CC BY) license (http://creativecommons.org/licenses/by/4.0/).