Article

100% Renewable Energy Grid for Rural Electrification of Remote Areas: A Case Study in Jordan

1
Mechanical Engineering Department, University of Kentucky, Lexington, KY 40506, USA
2
Department of Electrical and Computer Engineering, Kansas State University, Manhattan, KS 66506, USA
3
Institute of Research for Technology Development (IR4TD), University of Kentucky, Lexington, KY 40506, USA
4
Mechanical Engineering Program, Middle East Technical University Northern Cyprus Campus, Kalkanli, Guzelyurt via Mersin NCC 99738, Turkey
5
Electrical and Electronics Engineering Program, Middle East Technical University Northern Cyprus Campus, Kalkanli, Guzelyurt via Mersin NCC 99738, Turkey
*
Authors to whom correspondence should be addressed.
Energies 2020, 13(18), 4908; https://doi.org/10.3390/en13184908
Submission received: 28 August 2020 / Revised: 13 September 2020 / Accepted: 17 September 2020 / Published: 18 September 2020
(This article belongs to the Special Issue Green Energy Technology)

Abstract

:
Many developing countries suffer from high energy-import dependency and inadequate electrification of rural areas, which aggravates the poverty problem. In this work, Al-Tafilah in Jordan was considered as a case study, where the technical, economic, and environmental benefits of a decentralized hybrid renewable energy system that can match 100% of the city demand were investigated. A tri-hybrid system of wind, solar, and hydropower was integrated with an energy storage system and optimized to maximize the match between the energy demand and production profiles. The optimization aimed at maximizing the renewable energy system (RES) fraction while keeping the levelized cost of electricity (LCOE) equal to the electricity purchase tariff. The techno-economic analysis showed that the optimal system in Al-Tafilah comprises a 28 MW wind system, 75.4 MW PV, and 1 MW hydropower, with a 259 MWh energy storage system, for which a RES fraction of 99% can be achieved, and 47,160 MtCO2 are avoided yearly. This study can be easily extended to other rural cities in Jordan, as they have higher renewable energy system (RES) potential. The presented findings are essential not only for Jordan’s planning and economy-boosting but also for contributing to the ongoing force against climate change.

Graphical Abstract

1. Introduction

Energy is the most important ingredient in both developing and developed countries that contributes to the overall economic and social development [1,2,3]. There is a strong relationship between energy sources availability and economic growth and hence social development. Studies revealed that energy demand is rapidly increasing globally. It is expected to increase by about 65% in the developing countries and approximately about 34% on the global scale by 2040 [4]. This is due to several factors, including fast-paced prosperity, economic expansion, and continuous population growth. However, during the last 25 years, the reality and impact of environmental degradation have become visible as a result of a combination of factors such as increased energy demand and industrialization, which both imposed stress on energy production. Nowadays, conventional energy production systems—Namely fossil fuel-based systems—Are considered to be the primary cause of the increased environmental degradation due to their carbon dioxide (CO2) emissions [5]. According to Timmerberg et al. [6], the estimated rate of CO2 emissions in the Middle East region is 0.396–0.682 kg CO2 kWh−1, which means a considerable amount of CO2 is released into the atmosphere. However, as they indicated, if the target for 2030 of the renewable energy share is met, the electricity-production CO2 emissions are expected to drop to 0.341–0.514 kg CO2 kWh−1. Attaining solutions to such environmental problems that we face today, long-term planning and actions become vital for sustainable development [1]. Also, a large portion of the industry’s research is heavily focused on advancements that reduce operational [7,8] or mending energy [9,10]. Besides, more importantly, renewable energy sources play a significant role in mitigating environment-related problems as they are environmentally friendly with affordable and competitive costs relative to conventional energy systems [11,12,13].
Jordan is one of the developing countries in the Middle East, with more than 97% of its energy being imported. This has a significant impact on the country’s economy [14]. Moreover, the energy security of the country is threatened by the fluctuations of fossil fuel prices as well as the disruption of fossil fuel supplies, which happened in 2011 [15]. The most affected zones are usually rural areas, where infrastructure is not quite robust, and the electrical service coverage is weak. According to the economic research service of the United States Department of Agriculture [16], the delineation introduced in 2000 defines countryside with 500 people per square miles or less as rural areas. Developing countries’ poverty problem is aggravated by inadequate electrification of these remote sites. In Malaysia, for example, around 809 schools do not have a 24-hour electricity supply [17]. Modern energy forms are considered an economic good that can lift up the life of billions worldwide, predominantly in developing countries that lack service availability [18,19]. That said, from an economic standpoint, grid transmission through the impenetrable terrains and dense forests to supply a small village is not viable. Therefore, because of the high distribution cost and accompanying transmission losses, serving rural areas become unfeasible [17]. To avoid these high costs accompanying transmission via national grids, decentralized energy systems can be used [18]. Small-scale hydropower, wind, photovoltaic (PV), and diesel-engine generator are amongst the common off-grid electrification systems used in the developing regions; for instance in, Africa, the Caribbean, Latin America, and Asia [18]; nonetheless, most of the population in rural areas (>2.4 billion individuals worldwide), still rely on traditional fuels for cooking.
As discussed in [18], consideration of renewable energy systems (RES) as part of the remedy for rural electrification is of particular importance. This is because most of the previous attempts for conventional electrification of remote areas in developing countries were not successful. If the right policy is adopted, sustainable-development technology comprises an effective means for reducing energy poverty [17]. Solar, wind, and hydro technology are feasible and reliable energy sources. They can be used to generate off-grid electricity and assist in the rural-electrification capacity-expansion; nevertheless, the technical-, installation-, and social issues should be accounted for to ensure the project success [17]. Additionally, the importance of utilizing the Internet of Things (IoT) paradigm when integrating renewable energy sources into smart grids was discussed in the literature [20,21]. This provides a powerful tool for simultaneous monitoring and control of the resources. For instance, [22] provides a novel framework for state estimation in wind-turbine integrated grids.
Along with conventional Supervisory Control and Data Acquisition (SCADA) measurement methods, the IoT provides information about the resources in very short time frames, which can be utilized for control or monitoring purposes. Other literature investigated the use of IoT in energy-aware residential buildings [23]. Here, the IoT paradigm helps not only in appliance automation but also in monitoring household energy demand and remote control of appliances during peak and off-peak hours, which has tremendous economic value on the monthly rates of the household.
The shortcoming of remote areas being far from the capital cities can be utilized for our advantage, as it offers a large area of uninhabited land that can be used to build renewable systems. The government in Jordan should focus on maximizing the utilization of the available resources to decrease the dependency on fossil fuel. Jordan has a great potential of RES that can cover the country’s energy needs if implemented wisely, especially wind and solar resources [14,15,24,25,26]. However, solar and wind energies fluctuate with time. They do not match the demand profile, which forms a challenging issue related to energy security, power grid quality, and reliability of such systems [27]. The hybridization of solar and wind resources increases the reliability of the system and enhances the matching between demand and supply. Few studies investigated the potential of RES in Jordan. For instance, Essalaimeh et al. [28] found that the electricity generated by a combination of solar and wind energy grid-connected systems can be utilized for various types of applications, including space heating and cooling. Halasa and Asumadu [29] demonstrated the feasibility of having large scale wind and solar hybrid power systems in Jordan, where wind energy was placed in the mountains of Northern Jordan and Solar energy in the Eastern Desert. The installation costs were approximated to be US$290 million for the 100 – 150 MW wind farm and US$560 million for the 100 MW solar. Another study [30] proposed an off-grid hybrid solar PV and wind energy systems in two locations in Jordan, Alhasan industrial estate, and Alayn Albayda, taking economic, reliability, and sustainability measures into consideration.
Furthermore, a grid-connected hybrid system consisting of solar PV and wind turbines was proposed in [31]. The system was investigated at four different locations in Jordan, and results showed that it could power a small village in Jordan. However, in the latter study, no-optimization of the system’s size or economic feasibility was performed. Also, the mismatch between the demand and supply was not considered. The kingdom is rich in solar and wind resources, and also has a considerable potential of hydropower in some regions that can be utilized to supply a significant part of the baseload demand [32]. As such, a tri-hybridization of solar PV, wind, and hydropower forms an effective and environmentally friendly solution that ensures energy security and, at the same time, contributes to the mitigation of greenhouse gases (GHGs) [33,34].
Al-Tafilah governorate, located about 112 miles to the southwest of Amman, the capital of Jordan, spans an area of 853 mi². The population of the governorate is estimated to 106,000 people, which is about 1% of Jordan’s population. This means a population density of 125 people/mi² compared to 6827 people/mi² in the capital city, Amman [35,36], with a total annual electricity demand of 137 GWh. As presented in Kiwan et al. [37], the transition towards a 100% renewable energy grid in Jordan shall be gradual, and about 1/3 of the 2050 total capacity should be installed by 2030. This transition will help Jordan overcome its 94% energy-import dependency. Since Jordan is amongst the signatories to the Paris agreement, it will also help the country adhere to the set emissions limit by reducing its carbon dioxide production associated with electricity generation. In this work, the techno-economic feasibility of installing PV/wind-hydropower systems to supply and match 100% of the electrical demand in Al-Tafilah forecasted for the year 2030 was investigated. Multiple scenarios were considered, including the integration of an energy storage system. Sensitivity analysis was conducted to examine the effect of resources and demand variation, RES costs, and annual discount rate on the techno/economic performance of the system. It’s also worth noting that the expansion of this work to other similar areas in Jordan is possible, as Kiwan et al. [37] showed other rural cities, like AlMafraq and Maan, represent sites of highest hybrid RES potential. Hence, Al-Tafilah signifies the more challenging case towards a 100% renewable energy grid and is therefore considered here. As such, the presented study will not only set forth a decentralized system that will suffice the city of its energy needs while mitigating the issues mentioned above of centralized grids. It will also open the doors for consideration of rural renewable decentralized systems as part of the 2030 projection for the 100% renewable transition presented by Kiwan et al.

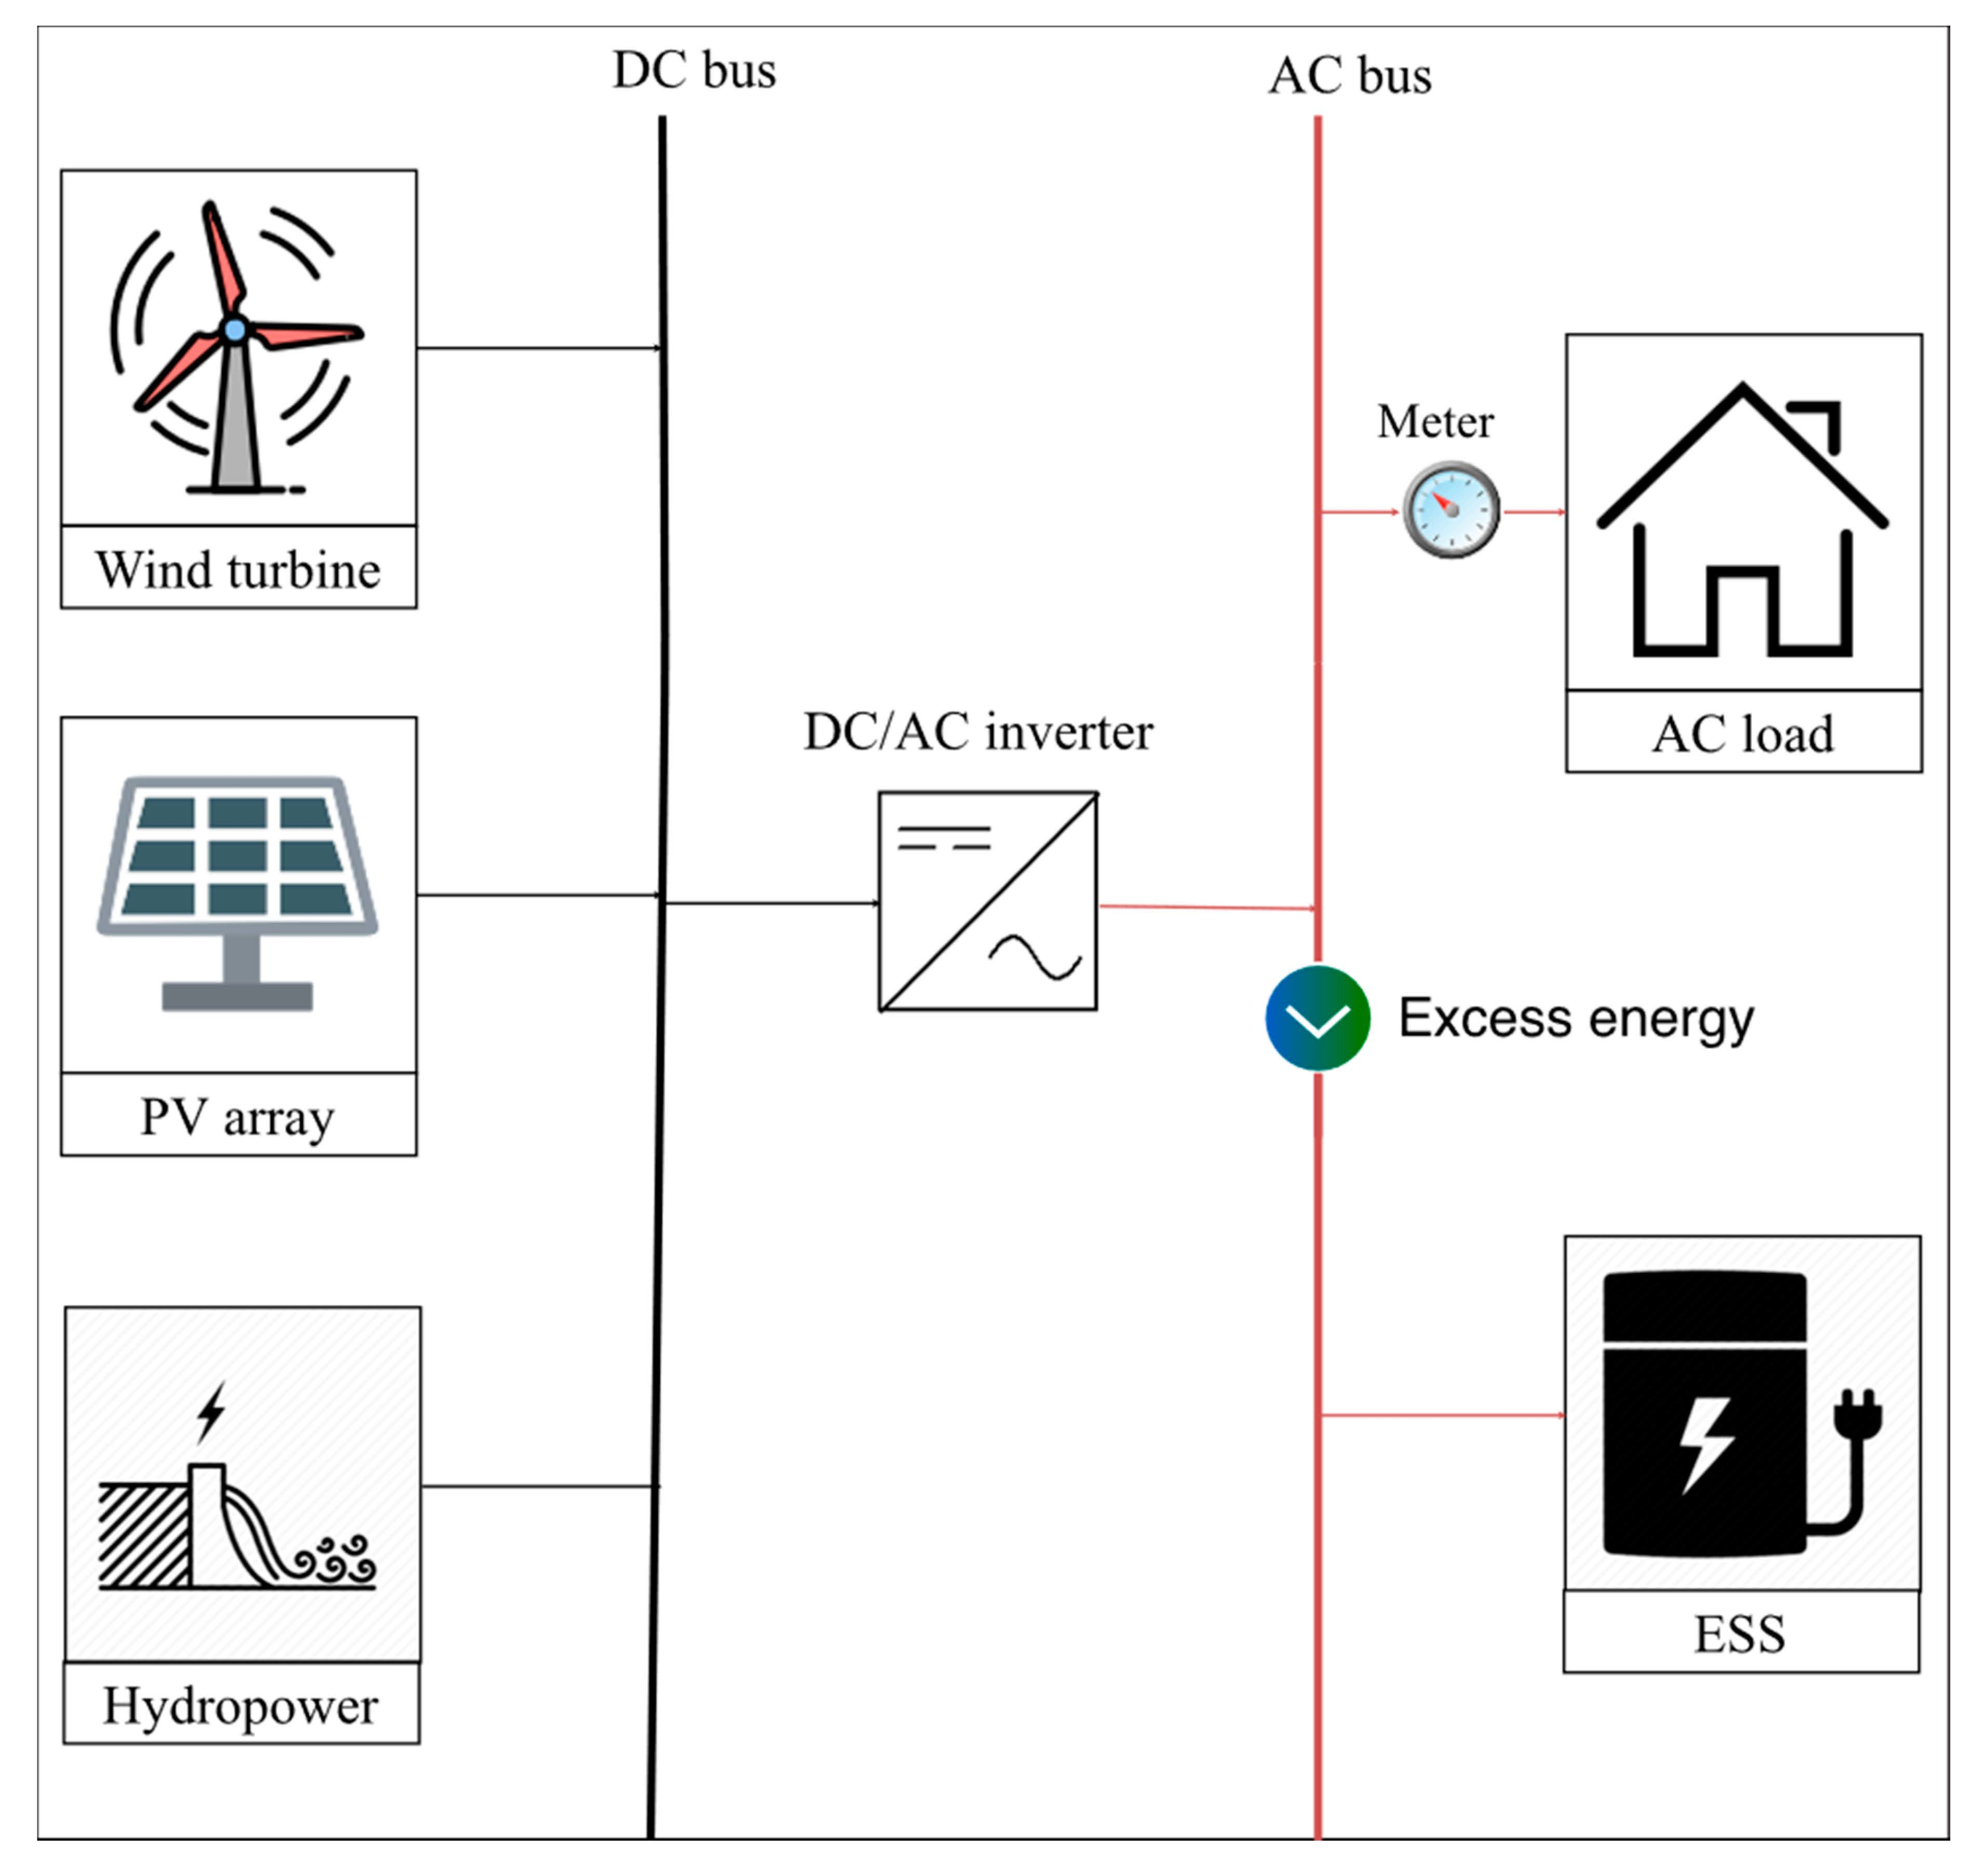
2. System Description and Methodology

2.1. RES Description

2.1.1. Solar Energy System

The ambient conditions of the location where the PV plant is installed affect the efficiency of the PV module and hence the energy production. As the module temperature increase, the PV efficiency decreases, and so does the amount of produced energy. By neglecting the effects of relative humidity and wind speeds and considering the effect of the ambient temperature, the efficiency of the PV module can be estimated using Equation (A1) shown in Appendix A.
The specifications of the PV modules are vital for the estimation of the energy output from the PV system. In this study, a Canadian Solar company type CS6K-285M modules were used. Obtaining the global insolation on the PV module in addition to the module efficiency is necessary for the estimation of the energy produced. The estimation of the global insolation was achieved using the methodology presented by Duffie and Beckman [38], which was not included here for brevity. The hourly energy generated from the PV power plant, Ep, can be calculated, as shown in A.2. The hourly solar resources, as well as the hourly ambient temperature for Al-Tafilah, were obtained using Meteonorm software, which provides the data based on Typical Metrological Year (TMY).

2.1.2. Wind Energy System

The wind speed at hub height varies depending on several factors, such as the wind speed at ground level, the hub height, time (hour, day, season), the nature of the terrain, and the ambient temperature. These variables can be represented by one factor known as the wind profile exponent or wind shear coefficient (α). In the absence of the site-specific data, can be taken as 1/7 [39,40]. The wind speed at hub height (uZ) can be extrapolated using equation A.3. By assuming that the energy generated is constant during the hour and each turbine generates the same amount in the case of having multiple turbines, the total hourly electrical energy generated by a wind turbine(s), Ew, can be estimated by A.4 in App. An under wind energy model section. The Weibull distribution shape parameter of the available wind speed, K can be calculated based on Justus theory using Equation (A5). A wind turbine with 2 MW of rated power from GAMESA company (G114-2.0) was used in this study. It should be noted the hourly TMY wind speeds at ground level were obtained from Meteonorm software.

2.1.3. Hydropower System

Al-Tafilah has the potential to construct two small hydropower systems with a total capacity (Ph) of 1 MW, as reported in [32]. In this study, a 1 MW hydropower system with capacity factor (CFh) of 80% [41] is designed to provide continuous energy generation as part of the baseload of Al-Tafilah, where the annual energy production from the hydropower system, Eh, can be estimated as shown in A.6.

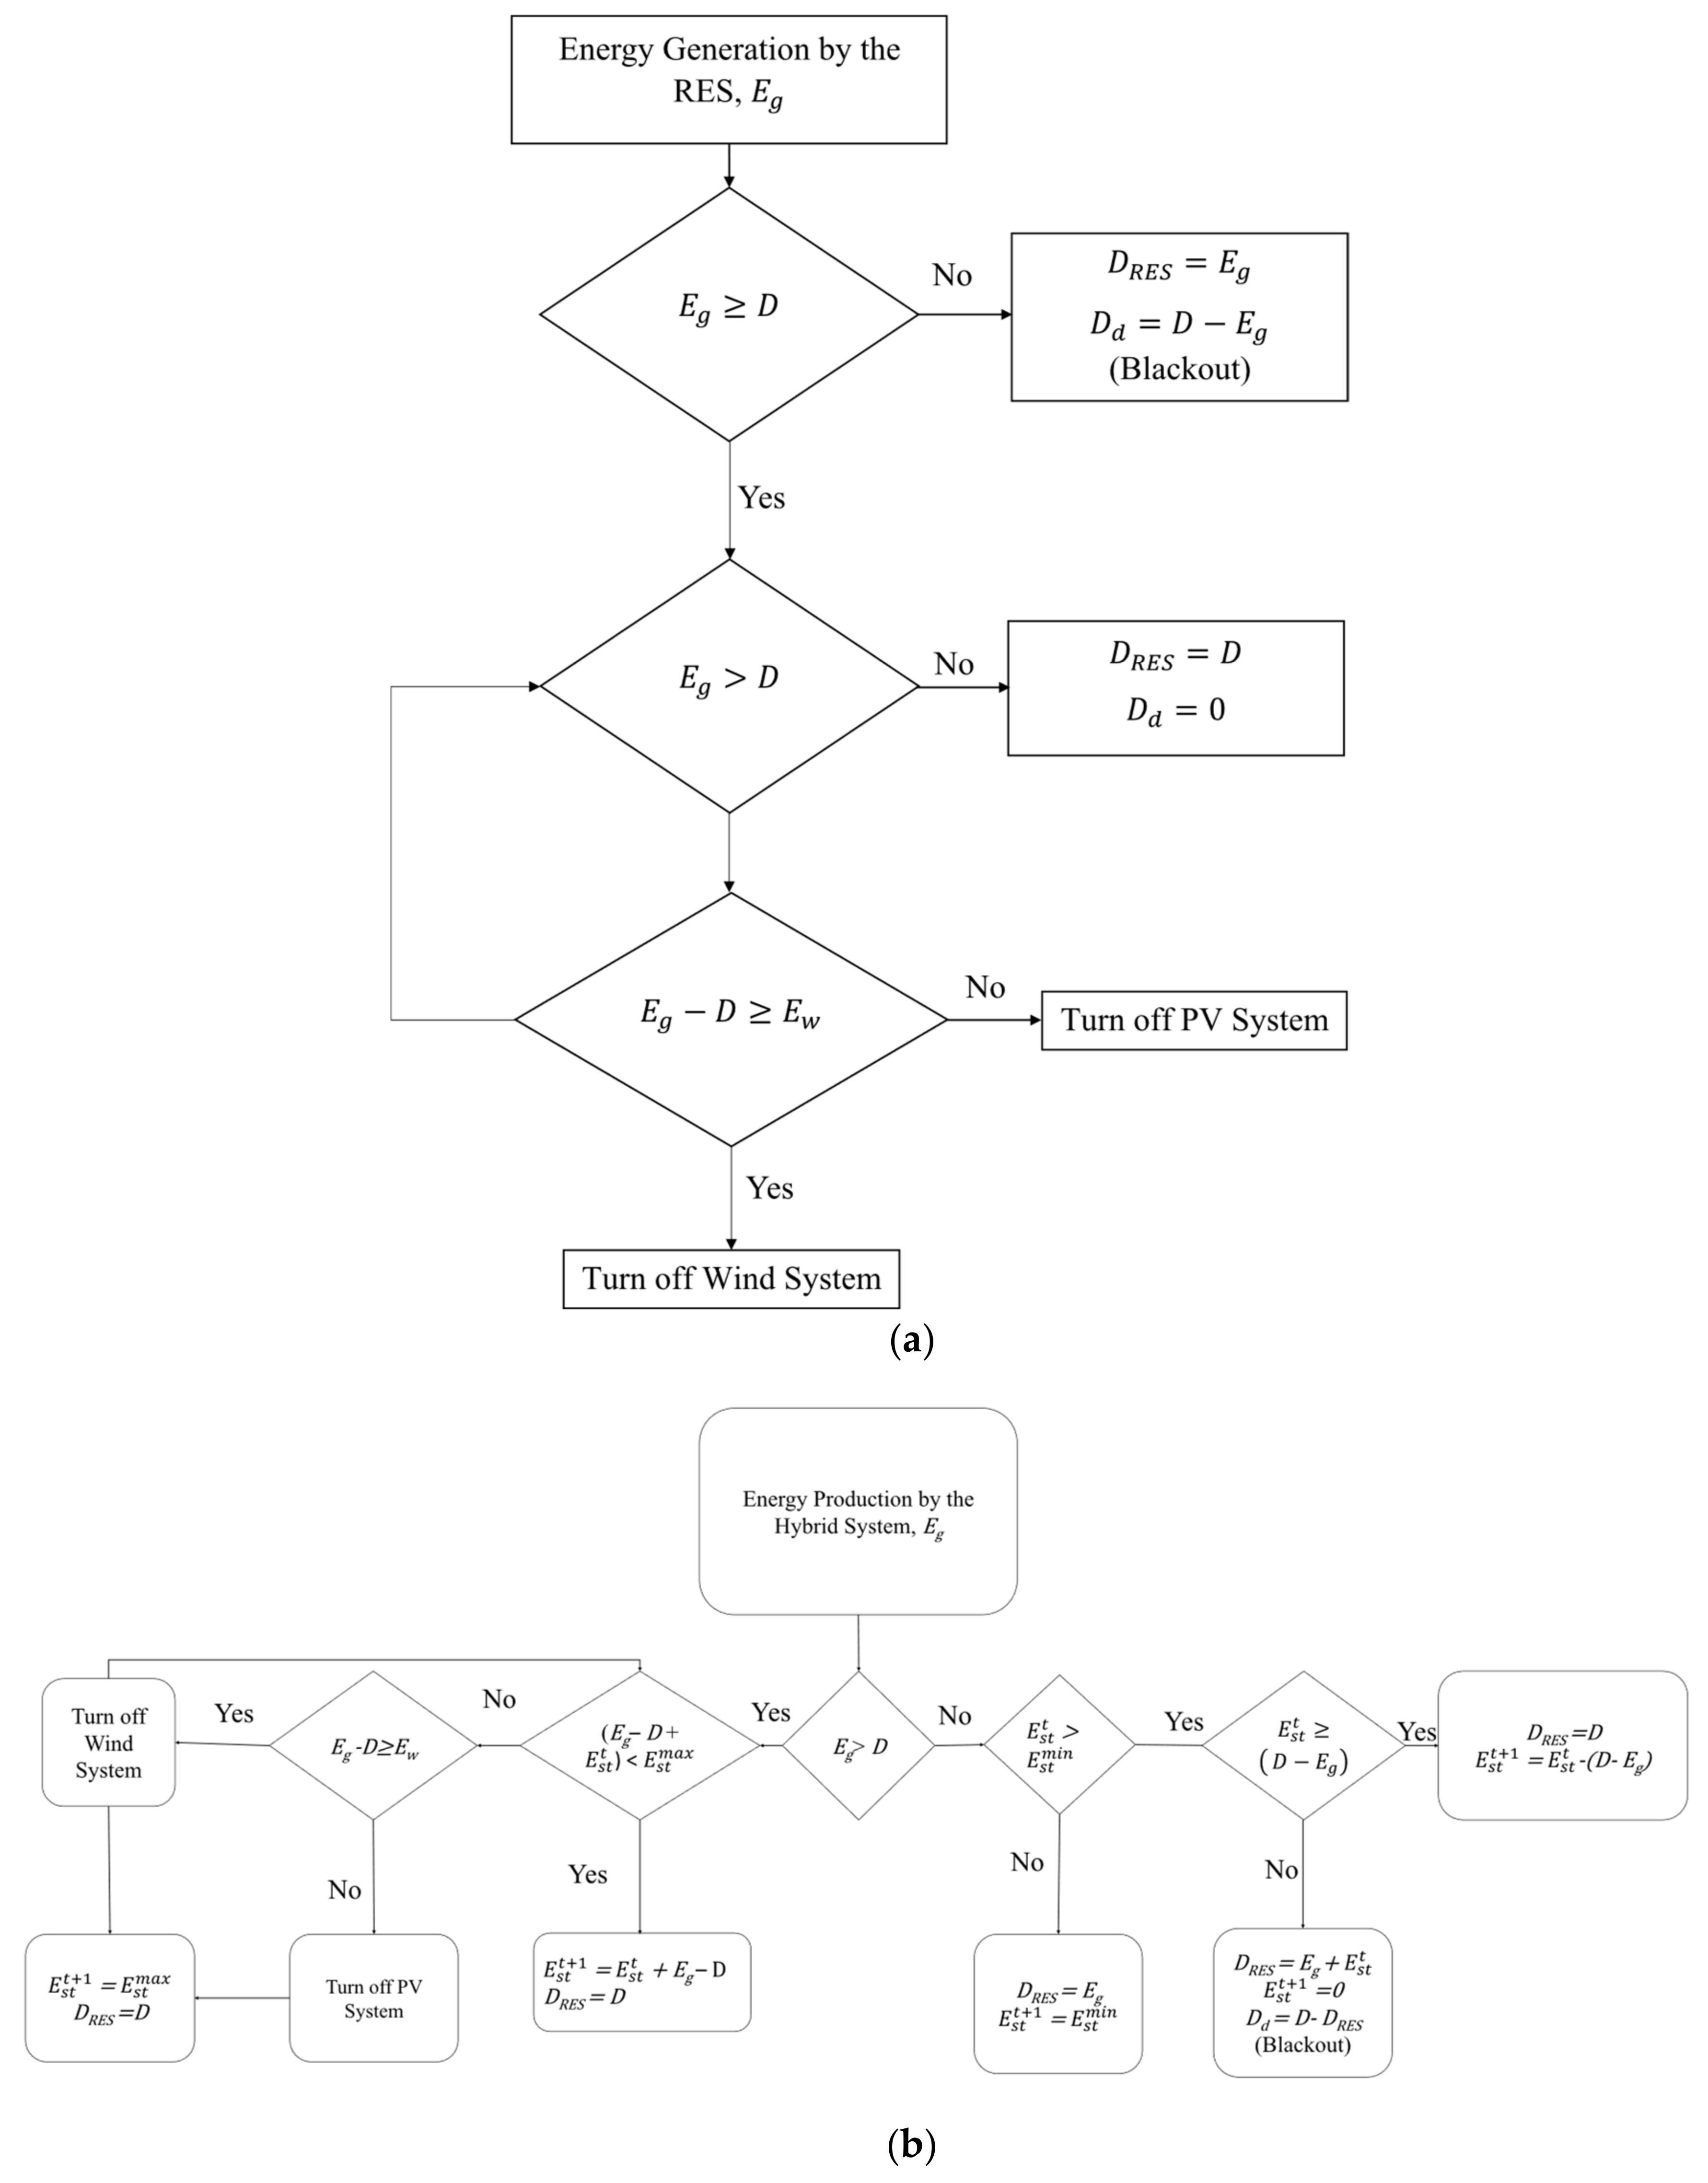
2.2. System Modelling and Energy Flow: With and Without an Energy Storage System

Energy Storage System is introduced into the power system as a solution for the intermittent behavior of renewable energy resources. This way, is it possible to reach a match between supply and demand. In this work, two scenarios consisting of and without an Energy Storage System (ESS) are adopted and discussed for the fitness of a hybrid off-grid system to supply the electricity demand of Al-Tafilah. Flow chart for with and without ESS are introduced in Figure 1. In comparison with other batteries for the ESS, this study considered Zinc-Bromine batteries (ZBB) as they show better performance and lower cost. In this study, the round-trip efficiency of the ZBB was taken as 72% and the depth of discharge was considered as 80% as reported in [42,43].
To inspect the matching between the energy production from the hybrid system and the demand, the RES Fraction (FH), which represents the annual fraction of demand met by the RES, was used. FH can be calculated by A.7. The forecasted demand of 2030 was used in this study, where the average hourly demand of Al-Tafilah in 2010 obtained from [44] was used for estimating the 2030 demand. The population of 2030 was forecasted using the Piecewise Cubic Hermite Interpolating Polynomial method, where 1994, 2004, 2015, and 2019 populations were used for this forecast [35,36].

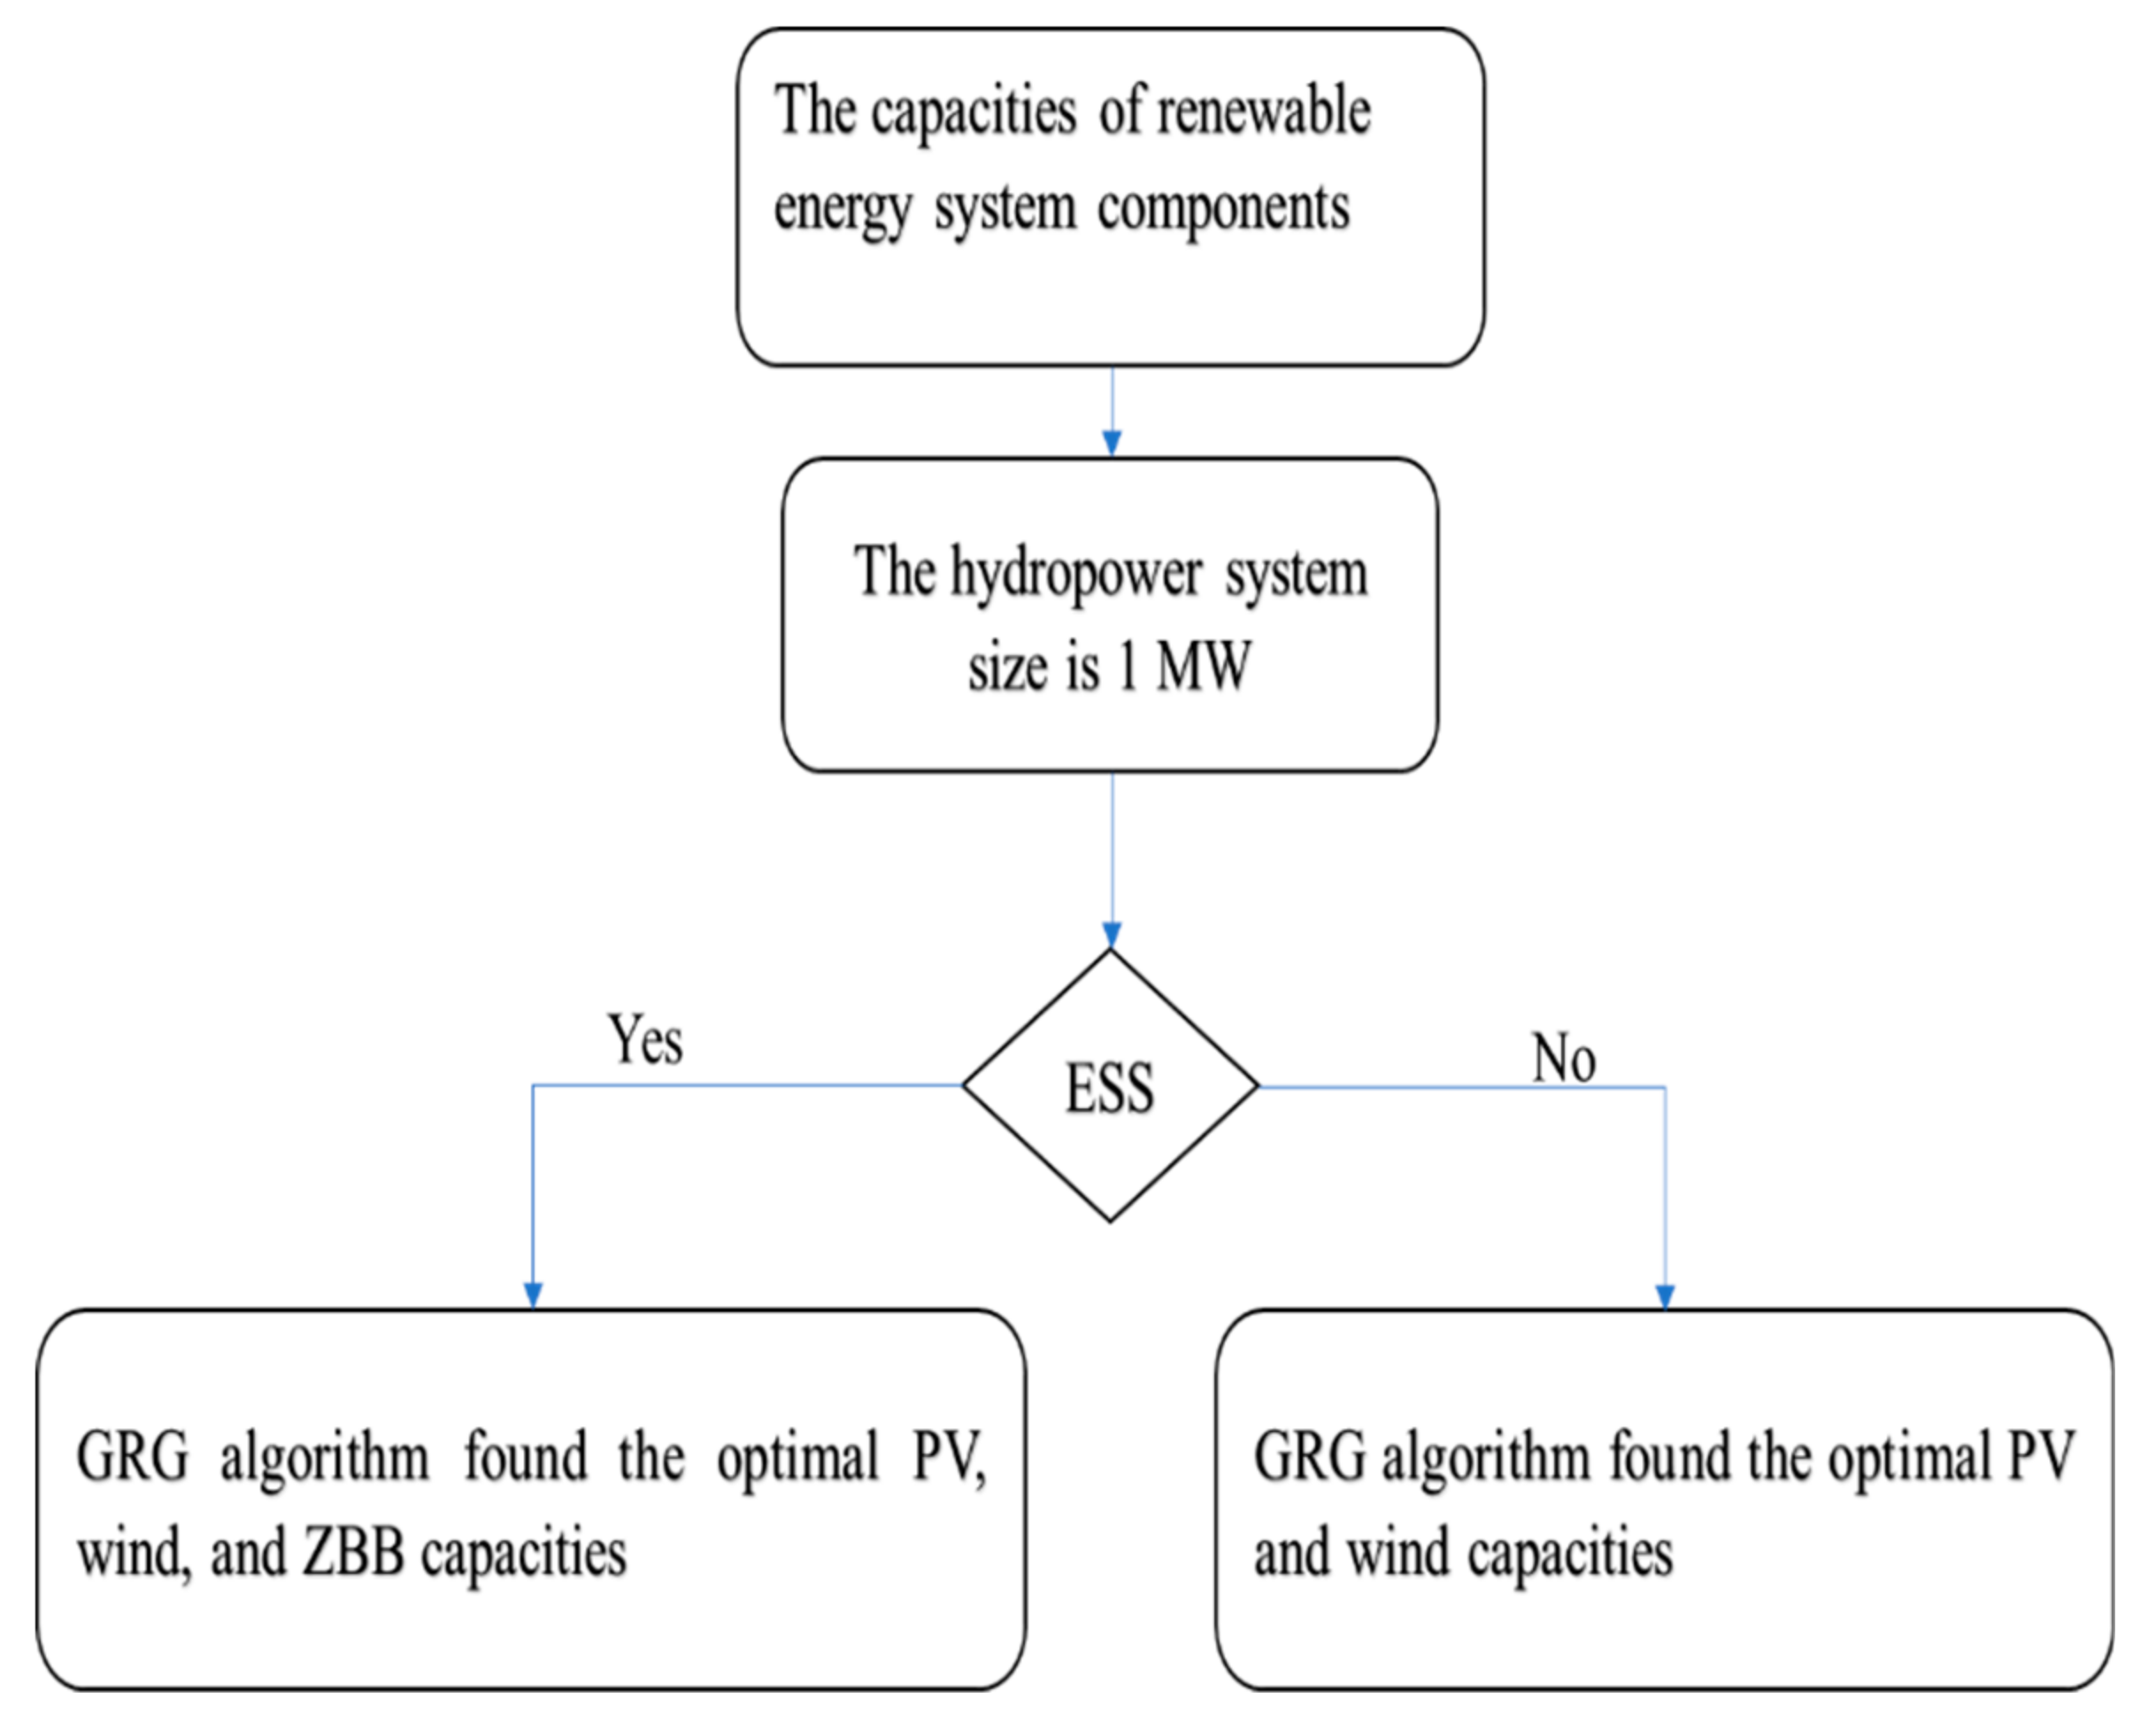
2.3. Optimization Procedure

As the hybrid system operating variables have a nonlinear relation, it is required to find a nonlinear solving algorithm to catch the optimal design. Therefore, the Generalized Reduced Gradient (GRG) algorithm was used. This algorithm can figure out the capacities of the hybrid systems. The adoption of the optimization procedure is depicted in Figure 2. Moreover, the optimization objective, constraints, and decision variables are given in Table 1.

2.4. Economic Assessment and System’s Feasibility

The economic feasibility of the energy system is vital as the technical feasibility wherein most of the cases, the choice of decision-makers is based on the economic feasibility of the project. The levelized cost of electricity (LCOE) is one of the economic parameters that is used to determine the economic feasibility of the energy systems. LCOE for the hybrid system can be calculated using Equation (A8) to incorporate the effect of the mismatching between the energy generation and the demand, the demand met by the hybrid system was used instead of the energy generation [45,46]. Table 2 shows all the economic parameters used in this study.

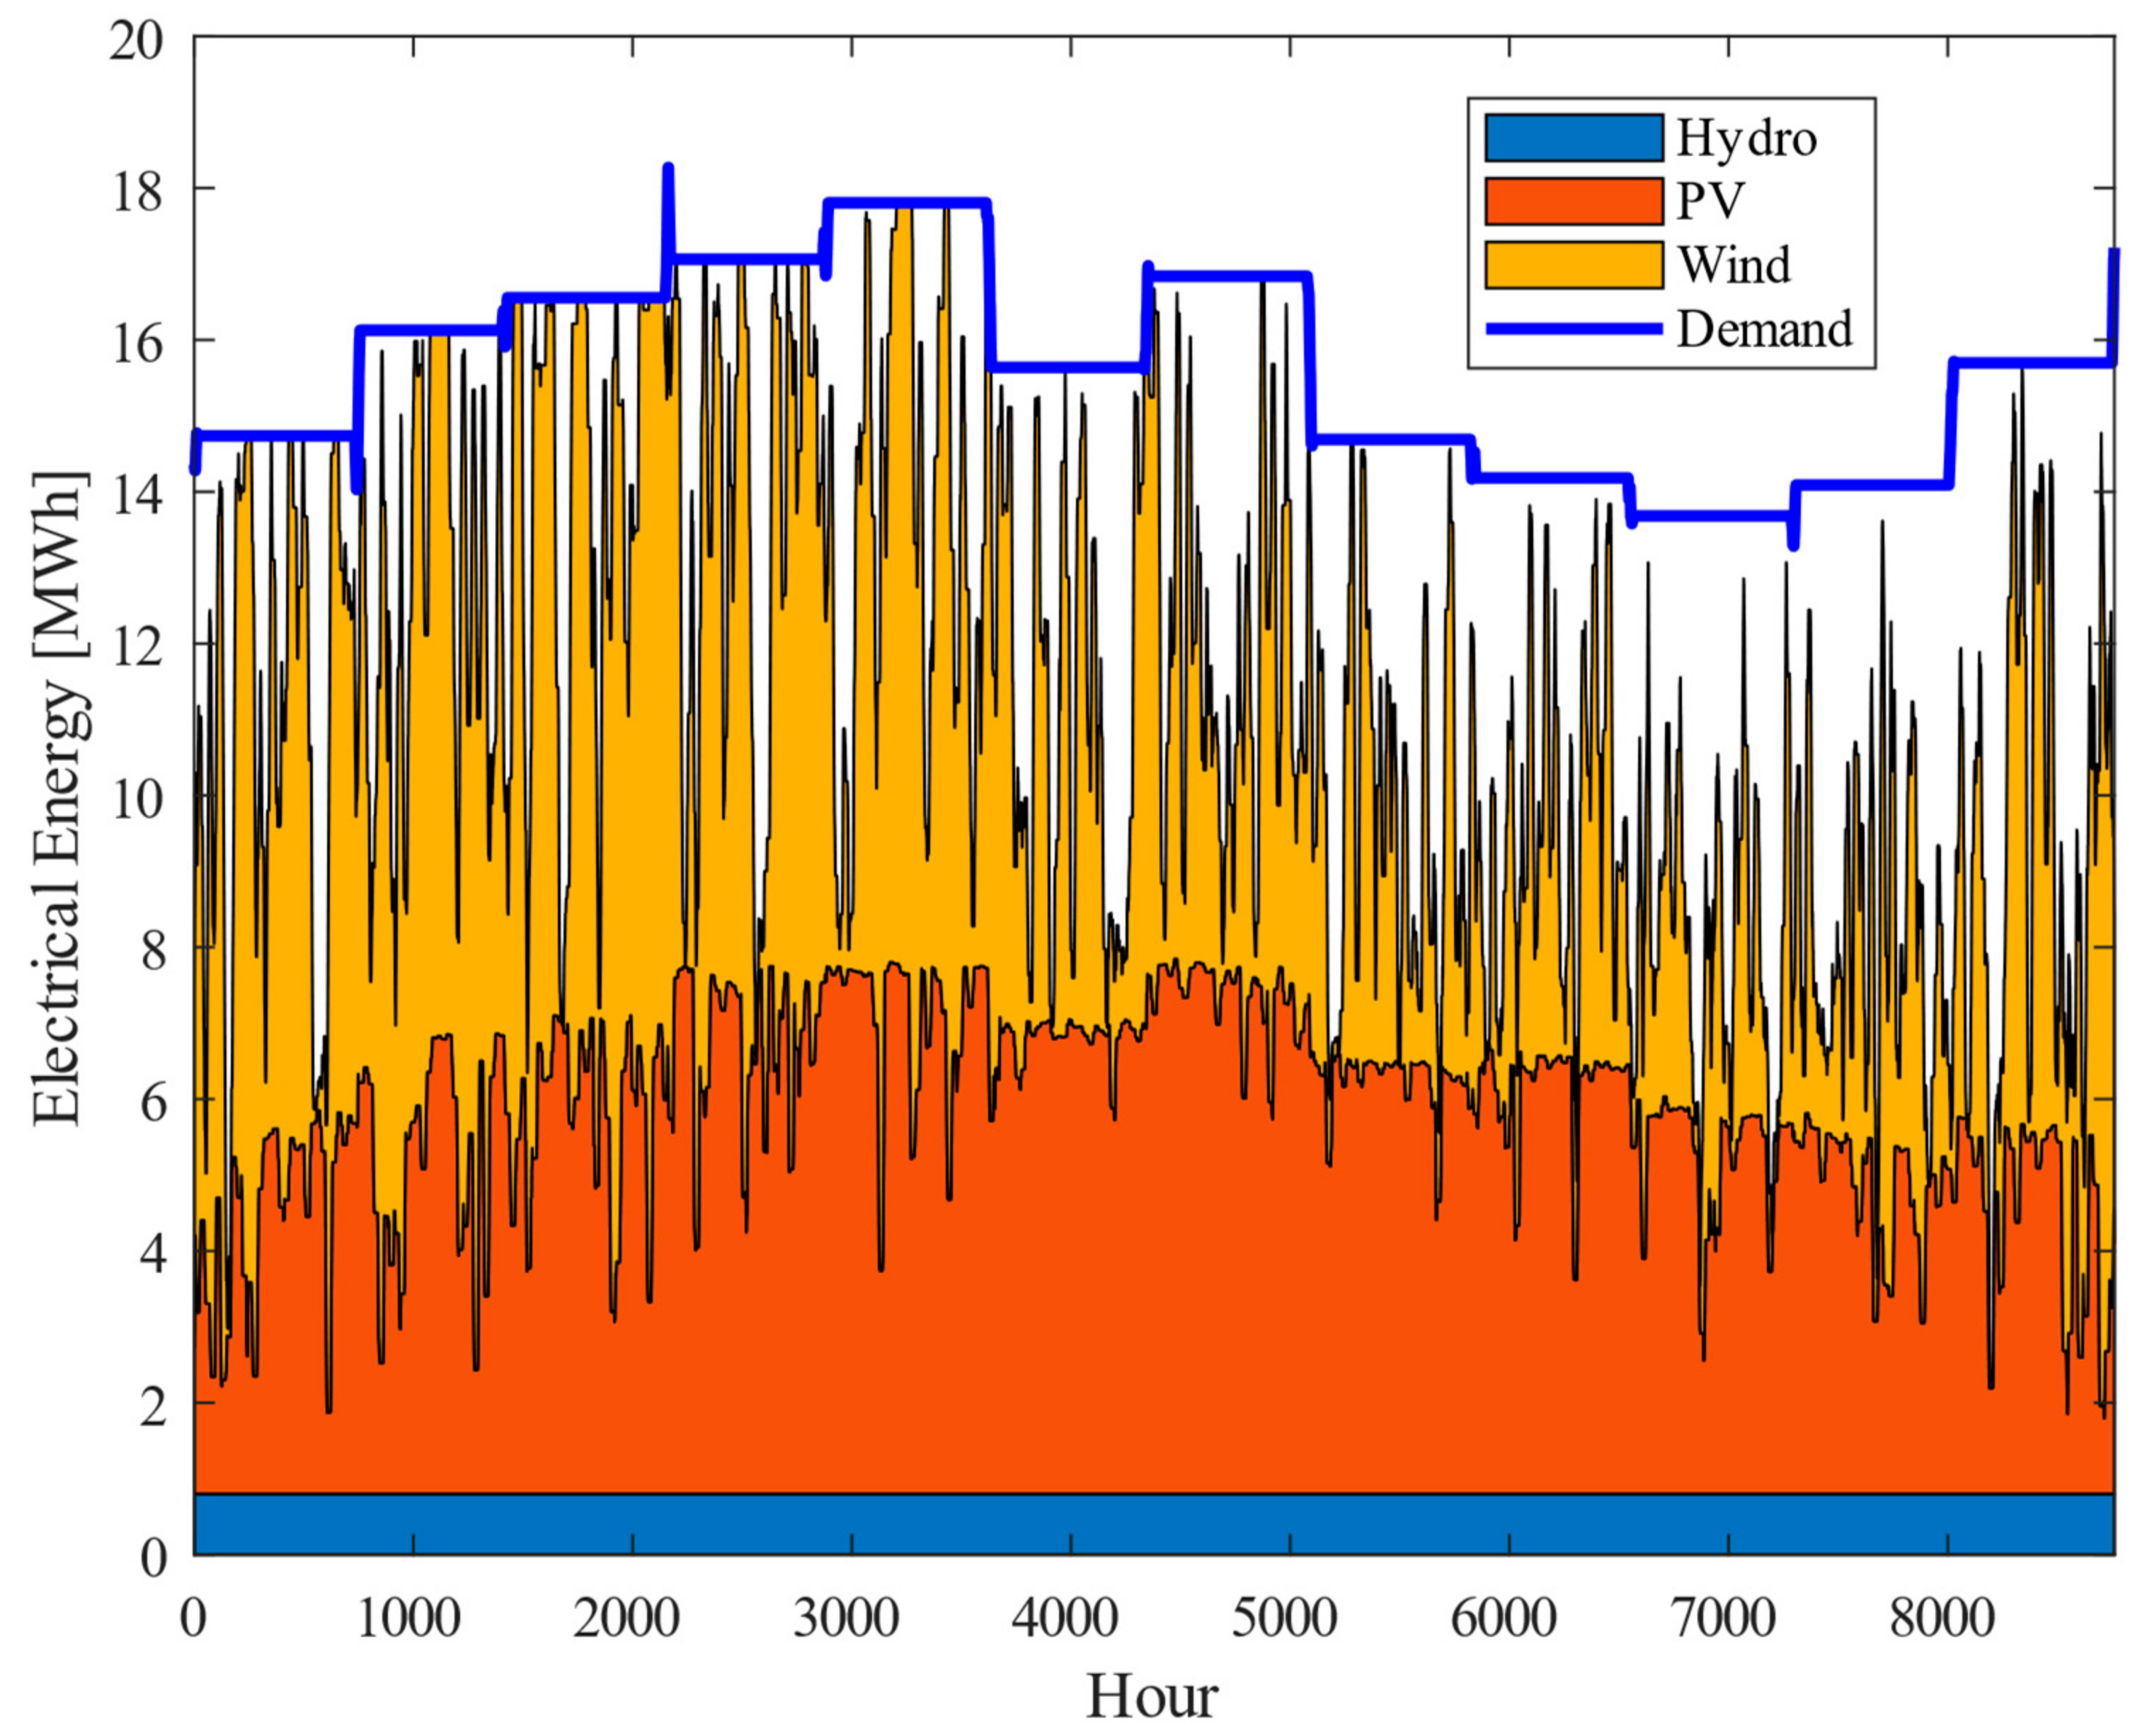
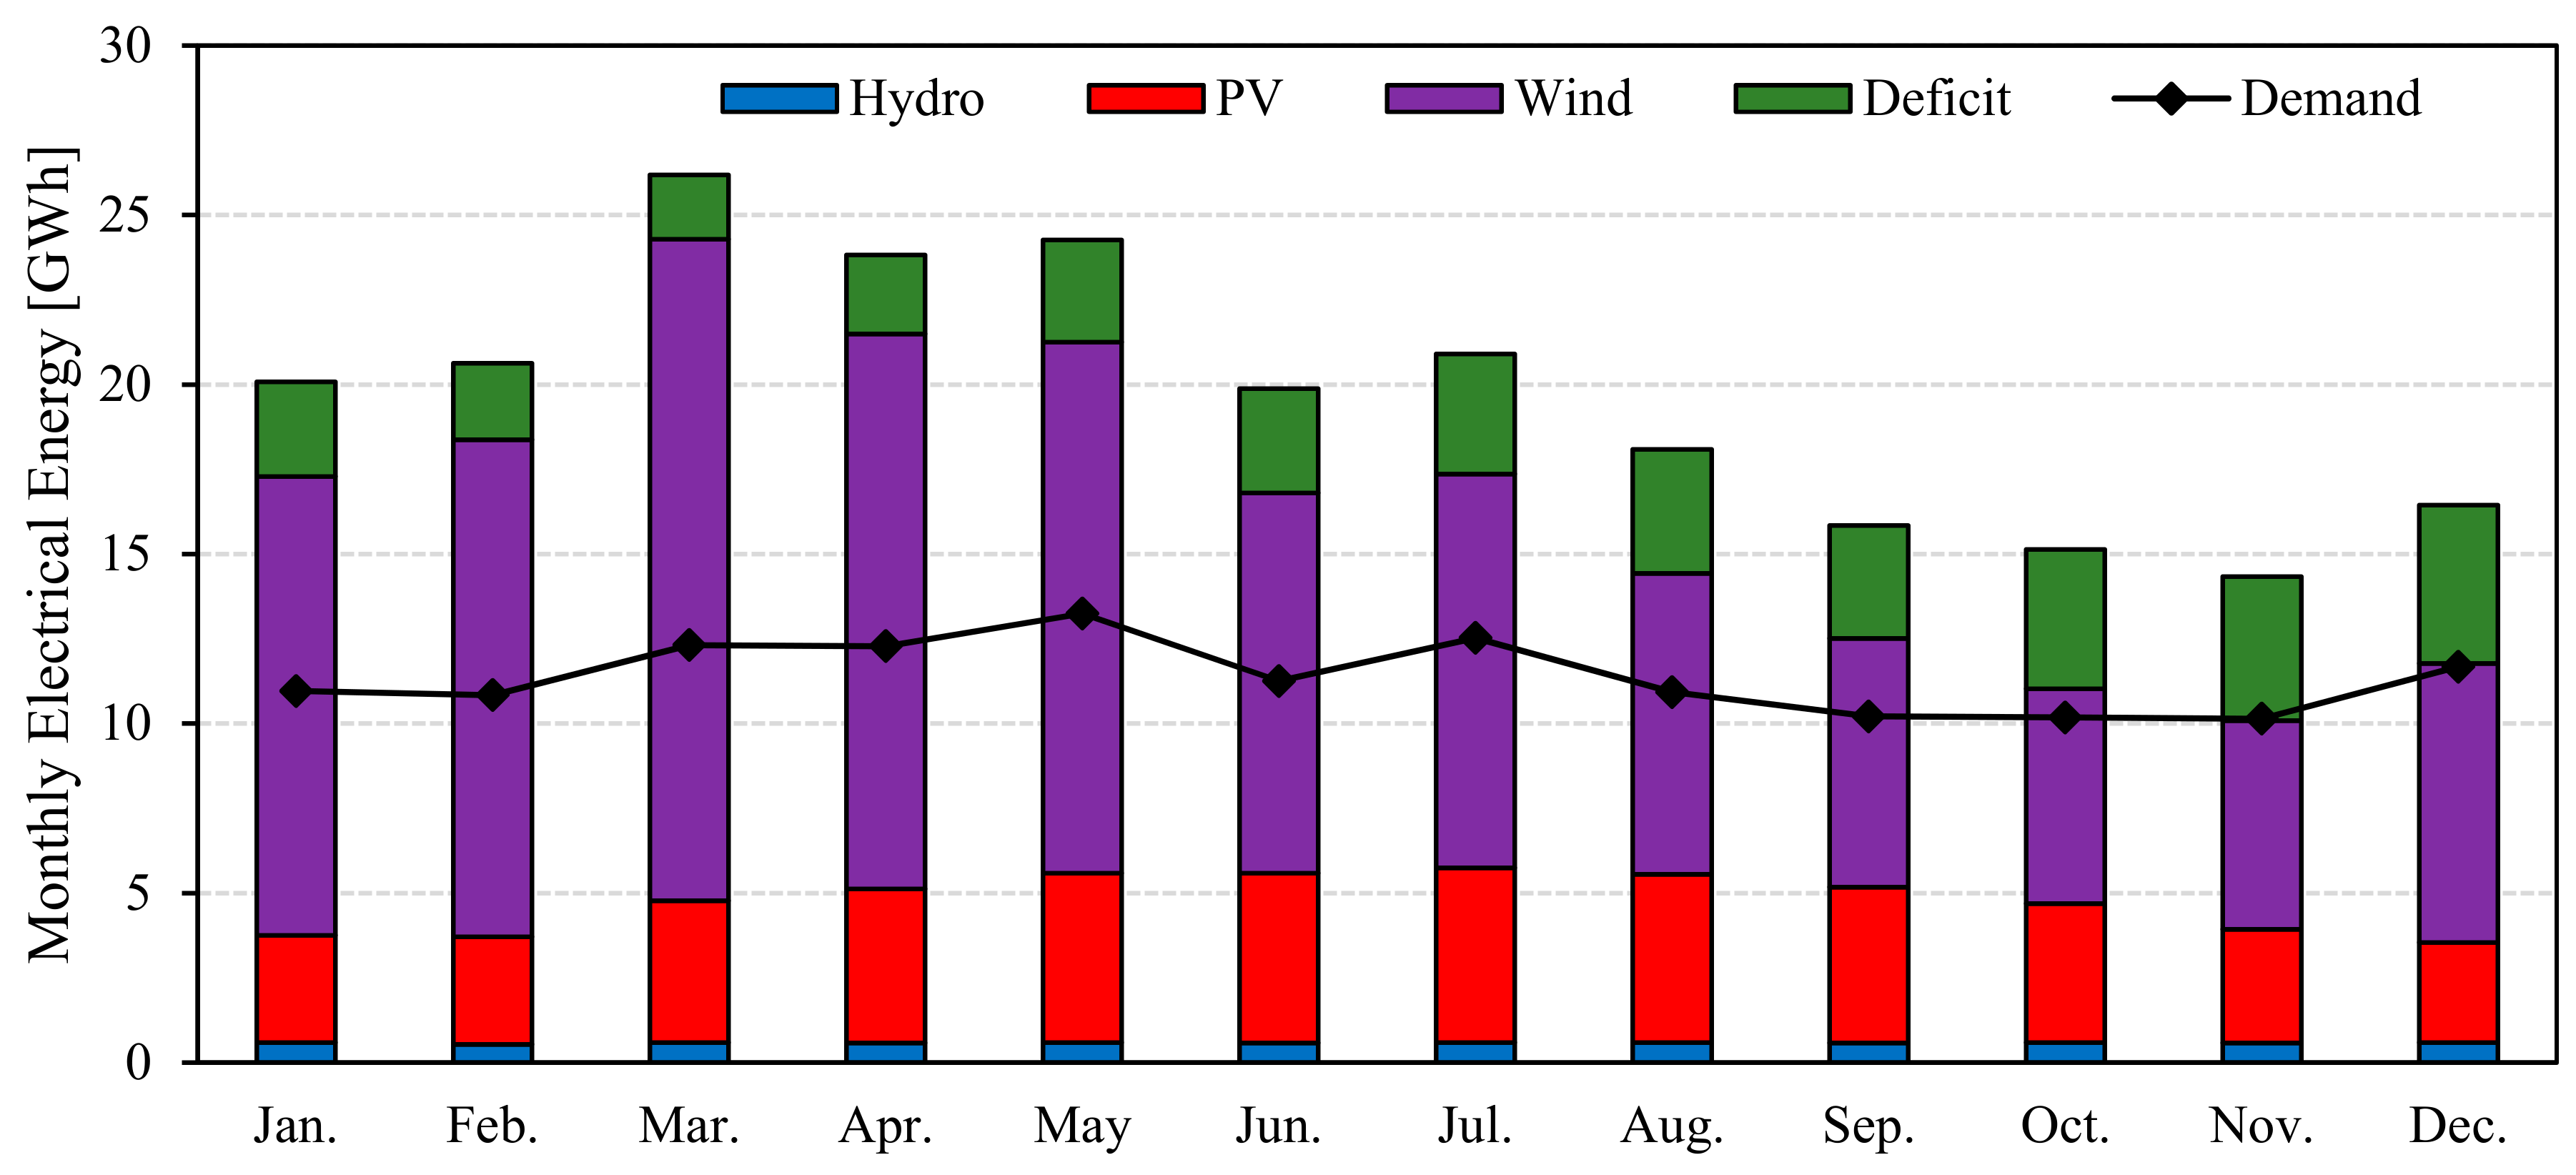
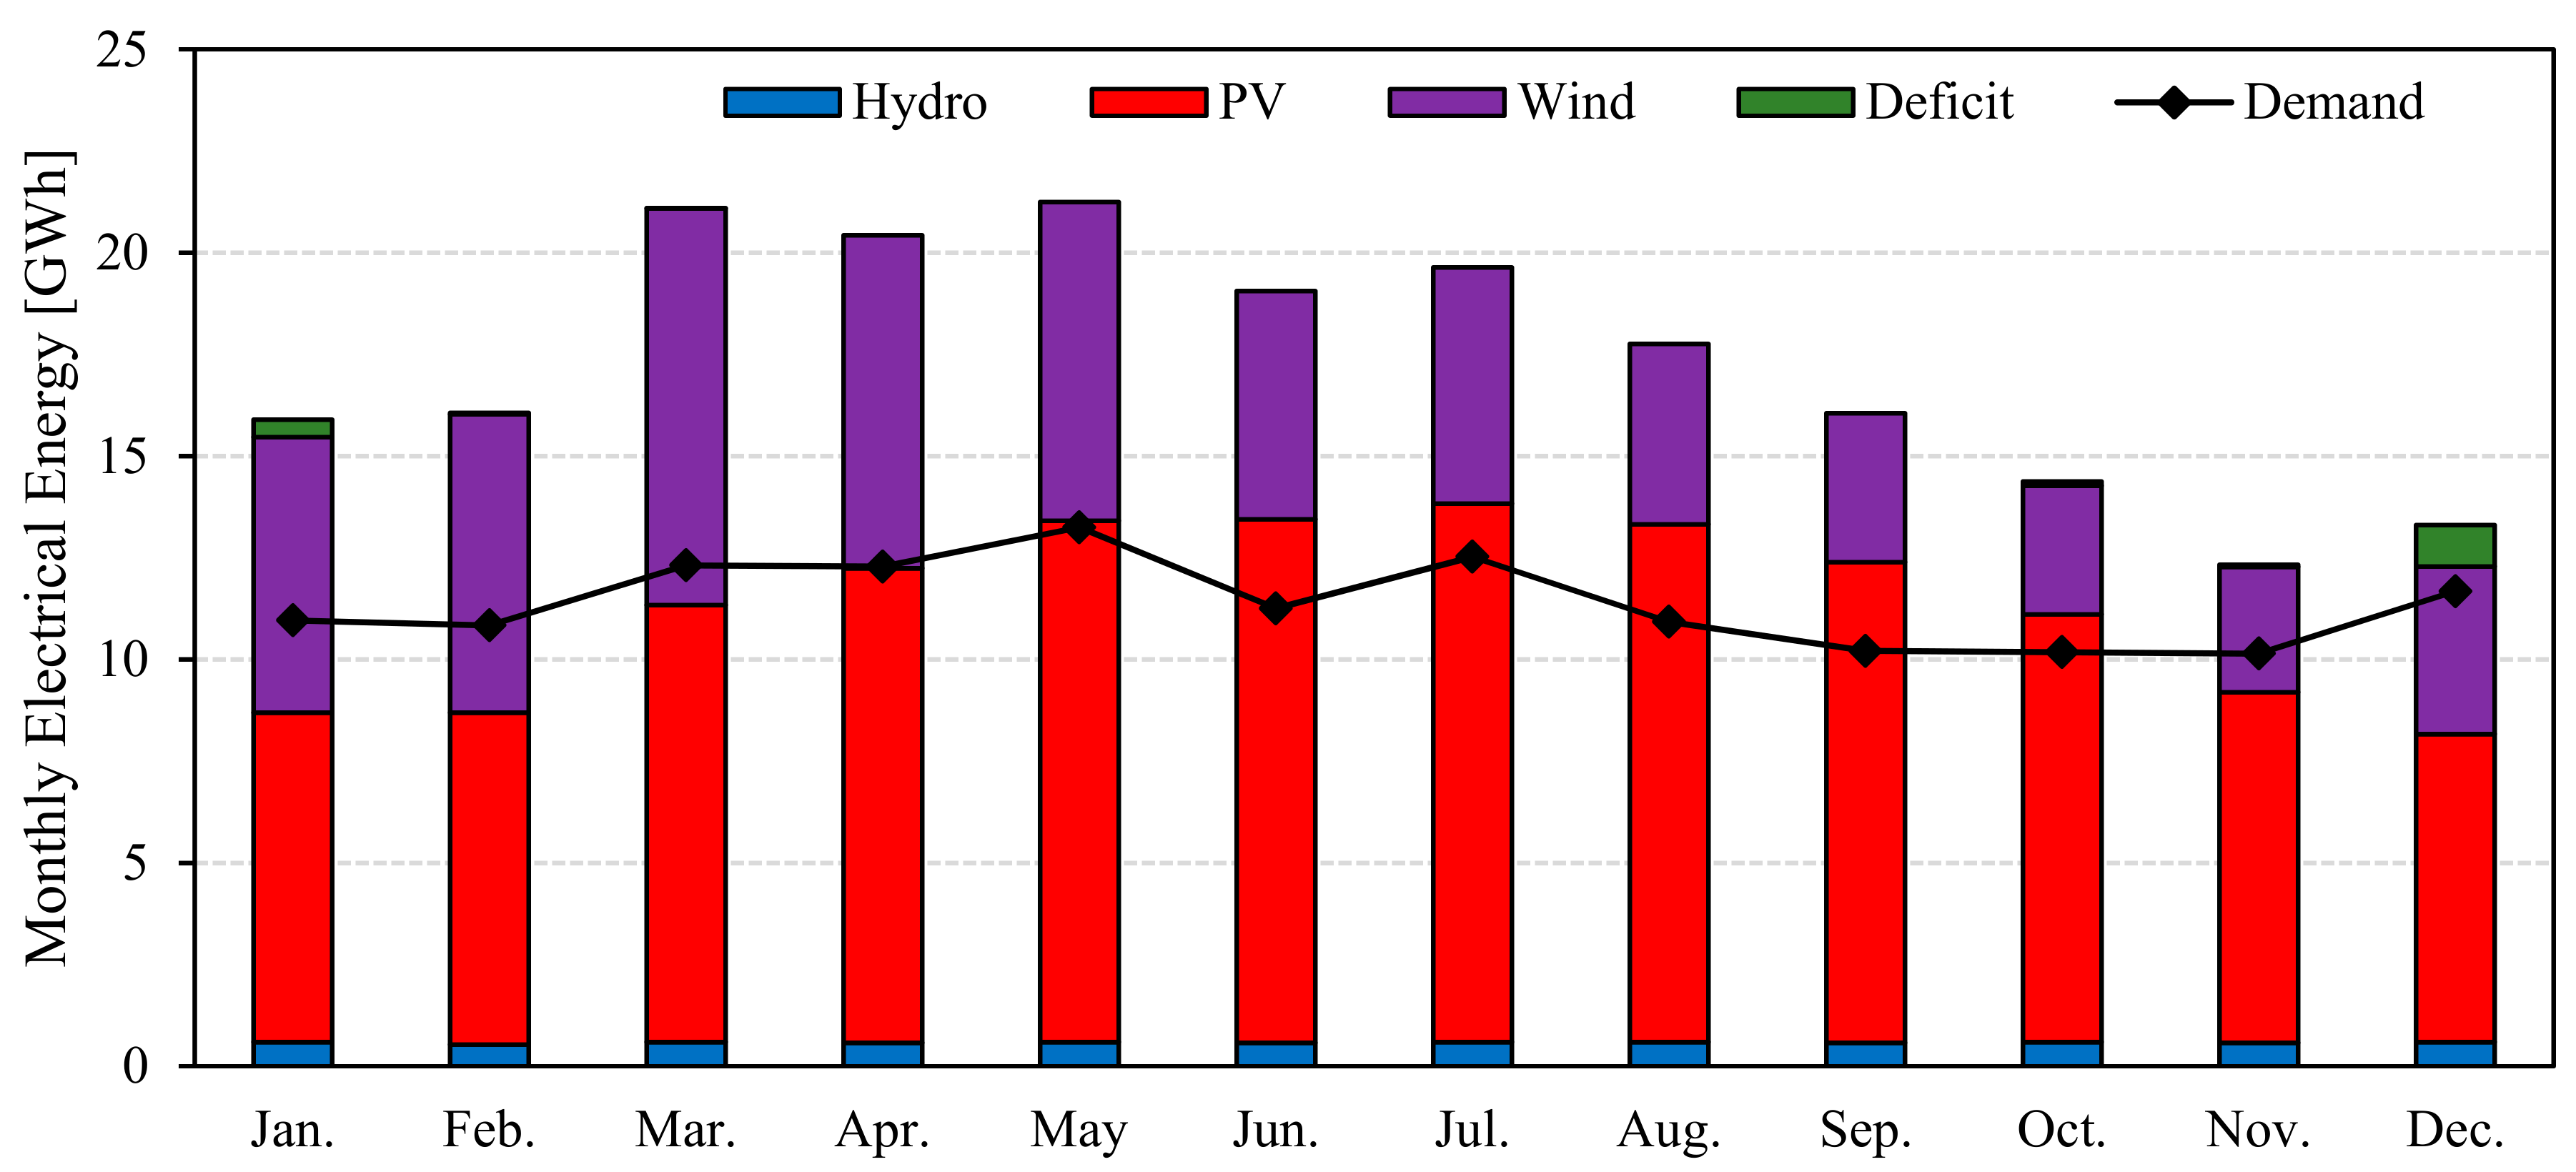
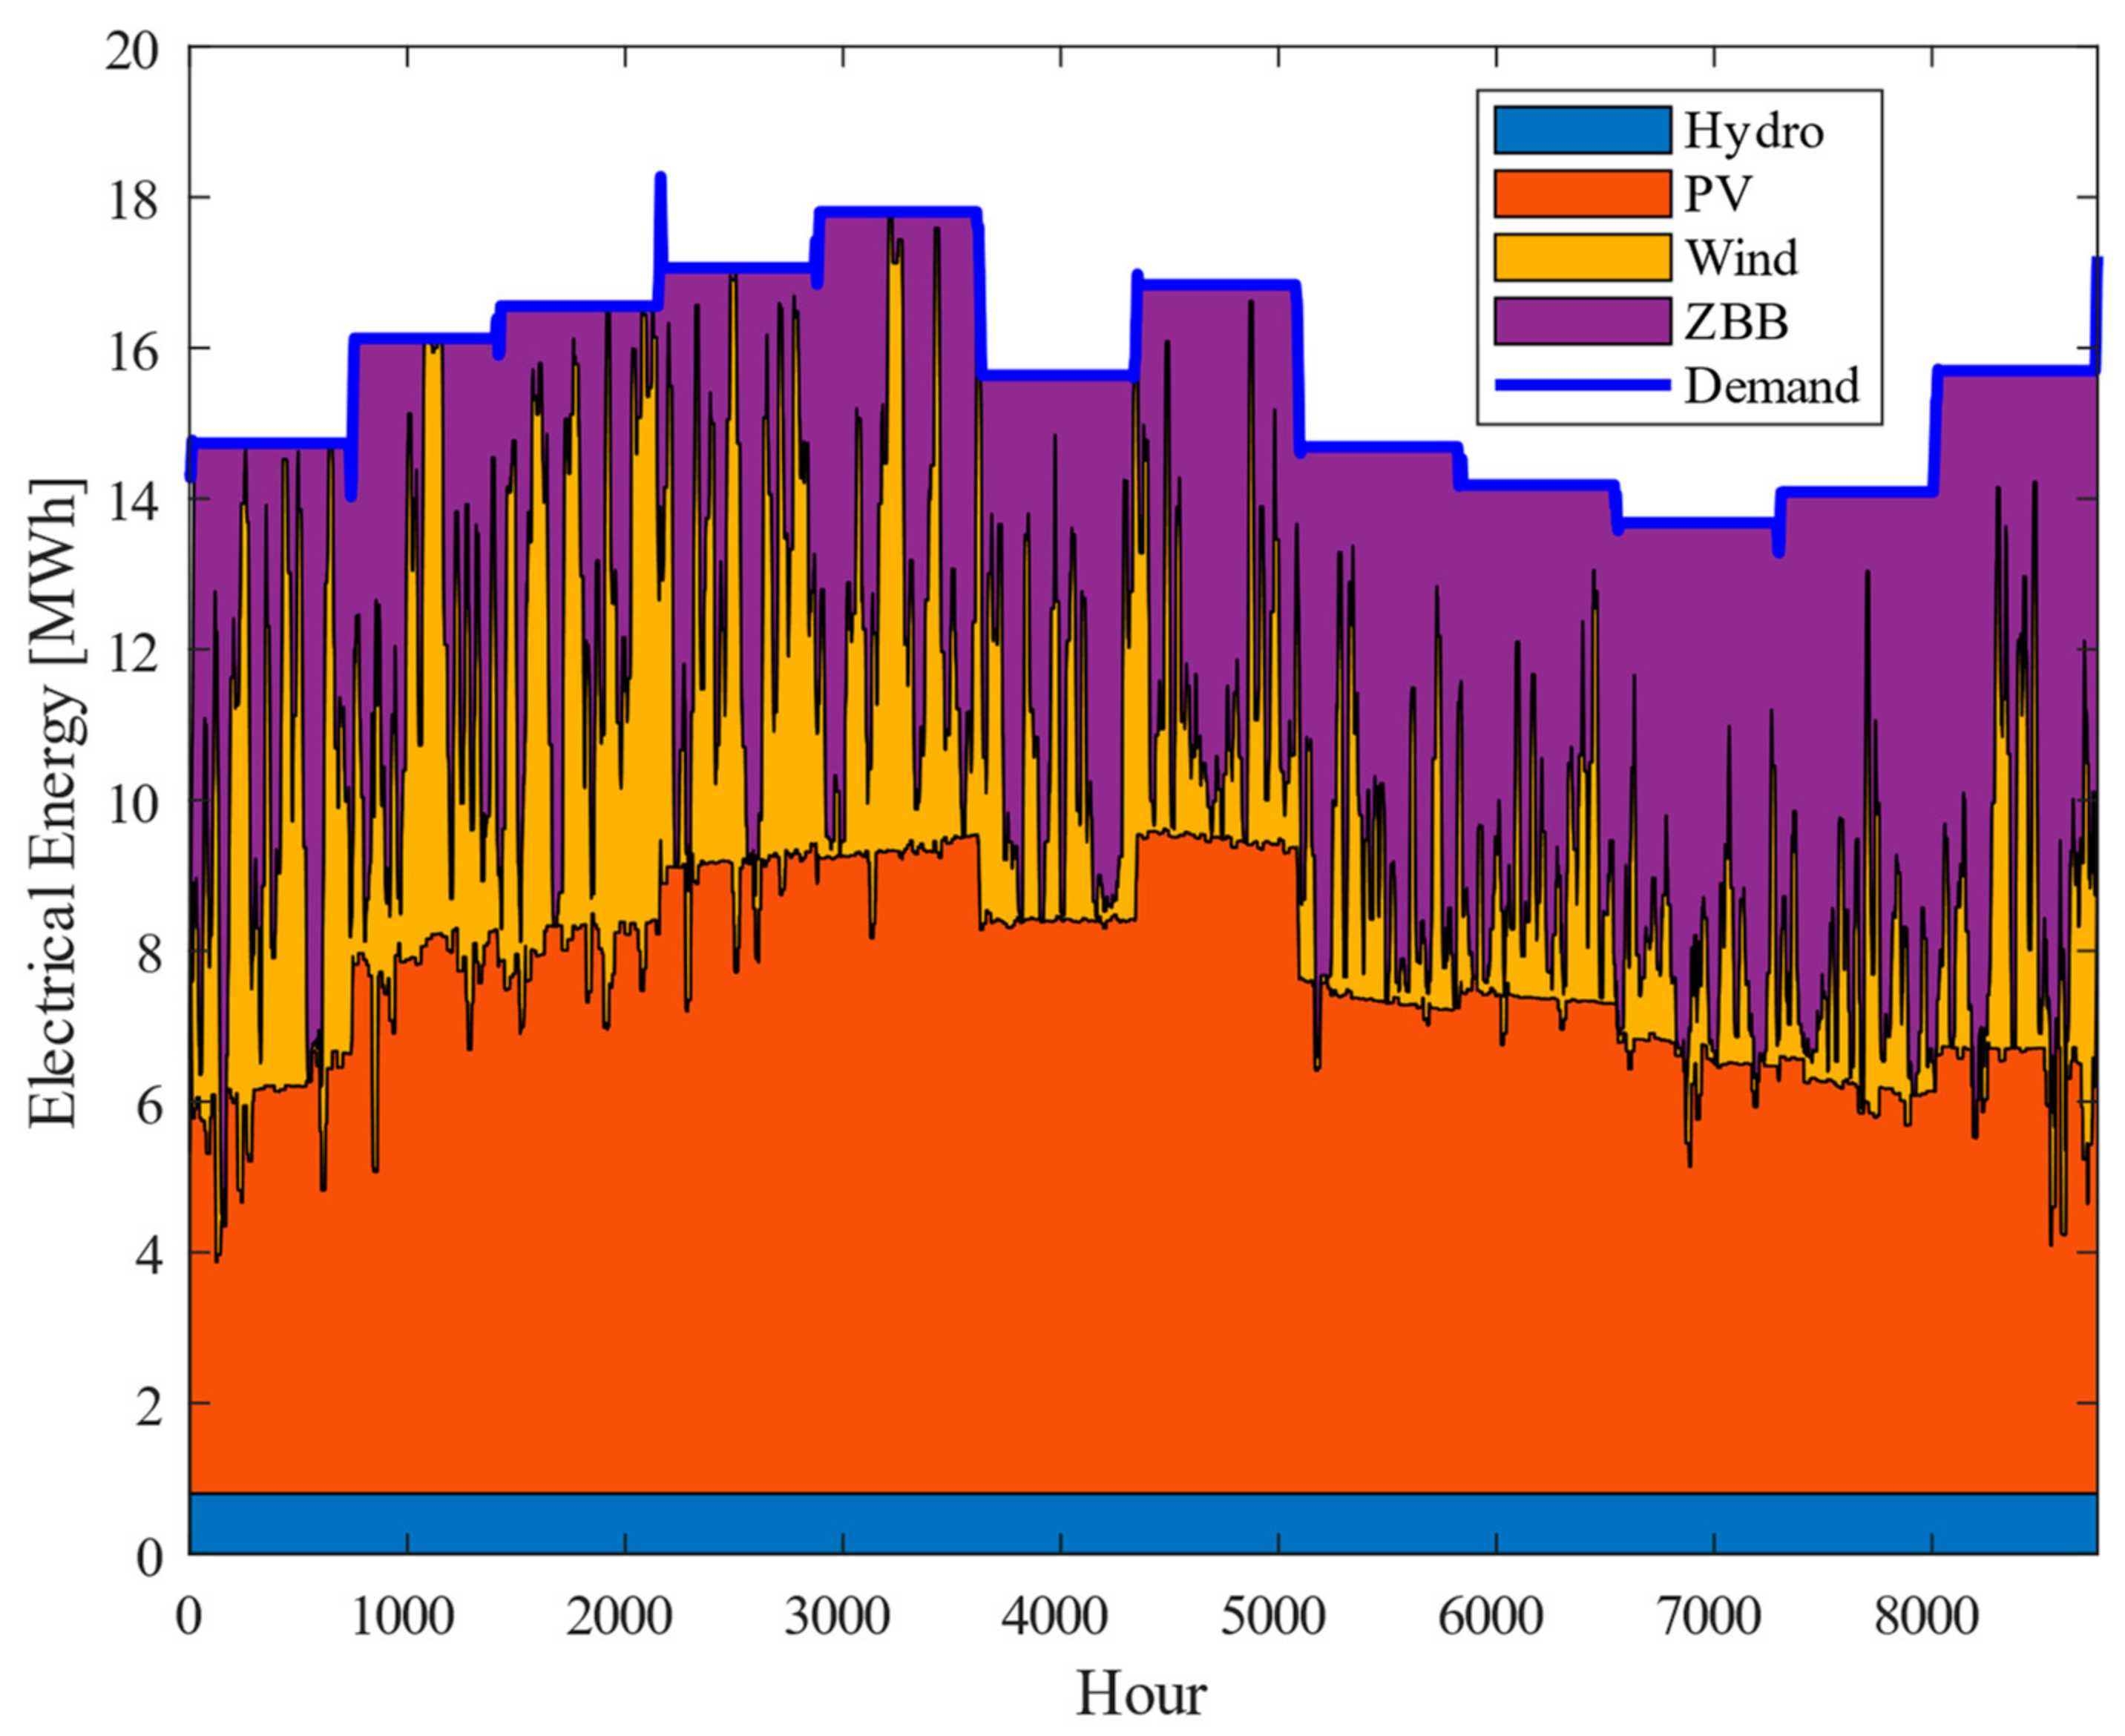
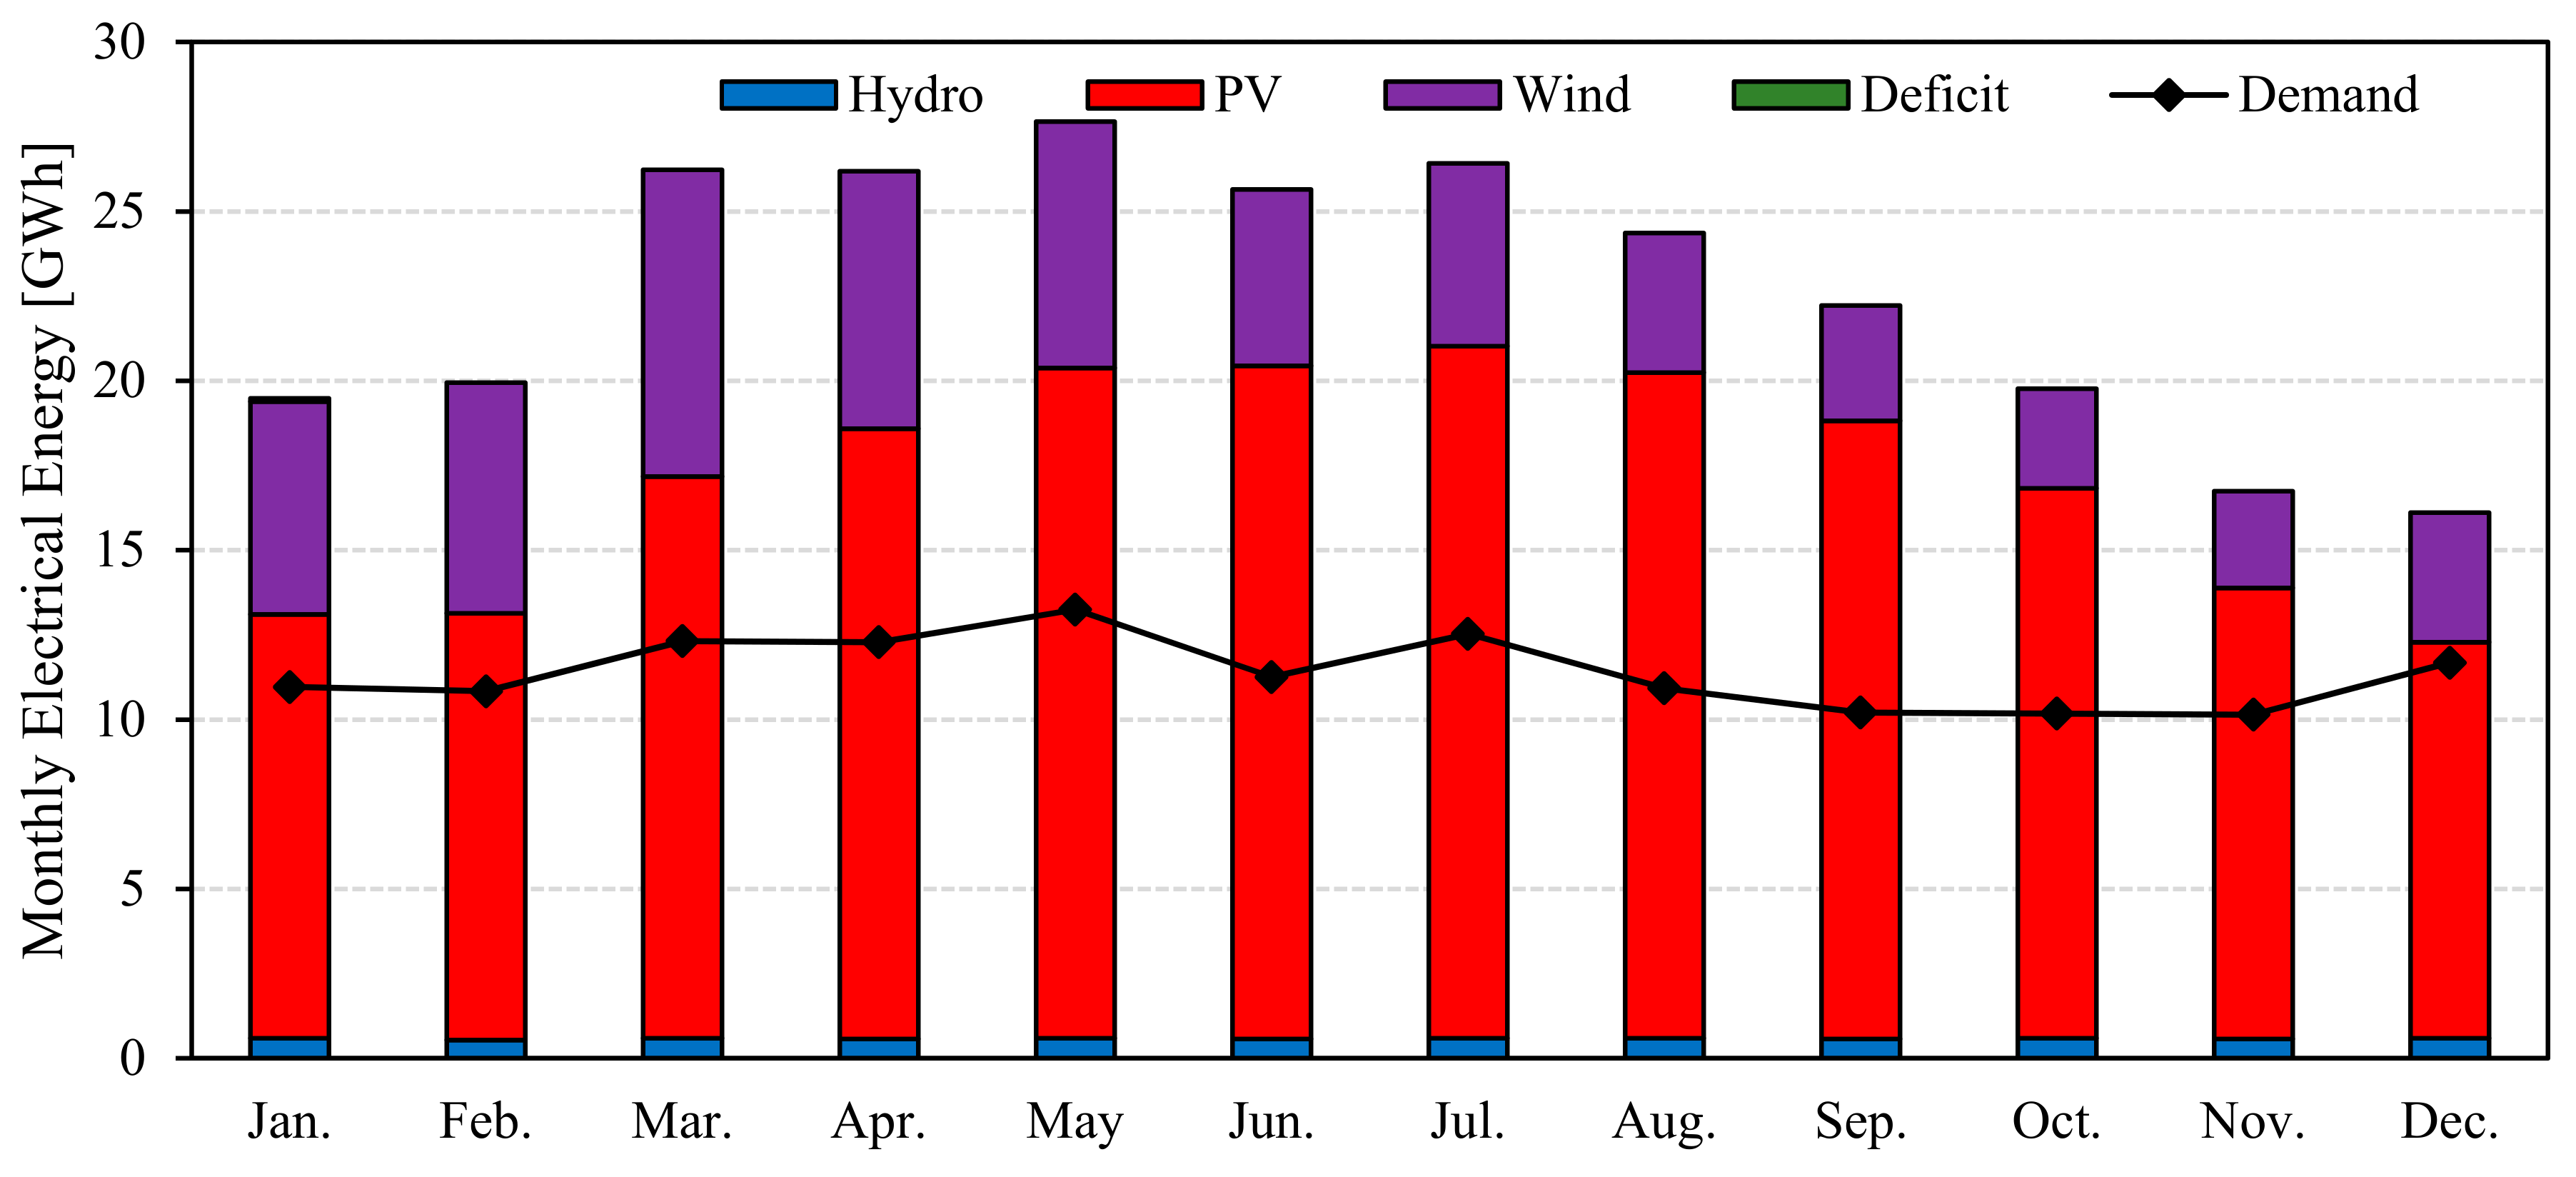
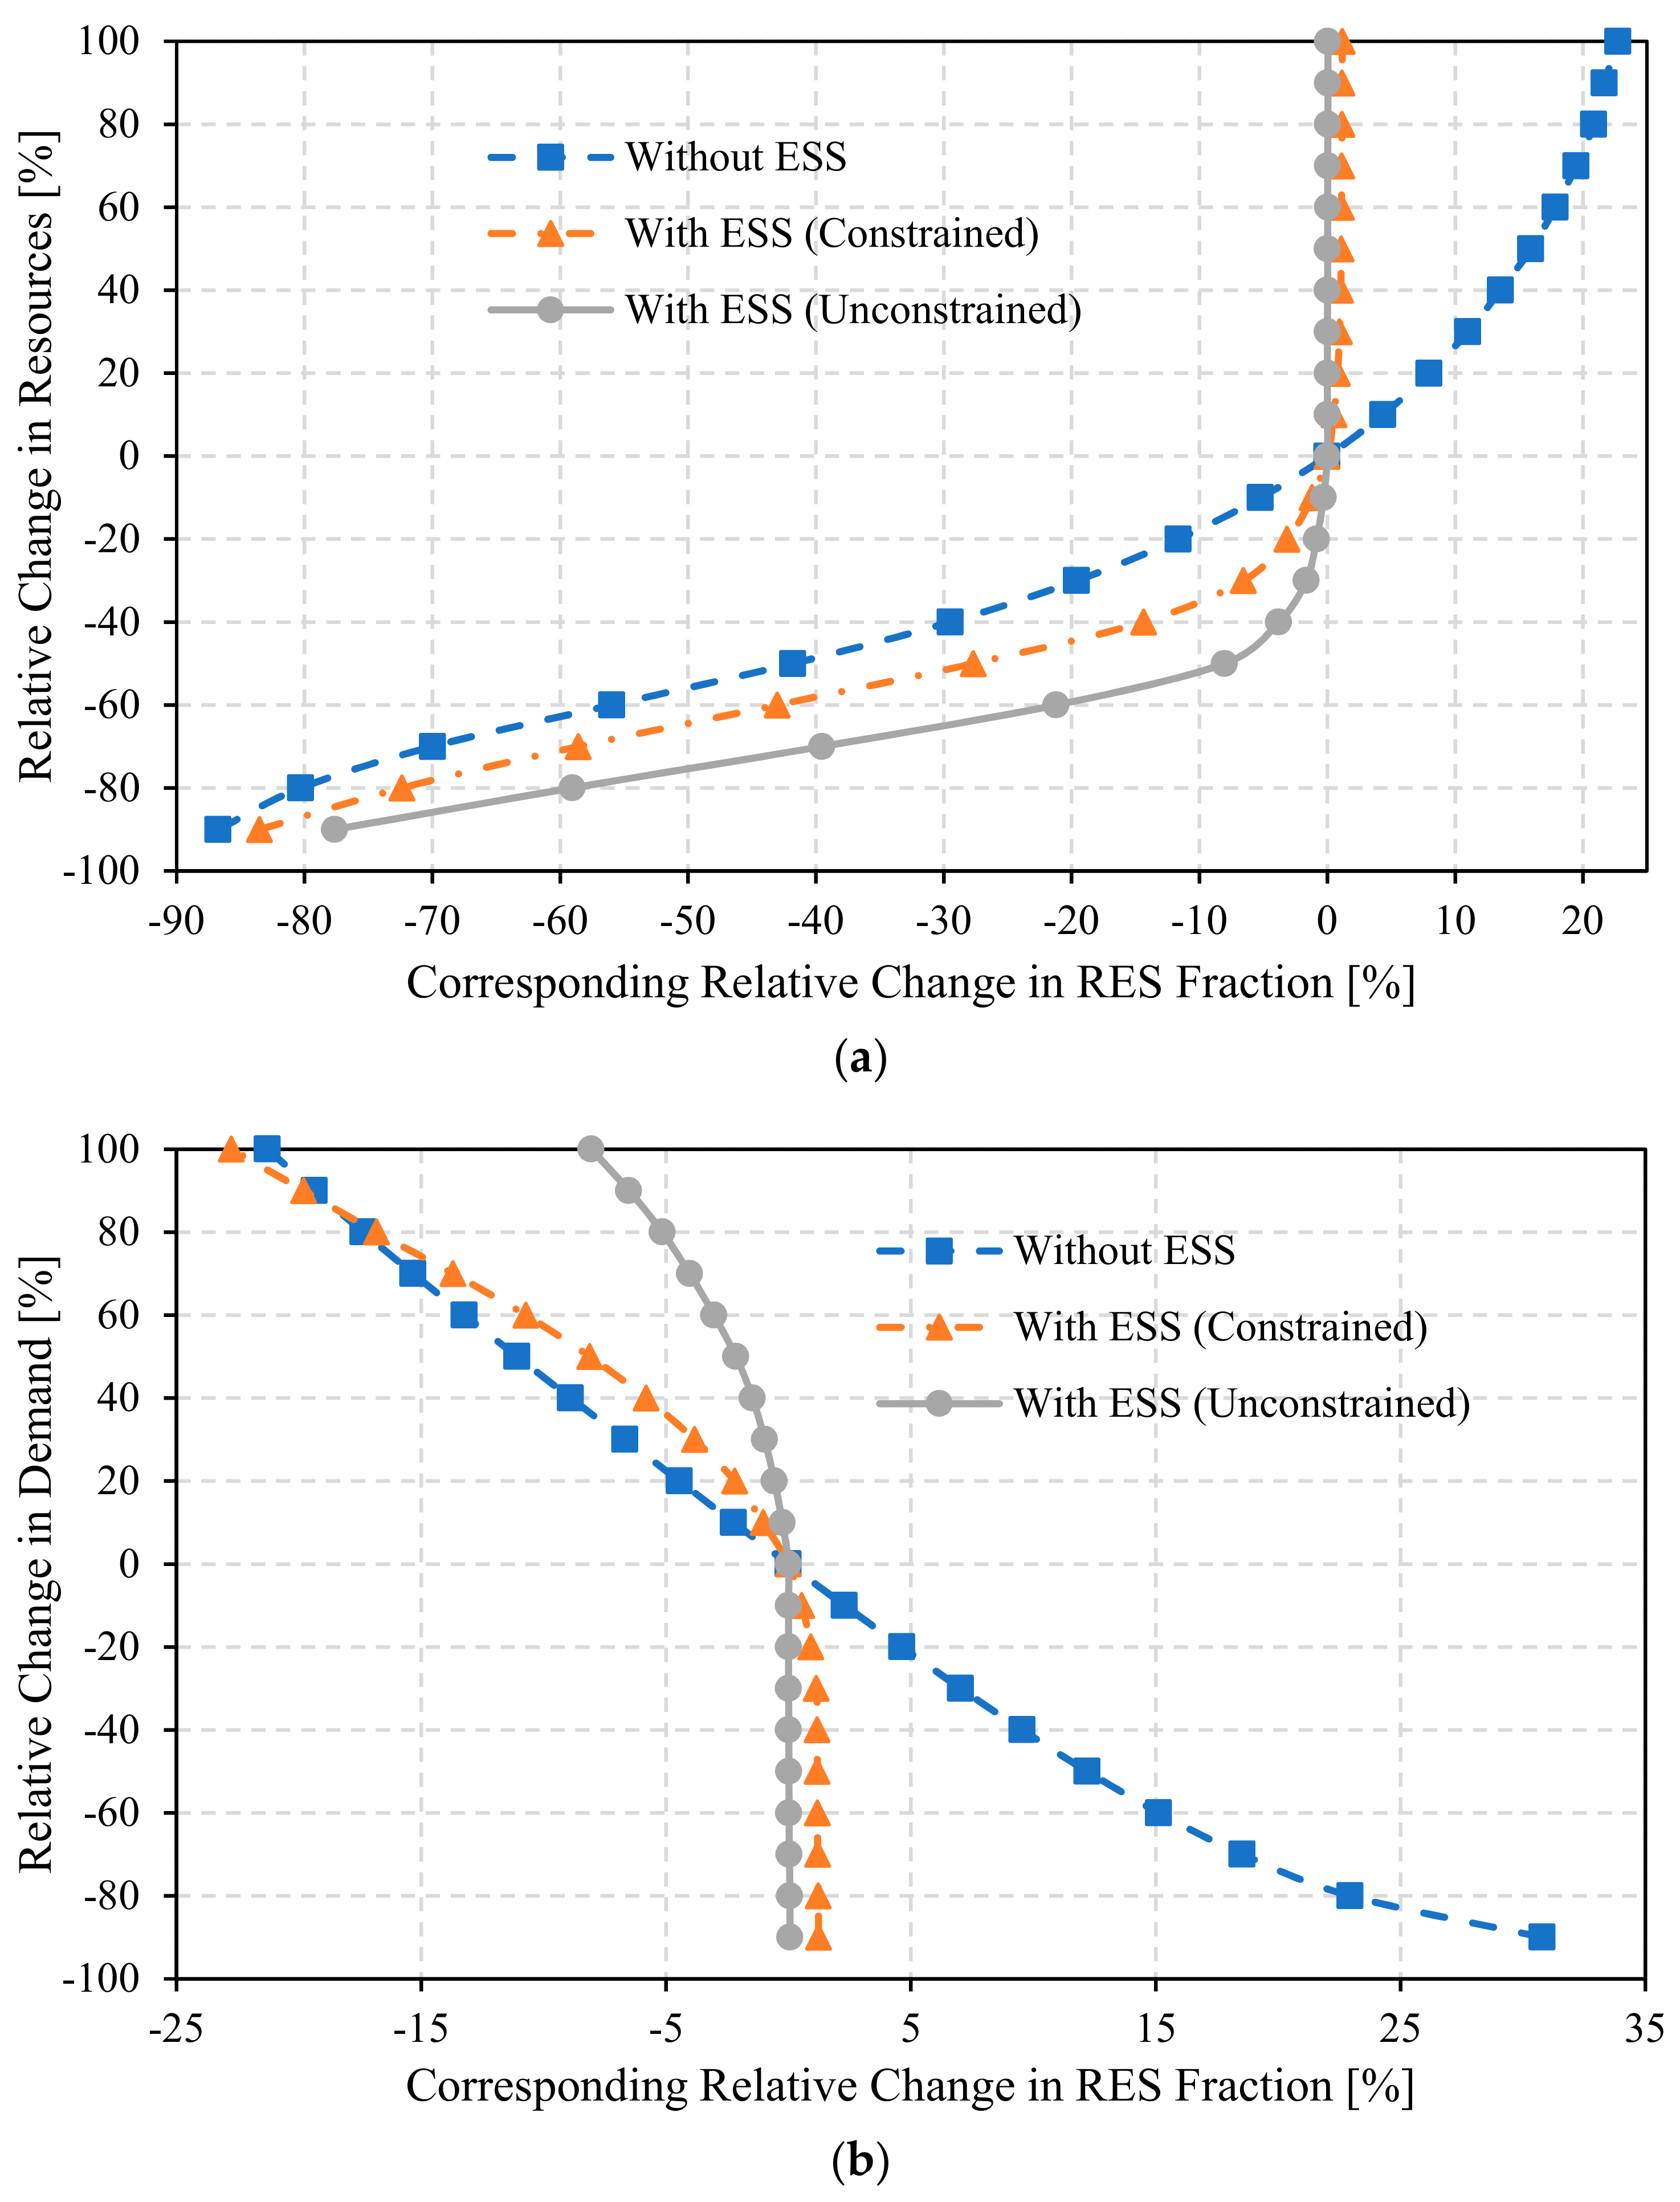
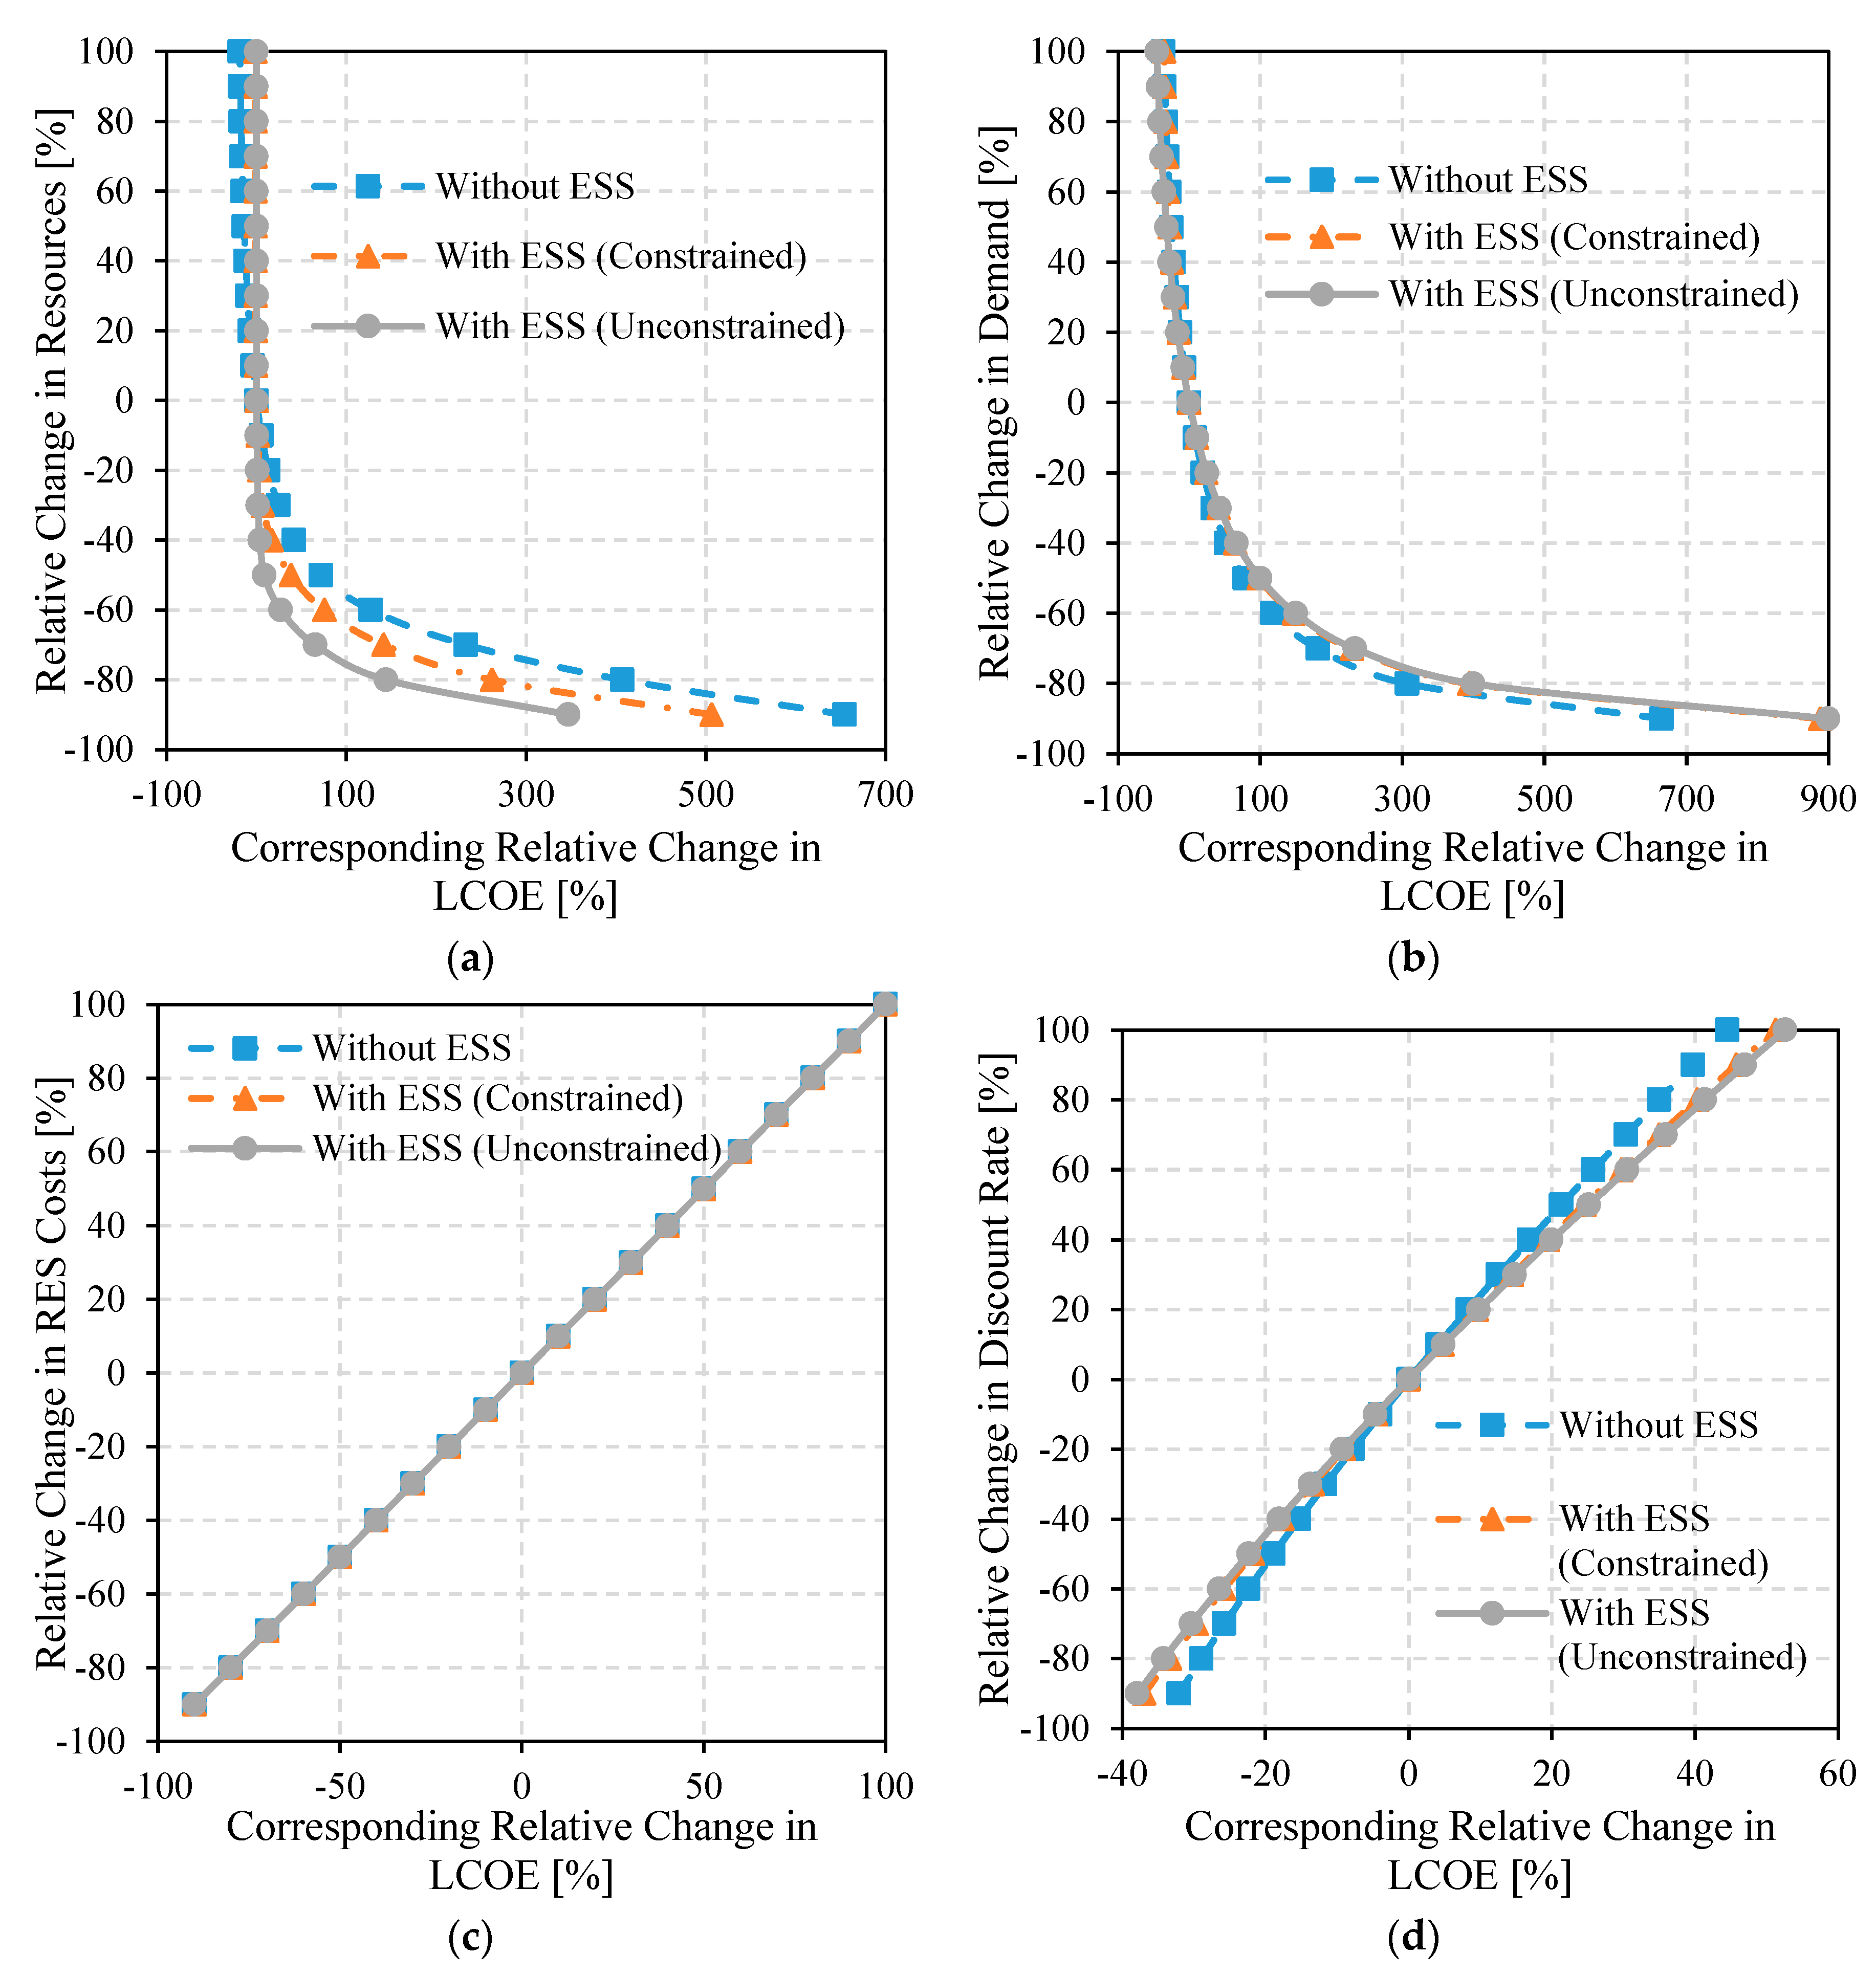
3. Results and Discussion

Al-Tafilah has a hydropower potential of 1 MW and a high potential of solar and wind resources that can achieve both economic and technical feasibilities. The RES sizing in this study was made based on maximizing the RES fraction and constraining the LCOE to the electricity purchase tariff in Al-Tafilah. This will maximize the environmental benefits of the system by meeting the highest demand possible, at the same time guaranteeing the economic feasibility of the system. The technical and economic parameters of the optimal sized PV/wind-hydro without ESS are shown in Table 3. Without an energy storage system, the tri-hybrid system comprises a 29.4 MW PV system and a 56 MW wind system. This system can supply the demand with a RES fraction equal to 71.5%, as seen in Table 3. In the case where no constraints were forced on the LCOE, the RES fraction reached a value of 87.9%; however, the system was very large and not feasible, hence, unrealistic for consideration.
Figure 3 shows the demand-met energy profile of the hybrid system components and how their summation compares with the demand profile. It is clearly seen from the superposition of the demand met by the system components that these RES can work synergistically as a hybrid system, as the hybridization mode could achieve higher RES fractions. However, although the amount of energy generated is enough, the profiles of the energy generation and energy demand do not match; a result of the fluctuation of the solar and wind resources and the limited hydropower capacity of the system. Consequently, the system is not capable of meeting the demand at 100%. This is seen in Figure 4, where the mismatch is represented by the deficit portion of the bar chart. Figure 4 shows that although the quantity of energy can be more than enough, the mismatch between the supply and demand profiles could still cause energy deficiency. Therefore, when a RES is to be assessed, not only energy quantity should be taken into account, but rather the time it is needed in as well. Since 100% could not be reached solely by the RES, an ESS must be integrated into the system to supply the deficit.
To ensure Al-Tafilah could base its decentralized grid on the hybrid RES proposed, 100% of their demand must be met and matched. Therefore, an ESS that can supply the deficit must be integrated. The technical and economic parameters of the optimal sized PV/wind-hydro with ESS are shown in Table 4. The table examines two scenarios for the ESS-integrated system; a constrained and unconstrained LCOE. In the first scenario, the LCCOE was again fixed to the electricity purchase tariff at Al-Tafilah. Results showed that the system would comprise of 75.4 MW PV system and 28 MW wind system. It worth noting that the size of the PV system is larger than in the case where no ESS was integrated, while the size of the wind system decreased. The size increase could be attributed to the utilization of more energy to supply the storage system as well as the demand in the time when solar energy is available. The result is a larger system, but with the great advantage of meeting the demand at 98.8%, RES fraction compared to only 71.5% previous value. If RES size was optimized to maximize the RES without any constraints on the LCOE, the system could meet 99.9% of the demand, with an acceptable LCOE of 0.165 $/kWh compared with the current value of 0.12 $/kWh. It is worth mentioning that the presented calculation of the LCOE was based on current prices of the RES technologies, which means these values will be less in the future as the prices of these technologies are expected to drop significantly in the next decades [53]. Figure 5 shows the demand-met energy profile of the hybrid system components when integrated with an ESS, and how their summation compares with the demand profile. The difference between this and Figure 3 resembles the power of the integration of the ESS in solving the mismatch problem. It is apparent in the figure that the demand- met and the actual demand curves coincide almost all the time. This is further clarified by Figure 6, with a significant reduction in the deficit portion when compared to Figure 4 that had no ESS backup. As explained earlier, there is still a 1% deficit due to the constraint forced on the LCOE. However, as this constraint is removed, Figure 7 shows that the demand and demand-met profiles coincide at all times, and no deficit portion is seen, which is further confirmed in Figure 8; i.e., the demand was met at 100%, but with a slightly higher LCOE compared to the current value.
The RES system with an ESS not only supply Al-Tafilah with decentralized electricity and help Jordan take a step further towards reducing energy-import dependency, but it also comes with economic and environmental benefits. In Jordan, power plants operated on combined cycles and fired with natural gas are used to supply part of the demand. When the proposed system provides the energy demand, the annual saving of fuel from a typical Jordanian plant, for example, the Al-Qatrana power plant, is equal to 20,365 tons-saved, which is equivalent to a reduction of 47,160 MtCO2 [3,54]. The fuel-saving and reduction in CO2 calculations were based on a previously developed code for the simulation of the power plant presented in those latter references, where detailed analysis of fuel consumption and CO2 emission calculations for the power plant can be found. Based on estimations by the United States Environmental Protection Agency, this CO2 reduction is equivalent to the carbon sequestered annually by US forest spreading an area of 61,589 acres. Therefore, the presented system also progresses Jordan’s adherence to the greenhouse gas limit set by the Paris agreement. For a developing country like Jordan, a transition towards 100% is crucial, as a study by Mathiesen et al. [55] associated such transition with large earnings on export potential, creating jobs, and economic growth. So, this work, which demonstrated a step further towards a 100% renewable energy grid, will support a more robust economy, at the same time, a greener Jordan.
The fluctuations in the renewable energy resources (solar and wind resources), as well as the variation in the electrical demand, significantly affect the performance of RESs where the amount of variations depends on the RES configurations and the existence of ESS, as shown in Figure 9. It can be depicted from Figure 9 that the RES fraction of the hybrid PV/wind/hydro system without ESS is the most sensitive one to the variation in the resources and the electrical demand, which is expected because the ESS acts as a backup system to cover the deficit caused by the drop in the resources or the increase in the demand. Moreover, it can be seen that the increase in the resources and the decrease in the demand do not change the RES fraction of the hybrid system with ESS (specifically for the unconstraint scenario) since they reached almost 100% RES fraction.
RES fraction Likewise, the LCOE of the system is sensitive to the variations in the renewable energy resources and the demand and also to the variations in the RES’s costs (capital and maintain ace costs) as well as the annual discount rate where the largest variations in the LCOE is caused by the change in the resources and demand as shown in Figure 10 since the amount of energy met by the RES is controlling the LCOE which is in return affected by the change in the resources and the demand. It can be depicted from Figure 10c that all the LCOE of the hybrid system configurations have almost the same sensitivity to the variation in the RES costs. At the same time, it can be seen in Figure 10d that the LCOE of the system without ESS is less sensitive to the variation in the annual discount rate, unlike the systems with ESS.

4. Conclusions

Many developing countries across the globe rely heavily on imported sources to cover their energy needs. As such, the development of a reliable yet cost-efficient means of energy production is vital for advancing the movement toward sustainable societies and fastening the economic growth in the desired country. Jordan, with no exception, relies on imported oil from neighboring countries to cover their domestic demand. Additionally, the lack of services and poor electrification of rural areas in the kingdom worsens the poverty problem. In this work, Al-Tafilah of Jordan was presented as a case study, and the technical, economic, and environmental benefits of a decentralized renewable energy system that can supply and match 100% of the city energy demand were investigated. Other rural cities in Jordan have higher RES potential; therefore, this study can be expanded to other parts of Jordan. A tri-hybrid system of wind, solar, and hydropower, and an energy storage system were modeled and optimized to maximize the matching between the energy demand and production profiles. Three main scenarios were considered, first a tri-hybrid RES without an energy storage system, with a constraint on LCOE (a maximum of LCOE equal to the electricity purchase tariff was set). The second and third scenarios were investigations of the RES system integrated with an ESS, with and without constraints on the LCOE. Results showed that without an ESS, the hybrid system could only reach up to 71.5% RES fraction. However, the techno-economic analysis of the PV/wind-hydropower system with an ESS showed that the optimal system in Al-Tafilah comprising a 28 MW wind turbine, 75.4 MW PV, 1 MW hydropower, and a 259 MWh energy storage facility could achieve a 99% RES fraction. It offers an attractive LCOE of 0.12 $/kWh (equal to the purchase tariff) and a payback period of 9 years. Results also indicated that with the installation of this system, an equivalent of 47,160 MtCO2 emissions could be avoided yearly, which demonstrates the environmental benefits of the proposed work. Therefore, these finding are essential not only for future renewable energy planning in the country and improving its economy but also for contributing to the ongoing force against climate change. When the constraint on the LCOE was removed, the RES fraction achieved was equal to 100%, with a slightly higher LCOE of 0.165 $/kWh. Since the prices of RES technologies are expected to drop dramatically in the next decades, the last scenario can also be adopted as the LCOE drops significantly with the RES price reduction. Finally, sensitivity analysis showed that the RES fraction of the hybrid PV/wind/hydro system without ESS is the most sensitive configuration to the variation in the resources and electrical demand. In contrast, the LCOE of the three configurations showed the largest sensitivity to the variation in the resources and demand compared to its sensitivity to the RES costs and annual discount rate variations.

Author Contributions

Conceptualization, L.A.-G., A.D.A. and M.A.; methodology, L.A.-G.; software, L.A.-G.; formal analysis, L.A.-G. and A.D.A.; investigation, L.A.-G., A.D.A. and A.M.A.; data curation, L.A.-G. and A.D.A.; writing—Original draft preparation, L.A.-G., A.D.A., A.M.A. and M.A.; writing—Review and editing, L.A.-G., A.D.A., M.A. and N.K.A.; supervision, O.T., M.F. and N.K.A.; project administration, O.T., M.F. and N.K.A.; funding acquisition, N.K.A. All authors have read and agreed to the published version of the manuscript.

Funding

This research was funded internally by the Institute of Research for Technology Development, University of Kentucky.

Acknowledgments

The authors would like to thank Prof. Derek Baker from Middle East Technical University for providing the TMY data of Al-Tafilah.

Conflicts of Interest

The authors declare no conflict of interest.

Nomenclature

E h Annual energy production from the hydropower system, kWh u g Average wind speed at ground level, m/s
E P Hourly energy generated from the PV power plant, kWh u R Rated wind speed, m/s
E w generated by a wind turbine(s), kWh u Z Wind speed at hub height, m/s
E s t t Energy stored at time t, kWh u ¯ Mean wind speed at hub height, m/s
E s t m a x Battery capacity, kWh Z Hub height, m
F H RES Fraction, % Z g Height of the ground level, m
I R Reference insolation at nominal conditions, Wh/m2Acronyms and Abbreviations
I T Global insolation on a tilted surface, Wh/m2ESSEnergy storage system
K Shape parameter of the Weibull distributionGHGsGreenhouse gases
L Lifetime of the system, yearsGRGGeneralized reduced gradient
L C O E Levelized Cost of Electricity, USD/kWhLCOELevelized cost of electricity
M t Yearly fixed maintenance cost of the RES, USDNPVNet present value
N m Number of modules in the PV power plantPBPPayback period
NOCT Nominal operating cell temperature, oCPVPhotovoltaic
P h Hydropower capacity, kWRESRenewable energy system
P R   Rated electrical power of the wind turbine, kWZBBZinc-Bromine battery
r Annual discount rate, %Greek letters
T a Ambient temperature, oC α Wind shear coefficient
T R , NOCT Reference module temperature at nominal conditions, oC β R Temperature coefficient, 1/°C
T Ref , STC Reference module temperature at standard conditions, oC η l System losses, %
u C Cut-in wind speed of the wind turbine, m/s η PV ,   R Reference efficiency of the PV module, %
u F Cut-out wind speed, m/s η P V PV module efficiency
σ Standard deviation of the wind speeds sample, m/s

Appendix A.

Table A1. System Modelling Equations.
QuantityEquationKey PointsEquation Number
PV Energy model
The PV module efficiency η P V = η PV ,   R × 1 β R × T a + NOCT T R , NOCT × I T I R T Ref , STC Neglecting the effects of relative humidity and wind speeds, while considering the effect of the ambient temperature [56,57].(A1)
The hourly energy generated from the PV power plant E P = η P V × I T × A m × N m × η l η l was taken 0.85 based on [58,59](A2)
Wind Energy model
The wind speed at hub height u Z = u g × Z Z g α α can be taken as 1/7 [39], Zg is the height of the ground level [m] at which speed is measured and it is equal 10 m.(A3)
total hourly electrical energy generated by a wind turbine(s) E w = { 0 , u Z < u C   or   u Z > U F N × P R   ×     u C K u Z K u C K u R K ,   u c u Z u R N   × P R   , u R < u Z u F By [39](A4)
Shape Parameter K = σ /   u   ¯ 1.086 1   K 10 (A5)
Hydropower Model
Annual energy production from the hydropower system E h = P h × CF h × 24 × 365 ( CF h ) of 80% [41](A6)
Performance assessment of RES
RES Fraction F H = D R E S D D is the hourly demand of Al-Tafilah [kWh] which was obtained from [44] (A7)
Economic Assessment of the RES
The Levelized
Cost of electricity
L C O E = C i + t = 1 L M t   1 + r t t = 1 L D R E S 1 + r t (A8)

References

  1. Jaber, J.; Badran, O.O.; Abu-Shikhah, N. Sustainable energy and environmental impact: Role of renewables as clean and secure source of energy for the 21st century in Jordan. Clean Technol. Environ. Policy 2004, 6, 174–186. [Google Scholar] [CrossRef]
  2. Hrayshat, E.S. Analysis of renewable energy situation in Jordan. Renew. Sustain. Energy Rev. 2007, 11, 1873–1887. [Google Scholar] [CrossRef]
  3. Ahmad, A.D.; Abubaker, A.M.; Najjar, Y.S.; Manaserh, Y.M.A. Power boosting of a combined cycle power plant in Jordan: An integration of hybrid inlet cooling & solar systems. Energy Convers. Manag. 2020, 214, 112894. [Google Scholar] [CrossRef]
  4. Bortolini, M.; Gamberi, M.; Graziani, A. Technical and economic design of photovoltaic and battery energy storage system. Energy Convers. Manag. 2014, 86, 81–92. [Google Scholar] [CrossRef]
  5. Al-Ghussain, L. Global warming: Review on driving forces and mitigation. Environ. Prog. Sustain. Energy 2019, 38, 13–21. [Google Scholar] [CrossRef] [Green Version]
  6. Timmerberg, S.; Sanna, A.; Kaltschmitt, M.; Finkbeiner, M. Renewable electricity targets in selected MENA countries—Assessment of available resources, generation costs and GHG emissions. Energy Rep. 2019, 5, 1470–1487. [Google Scholar] [CrossRef]
  7. Abubaker, A.M.; Magableh, M.N.A.; Darwish-Ahmad, A.; Najjar, Y.S.H. Efficiency boosting and steam saving for a steam-injected gas turbine engine: An optimization study of the running conditions. J. Energy Eng. [CrossRef]
  8. Ahmad, A.D.; Abubaker, A.M.; Salaimeh, A.A.; Akafuah, N.K. Schlieren visualization of shaping air during operation of an electrostatic rotary bell sprayer: Impact of shaping air on droplet atomization and transport. Coatings 2018, 8, 279. [Google Scholar] [CrossRef] [Green Version]
  9. Ahmad, A.D.; Singh, B.B.; Doerre, M.; Abubaker, A.M.; Arabghahestani, M.; Salaimeh, A.A.; Akafuah, N.K. Spatial positioning and operating parameters of a rotary bell sprayer: 3D mapping of droplet size distributions. Fluids 2019, 4, 165. [Google Scholar] [CrossRef] [Green Version]
  10. Sharadga, H.; Dawahdeh, A.; Al-Nimr, M.A. A hybrid PV/T and Kalina cycle for power generation. Int. J. Energy Res. 2018, 42, 4817–4829. [Google Scholar] [CrossRef]
  11. Harris, C.B.; Meyers, J.P.; Webber, M.E. A unit commitment study of the application of energy storage toward the integration of renewable generation. J. Renew. Sustain. Energy 2012, 4, 013120. [Google Scholar] [CrossRef] [Green Version]
  12. Al-Ghussain, L.; Samu, R.; Taylan, O.; Fahrioglu, M. Sizing renewable energy systems with energy storage systems in microgrids for maximum cost-efficient utilization of renewable energy resources. Sustain. Cities Soc. 2020, 55, 102059. [Google Scholar] [CrossRef]
  13. Najjar, Y.S.; Abubaker, A.M. Thermoeconomic analysis and optimization of a novel inlet air cooling system with gas turbine engines using cascaded waste-heat recovery. Energy 2017, 128, 421–434. [Google Scholar] [CrossRef]
  14. Al-Ghussain, L.; Taylan, O.; Fahrioglu, M. Sizing of a photovoltaic-wind-oil shale hybrid system: Case analysis in Jordan. J. Sol. Energy Eng. 2018, 140, 011002. [Google Scholar] [CrossRef]
  15. Anagreh, Y.N.; Bataineh, A.S. Renewable energy potential assessment in Jordan. Renew. Sustain. Energy Rev. 2011, 15, 2232–2239. [Google Scholar] [CrossRef]
  16. Cromartie, J. What is Rural? Available online: https://www.ers.usda.gov/topics/rural-economy-population/rural-classifications/what-is-rural/#:~:text=According%20to%20this%20system%2C%20rural,with%20fewer%20than%202%2C500%20people (accessed on 17 September 2020).
  17. Azad, H.B.; Mekhilef, S.; Saidur, R.; Boroumandjazi, G. Potential application of renewable energy for rural electrification in Malaysia. Renew. Energy 2013, 59, 210–219. [Google Scholar] [CrossRef]
  18. Alazraque-Cherni, J. Renewable energy for rural sustainability in developing countries. Bull. Sci. Technol. Soc. 2008, 28, 105–114. [Google Scholar] [CrossRef] [Green Version]
  19. Anderson, D. Energy and economic prosperity. In World Energy Assessment: Energy and the Challenges of Sustainability; Goldemberg, J., Ed.; United Nations Development Programme: New York, NY, USA, 2000; pp. 393–414. [Google Scholar]
  20. Abujubbeh, M.; Al-Turjman, F.; Fahrioglu, M. Software-defined wireless sensor networks in smart grids: An overview. Sustain. Cities Soc. 2019, 51, 101754. [Google Scholar] [CrossRef]
  21. Al-Turjman, F.; Abujubbeh, M. IoT-enabled smart grid via SM: An overview. Futur. Gener. Comput. Syst. 2019, 96, 579–590. [Google Scholar] [CrossRef]
  22. Noor-A-Rahim, M.; Khyam, M.O.; Li, X.; Pesch, D. Sensor fusion and state estimation of IoT enabled wind energy conversion system. Sensors 2019, 19, 1566. [Google Scholar] [CrossRef] [Green Version]
  23. Pan, J.; Jain, R.; Paul, S.; Vu, T.; Saifullah, A.; Sha, M. An internet of things framework for smart energy in buildings: Designs, prototype, and experiments. IEEE Internet of Things J. 2015, 2, 527–537. [Google Scholar] [CrossRef] [Green Version]
  24. Al-Ghussain, L.; Ahmed, H.; Haneef, F. Optimization of hybrid PV-wind system: Case study Al-Tafilah cement factory, Jordan. Sustain. Energy Technol. Assess. 2018, 30, 24–36. [Google Scholar] [CrossRef]
  25. Hrayshat, E.S. Wind resource assessment of the Jordanian southern region. Renew. Energy 2007, 32, 1948–1960. [Google Scholar] [CrossRef]
  26. Alsaad, M.A. Wind energy potential in selected areas in Jordan. Energy Convers. Manag. 2013, 65, 704–708. [Google Scholar] [CrossRef]
  27. Deshmukh, M.; Deshmukh, S. Modeling of hybrid renewable energy systems. Renew. Sustain. Energy Rev. 2008, 12, 235–249. [Google Scholar] [CrossRef]
  28. Essalaimeh, S.; Al-Salaymeh, A.; Abdullat, Y. Electrical production for domestic and industrial applications using hybrid PV-wind system. Energy Convers. Manag. 2013, 65, 736–743. [Google Scholar] [CrossRef]
  29. Halasa, G.; Asumadu, J.A. Wind-solar hybrid electrical power production to support national grid: Case study-Jordan. In Proceedings of the IEEE 6th International Power Electronics and Motion Control Conference, Wuhan, China, 17–20 May 2009; pp. 903–909. [Google Scholar]
  30. Aiad, M.; Badran, A.; Shihabi, S. Optimal selection of hybrid PV/wind systems for jordanian conditions. In Proceedings of the GCREEDER, Amman, Jordan, 10–12 September 2013; pp. 1–9. [Google Scholar]
  31. Dihrab, S.S.; Alghoul, M.; Sopian, K.; Sulaiman, M. Potential of hybrid PV/wind turbine system in Jordan. In Proceedings of the Global Conference on Renewables and Energy Efficiency for Desert Regions, Amman, Jordan, 31 March–2 April 2009. [Google Scholar]
  32. Jaber, J.O. Prospects and challenges of small hydropower development in Jordan. Jordan J. Mech. Ind. Eng. 2012, 6, 110–118. [Google Scholar]
  33. Bekele, G.; Tadesse, G. Feasibility study of small Hydro/PV/Wind hybrid system for off-grid rural electrification in Ethiopia. Appl. Energy 2012, 97, 5–15. [Google Scholar] [CrossRef]
  34. Delucchi, M.A.; Jacobson, M.Z. Providing all global energy with wind, water, and solar power, Part II: Reliability, system and transmission costs, and policies. Energy Policy 2011, 39, 1170–1190. [Google Scholar] [CrossRef]
  35. Al-Momani, A. Estimated Population 2019 and Some Selected Data; Department of Statistics: Amman, Jordan, 2020.
  36. City Population. Available online: https://www.citypopulation.de/en/jordan/tafilah/?fbclid=IwAR0v2OxWg_BsQFkG4sbAj_2Ub_68xmfV_zvNO7T5uczIPPapasmrHOlk0HY (accessed on 17 September 2020).
  37. Kiwan, S.; Al-Gharibeh, E. Jordan toward a 100% renewable electricity system. Renew. Energy 2020, 147, 423–436. [Google Scholar] [CrossRef]
  38. Duffle-John, A.; Beckman-William, A. Solar Engineering of Thermal Processes; John Wiley & Sons: New York, NY, USA, 2006. [Google Scholar]
  39. Manwell, J.F.; McGowan, J.G.; Rogers, A.L. Wind Energy Explained:Theory, Design and Application; Wiley: Hoboken, NJ, USA, 2009. [Google Scholar]
  40. Al-Ghussain, L.; Taylan, O.; Samu, R.; Fahrioglu, M. Techno-Economic Analysis of Photovoltaic-Hydrogen Fuel Cell/Pumped Hydro Storage System for Micro Grid Applications: Case Study in Cyprus. In Proceedings of the 2018 International Conference on Photovoltaic Science and Technologies (PVCon), Ankara, Turkey, 4–6 July 2018; Institute of Electrical and Electronics Engineers (IEEE): Piscataway, NJ, USA, 2018; pp. 1–6. [Google Scholar]
  41. IRENA. Renewable Energy Cost Analysis: Hydropower; IRENA Press: Abu Dhabi, UAE, 2012. [Google Scholar]
  42. Sadati, S.S.; Jahani, E.; Taylan, O. Technical and economic analyses for sizing PV power plant with storage system for METU NCC. In Proceedings of the ASME International Mechanical Engineering Congress and Exposition, Houston TX, USA, 13–15 November 2015; American Society of Mechanical Engineers: New York, NY, USA, 2015. [Google Scholar]
  43. Al-Ghussain, L.; Samu, R.; Taylan, O.; Fahrioglu, M. Techno-economic comparative analysis of renewable energy systems: Case study in Zimbabwe. Inventions 2020, 5, 27. [Google Scholar] [CrossRef]
  44. El-Tous, Y.; Al-Battat, S.; Hafith, S.A. Hybrid wind-PV grid connected power station case study: Al Tafila, Jordan. Int. J. Energy Environ. 2012, 3, 605–616. [Google Scholar]
  45. Al-Ghussain, L.; Taylan, O. Sizing methodology of a PV/wind hybrid system: Case study in Cyprus. Environ. Prog. Sustain. Energy 2018, 38, e13052. [Google Scholar] [CrossRef]
  46. Al-Ghussain, L.; Taylan, O.; Baker, D.K. An investigation of optimum PV and wind energy system capacities for alternate short and long-term energy storage sizing methodologies. Int. J. Energy Res. 2019, 43, 204–218. [Google Scholar] [CrossRef] [Green Version]
  47. Fichter, T.; Trieb, F.; Moser, M.; Kern, J. Optimized integration of renewable energies into existing power plant portfolios. Energy Procedia 2014, 49, 1858–1868. [Google Scholar] [CrossRef] [Green Version]
  48. Yamchi, H.B.; Shahsavari, H.; Kalantari, N.T.; Safari, A.; Farrokhifar, M. A cost-efficient application of different battery energy storage technologies in microgrids considering load uncertainty. J. Energy Storage 2019, 22, 17–26. [Google Scholar] [CrossRef]
  49. Sangster, A.J. Solar photovoltaics. In Electromagnetic Foundations of Solar Radiation Collection; Springer International Publishing: Cham, Switzerland, 2014; pp. 145–172. [Google Scholar]
  50. Breeze, P. Wind Power Generation; Academic Press: Cambridge, MA, USA, 2016. [Google Scholar]
  51. Yang, H.; Wei, Z.; Chengzhi, L. Optimal design and techno-economic analysis of a hybrid solar–wind power generation system. Appl. Energy 2009, 86, 163–169. [Google Scholar] [CrossRef]
  52. Company, J.E.P. Available online: http://www.jepco.com.jo/jepco/index.php?option=com_content&view=frontpage&Itemid=1&lang=en (accessed on 17 September 2020).
  53. IRENA. Future of Solar Photovoltaic: Deployment, Investment, Technology, Grid Integration and Socio-Economic Aspects (A Global Energy Transformation: Paper); International Renewable Energy Agency: Abu Dhabi, UAE, 2019. [Google Scholar]
  54. Najjar, Y.S.; Manaserh, Y.M.A. Aligning combined cycle power plant performance with field measurements. Arab. J. Sci. Eng. 2019, 44, 1657–1669. [Google Scholar] [CrossRef]
  55. Mathiesen, B.V.; Lund, H.; Karlsson, K.B. 100% Renewable energy systems, climate mitigation and economic growth. Appl. Energy 2011, 88, 488–501. [Google Scholar] [CrossRef]
  56. Dubey, S.; Sarvaiya, J.N.; Seshadri, B. Temperature dependent photovoltaic (PV) efficiency and its effect on pv production in the world—A review. Energy Procedia 2013, 33, 311–321. [Google Scholar] [CrossRef] [Green Version]
  57. Al-Nimr, M.A.; Kiwan, S.; Sharadga, H. Simulation of a novel hybrid solar photovoltaic/wind system to maintain the cell surface temperature and to generate electricity. Int. J. Energy Res. 2018, 42, 985–998. [Google Scholar] [CrossRef]
  58. Reich, N.H.; Mueller, B.; Armbruster, A.; van Sark, W.; Kiefer, K.; Reise, C. Performance ratio revisited: Is PR > 90% realistic? Prog. Photovoltaics: Res. Appl. 2012, 20, 717–726. [Google Scholar] [CrossRef]
  59. Ueda, Y.; Kurokawa, K.; Kitamura, K.; Yokota, M.; Akanuma, K.; Sugihara, H. Performance analysis of various system configurations on grid-connected residential PV systems. Sol. Energy Mater. Sol. Cells 2009, 93, 945–949. [Google Scholar] [CrossRef]
Figure 1. Energy flowchart of the photovoltaic (PV)/wind/hydro hybrid system: (a) Without an energy storage system (ESS) and (b) with ESS.
Energies 13 04908 g001
Figure 2. The optimization procedure of the hybrid system components.
Energies 13 04908 g002
Figure 3. Demand met by the renewable energy system (RES) components without ESS (levelized cost 4 of electricity (LCOE) of 0.12 $/kWh).
Energies 13 04908 g003
Figure 4. Monthly energy generation by the RES components without ESS.
Energies 13 04908 g004
Figure 5. Demand met by the RES components with ESS (LCOE of 0.12 $/kWh).
Energies 13 04908 g005
Figure 6. Monthly energy generation by the RES components with ESS (LCOE of 0.12 $/kWh).
Energies 13 04908 g006
Figure 7. Demand met by the RES components with ESS (LCOE of 0.165 $/kWh).
Energies 13 04908 g007
Figure 8. Monthly energy generation by the RES components with ESS (LCOE of 0.165 $/kWh).
Energies 13 04908 g008
Figure 9. The sensitivity of the RES fraction to the variations in the: (a) Solar and wind resources and (b) demand.
Energies 13 04908 g009
Figure 10. The sensitivity of the LCOE to the variations in the: (a) Solar and wind resources, (b) demand, (c) RES costs, and (d) annual discount rate.
Energies 13 04908 g010
Table 1. The components of the optimization problem.
Decision VariablesObjective FunctionsConstraints
Without ESSWith ZBB
PV and wind capacitiesPV, wind and ZBB capacitiesMaximizing FRLCOE ≤ 0.12
Table 2. The economic parameters of the PV, the wind, and the hydropower systems in addition to the electricity purchase tariff and the annual discount rate for Al-Tafilah, Jordan.
ParameterValueReference
PV system capital cost ($/kW)1533[47]
Wind system capital cost ($/kW)1516[47]
Hydropower capital cost ($/kW)3000[41]
Zinc-Bromine capital cost ($/kW)195[48]
PV system maintenance cost ($/kW)24.68[49]
Wind system maintenance cost ($/kW)39.53[50]
Hydro power maintenance cost ($/kW)75[41]
System expected lifetime (Years)25[41,48,51]
Electricity purchase tariff ($/MWh)120[52]
Annual discount rate (%)5[37]
Table 3. Technical and economic performance parameters of the PV/wind-hydro system without ESS.
ParameterValue
PV Capacity (MW)29.37
Wind Capacity (MW)56
Hydropower Capacity (MW)1
Capacity Factor (%)26
RES Fraction (%)71.5
LCOE ($/kWh)0.12
NPV (M$)167.53
PBP (Years)6.235
Table 4. Technical and economic performance parameters of the PV/wind-hydro system with ESS.
ParameterValue
ConstrainedUnconstrained
PV Capacity (MW)75.4116.39
Wind Capacity (MW)2826
Hydropower Capacity (MW)11
ZBB (GWh)0.2590.415
Capacity Factor (%)22.4821.55
RES Fraction (%)98.7999.93
LCOE ($/kWh)0.120.165
NPV (M$)119.55140.45
PBP (Years)99.62

