Article

Experimental Study on the Performance of an SI Engine Fueled by Waste Plastic Pyrolysis Oil–Gasoline Blends †

by
Khairil
1,*,
Teuku Meurah Indra Riayatsyah
1,
Samsul Bahri
1,
Sarwo Edhy Sofyan
1,
Jalaluddin Jalaluddin
1,
Fitranto Kusumo
2,
Arridina Susan Silitonga
2,3,
Yanti Padli
4,
Muhammad Jihad
1 and
Abd Halim Shamsuddin
2
1
Department of Mechanical Engineering, Universitas Syiah Kuala, Banda Aceh 23111, Indonesia
2
College Institute of Sustainable Energy, Universiti Tenaga Nasional, Kajang 43000, Malaysia
3
Department of Mechanical Engineering, Politeknik Negeri Medan, Medan 20155, Indonesia
4
School of Chemical and Biomolecular Engineering, University of Sydney, Sydney 2006, NSW, Australia
*
Author to whom correspondence should be addressed.
This paper is an extended version of our paper published in International Conference on Sustainable Energy and Green Technology 2019, Bangkok, Thailand, 11–14 December 2019, doi:10.1088/1755-1315/463/1/012002.
Energies 2020, 13(16), 4196; https://doi.org/10.3390/en13164196
Submission received: 27 May 2020 / Revised: 17 July 2020 / Accepted: 7 August 2020 / Published: 14 August 2020
(This article belongs to the Special Issue Green Energy Technology)

Abstract

:
Pyrolyzed waste plastic-based green fuel has been reported to be used as an alternate fuel for diesel engines. Some of the main challenges for implementing this in current automotive technology include evaluating engine performance, emission, noise vibration harshness (NVH), and knock characteristics of this fuel. This study focuses on the engine performance of poly-ethylene terephthalate (PET)-based waste plastic oil (WPO) at varying engine speed conditions. The pyrolysis of mixed-waste plastic was carried out at 300 °C in a fixed-bed reactor. Physicochemical properties such as viscosity, density, calorific value, sulfur, and research octane number (RON) of the plastic fuel and its blends with gasoline were analyzed using ASTM standard test methods. The WPO was blended with two different types of gasoline (RON88 and RON90) at 10, 20, and 30%, and was tested in a spark-ignition (SI) engine. The experimental results showed that different WPO–gasoline blends can be used in an SI engine without any engine modifications, and the performance indicators for different blends were found to be close to that of pure gasoline. The brake power and brake specific fuel consumption (BSFC) were found to be 4.1 kW and 0.309 kg/kW h, respectively. The 10% WPO and 90% RON90 blend produced optimal engine performance at 3500 rpm.

1. Introduction

Presently, increasing world energy demand is causing an increase in the consumption of fossil fuels, which also causes a negative impact on global warming and the overall environment. Moreover, fossil fuel resources continue to deplete every year due to their non-renewable nature [1,2]. This has prompted researchers to investigate alternative fuels both from waste materials and renewable feedstock to reduce dependence on fossil fuel and ensuing air pollution. Some of the renewable energy sources that have been widely explored include biofuel [3], wind [4], solar [5], geothermal [4], and nuclear energy. Each type of energy sources possesses some advantages and drawbacks. For example, solar and wind energy suffer difficulties in energy storage since they are unstable and available only at certain times [6]. This can be addressed by appropriate energy storage material that can save a large amount of energy, such as phase-change materials that can replace current batteries [7]. On the other hand, energy coming from agricultural waste, or tropical biodiversity of non-edible origin, is still one of the best choices in developing countries, such as Indonesia and Malaysia, as they directly address the issue of energy sustainability [8,9].
Plastic has been widely produced and used since the early 20th century. The use of plastic has risen rapidly and it is presently used in almost every economic sector for packaging products, as it is an easy material to procure as well as to form into an end product. At present, the use of plastic materials in western European countries has reached 60 kg/person/year and 80 kg/person/year in the USA, while in India it is only 2 kg/person/year [10]. High plastic waste is related to population and waste management. Around 80% of plastic waste comes from the mainland. In 2019, waste in Indonesia reached 68 million tons, with 14% of this being plastic waste, at 9.52 million tons. With an estimated 0.7 kg/day of garbage produced by each person, the average daily amount of rubbish dumped in metropolitan cities is approximately 1300 tons/day (the population is more than 1 million) [11]. Furthermore, Indonesia is second highest dumper of plastic waste into world’s oceans, after China, depositing approximately 1.29 million tons per year, compared to China’s 3.53 million tons per year [11,12]. Managing plastic waste has always been a big problem. Besides being non-biodegradable and difficult to manage, plastic waste can also pollute soil. Standard plastic bags generally made from poly-ethylene are not biodegradable. However, photodegradation can occur in plastics. When exposed to ultraviolet rays from sunlight, the structure becomes fragile and breaks into pieces, which takes a long time. Experts estimate that at least 500 to 1000 years are needed for this decomposition to take place [11]. The negative effects of trash in the ocean has resulted in many marine biota experiencing metabolic disorders, irritation of the digestive system, and death resulting from plastic consumption. According to the Australian Coral Reef Research Center (ACRRC), reefs exposed to plastic waste have about an 89% chance of being affected by diseases, compared to just 4% for reefs not affected by plastic waste. Coral reefs most exposed to plastic wastes appear in Indonesia, which is approximately 26 parts per 100 square meters [13]. Waste management with the theme “3R” (Rescue, Reduce, Recycle) has been considered ineffective.
Several types of plastics commonly used as raw materials are poly-ethylene terephthalate (PET), High-Density Poly-Ethylene (HDPE), Polyvinyl Chloride (PVC), Low-Density Poly-Ethylene (LDPE), Poly Propylene (PP), etc. Among these, PET with the chemical formula (C10H8O4)n, is widely available at landfills as it is used as a raw material for mineral-water bottles. It is also very difficult to decompose. One of the advantages of PET plastic waste is that it can be recycled into various types of goods that have economic value such as clothing, bags, furniture, and carpet. Another use of PET plastic is to convert it to fuel oil via pyrolysis [14]. It has been reported in the literature that PET has moderate to high conversion compared to other plastic wastes such as LDPE and HDPE [14,15]. PET plastic possesses a high calorific value, which makes the conversion process using pyrolysis very effective [16].
Based on the literature, it is necessary to find a technique that reduces the amount of plastic waste, by converting plastic waste into an alternative fuel. Many researchers have investigated techniques that would reduce plastic waste in a short time, which is to convert plastic waste into fuel oil via pyrolysis [17], specifically by heating the polymer material without or using only a little oxygen [18,19]. Pyrolysis is the process of thermo-chemical decomposition of organic compounds through the heating process without or in the presence of only a small amount of oxygen and other chemical reagents [20]. Pyrolysis thermally decomposes long-chain polymer molecules into less complex molecules [21]. Pyrolysis has been chosen by many researchers due to its ability to produce a high oil yield of up to 80 wt.% at a temperature of about 500 °C. In many industrial applications, pyrolysis is carried out at atmospheric pressure and operating temperatures above 430 °C. Figure 1 shows the chemical reaction of the pyrolysis process. Pyrolysis is divided into three types: hydrocracking, thermal cracking, and catalytic cracking. According to Cleetus et al. [22], PET undergoes pyrolysis that produces different gases i.e., CO2 and CO, and other miscellaneous hydrocarbons. Furthermore, condensation occurring in the heat-exchange process produces plastic oil with the chemical formula C13.8H23.56 [23]. There are three major products produced during pyrolysis. These are oil, gas, and char, which is valuable for industries, especially production and refineries [24,25,26].
Previous research on the pyrolysis of waste plastic oil as has been reported by Ramadhan and Ali [27]. They produced pyrolysis oil from waste LDPE and HDPE at temperatures of 250 °C to 420 °C and found that oil characteristics are similar to that of diesel fuel. Sarker et al. [28] studied the thermal cracking of waste LDPE under temperatures of 150 °C to 420 °C without a catalyst and found that the produced oil properties are similar to those of kerosene.
In Indonesia, the fuel vendorship is distributed by state-owned enterprises (Pertamina) throughout the country. Indonesia has several grades for both diesel and gasoline. Gasoline and diesel fuel standards were updated in 2013. Government regulations stipulate that gasoline fuel should maintain the Euro 2 sulfur limit for RON 88, eliminating lead in the fuel. For diesel fuel, the minimum limit for a cetane number of 48 is mandated in government regulations. There are four types of gasoline grades sold in Indonesia, namely Premium (RON88), Pertalite (RON90), Pertamax (RON91), and Pertamax Plus (RON95) [29]. The Ministry of Energy has since 2008 mandated a minimum limit of biofuel volume to be blended into gasoline and diesel fuels [3,30]. This regulation has undergone several updates. The most recent one, released in 2015, set the bioethanol blend in gasoline to be 5% in 2016 and 10% in 2020. In addition, the biodiesel percentage in diesel for the transportation sector was set to be 20% in 2016 and 30% in 2020.
Previous studies have investigated the use of plastic oil as fuel in gasoline engines. One of them was done by Khan et al. Related to the characteristics of WPO–diesel blends, the study obtained a maximum yield of 77.03% within 2 h. Cleetus et al. [22] studied engine performance using WPO–gasoline blends. However, the type of engine used had a low engine speed of about 1500 rpm. It is important to mention that the effect of WPO–gasoline blends on SI engine performance parameters such as engine power, specific fuel consumption (SFC), and thermal efficiency have not been elucidated properly in previous studies. Thus, the objective of this study is to examine the engine performance of two low-RON gasoline (RON 88 and RON90) blended with WPO at varying engine speeds. In doing so, this study also examines the suitability of gasoline–WPO blend fuel for an SI engine as a potential renewable fuel source for future energy supply.

2. Materials and Methods

2.1. Materials

Plastic waste was collected from the final disposal site on the coast of Banda Aceh, Indonesia. Then, plastic waste was washed several times and dried under sunlight. After that, the waste was cut into small pieces. The experiments were carried out in the Laboratory of Fuel Engines and Propulsion Systems, Department of Mechanical Engineering, Faculty of Engineering, Syiah Kuala University.

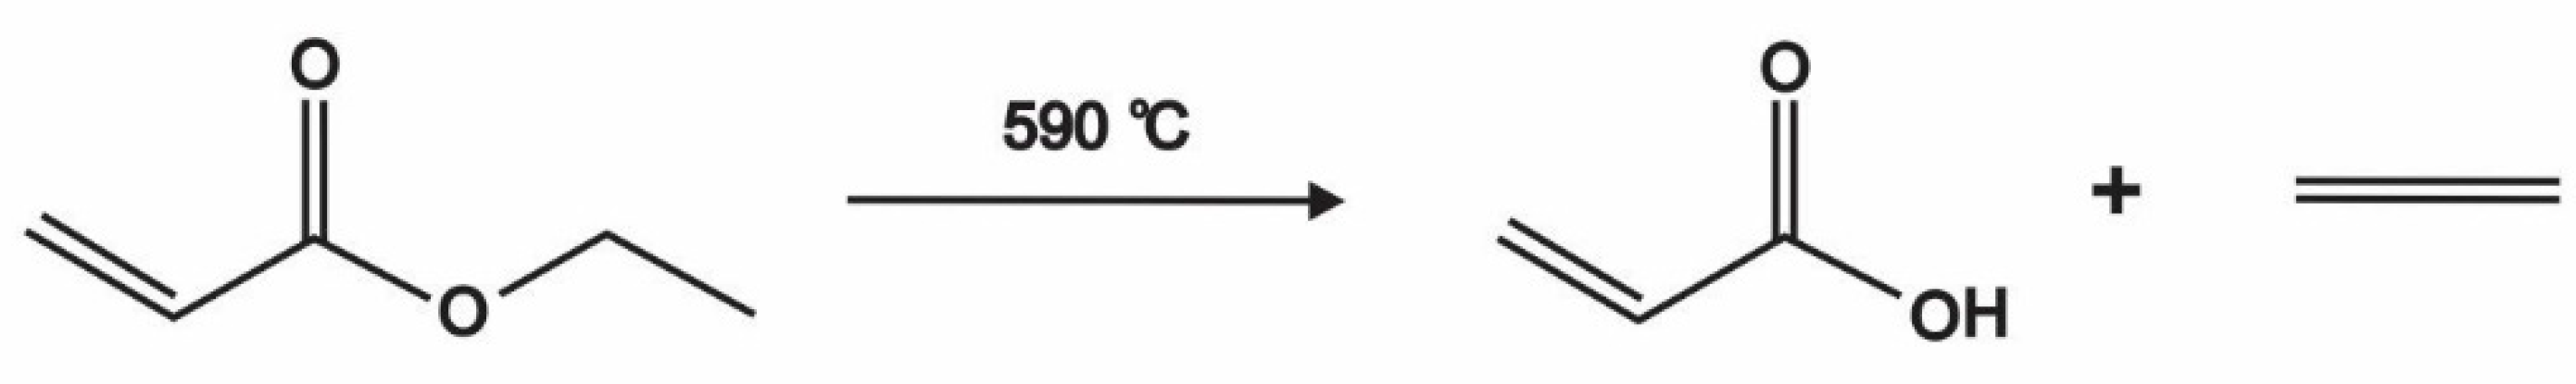
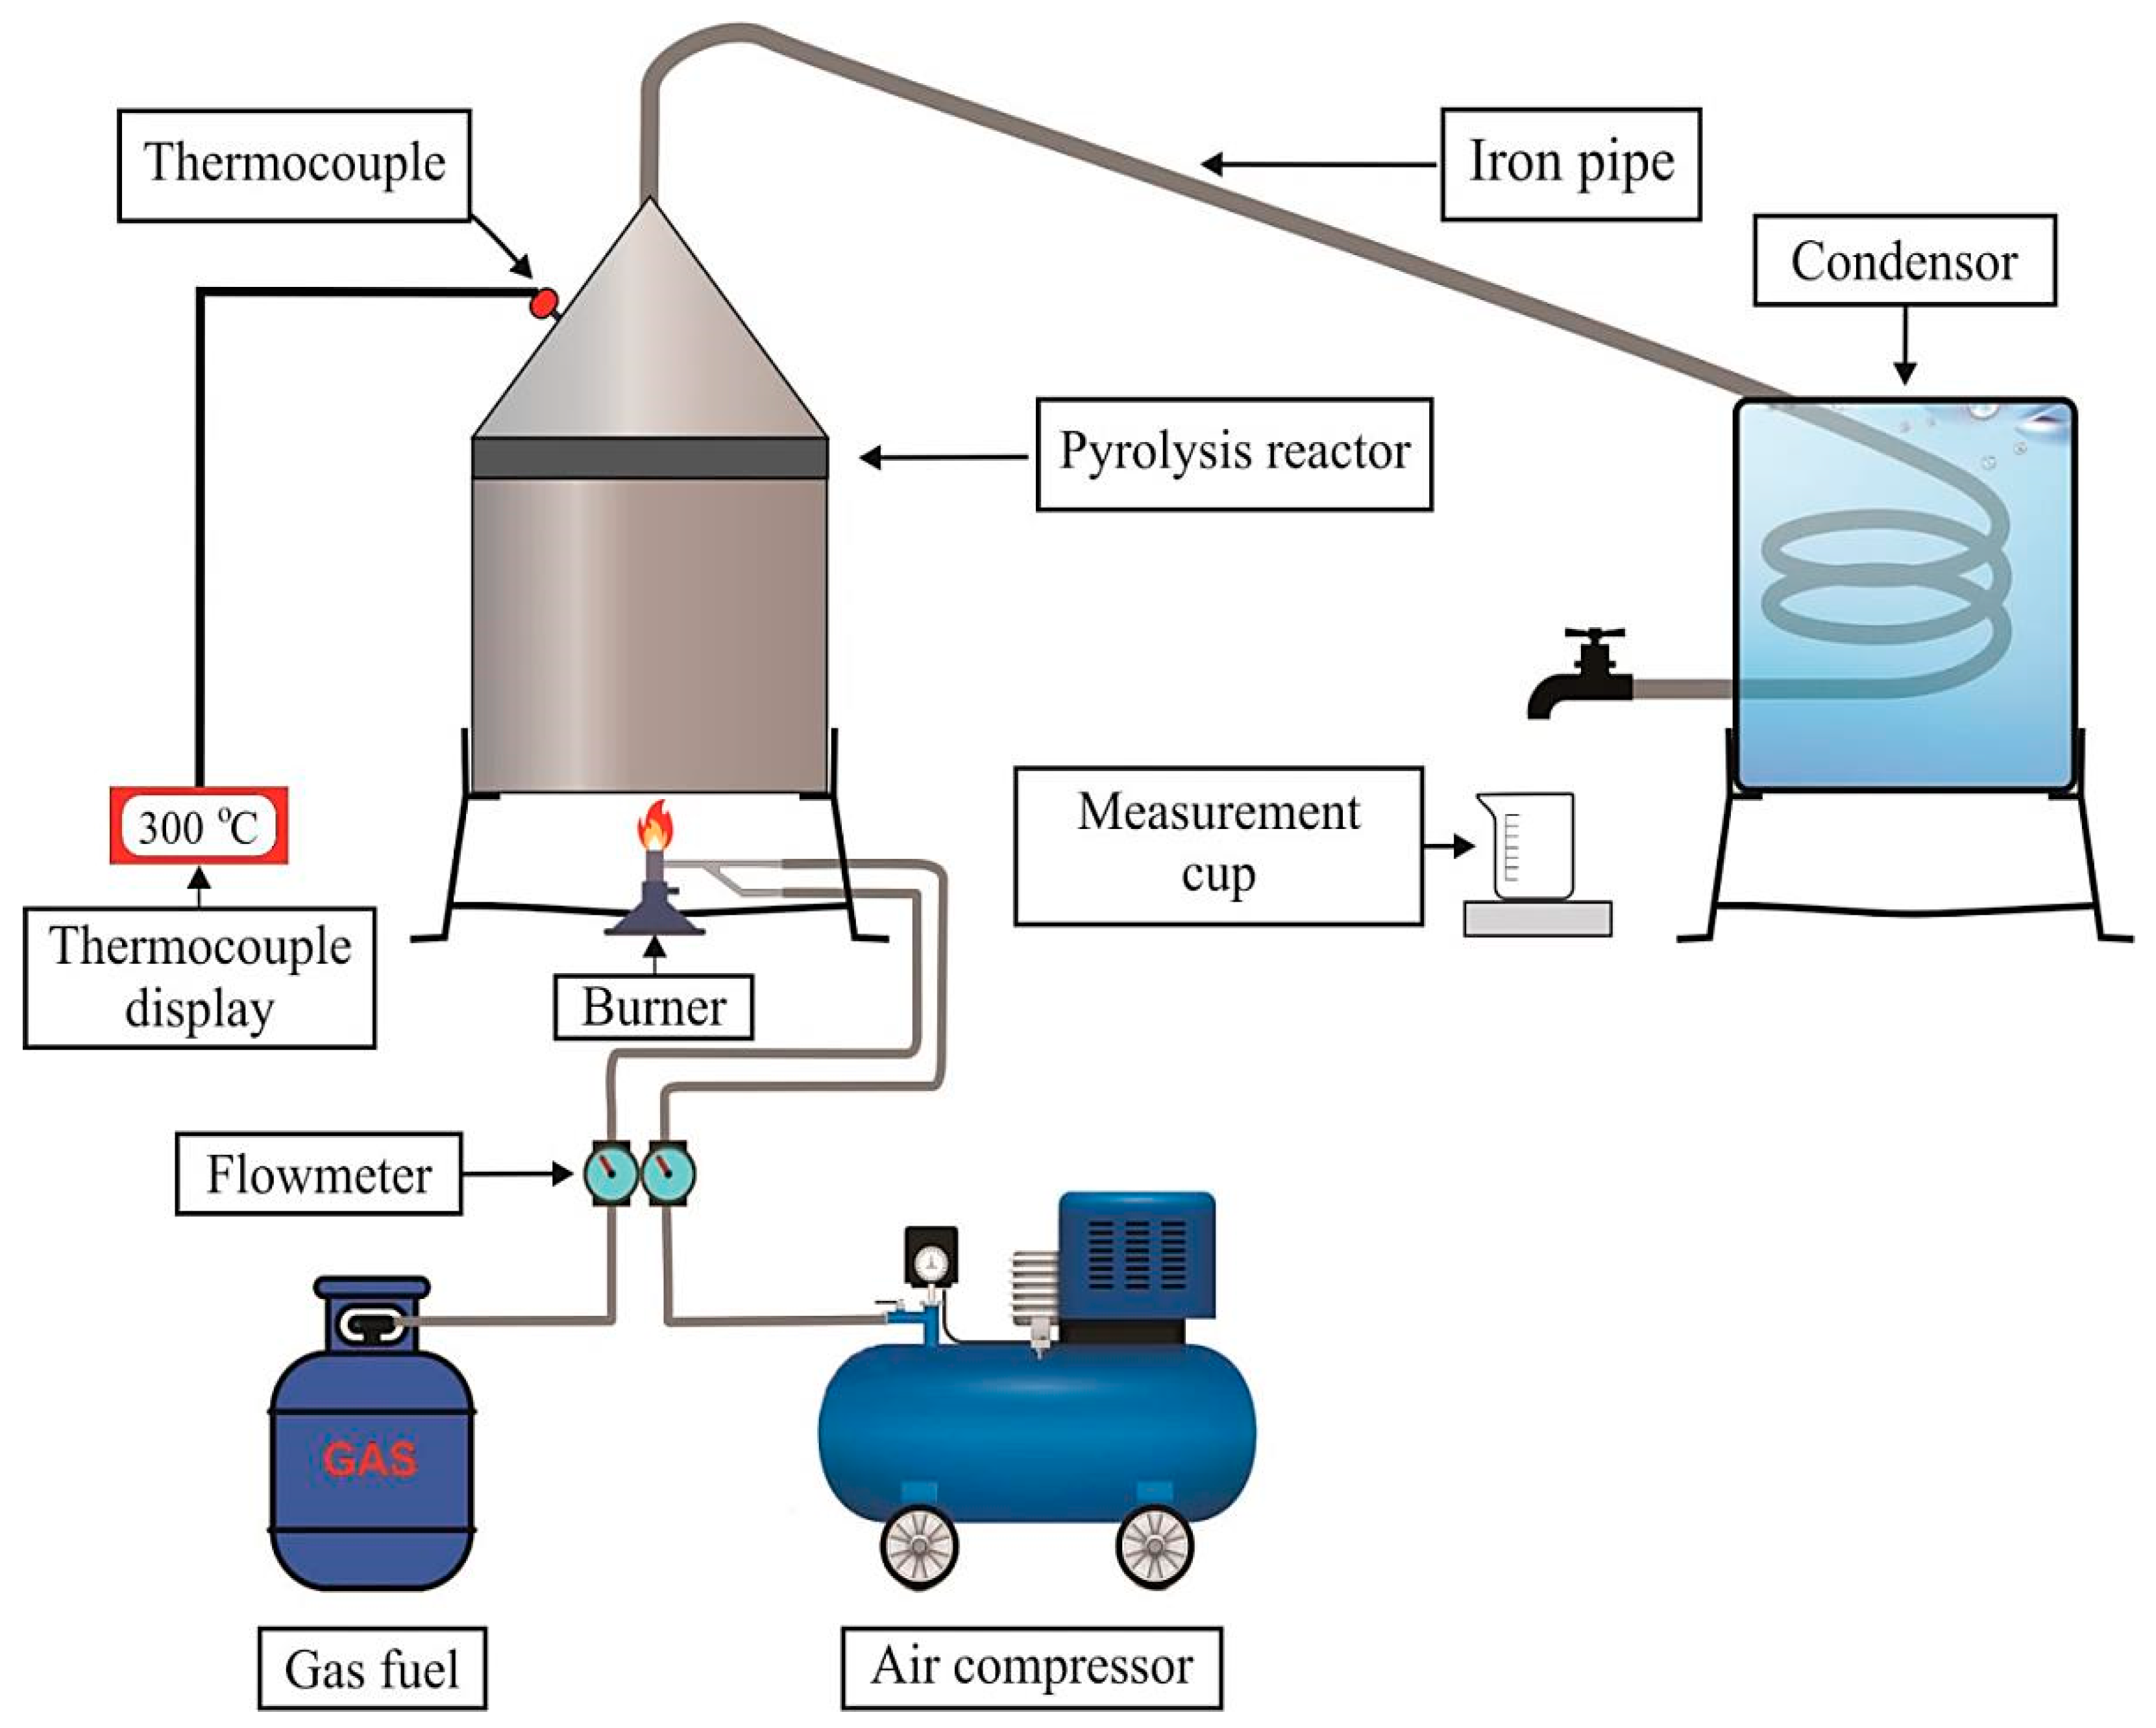
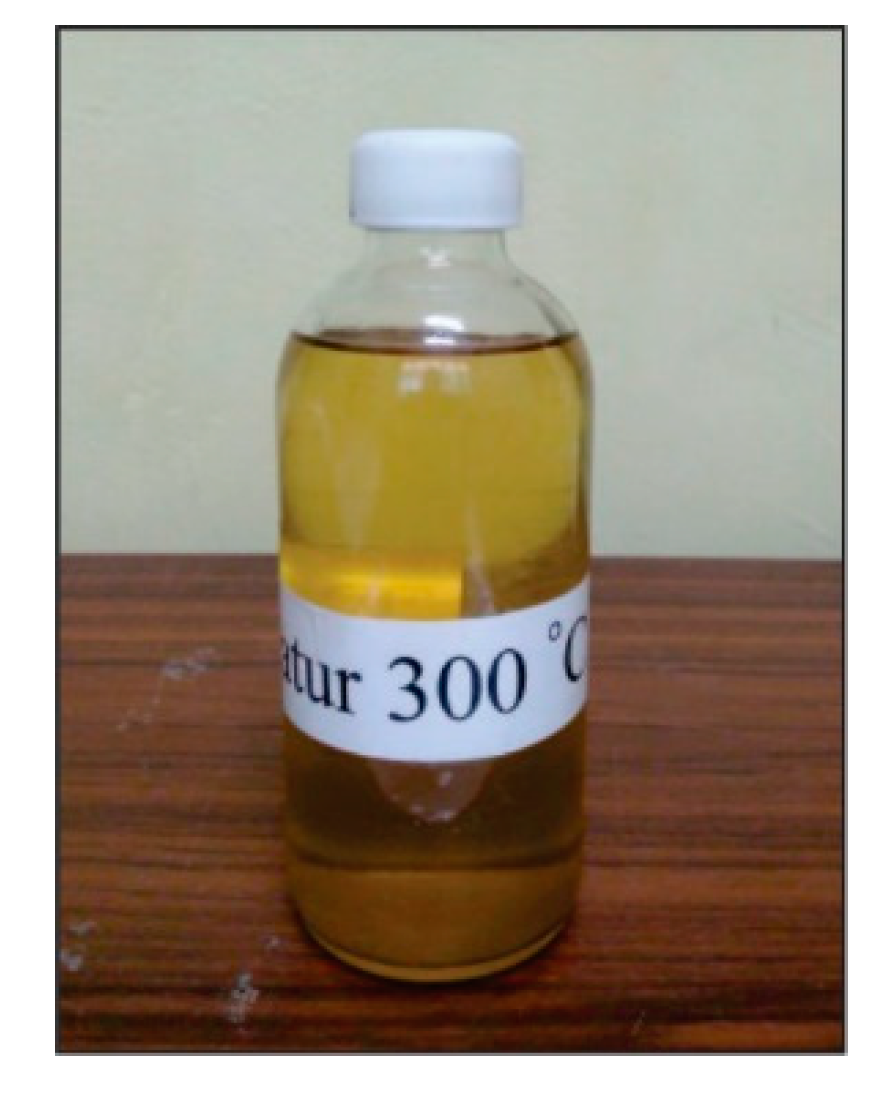
2.2. Production of WPO via Pyrolysis

Before the beginning of pyrolysis process, it was ensured that the raw materials were washed thoroughly, cut into pieces, and dried under sunlight. The PET pieces were then weighed up to 1 kg. Figure 2 shows a schematic diagram of the pyrolysis process for plastic waste. The main component consists of a reactor chamber and condenser. The condenser was connected to a reactor chamber by an iron pipe exchanger submerged in cold water so that the condensation process ran smoothly. Digital thermocouples Type K, Length 30cm and diameter 5 mm was directly connected to the reactor chamber to monitor the temperature of the plastic waste gas from the pyrolysis process. The preparation was finalized by installing an iron pipe with heat insulation cladding between the reactor and condenser. The pyrolysis process used Liquefied Petroleum Gas (LPG) as a provider of thermal energy. The produced gas flowed into the reservoir through the heat exchanger pipe using a condensation process as a liquid oil. The pyrolysis process began by turning on a reactor that was set at 300 °C in a vacuum condition. At the same time, the condenser cooler was supplied. The temperature of the reactor was maintained at 300 °C [31] for 2 h 30 min. As the product gases flowed into the condenser, some compounds were condensed. The parts that did not condense remained in the gas phase. The pyrolyzed oil was collected and weighed for analysis. The oil from the plastic waste can be seen in Figure 3. The oil yield from waste plastic through the pyrolysis process at a temperature of 300 °C produced a 53.8% (w/w) yield of WPO. Sample testing was carried out to determine the chemical content of WPO. The yield, i.e., conversion of plastic to oil, was determined using the following equation [32]:
WPO   yield   ( wt , % ) = Mass   of   oil Mass   of   PET × 100 %

2.3. Fuel Preparation

The fuel compositions of WPO–gasoline blends (RON 88 and RON 90) for the three mixture ratios used in the experiment are shown in Table 1. Three mixtures of WPO and gasoline (RON 88), and three mixtures of WPO and gasoline (RON 90), with different percentages of WPO, specifically 10%, 20%, and 30%, were used in the experiment. WPO–gasoline mixtures (RON 88 and RON 90) were placed in a 1 L beaker, then blending was carried out using a magnetic stirrer for 10 min at a speed of 300 rpm at room temperature. The resultant blends were stored in different bottles, separately. To obtain the physicochemical properties of the oil mixture of WPO–gasoline blends, such as viscosity, density, and calorific value, the equation of mixture-oil properties was used as follows:
C V b l e n d = X 1 × C V W P O + X 2 × C V R O N
where:
CVblend = Calorific value of fuel blends; X1 = Percentages volume of WPO; X2 = Percentages volume of pure gasoline; CVWPO = Calorific value of WPO; CVRON = Calorific value of pure gasoline.

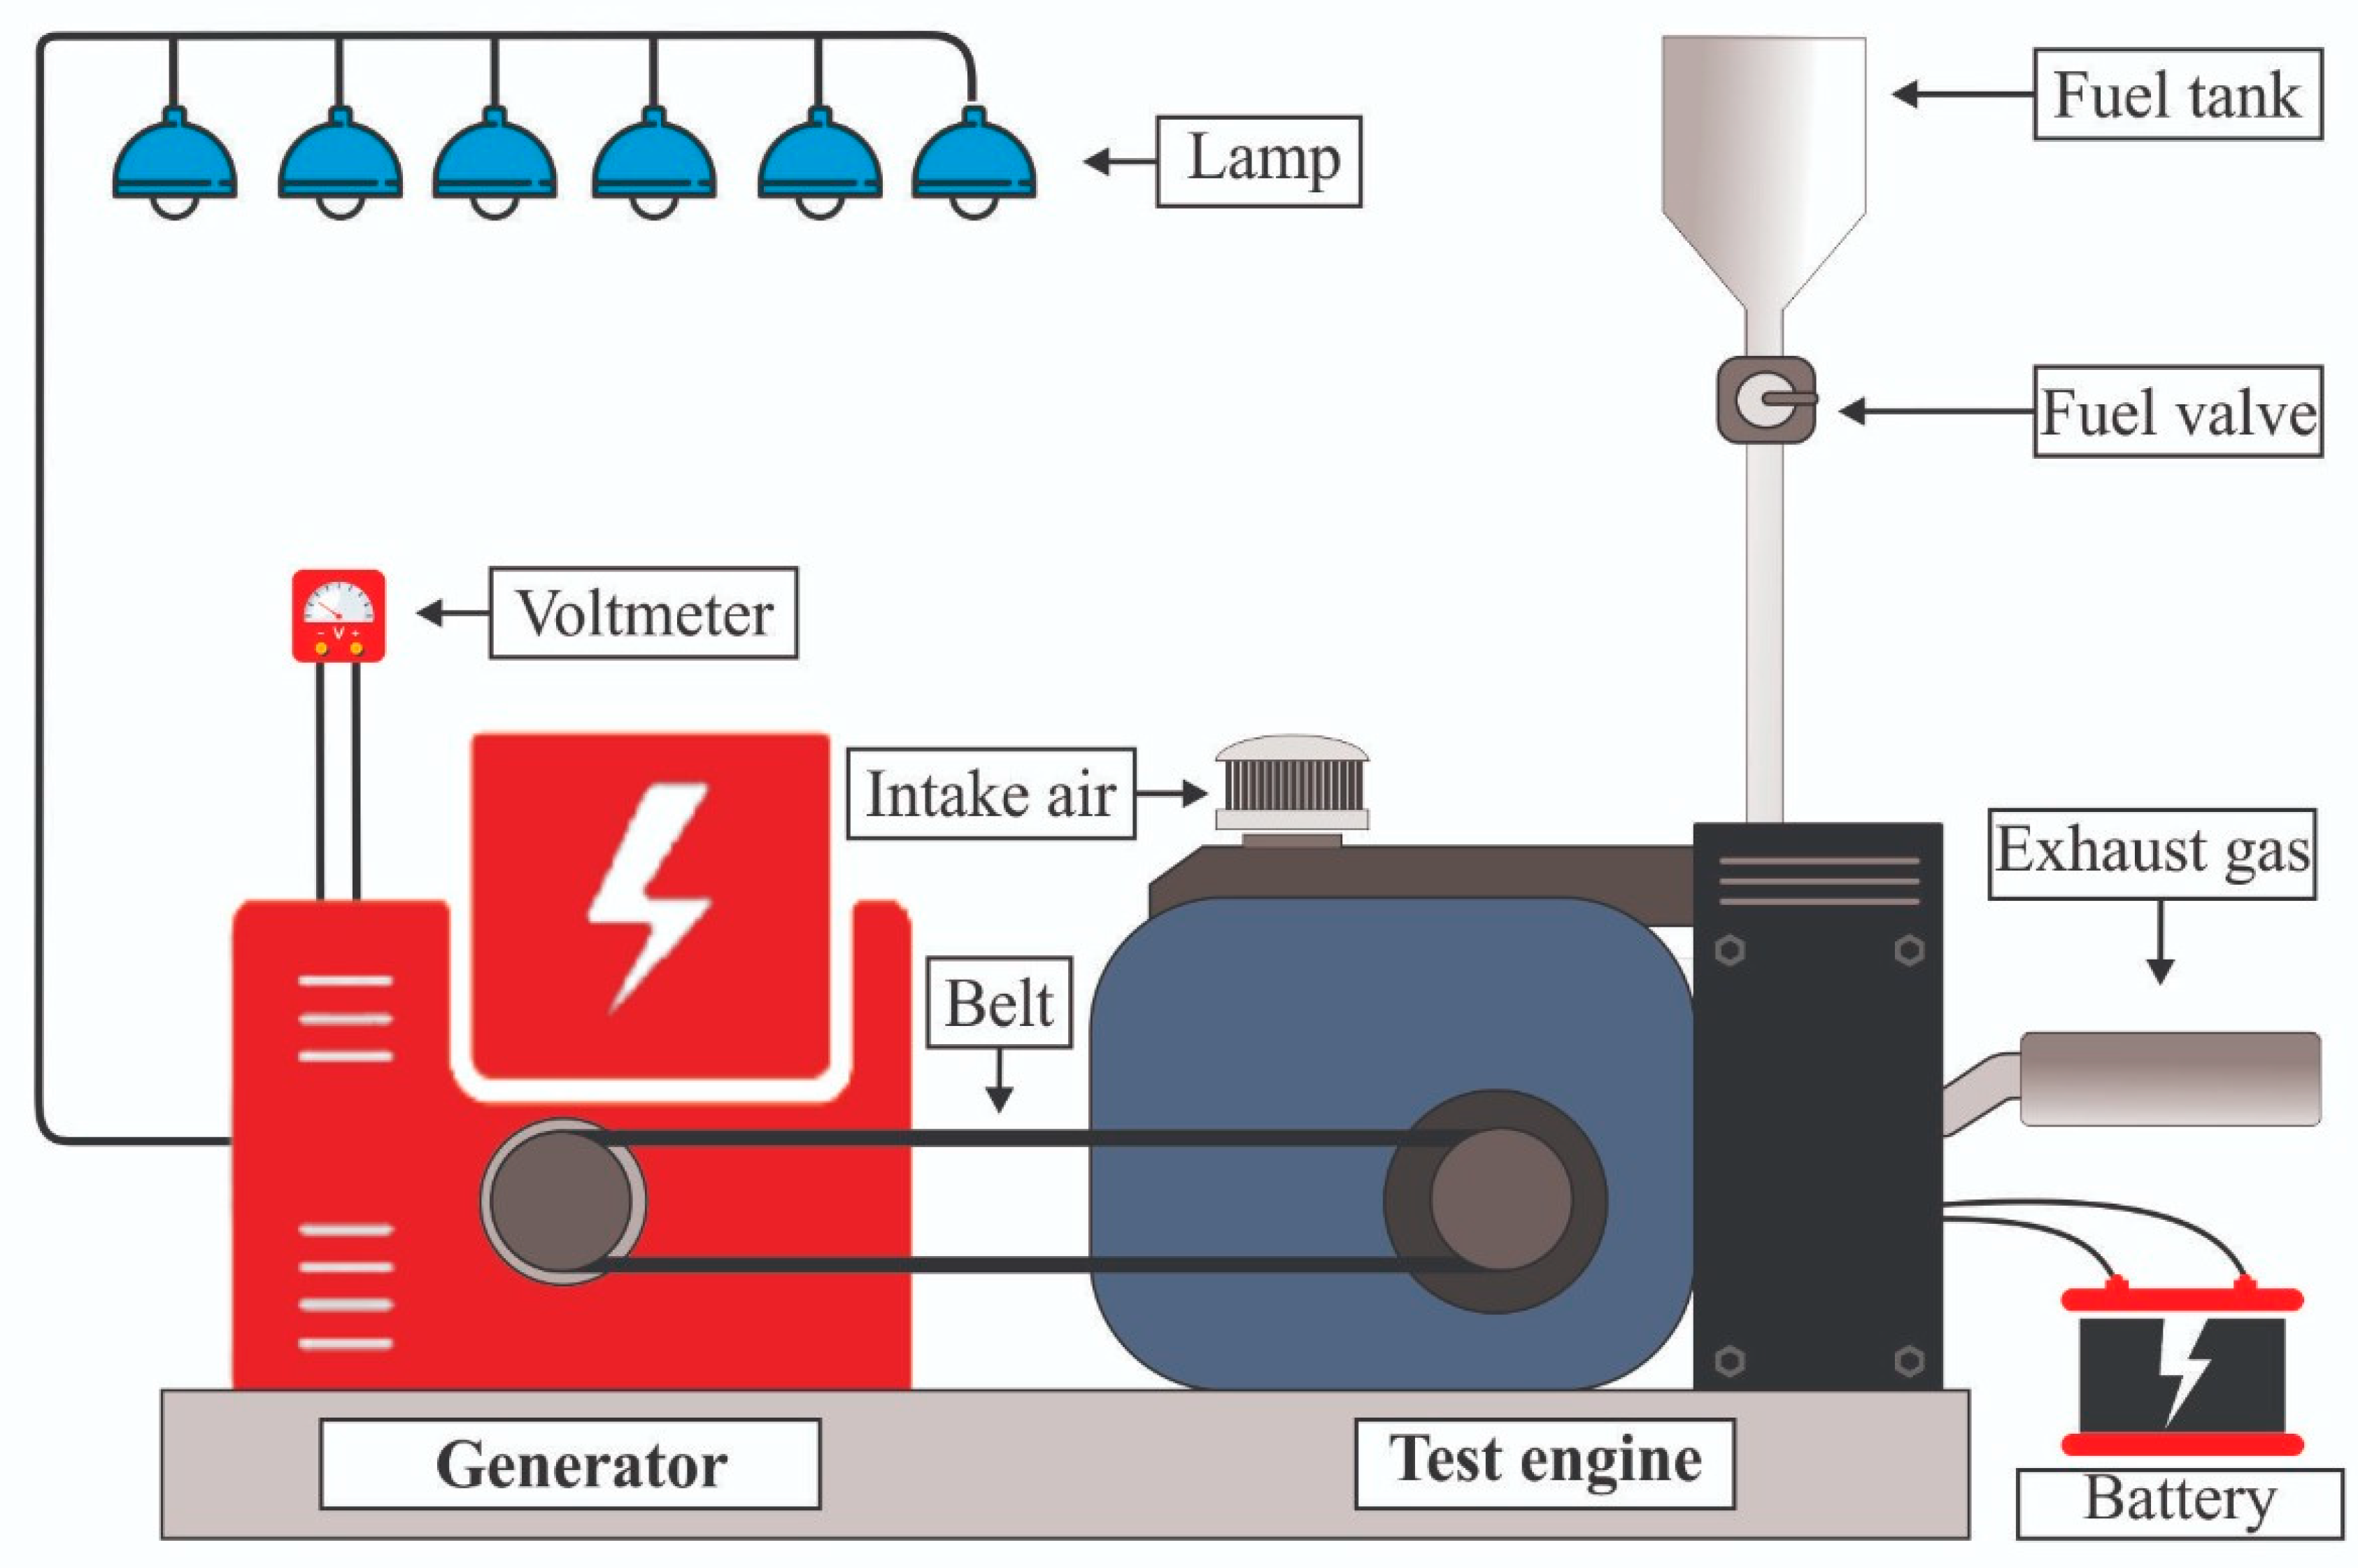
2.4. Engine Performance Test Procedure

A four-stroke 163 cc overhead valve OHV single-cylinder, horizontal-shaft, water-cooled SI engine was used to perform the tests. The specifications of the engine are shown in Table 2. The engine is mated to a generator with maximum load 3 kW and operated at 220 V–50 Hz and connected to 6 (six) lamps (500 watts each) that used a load bank to control the load of the engine during the performance test. The function of the generator is to supply the voltage and electric current to power the 3000-watt six-lamp configuration when the engine consumes the fuel at varying speeds. A schematic diagram of the engine experimental setup is given in Figure 3. The engine test was conducted under speed variation from 1500 to 3000 rpm with 500 rpm intervals for each type of fuel. A tachometer, voltmeter, and clamp meter was used to determine the engine rotation, the voltage input, and the electrical current of engine load, respectively. The experiment was repeated three times, and the mean value was calculated for each sample. Figure 4 shows a schematic diagram of the engine experimental setup.

2.5. Engine Performance

The gasoline engine performance test included measurement and/or calculation of engine power (P), calculation of SFC, and thermal efficiency (ηth).

2.5.1. Engine Power

The power generated by an engine connected to a single-phase alternating current (AC) generator can be calculated by the equation [33],
N b = E .   I .   p f 746   eg
where:
Nb = Engine Power (HP); E = Voltmeter Reader (Volt); I = Ampere meter Reader (Ampere); pf = Power factor for one single phase = 1; eg = Efficiency of electric generators for engines under 50 kVA = 87–89%, for generators using V belts, the power generated is divided by ηb = 0.96.

2.5.2. Specific Fuel Consumption

The SFC is defined as the amount of fuel consumed by the engine to produce power denoted in kW/h. This SFC of an engine is usually measured by the mass of fuel consumed for the power output. The SFC can be calculated by the following equation [34]:
s f c = m f N b
where:
sfc = Specific fuel consumption (kg/kWh); mf = Total fuel consumption (kg/hour); Nb = Engine power (HP).

2.5.3. Thermal Efficiency

Thermal efficiency is defined as the heat-use efficiency of fuel to be converted into mechanical work. The thermal efficiency (ηth) can be calculated using the equation [34]:
η th = N b × 632.5 mf × LHV
where:
ηth = Thermal efficiency (%); Nb = Engine Power (HP); mf = Fuel Consumption (kg/hour); LHV = Fuel Calorific Value (kcal/kg).

3. Results and Discussion

3.1. The Characteristics of Physicochemical Properties of WPO

The characteristic properties of WPO were analyzed and shown in Table 3. The results show that the characteristics of WPO are close to the standards of gasoline fuels that have been set by the Indonesian government. Some of the properties stated in the national standard include viscosity, density, sulfur content, and calorific value. Table 3 shows the measured kinematic viscosity of WPO was 3.5 mm2/s, which is slightly higher than the reported kinematic viscosity of Ananthakumar et al. [35]. They obtained kinematic viscosity of WPO 2.52 mm2/s. The density of WPO was 750 Kg/m3, which is slightly lower than that of gasoline. The sulfur content of WPO was obtained at 0.68% mm. The calorific value of WPO was found to be 45.0196 MJ/kg, which is higher than the calorific value of waste plastic oil of 42.8075 MJ/kg reported by Kumar et al. [36]. Zainuri [37] also reported the calorific value of WPO to be 46.848 MJ/kg.

3.2. Engine Performance Fueled by Waste Plastic Oil–Gasoline (RON 88) Blends

Research has been conducted to examine the effect of engine power, SFC, and thermal efficiency on gasoline engines with high-speed motors using waste plastic oil–gasoline (RON 88) blends with different mixture variations.

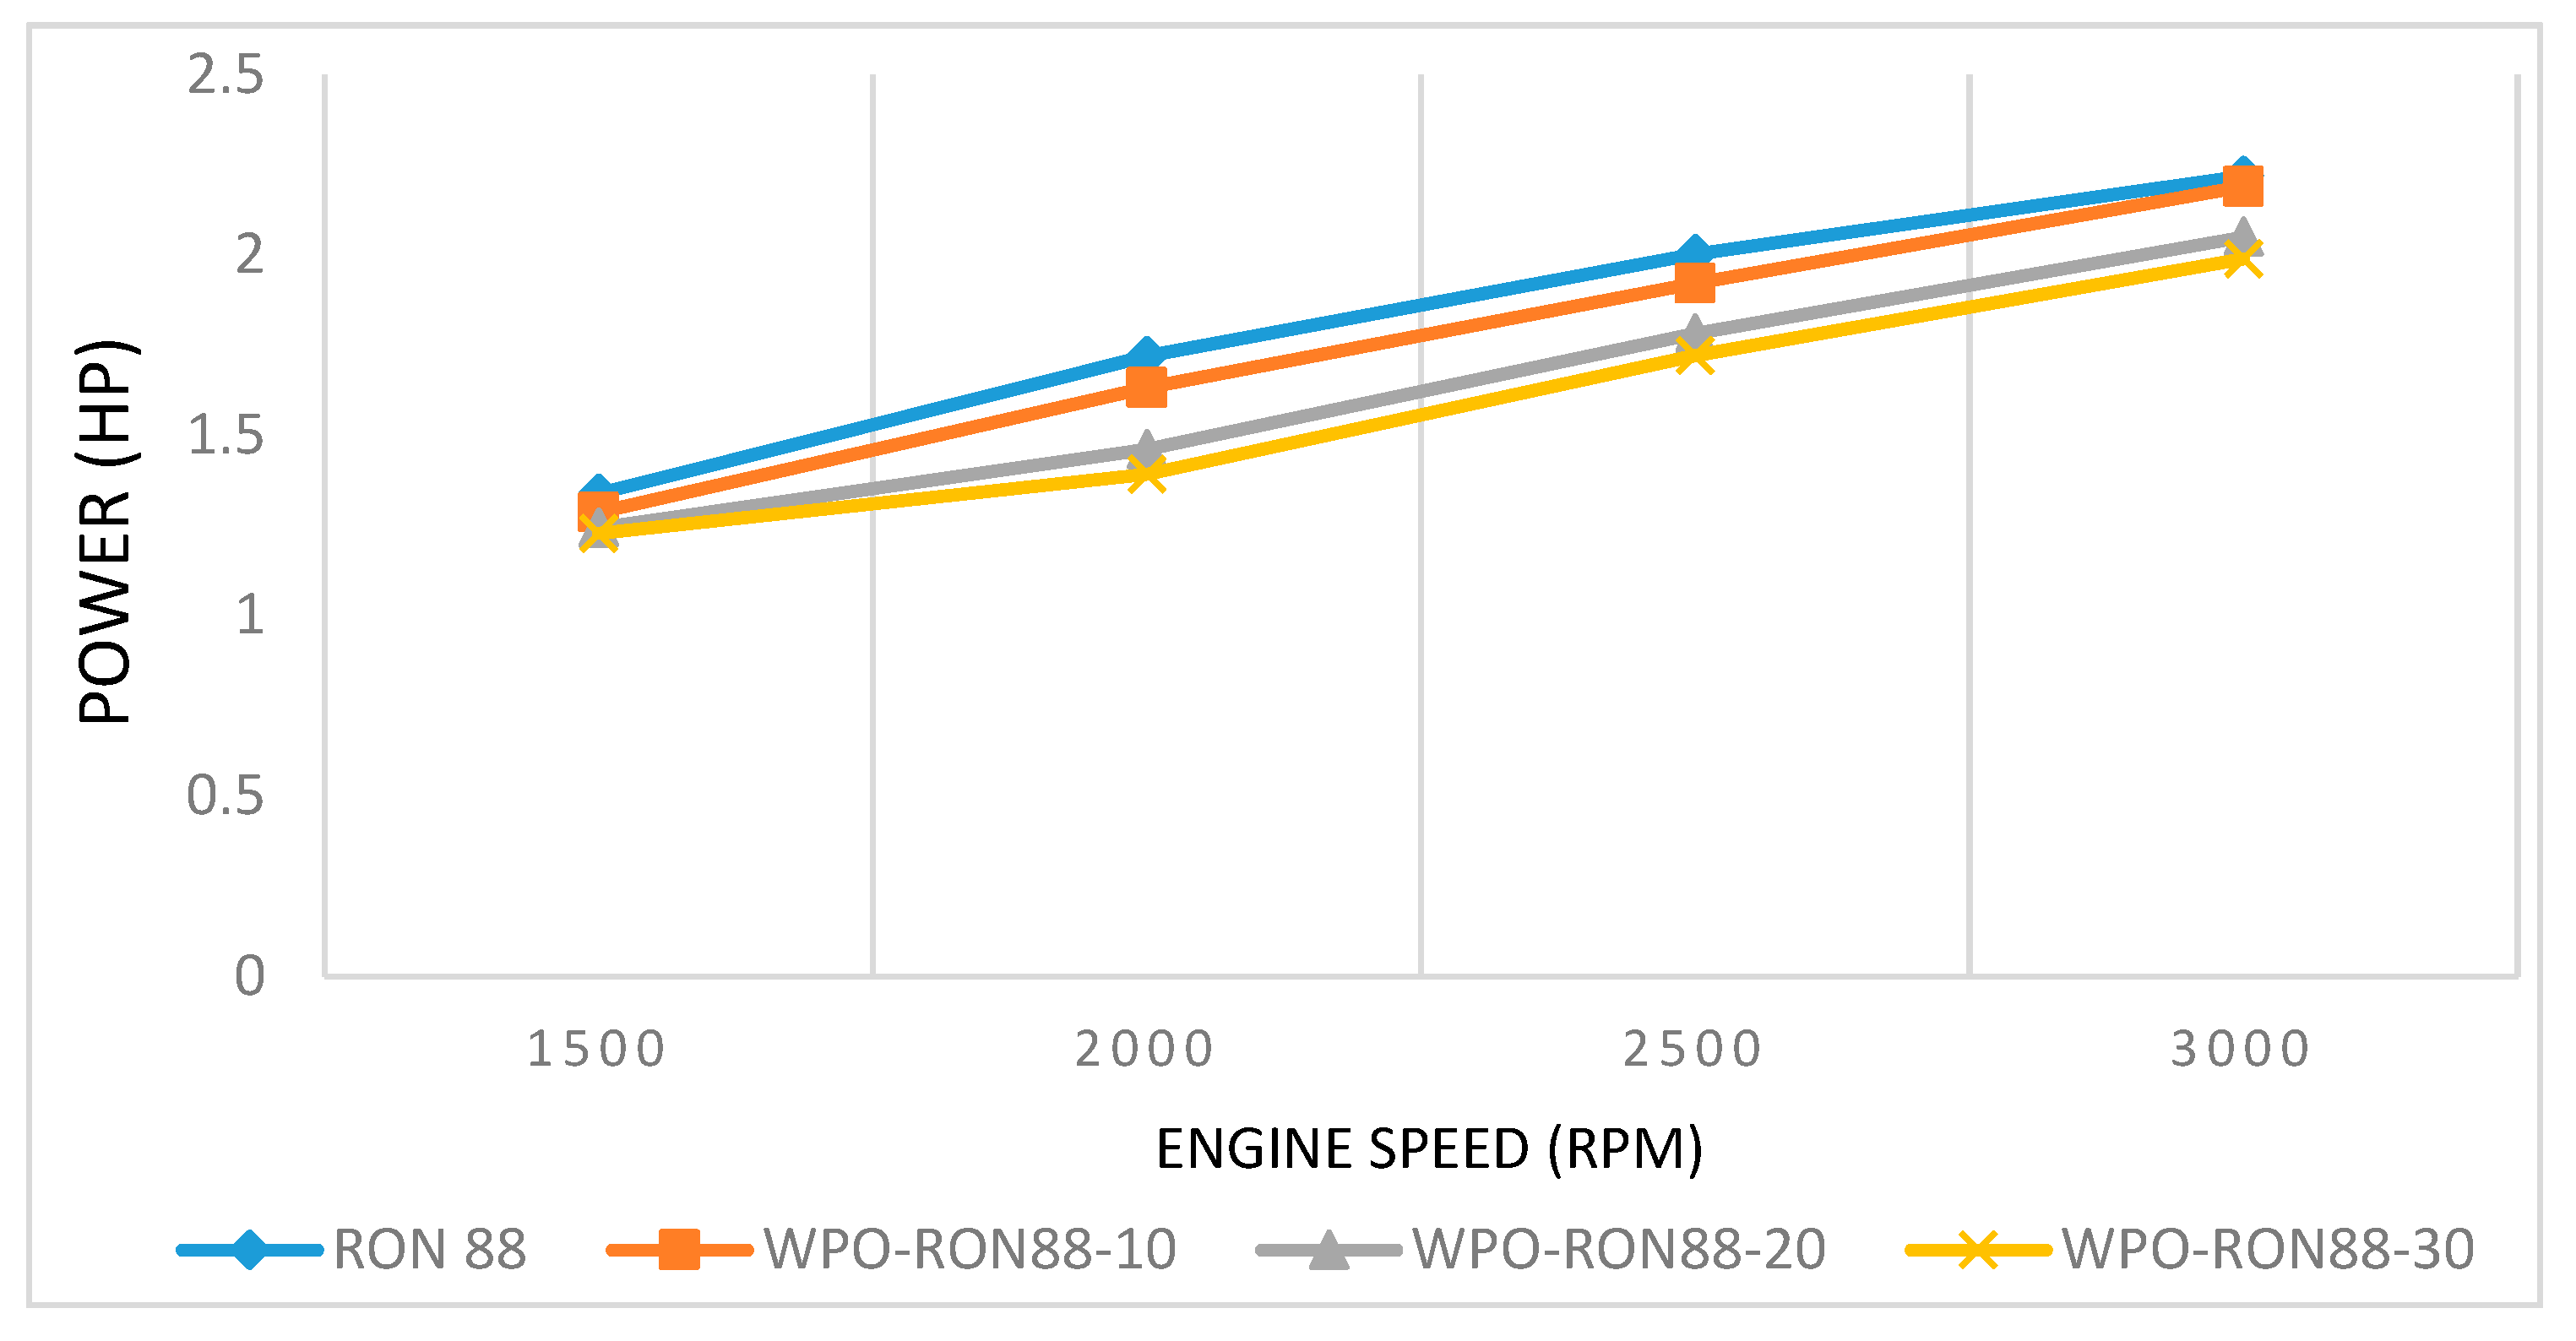
3.2.1. The Effect of WPO Blends on Brake Power

The engine powers produced using pure gasoline and WPO–gasoline blends are shown in Figure 5. The pure gasoline produced the highest engine power of 1.339 HP. In comparison, the WPO–gasoline blends produced 1.287 HP, 1.244 HP, and 1.229 HP for WPO-RON88-10, WPO-RON88-20, and WPO-RON88-30, respectively. With the increase in engine speed, the brake increased. At 1500 rpm, the pure gasoline fuel gives the highest engine power, which is 1.339 HP, while the WPO–gasoline blends produced 1.287 HP, 1.244 HP, and 1.229 HP for WPO-RON88-10, WPO-RON88-20, and WPO-RON88-30, respectively. At medium speeds of 2000 rpm and 2500 rpm, the engine powers obtained were 1.72 HP and 2.002 HP, respectively, using pure gasoline. On the other hand, when WPO-RON88-30 was used, the engine powers were reduced to 1.392 HP and 1.721 HP, respectively. The RON88 fuel produced the highest engine power of 2.219 HP at 3000 rpm engine speed, while the WPO–gasoline blends obtained 2.19 HP (WPO-RON88-10), 2.05 HP (WPO-RON88-20), and 1.99 HP (WPO-RON88-30). The WPO-RON88-30 blends gave the lowest engine power output. From the figure, it can be seen that the addition of 10% WPO with RON88 does not change the engine power output significantly compared to the pure RON88 result. This can be attributed to a small percentage of low RON and the low calorific value of the WPO in the blend. This is different from the results obtained by Ravinanath et al. [39], which showed an increased power output with increased ethanol content of the blend.

3.2.2. The Effect of WPO Blends on SFC

The SFCs of WPO–gasoline blends and pure gasoline are shown in Figure 6. Based on Figure 6, the SFC of WPO-RON88-30 was the highest compared to WPO-10, WPO-20, and RON88. The SFC of WPO-RON88-30 at 1500 rpm was 0.351 kg/kWh compared to 0.3496 kg/kWh, 0.3295 kg/kWh, and 0.3254 kg/kWh for WPO-RON88-10, WPO-RON88-20, and RON88, respectively. Furthermore, the BSFC for WPO-RON88-10 showed identical results to that of RON88 at 1500 rpm and 2500 rpm, which was 0.3295 kg/kWh and 0.404 kg/kWh, respectively. In general, the values of SFC from gasoline–WPO blends were close to gasoline blends, and can be used as a reference fuel for further development with other variations in future research. With the increase in engine speed, the SFC is in line with the existing literature [40]. In addition, with the increase in concentration (%) of WPO in the mixture of RON88-WPO, SFC is increased. This could be due to the lower calorific value of WPO compared to RON88. Cleetus et al. [22] obtained similar results from gasoline–WPO blend when tested in a SI engine.

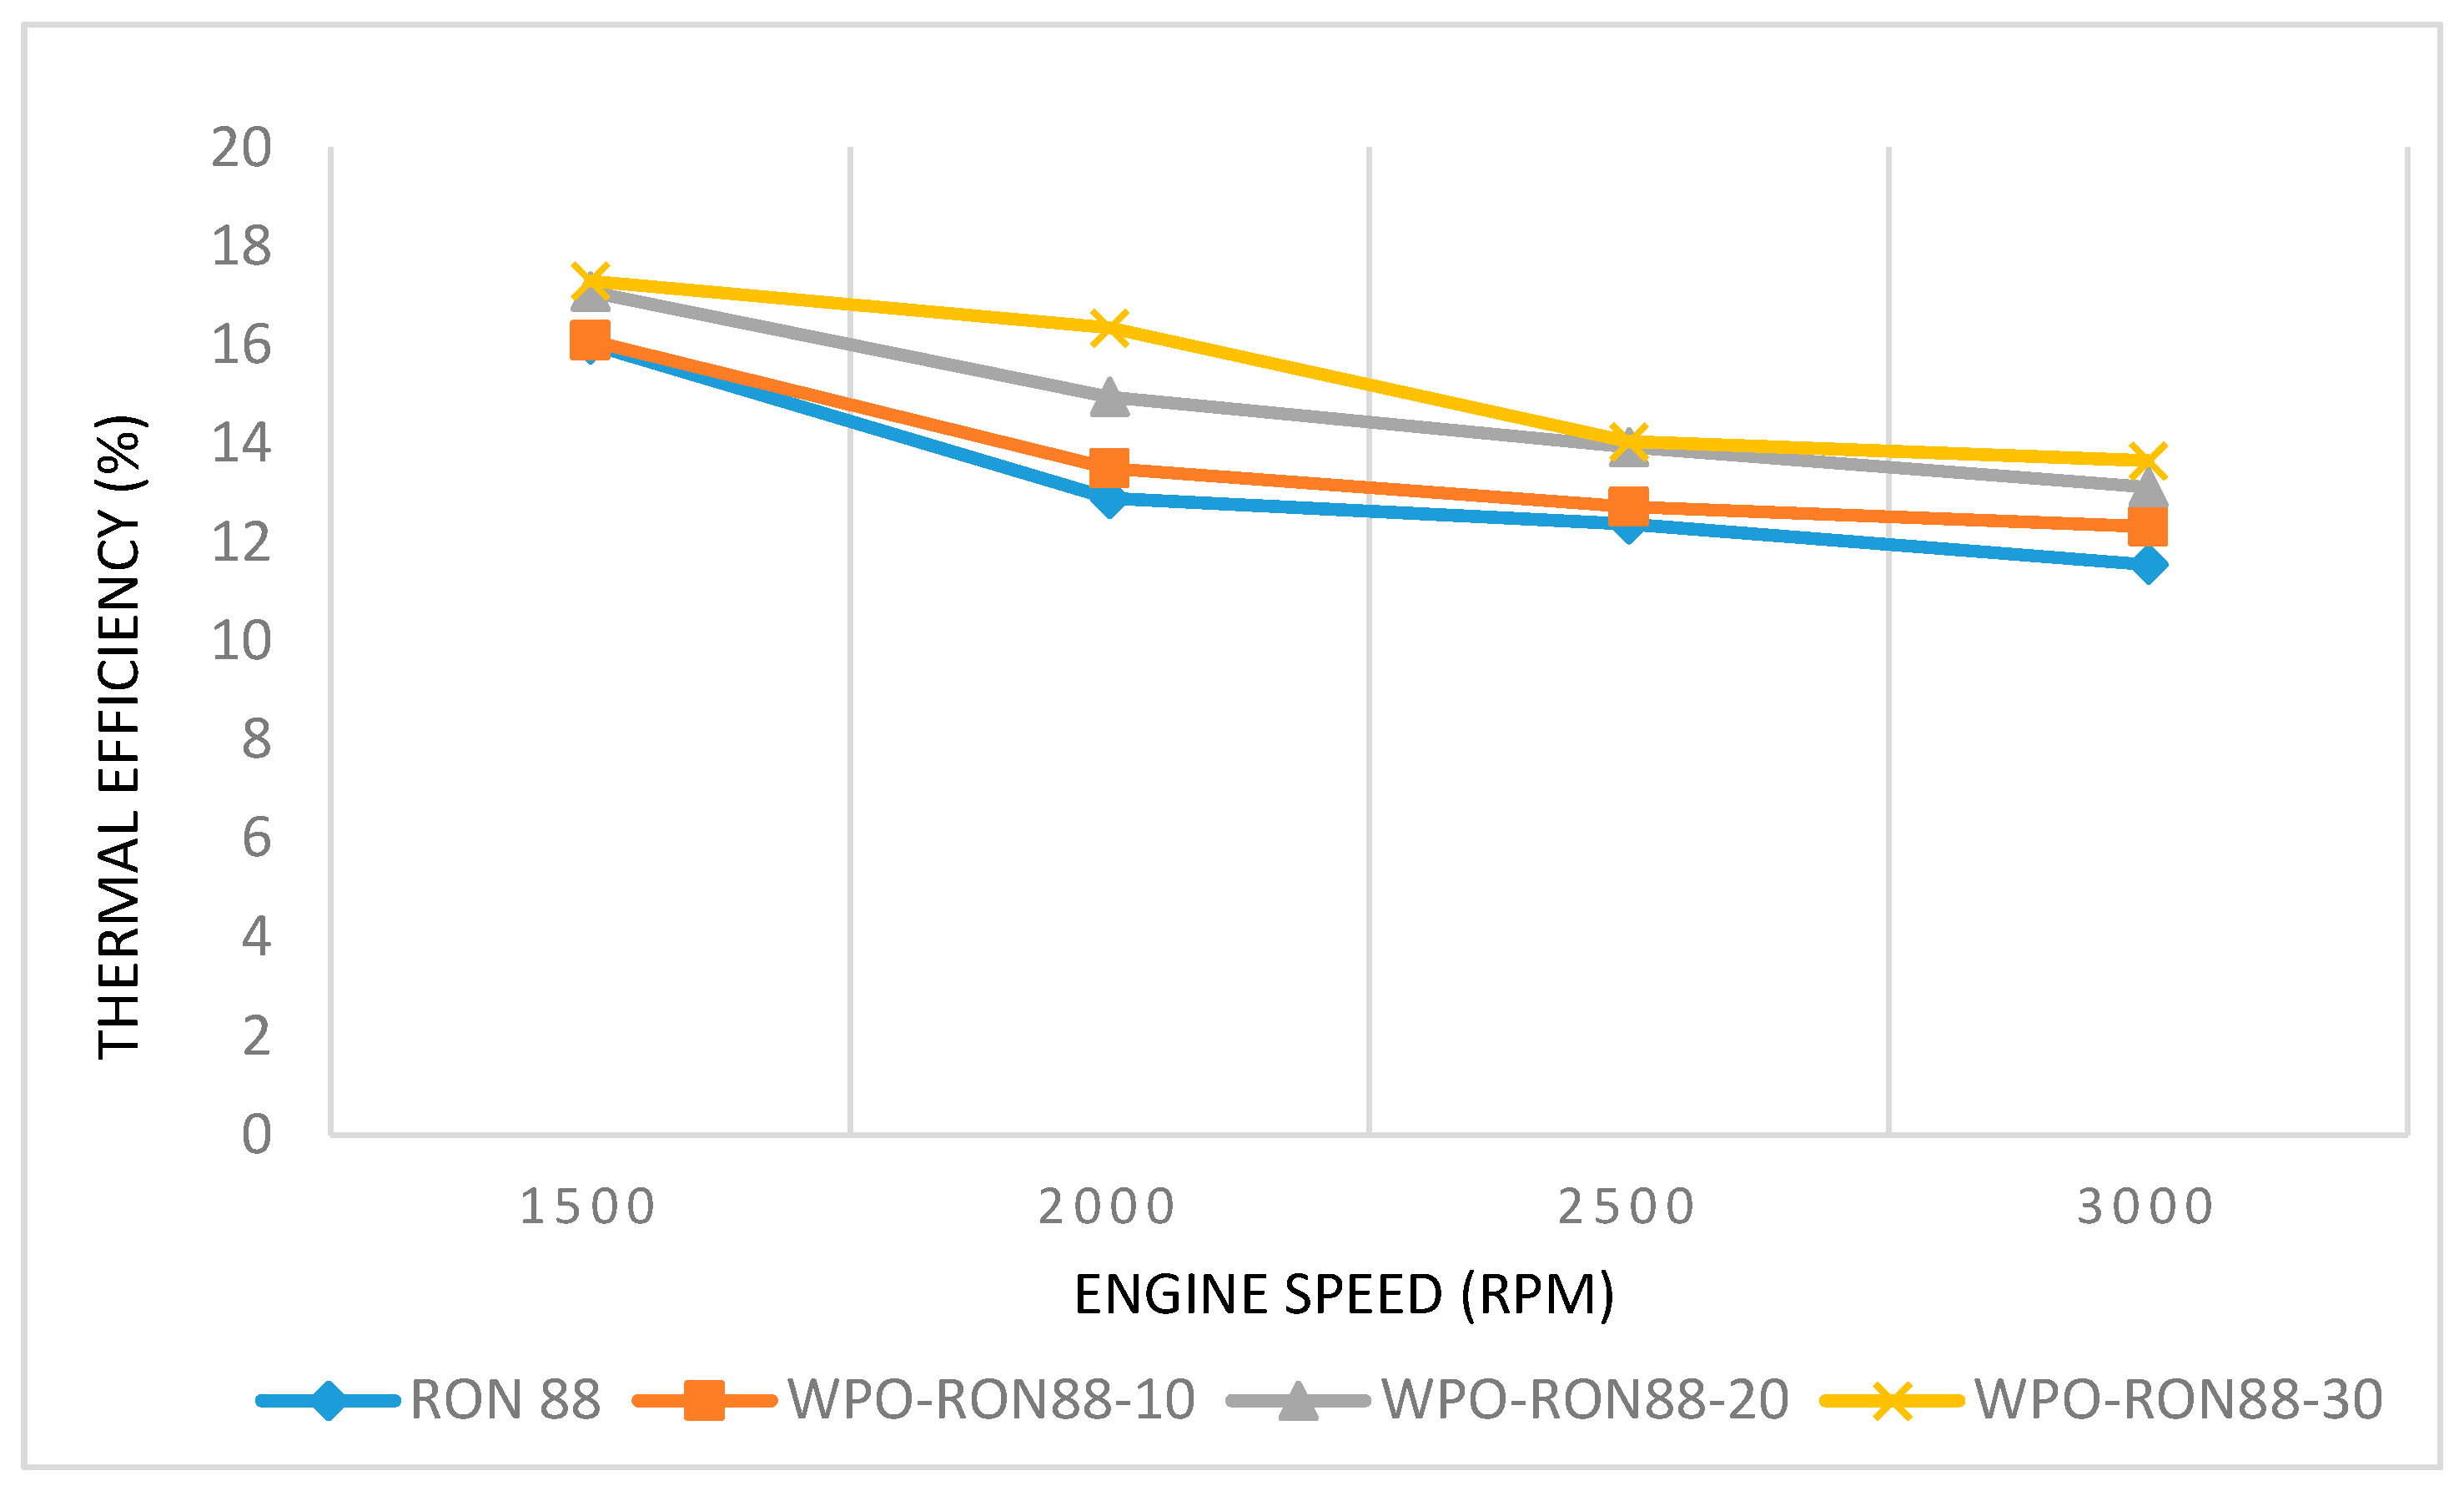
3.2.3. The Effect of WPO Blends on Thermal Efficiency

Thermal efficiency is the ratio of work output to energy supplied through fuel injection. The variation of thermal efficiencies using WPO–gasoline blends and pure gasoline is shown in Figure 7. It can be seen that the brake thermal efficiency (BTE) for WPO-RON88-10, WPO-RON88-20, and WPO-RON88-30 were 16.09%, 17.08%, and 17.3%, whereas for RON88, the BTE was about 16.02% at engine speed 1500 rpm. Based on the results of the experiments conducted, the higher the engine speed, the lower the BTE, which can be attributed to increased BSFC at higher engine speeds. It can be seen that the thermal efficiency of content of WPO in WPO–gasoline mixtures was higher than that of pure gasoline, which can be attributed to less frictional power loss than that of lower WPO blends and pure gasoline. Similar results were obtained by Cleetus et al. [22], showing a higher percentage of WPO in WPO–gasoline blends resulting in higher thermal efficiency compared to that of lower WPO containing blends in a CI engine. In addition, higher oxygen content in high WPO blends can result in the presence of more oxygen in the combustion process, therefore achieving better combustion and hence greater thermal efficiency [39].

3.3. Engine Performance Fueled by WPO–Gasoline (RON 90) Blends

Research has been conducted to examine the effect of engine power, SFC, and thermal efficiency on gasoline engines with high-speed motor using WPO–gasoline (RON 90) blends with different mixture variations.

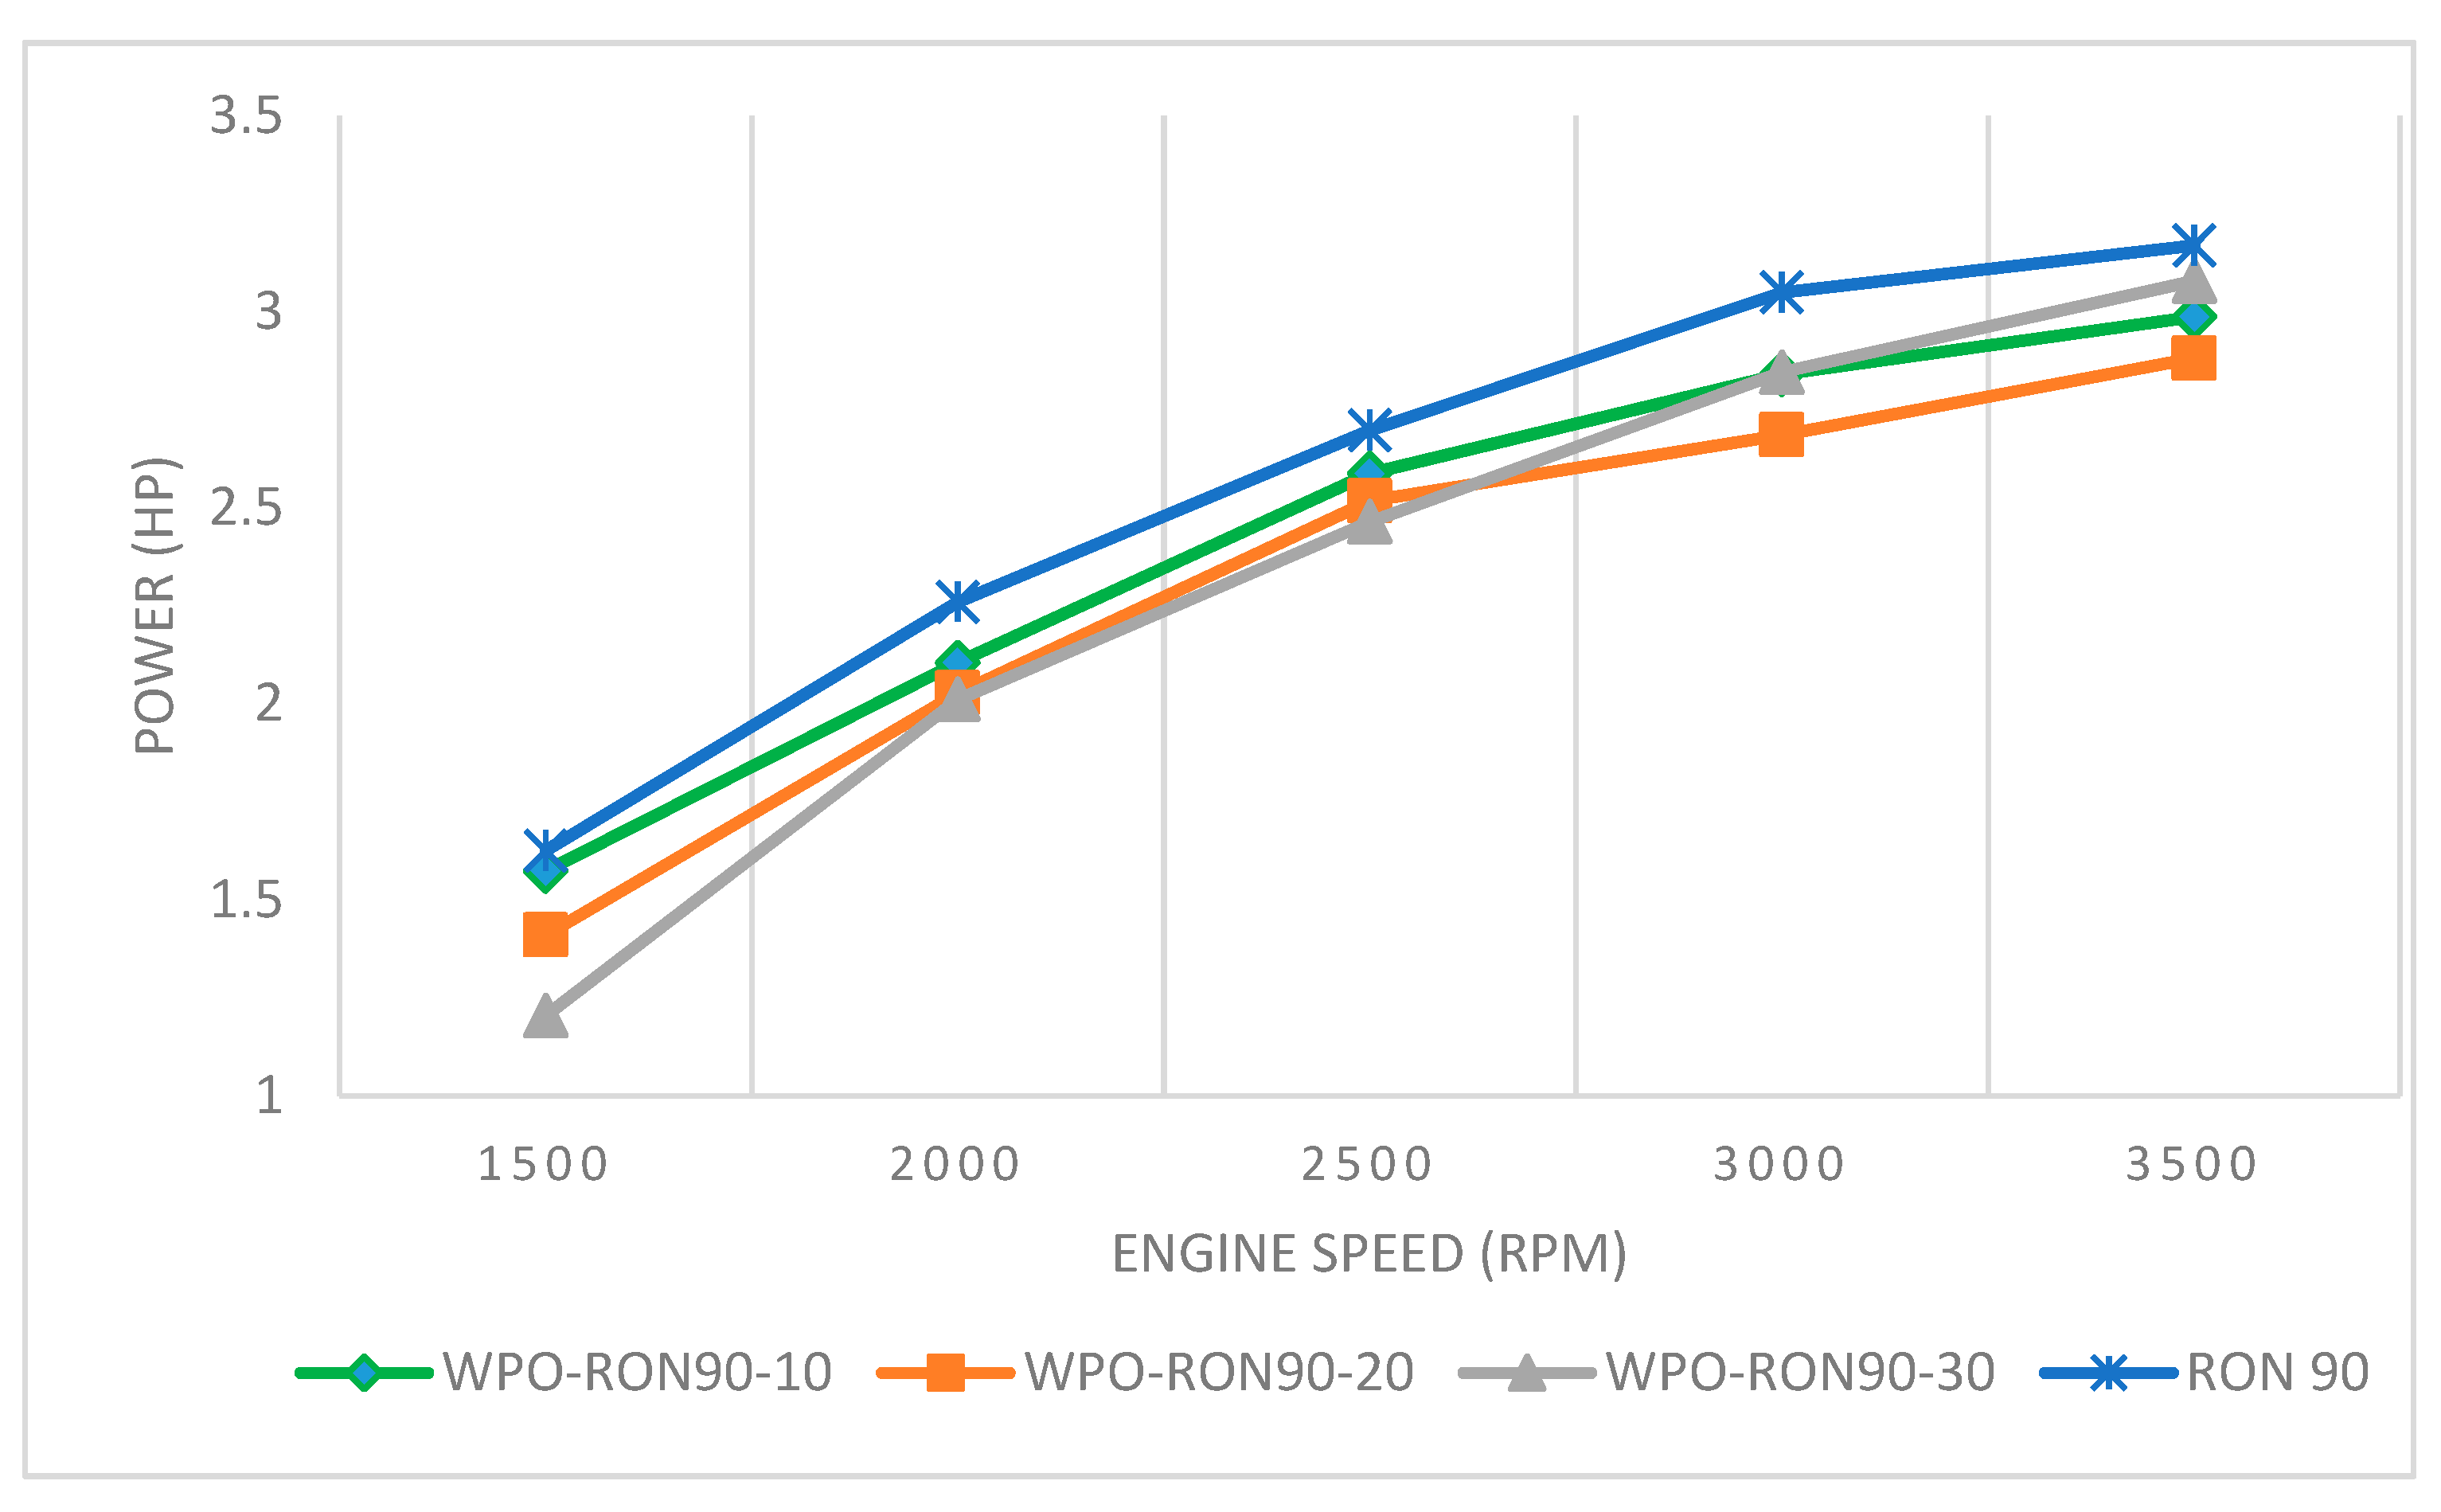
3.3.1. The Effect of WPO–Gasoline RON 90 Blends on Engine Power

From Figure 8, it can be seen that engine power increased with increase in engine speed. The rate of increase in power above 3000 rpm was slower compared to other engine speeds, which can be attributed to faster valve operation, reducing the mean effective pressure of the piston in the engine. It is shown in Figure 8 that the power generated from pure RON 90 fuel at 1500 rpm is 1.626 HP, while the WPO-RON90-10, WPO-RON90-20, and WPO-RON90-30 produced powers of 1.573 HP, 1.410 HP, and 1.205 HP, respectively. On the other hand, the engine speeds at 2000 rpm, 2500 rpm, and 3000 rpm for RON 90 produced powers of 2.260 HP, 2.697 HP, and 3.049 HP, respectively. The powers produced by WPO-RON90-10 is close to that of RON 90, which were 2105 HP, 2587 HP, and 2841 HP at 2000 rpm, 2500 rpm, and 3000 rpm, respectively. Furthermore, at 3500 rpm RON90 produced the highest engine power of 3.169 HP. Moreover, the WPO-RON90-30 produced close to the highest powers of pure RON 90, which were 3.078 HP at an engine speed of 3500 rpm, followed by WPO-RON90-10 and WPO-RON90-20, respectively. Ravinanath et al. [39] also reported similar results for higher concentrations (%) of WPO in the blend. As such, blends with higher concentration of WPO was able to approach the engine power output produced by RON90. The WPO-RON90-30 fuel blend produced the highest engine power compared to other blends due to the presence of more fuel-borne oxygen for combustion, therefore producing better combustion.

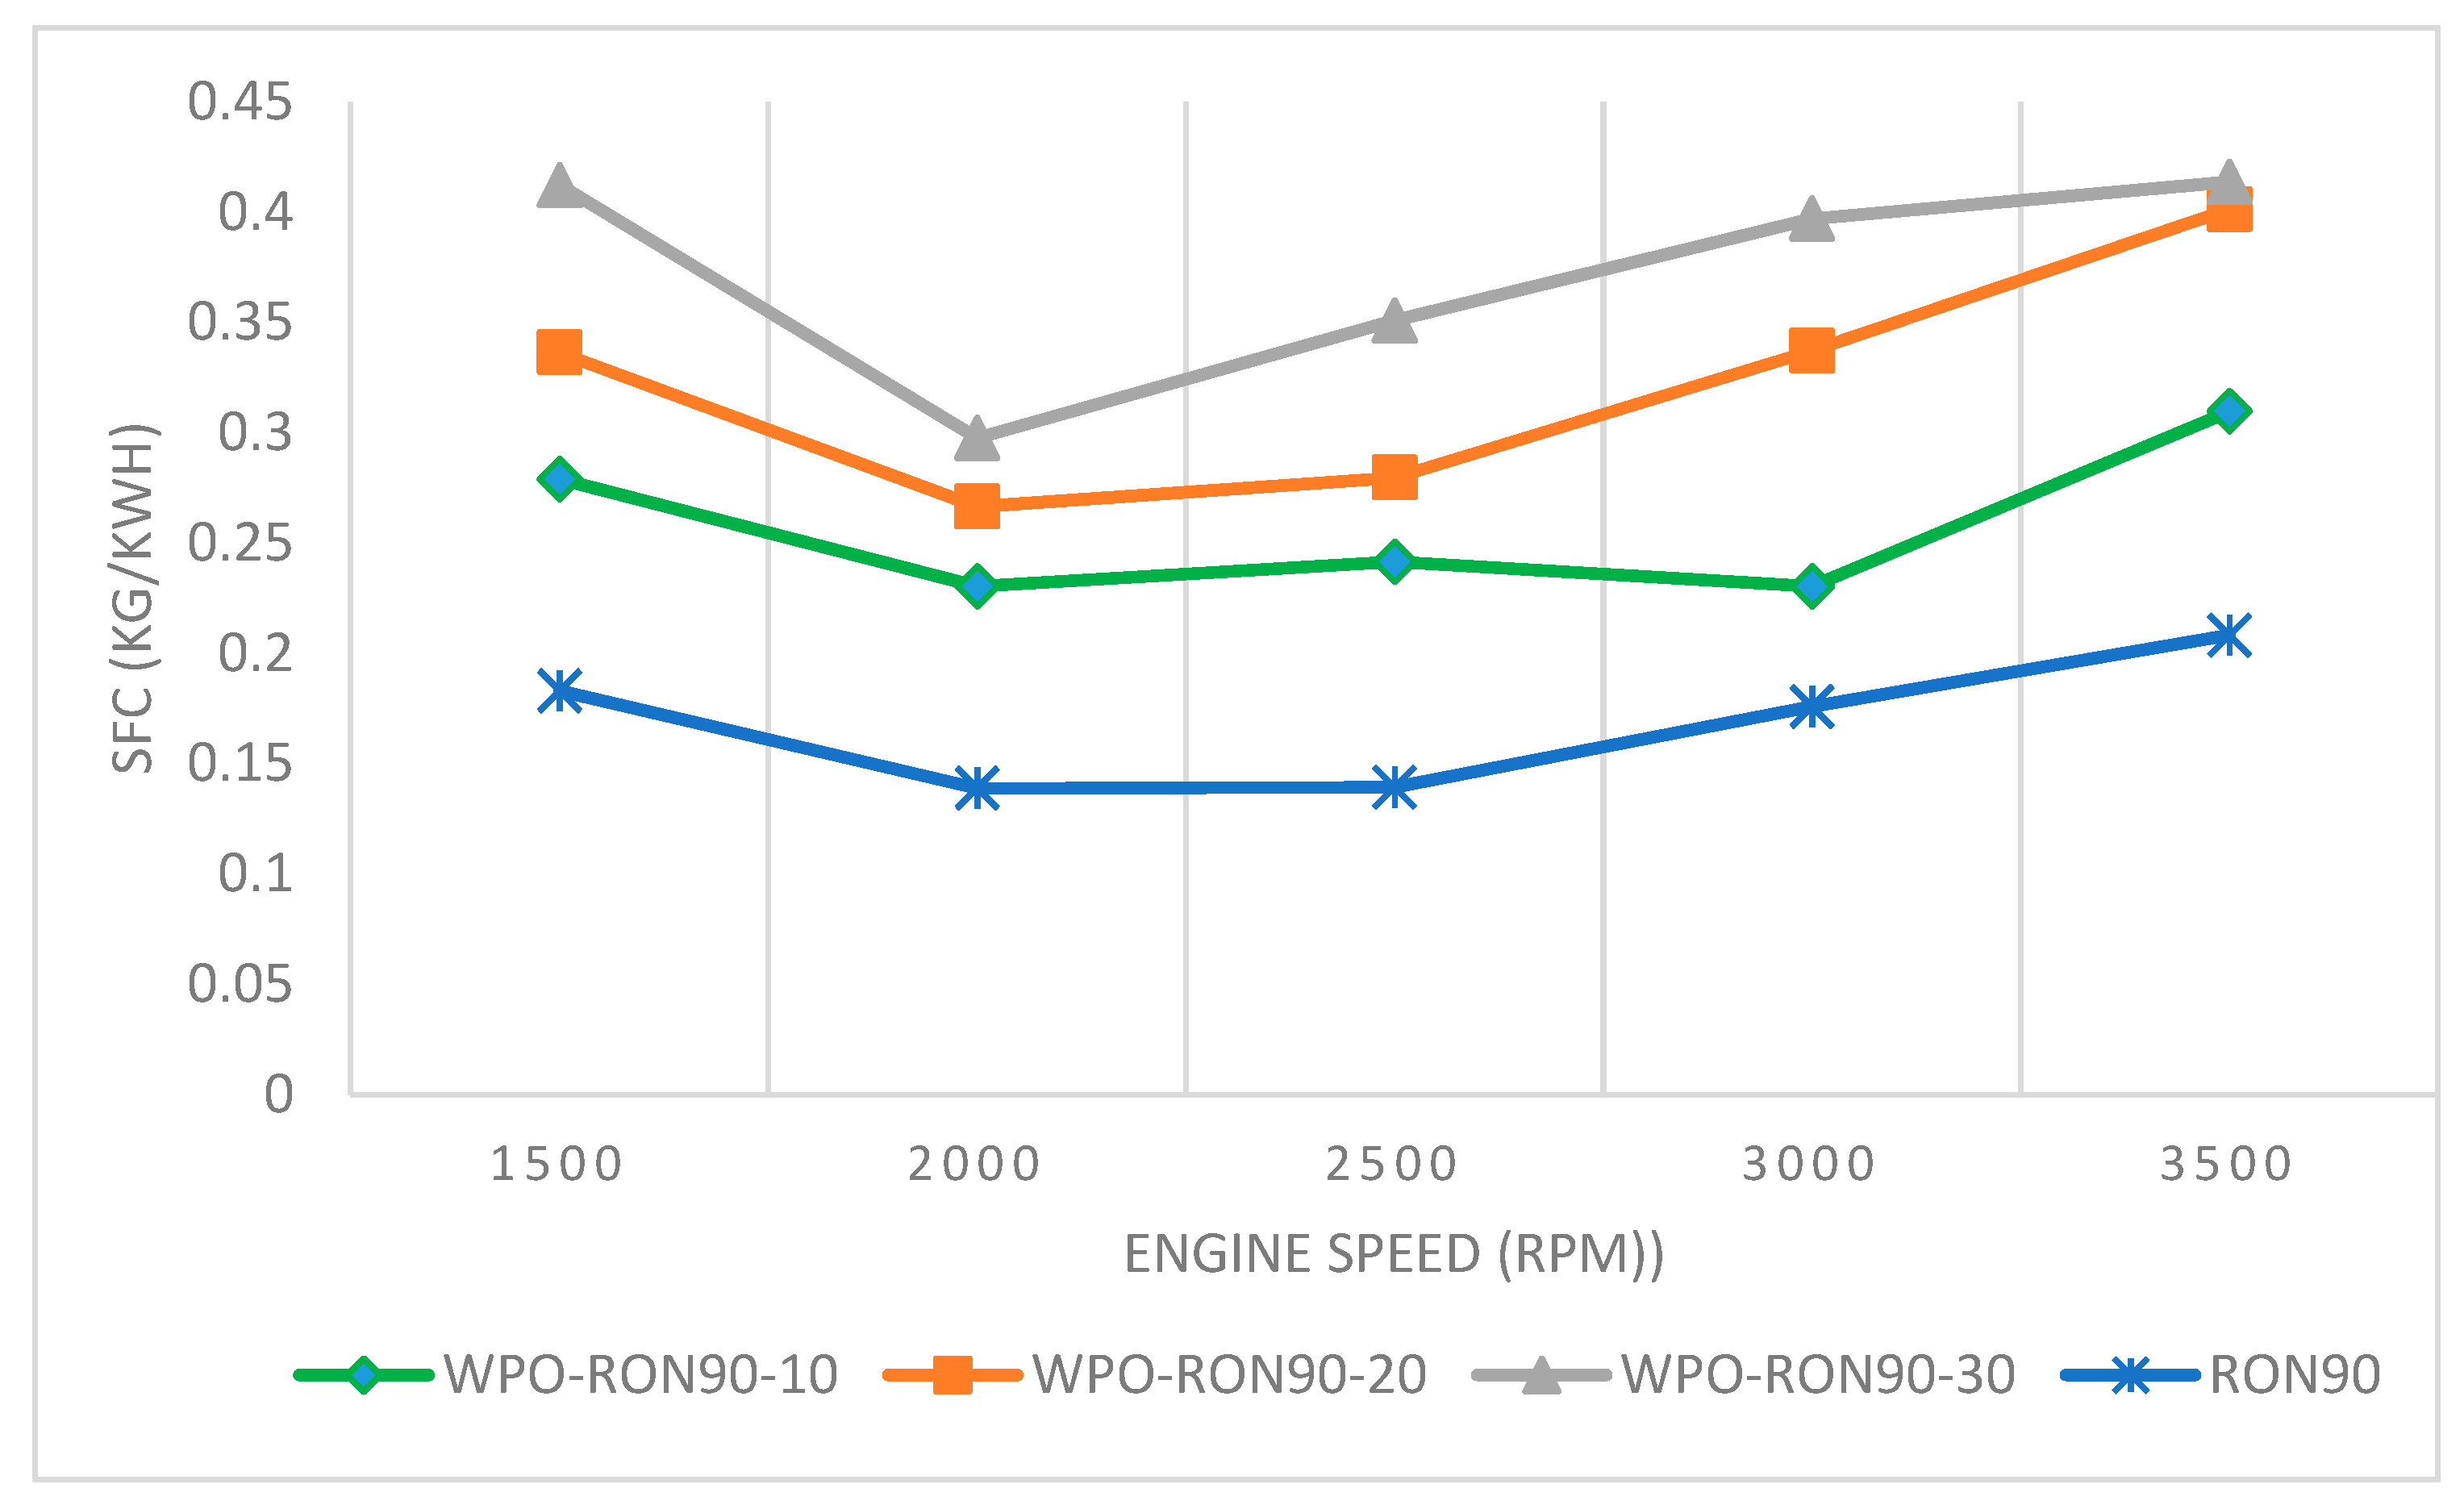
3.3.2. The Effect of WPO–Gasoline RON 90 Blends on SFC

The SFC for WPO–gasoline blends as well as pure RON 90 fuels are shown in Figure 9. The SFC increased with an increase in the percentage of WPO in WPO–gasoline blends at the same engine speed. It can be seen in Figure 9 that at an engine speed of 2000 rpm, the SFC of WPO-RON90-10, WPO-RON90-20, WPO-RON90-30, and RON90 were 0.2304 kg/kWh, 0.2665 kg/kWh, 0.2976 kg/kWh, and 0.1388 kg/kWh, respectively. With the increase in engine speed from 2000 rpm to 3500 rpm, an increase in SFC was observed due to higher frictional loss at higher engine speed, as discussed previously. In a previous work, Murni [41] reported that the use of fuels with low kinematic viscosity can increase the amount of fuel being consumed during engine operation. Interestingly, at engine speeds between 1500 rpm to 2000 rpm, the SFC of every fuel is decreased, which is different from the results reported by Cleetus et al. [23]. This can be attributed to the high calorific value and octane number of RON90 fuel.

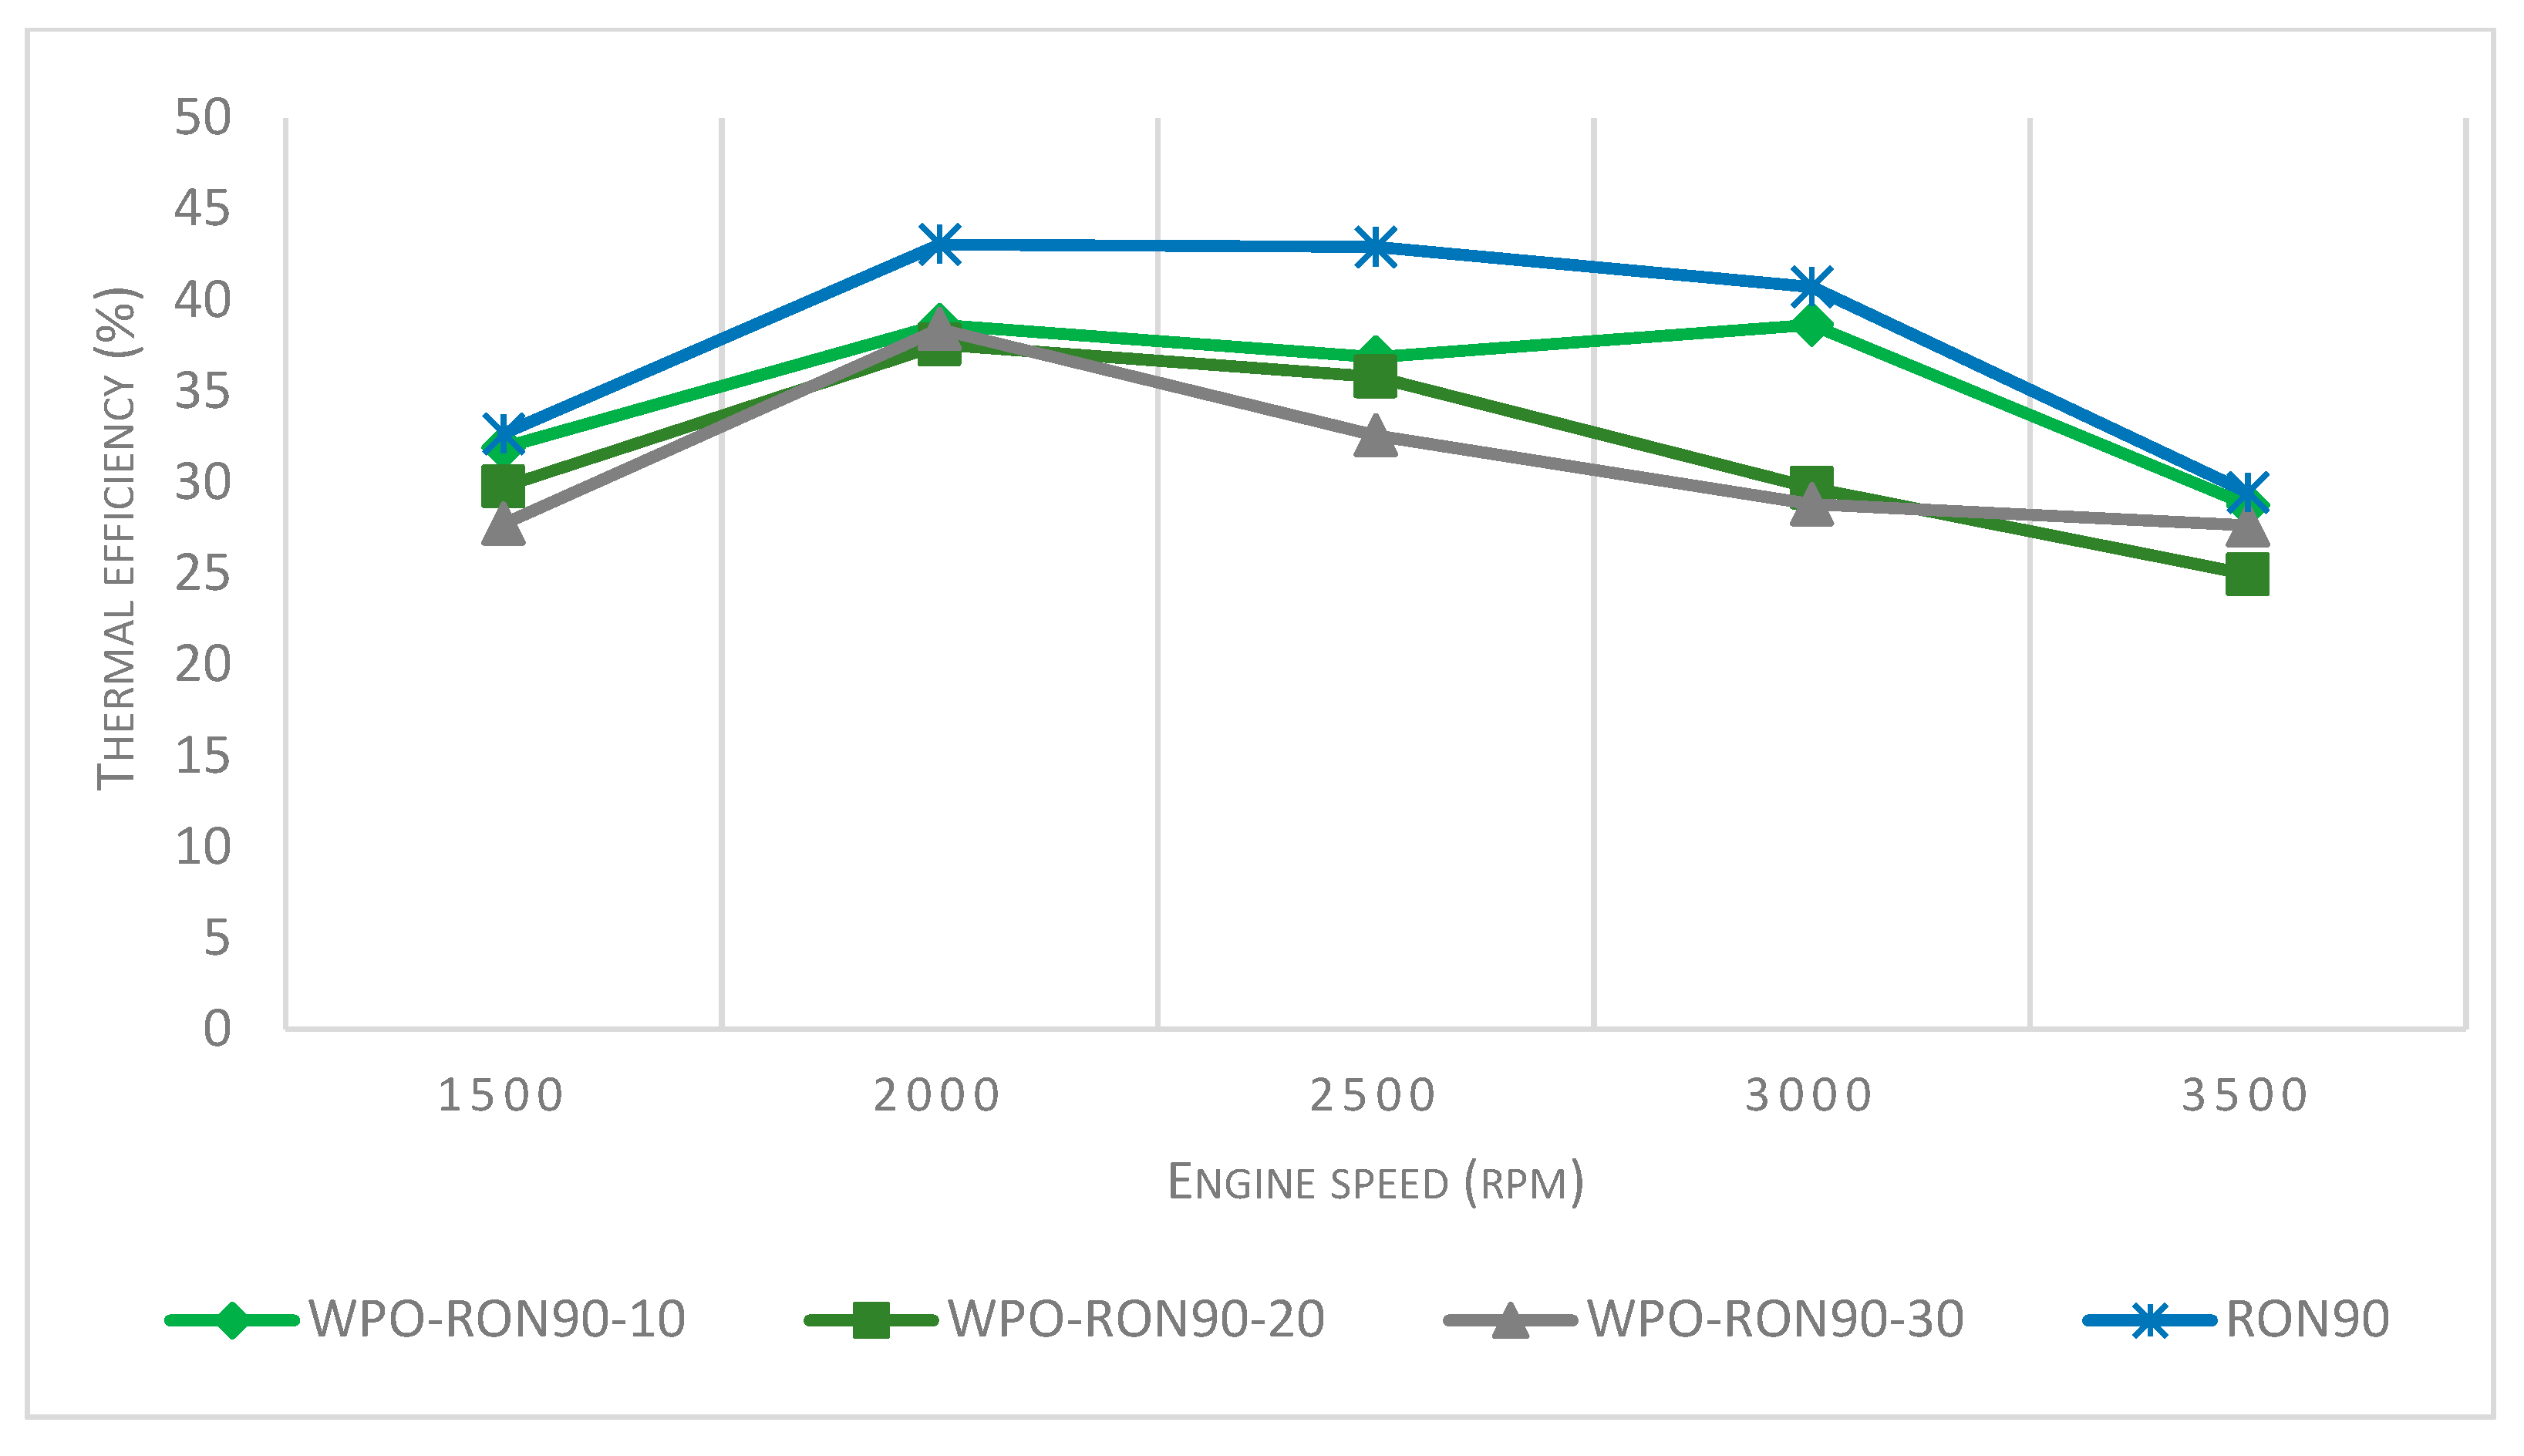
3.3.3. The Effect of WPO–Gasoline RON 90 Blends on Thermal Efficiency

Based on experimental results presented in Figure 10, there was a relationship between engine speed and brake thermal efficiency with the use of the different WPO–gasoline blends. Pure RON90 showed higher thermal efficiency compared to WPO blends. The thermal efficiency for WPO-RON90-10, WPO-RON90-20, and WPO-RON90-30 were obtained as 38.65%, 37.5%, and 38.41%, respectively, at an engine speed of 2000 rpm. For the same engine speed, the thermal efficiency of pure RON90 reached 43.05%. The highest brake thermal efficiency for each type of blend was 38.75%, 37.56%, and 38.41% for WPO-RON90-10, for WPO-RON90-20, and WPO-RON90-30, respectively, at 2000 rpm. Overall, the thermal efficiency for all fuels increased at 2000 rpm compared to that of 1500 rpm. However, as the engine speed increased from 2500 rpm to 3500 rpm, the thermal efficiency decreased. The decreased thermal efficiency can be attributed to the lower heating value of WPO. Secondly, after the efficiency increase of the first stage at 1500–2000 rpm engine speed, thermal efficiency continues to decrease for all types of fuel to 3500 rpm engine speed. This is probably due to the high research octane number on the RON90, meaning that fuel can be compressed because of the ability of high-octane fuels to resist auto-ignition. Usually, more power is generated due to increased efficiency and to higher compression.

4. Conclusions

Pyrolysis of waste plastic was performed in a batch reactor equipped with temperature-controlled reflux to produce WPO. It was found that the properties of WPO are close to that of gasoline fuel. The properties of WPO were also found to be within the limits mandated in ASTM standard. From the results of this study, the following conclusions can be drawn:
  • The blend ratio of WPO with gasoline (RON88 and RON 90) was varied from 10% to 30% with gasoline. It was found that the engine power outputs of WPO-RON88 and WPO-RON90 blends were close to that of pure RON88 and RON90 fuels.
  • The increasing concentration on the blending of WPO with gasoline (RON88 and RON 90) can reduce engine output power slightly. By contrast, the WPO-RON90-30 obtained satisfactory results at the maximum engine speed of 3500 rpm, which gave results very close to the engine power fueled by pure RON90 fuel.
  • The engine power, SFC, and thermal efficiency improvement due to WPO blending showed more pronounced effects for WPO-RON90 blends than for WPO-RON88 blends.

Author Contributions

Conceptualization, methodology, writing-original draft and supervision by K. T.M.I.R. contribute to validation and writing-review & editing. S.B., S.E.S., J.J. and M.J. contributed to the experiment and investigation. F.K., Y.P., A.S.S. and A.H.S. contributed to analysis the data and improve the manuscript. All authors read and approved the final manuscript.

Funding

This research was funded by the Universitas Syiah Kuala, Minister of national education through Research Professor Program No.: 520/UN11/SPK/PNBP/2019.

Acknowledgments

The authors graciously acknowledge the financial support provided by the Chair of the Renewable Energy Research Fund—Biofuel/Bioenergy Research Program (201801 KETTHA). The authors would like to appreciate many thanks to bachelor students (Razuardi Kumar) and magister students (T.M Hakim Furqan) in the combustion Laboratory of Mechanical Engineering Department who has supported to conducting of the research. The authors wish to express their appreciation to the Direktorat Jenderal Penguatan Riset dan Pengembangan Kementerian Riset dan Teknologi/Badan Riset dan Inovasi Nasional Republik Indonesia and Politeknik Negeri Medan, Medan, Indonesia.

Conflicts of Interest

The authors declare no conflict of interest.

References

  1. Silitonga, A.S.; Masjuki, H.H.; Mahlia, T.M.I.; Ong, H.C.; Chong, W.T.; Boosroh, M.H. Overview properties of biodiesel diesel blends from edible and non-edible feedstock. Renew. Sustain. Energy Rev. 2013, 22, 346–360. [Google Scholar] [CrossRef]
  2. Shahir, S.A.; Masjuki, H.H.; Kalam, M.A.; Imran, A.; Rizwanul Fattah, I.M.; Sanjid, A. Feasibility of diesel–biodiesel–ethanol/bioethanol blend as existing CI engine fuel: An assessment of properties, material compatibility, safety and combustion. Renew. Sustain. Energy Rev. 2014, 32, 379–395. [Google Scholar] [CrossRef]
  3. Milano, J.; Ong, H.C.; Masjuki, H.H.; Silitonga, A.S.; Chen, W.-H.; Kusumo, F.; Dharma, S.; Sebayang, A.H. Optimization of biodiesel production by microwave irradiation-assisted transesterification for waste cooking oil-Calophyllum inophyllum oil via response surface methodology. Energy Convers. Manag. 2018, 158, 400–415. [Google Scholar] [CrossRef]
  4. Mason, I.G.; Page, S.C.; Williamson, A.G. A 100% renewable electricity generation system for New Zealand utilising hydro, wind, geothermal and biomass resources. Energy Policy 2010, 38, 3973–3984. [Google Scholar] [CrossRef]
  5. Ismail, M.S.; Moghavvemi, M.; Mahlia, T.M.I. Characterization of PV panel and global optimization of its model parameters using genetic algorithm. Energy Convers. Manag. 2013, 73, 10–25. [Google Scholar] [CrossRef]
  6. Mahlia, T.M.I.; Syaheed, H.; Abas, E.P.; Kusumo, F.; Shamsuddin, A.H.; Ong, H.C.; Bilad, M.R. Organic Rankine Cycle (ORC) System Applications for Solar Energy: Recent Technological Advances. Energies 2019, 12, 2930. [Google Scholar] [CrossRef] [Green Version]
  7. Mofijur, M.; Mahlia, T.M.I.; Silitonga, A.S.; Ong, H.C.; Silakhori, M.; Hasan, M.H.; Putra, N.; Rahman, S.M.A. Phase Change Materials (PCM) for Solar Energy Usages and Storage: An Overview. Energies 2019, 12, 3167. [Google Scholar] [CrossRef] [Green Version]
  8. Mahlia, T.M.I.; Syazmi, Z.A.H.S.; Mofijur, M.; Abas, A.E.P.; Bilad, M.R.; Ong, H.C.; Silitonga, A.S. Patent landscape review on biodiesel production: Technology updates. Renew. Sustain. Energy Rev. 2020, 118, 109526. [Google Scholar] [CrossRef]
  9. Ong, H.C.; Masjuki, H.H.; Mahlia, T.M.I.; Silitonga, A.S.; Chong, W.T.; Yusaf, T. Engine performance and emissions using Jatropha curcas, Ceiba pentandra and Calophyllum inophyllum biodiesel in a CI diesel engine. Energy 2014, 69, 427–445. [Google Scholar] [CrossRef]
  10. Ahvenainen, R. Modern Plastics Handbook; Woodhead Publishing Limited: Cambridge, UK, 2003. [Google Scholar]
  11. Jambeck, J.R.; Geyer, R.; Wilcox, C.; Siegler, T.R.; Perryman, M.; Andrady, A.; Narayan, R.; Law, K.L. Plastic waste inputs from land into the ocean. Science 2015, 347, 768–771. [Google Scholar] [CrossRef]
  12. Finance, M.O. Bumi Dalam Kantong Plastik; Kementerian Keuangan: Jakarta, Indonesia, 2019; Volume XIV, No. 144.
  13. Lamb, J.B.; Willis, B.L.; Fiorenza, E.A.; Couch, C.S.; Howard, R.; Rader, D.N.; True, J.D.; Kelly, L.A.; Ahmad, A.; Jompa, J.; et al. Plastic waste associated with disease on coral reefs. Science 2018, 359, 460–462. [Google Scholar] [CrossRef] [PubMed]
  14. Wong, S.L.; Ngadi, N.; Abdullah, T.A.T.; Inuwa, I.M. Current state and future prospects of plastic waste as source of fuel: A review. Renew. Sustain. Energy Rev. 2015, 50, 1167–1180. [Google Scholar] [CrossRef]
  15. Siddiqui, M.N.; Redhwi, H.H. Pyrolysis of mixed plastics for the recovery of useful products. Fuel Process. Technol. 2009, 90, 545–552. [Google Scholar] [CrossRef]
  16. Lee, J.; Lee, T.; Tsang, Y.F.; Oh, J.-I.; Kwon, E.E. Enhanced energy recovery from polyethylene terephthalate via pyrolysis in CO2 atmosphere while suppressing acidic chemical species. Energy Convers. Manag. 2017, 148, 456–460. [Google Scholar] [CrossRef]
  17. Khairil; Jihad, M.; Indra Riayatsyah, T.M.; Bahri, S.; Sofyan, S.E.; Jalaluddin. The effect of gasoline-waste plastics oil blends on SI engine performance at high-speed rotation. IOP. Conf. Ser. Earth Environ. Sci. 2020, 463, 012002. [Google Scholar] [CrossRef]
  18. Surono, U.B. Berbagai metode konversi sampah plastik menjadi bahan bakar minyak. J. Tek. 2013, 3, 32–40. [Google Scholar]
  19. Bezergianni, S.; Dimitriadis, A.; Faussone, G.-C.; Karonis, D. Alternative Diesel from Waste Plastics. Energies 2017, 10, 1750. [Google Scholar] [CrossRef] [Green Version]
  20. Chong, C.T.; Mong, G.R.; Ng, J.-H.; Chong, W.W.F.; Ani, F.N.; Lam, S.S.; Ong, H.C. Pyrolysis characteristics and kinetic studies of horse manure using thermogravimetric analysis. Energy Convers. Manag. 2019, 180, 1260–1267. [Google Scholar] [CrossRef]
  21. Ong, H.C.; Chen, W.-H.; Farooq, A.; Gan, Y.Y.; Lee, K.T.; Ashokkumar, V. Catalytic thermochemical conversion of biomass for biofuel production: A comprehensive review. Renew. Sustain. Energy Rev. 2019, 113, 109266. [Google Scholar] [CrossRef]
  22. Cleetus, C.; Thomas, S.; Varghese, S. Synthesis of Petroleum-Based Fuel from Waste Plastics and Performance Analysis in a CI Engine. J. Energy 2013, 2013, 608797. [Google Scholar] [CrossRef] [Green Version]
  23. Khan, M.Z.H.; Sultana, M.; Al-Mamun, M.R.; Hasan, M.R. Pyrolytic waste plastic oil and its diesel blend: Fuel characterization. J. Environ. Public Health 2016, 2016, 7869080. [Google Scholar] [CrossRef] [PubMed] [Green Version]
  24. Soltes, E.J.; Elder, T.J. Pyrolysis. In Organic Chemicals from Biomass; CRC Press: Boca Raton, FL, USA, 2018; pp. 63–99. [Google Scholar]
  25. Sultan, M.A.-S.; Yang, Y.; Wang, J.; Gary, A.L. Pyro-Oil and Wax Recovery from Reclaimed Plastic Waste in a Continuous Auger Pyrolysis Reactor. Energies 2020, 13, 2040. [Google Scholar]
  26. Lee, X.J.; Ong, H.C.; Gan, Y.Y.; Chen, W.-H.; Mahlia, T.M.I. State of art review on conventional and advanced pyrolysis of macroalgae and microalgae for biochar, bio-oil and bio-syngas production. Energy Convers. Manag. 2020, 210, 112707. [Google Scholar] [CrossRef]
  27. Ramadhan, A.; Ali, M. Pengolahan sampah plastik menjadi minyak menggunakan proses pirolisis. J. Ilm. Tek. Lingkung. 2012, 4, 44–53. [Google Scholar]
  28. Sarker, M.; Rashid, M.M.; Rahman, M.S.; Molla, M. Environmentally harmful low density waste plastic conversion into kerosene grade fuel. J. Environ. Prot. 2012, 3, 700. [Google Scholar] [CrossRef] [Green Version]
  29. Indonesia: Fuels: Diesel and Gasoline. Available online: https://www.transportpolicy.net/standard/indonesia-fuels-diesel-and-gasoline/ (accessed on 8 November 2019).
  30. Silitonga, A.S.; Atabani, A.E.; Mahlia, T.M.I.; Masjuki, H.H.; Badruddin, I.A.; Mekhilef, S. A review on prospect of Jatropha curcas for biodiesel in Indonesia. Renew. Sustain. Energy Rev. 2011, 15, 3733–3756. [Google Scholar] [CrossRef]
  31. Mohanraj, C.; Senthilkumar, T.; Chandrasekar, M. A review on conversion techniques of liquid fuel from waste plastic materials. Int. J. Energy Res. 2017, 41, 1534–1552. [Google Scholar]
  32. Thahir, R.; Altway, A.; Juliastuti, S.R.; Susianto. Production of liquid fuel from plastic waste using integrated pyrolysis method with refinery distillation bubble cap plate column. Energy Rep. 2019, 5, 70–77. [Google Scholar] [CrossRef]
  33. Priambodo, B.; Maleev, V. Operasi dan Pemeliharaan Mesin Diesel; Penerbit Erlangga: Jakarta, Indonesia, 1991. [Google Scholar]
  34. Marthur, S.; Sharma, R. A Course in Internal Combustion Engine; JC Kapur: For Dhanpat Rai & Son: Delhi/Julundur, India, 1980. [Google Scholar]
  35. Ananthakumar, S.; Jayabal, S.; Thirumal, P. Investigation on performance, emission and combustion characteristics of variable compression engine fuelled with diesel, waste plastics oil blends. J. Braz. Soc. Mech. Sci. Eng. 2017, 39, 19–28. [Google Scholar] [CrossRef]
  36. Vijaya Kumar, K.; Puli, R.K. Effects of Waste Plastic Oil Blends on a Multi Cylinder Spark Ignition Engine. MATEC Web Conf. 2017, 108, 08005. [Google Scholar] [CrossRef]
  37. Zainuri, F. Pirolisis Sampah Plastik Hingga Suhu 900 °C Sebagai Upaya Menghasilkan Bahan Bakar Ramah Lingkungan; Universitas Muhammadiyah Surakarta: Surakarta, Indonesia, 2014. [Google Scholar]
  38. Pratama, A.W.; Budi, A. Design of Polypropylene Distillation Fuel Generator (PDFG) as an effort to create alternative energy for standar engine. In Proceedings of the International Conference on Food and Agriculture, Bali, Indonesia, 20–21 October 2018. [Google Scholar]
  39. Rao, R.N.; Silitonga, A.S.; Shamsuddin, A.H.; Milano, J.; Riayatsyah, T.M.I.; Sebayang, A.H.; Nur, T.B.; Sabri, M.; Yulita, M.R.; Sembiring, R.W. Effect of Ethanol and Gasoline Blending on the Performance of a Stationary Small Single Cylinder Engine. Arab. J. Sci. Eng. 2020. [Google Scholar] [CrossRef]
  40. Fattah, I.M.R.; Masjuki, H.H.; Kalam, M.A.; Mofijur, M.; Abedin, M.J. Effect of antioxidant on the performance and emission characteristics of a diesel engine fueled with palm biodiesel blends. Energy Convers. Manag. 2014, 79, 265–272. [Google Scholar] [CrossRef]
  41. Murni, M. Kaji Eksperimental Pengaruh Temperatur Biodiesel Minyak Sawit Terhadap Performansi Mesin Diesel Direct Injection Putaran Konstan. Master’s Thesis, Diponegoro University, Semarang, Indonesia, 2010. [Google Scholar]
Figure 1. The chemical formula of the pyrolysis process.
Energies 13 04196 g001
Figure 2. Schematic diagram for converting plastic waste to oil via pyrolysis.
Energies 13 04196 g002
Figure 3. Pictorial view of produced WPO.
Energies 13 04196 g003
Figure 4. Schematic diagram of engine experimental setup.
Energies 13 04196 g004
Figure 5. Effect of WPO-RON88 blends on engine power compared to RON88.
Energies 13 04196 g005
Figure 6. Effect of WPO-RON88 blend on SFC compared to RON88.
Energies 13 04196 g006
Figure 7. Effect of WPO-RON88 blend on thermal efficiency (%), compared to RON88.
Energies 13 04196 g007
Figure 8. Effect of WPO-RON90 blends on engine power compared to RON90.
Energies 13 04196 g008
Figure 9. The effect of WPO-RON90 blend on SFC compared to RON90.
Energies 13 04196 g009
Figure 10. Effect of WPO-RON90 blends on thermal efficiency compared to RON90.
Energies 13 04196 g010
Table 1. Preparations of fuel samples of waste oil plastic blend with gasoline (RON88 and RON90).
Fuel TypeWPO
(%)
Gasoline TypeVolume
RON88 (%)RON90 (%)
WPO-RON88-101090-1 L
WPO-RON88-202080-1 L
WPO-RON88-303070-1 L
RON88-1000100 1 L
WPO-RON90-1010-901 L
WPO-RON90-2020-801 L
WPO-RON90-3030-701 L
RON90-1000 1001 L
Table 2. The specification of the engine.
BrandSpecification (Honda)
ModelGP160H-SD1
Power5.5 HP
Engine typeAir-Cooled 4 Stroke OHV Single Cylinder, Horizontal Shaft
Cylinder Volume163 cc
Bore × Stroke68 × 45 mm
Compression Ratio8.5:1
Maximum Torque10.3 Nm at 2500 rpm
Maximum Output5.5 HP at 3600 rpm
Output Net3.6 HP at 3600 rpm
Table 3. The physicochemical properties of WPO.
PropertiesUnitASTM D6751 StandardRON 88 [11]RON 90 [11,38]WPO aWPO b [36]Method
Kinematic Viscosity(mm2/s)1.9–6.02.0–5.02.0–5.03.52.64ASTM D4052
Density at 15 °C(Kg/m3)880 max715–770715–770750830ASTMD4052 or D1298
Sulfur Content% mmMax. 0.050.050.050.68-ASTM D664
Calorific ValueMJ/kg-47.04948.2045.019642.8075ASTM D240
RONRON (min)-889078.8-ASTMD2699
a Value measured, b Vijaya Kumar.

