Article

Investigations on Low Frequency Noises of On-Shore Wind Turbines

1
Stuttgart Wind Energy (SWE), University of Stuttgart (USTUTT), 70569 Stuttgart, Germany
2
Institute of Soil Mechanics and Rock Mechanics (IBF), Karlsruhe Institute of Technology (KIT), 76131 Karlsruhe, Germany
*
Author to whom correspondence should be addressed.
Acoustics 2020, 2(2), 343-365; https://doi.org/10.3390/acoustics2020020
Submission received: 4 May 2020 / Revised: 20 May 2020 / Accepted: 24 May 2020 / Published: 26 May 2020
(This article belongs to the Special Issue Wind Turbine Noise)

Abstract

:
The expansion of renewable energy usage is one of the major social tasks in Europe and therefore requires acceptance and support from the population. In the case of onshore wind turbines, the complaints of local residents are often interpreted as infrasound disturbances conceivably caused by wind turbine operation. To improve the acceptance for wind energy projects, national standards and regulations need to incorporate such low frequency effects. This contribution presents long-term acoustic measurement data of low frequency noise recorded directly near wind turbines (emission) and inside of residential buildings (immission) with the objectives to identify the signal characteristics and main influential parameters. Different locations (wind farm and individual turbine), wind conditions, and time ranges are evaluated. It is shown that various frequency content below 150 Hz (harmonics of blade passing frequency, etc.) is connected to the rotation of the rotor blade and the operation of the generator. Furthermore, stable atmospheric conditions are determined to be of high importance for the transmission of the characteristic signals. For future research, this work also serves as an example for low frequency sound pressure data during operation and shutdown of wind turbines.

1. Introduction

In recent years, the further development of onshore wind energy in Germany has been strongly inhibited. This strong decrease in newly installed wind energy capacity (see [1]) completely contradicts the goals for renewable energy usage and has negative environmental and economic effects. One of the reasons for this development are slow approval processes often caused by local resistance in terms of environmental aspects (e.g., animal protection, deforestation) and expected visual or acoustic disturbances caused by the planned wind turbines (WT) [2]. In many cases, it is argued that low frequency (20–200 Hz) and infrasonic (1–20 Hz) acoustic emissions in combination with low frequency vibrations lead to the perceptibility of wind turbines even at large distances.
A reason seen by the authors is a reduced attenuation rate of low frequency components over large distances and interactions with building structures [3]. Due to the low noise reduction of facades for low frequencies, resonant acoustic modes inside the building and structural vibration can lead to higher sound pressure levels indoors compared to outdoors, possibly in the audible range [4,5]. Although negative health effects reported by residents like sleep disturbance and headaches are often related to low frequency noise, recent reviews of studies [2,6,7] concluded that annoyance is highly influenced by social factors such as fairness, participation in the planning process, visual aspects, or attitude towards wind energy. These factors in turn could lead to the mentioned health effects, which are not solely correlated with acoustic factors. Due to [8], the relation of health effects provoked by infrasound need more research for clear answers.
In fact it is physically indisputable that the elastic rotor blades cause air pressure changes with every passage of the tower, which are spread as acoustic waves in the atmosphere [9,10,11]. Moreover, other rotating parts of a WT (e.g., power train, generator) also cause acoustic emissions [12,13,14]. Furthermore some studies show that sound propagation is clearly influenced by atmospheric condition, wind speed, and direction [13,15,16]. The tower in turn “gathers” all kinds of dynamic loads, passes them through its stiffness to the foundation, and produces structure-borne sound as well. Besides static loads, the foundation transfers various dynamic load components to the surrounding soil via soil-structure interaction, which leads to seismic wave propagation in the ground. These multiple factors influencing sound generation and propagation complicate a clear explanation of local measured values, as well as reliable forecasts.
The process of the measurement and assessment of low frequency noise down to 8 Hz is specified in DIN 45680 [17] and evaluated in “Technical instructions for protection against noise” (TA Lärm [18]). However, for the planning and approval process of an on-shore WT, the investigation of acoustic and micro-seismic emissions below f < 20 Hz is not an obligation in Germany and is only evaluated in individual cases. Therefore, no objective criteria can be applied.
To overcome this drawback, the research project “Tremor and Acoustics” (TremAc) was founded by several scientific institutions with different backgrounds in acoustics, seismology, structural engineering, environmental health, and psychology. One of the major objectives of TremAc was the measurement of low frequency ( f < 200 Hz ) acoustic noises with infrasound microphones directly near wind turbines (distance less than 300 m) and inside nearby residents buildings (different distances from WT).
Thus, with this approach regarding the acoustic measurements, time synchronous data for sound pressure p were recorded both at the location of emission and at the location of immission and in parallel with meteorological data. Thus, the decrease of acoustic noise, as well as changes in the characteristics of the signal in the time domain and frequency domain also in relation to meteorological conditions could be observed. Furthermore, one of the objectives was to be able to compare the results of numerical simulations for acoustic emissions (near-field flow and far-field propagation) with measurement data. In this contribution, the results of the acoustic measurements performed are presented and discussed in detail. They also contribute to finding objective criteria for the low frequency noise of WT.
To keep the text intelligible, the frequency range from 1 Hz to about 200 Hz is referred to as low frequency sound.

2. Methodology

2.1. Measuring Locations, Setup, and Periods

The acoustic measurements were conducted at two different WT sites subsequently called Sites 1 and 2. Both sites were equipped with gearless WT. Site 1 with one WT (hub height 138 m, rotor diameter 82 m, 2 MW power) was located in southern Germany with a hilly surrounding terrain. At Site 2, located in northern Germany (flat terrain), nine WT of the same type, but with a different hub height of 108 m, were considered. Altogether, three periods of long-term noise surveillance were carried out with about 117 days (by University Stuttgart—Stuttgart Wind Energy (SWE)) and 120 days (by Karlsruhe Institute of Technology—Institute of Soil Mechanics and Rock Mechanics (IBF)) of measurement. For Site 1, the measurement period was from 31 July 2018 to 31 August 2018 and from 5 February 2019 to 11 March 2019. SWE had to dismount the instrumentation already on 25 February 2019. The average temperature in August was 30 ° C and 0–5 ° C in February. For Site 2, measurements were conducted from 16 November 2018 to 17 January 2019 (IBF until 9 January 2019) with average temperatures around 0 ° C.
Figure 1 shows the site plans of Sites 1 and 2 indicating the locations of the measuring devices and wind turbines in a schematic way. At Site 1, the free field equipment was located 140 m south of the WT in August 2018 (measurement location L1) and 240 m south east of the WT in February 2019 (measurement location L2). The location inside a building (L3) was approximately 400 m west of the WT. Location L5 indicated the measurement location at Site 2 approximately 237 m east of WT 3, shown in Figure 1. L6, as well as L7 were the measurement locations inside of buildings at distances between approximately 1450 m to WT 8 (L6) and approximately 1640 m distance to WT 5 (L7). Locations L3 (7 m × 10 m, height 8 m) and L7 (8 m × 11 m, height approximately 5 m) were rarely used barns built as wooden constructions (wall thickness < 3 cm) with tiled roofs and concrete foundations directly beside the homes of residents who felt disturbed by the WT. L6 was a two-story single-family house (9 m × 10 m) of masonry construction (wall thickness unknown) with a tiled roof and partly a cellar. Here it is noted that acoustic measurements during the first campaign in August were used as test measurements for further measurements. For evaluation, the data from measurement location L1 were not considered.
As stated before, the measurements were performed simultaneously near the WT by SWE and inside nearby buildings by IBF (see Figure 1). Therefore, different measuring setups were used. Prior to the actual field measurements, the different infrasound microphones (see Section 2.2 and Section 2.3) were tested together with each data acquisition system in accordance with the GPS timestamps and sound pressure amplitudes.
The peculiarity in this research project was that the wind turbines at Site 1 and Site 2 were switched off at determined times every day during the measurements. This approach offered a more precise separation of the emissions of the WT and the current background noise. Throughout the first measuring period in August 2018, the WT was switched off at 01:40 (UTC) for 20 min for the first time and then every two hours for 20 min (12 shutdowns per day). Due to significant acoustic emissions produced by traffic and agricultural work during the daytime, the number of shutdowns was reduced in the following measuring periods. Thus, only four 20 min shutdowns were determined at 00:40, 02:40, 04:40, and 22:40 with the focus on nighttime. Time stamps in this paper are always based on Coordinated Universal Time (UTC).

2.2. Instrumentation of SWE

Within the scope of the project, SWE carried out measurements of acoustic emissions close to the WT combined with meteorological parameters. To measure low frequency noise, two G.R.A.S.47AC 1/2 inch CCP (constant current power) free-field condenser microphone sets for infra-sound were used with a frequency response of ±3 dB from 0.09 Hz to 20 kHz. The time series data were recorded using the imc CRONOSflex data acquisition system supporting a 4 channel sound card with 24 bit resolution, a maximum sampling rate of 50 kHz, and a lower cut-off frequency of 0.2 Hz. Detailed sensor information is specified in Table 1. It was operated with imc Studio-PRO-5.0 Software [19]. Two mounting methods were used for the measurements. One microphone was placed in the middle of a 43 mm thick and 1 m diameter wooden plate with an 85 mm primary windshield and 450 mm hemispherical secondary windshield, which conformed to the IEC 61400-11:2012 standard [20], as shown in Figure 2. The second measurement method is shown in Figure 3 using a sound reflecting 0.4 m wide/long and 0.85 m high wooden box, which was constructed by SWE according to [21]. The microphone was placed on a 0.4 m high tripod with a primary windshield in the middle of the box, which was buried at ground level and covered by acoustically transparent material to reduce wind induced noise.
In addition to low frequency acoustic data, meteorological data were captured. As shown in Figure 4, a 10 m high met-mast mounted to a container was equipped with a 3D ultrasonic anemometer on the top to measure wind speed and direction. Furthermore, air pressure, temperature, and humidity were recorded continuously with a sampling rate of 10 Hz. A camera for safeguarding the measurement equipment was installed in the middle at about a 4 m height on the met-mast. Detailed sensor information is specified in Table 2. All recorded data were synchronized with a GPS time signal. A container was placed on a trailer used as a mobile control center for the data acquisition system, but also as protection for the electronic measuring equipment from weather and theft. The distance between the microphones and container was up to 25 m due to the maximum cable length.
Figure 5 shows a schematic drawing of the container. It was supplied with 230 V AC over a supply cable from the WT. The battery charger of two batteries mounted in the container was directly connected to the container power supply. It was designed to ensure a constant, undisturbed power supply to prevent immediate failure of the measuring electronics even in the event of a power breakdown. In order to ensure an undisturbed power supply, the battery should not be charged and discharged at the same time. This was achieved by switching over with the aid of a relay four times per day at 7:00, 12:00, 15:00, and 20:00 and caused electrical disturbances in the measured pressure signal.

2.3. Instrumentation of IBF

The focus of IBF as a TremAc project partner was the combined measurement of acoustic immissions (sound pressure) and seismic immissions (vibration velocity) at the same location inside of buildings near wind turbines. These buildings were chosen because of the actual complaints of the residents. Thereby, the common frequency range of seismic measurements ( 1 Hz f 50 Hz ) was expanded up to 150 Hz. For acoustic measurements in general, this was a strong limitation, but in this project, the focus was on low frequencies and the time history of sound pressure. Nevertheless, besides the use of infrasound microphones, a sound pressure level meter was used to preserve at least the information about the sound pressure level (SPL) and its frequency characteristic between 6.3 Hz and 20 kHz.
Within this project, two 1/2 inch free-field ICP condenser microphones of type Brüel & Kjær No. 4964 and PCB 378A07 were used. Additionally, a Larson Davis SoundTrack LxT sound level meter (IEC Class 1) recording third octave SPL was employed. A selection of technical data is shown in Table 3. For the combined data acquisition of the acoustic and seismic instruments, a so-called DiGOS DATA-CUBE 3 Type 2 with a 400 Hz sampling rate and 24 bit sampling depth saved the incoming voltage amplitudes of three separate channels with symmetric inputs simultaneously including GPS timestamps. The asymmetric outputs of the microphones and SPL meter were adapted to the symmetric inputs.
As exemplary pictured in Figure 6, the microphones were placed openly inside of the investigated area at a height of about 0.1 m from the floor (sound pressure tended to be highest). This led to the restriction that no interferences with the local residents occurred. Besides the likely disturbance of the measurements by everyday noises with low frequencies, especially the movement of doors and electric machines (e.g., washing machines), the protection of privacy was mandatory because the conversations of residents were still audible. Therefore, only data during the absence of inhabitants were used or the measuring setup was installed in unoccupied auxiliary buildings.

3. Data Evaluation

In order to analyze the measured acoustic data for the location of emission and immission, specific time periods between one to six days were chosen either according to the atmospheric stability or due to wind turbine operation data. The wind farm operator provided 10 minute averaged hub height data, including mean wind speed, rotational speed of the rotor blades, power output, and nacelle position, for both sites and all measurement periods.
A method for the evaluation of atmospheric conditions with respect to wind turbine noise presented by [15] is to calculate atmospheric stability with the logarithmic shear exponent m, which is defined as follows:
m = ln ( v h / v ref ) ln ( h / h ref )
where v h is the wind speed at hub height h and v ref is the wind speed at reference height h ref = 10 m (top of the met-mast). A relation between the shear exponent and atmospheric stability was proposed by [15,16,22] and was used in [13] to relate acoustic data and atmospheric conditions. Table 4 shows the ranges of m for different atmospheric conditions. Instable conditions can be associated with higher turbulence, hence higher changes over time and space of wind speed and direction [16].
Shorter time periods (especially after 22:00 and before 06:00) were then chosen for further investigations if there was the possibility to distinguish the WT noise and background noise of other sources (e.g., traffic, agricultural work). Selected time series of sound pressure p recorded both at Site 1 and Site 2 are shown in Section 4.3. For this purpose, the raw sound pressure data of SWE taken with a sampling rate of 20 kHz were low-pass filtered and resampled with a 500 Hz sampling rate to simplify the processing of the data. Because of the GPS based time synchronization SWE and IBF used, time series data could directly be compared. To maintain the recognizability of small amplitudes in the time series diagrams, the ordinate axis was limited on purpose.
For the plot of the spectrograms (see Section 4.4), an estimate of the power spectral density (PSD) of the acoustic data was calculated using MATLAB function “spectrogram”. The following properties were used: time length T = 10 s , Hanning window, window length N win = T · f s (SWE: f s = 500 Hz , IBF: f s = 400 Hz ), no averaging, 0% overlap. This led to outputs with a resolution of 1 / T = 0.1 Hz and upper limiting frequencies of 0.7 · f s / 2 . Color mapping of the PSD plots was done by evaluating 10 · log 10 ( P / P ref ) with measured power quantity P and reference value P ref = 1.0 Pa 2 / Hz as the level in decibels (dB).
More detailed information regarding the frequency spectrum of the measured acoustic signals and related sound pressure levels was received by evaluating the mean values of narrow-band spectra over selected 10 minute time periods (see Section 4.5). Therefore, the short-time Fourier transform S of the input signal was calculated again with the use of MATLABfunction “spectrogram” and the same properties as described before. After that, the spectral amplitude | S | in MATLAB had to be properly normalized by factor 2 / N win .
Additionally, one-third octave spectra were calculated in the following way. At first, a specific time range for the evaluation was chosen (mostly based on current atmospheric stability), then this part of the original signal was bandpass filtered between 1 Hz and 150 Hz. With the use of MATLAB function “octaveFilter”, a filter bank with 20 center frequencies between 1.6 Hz and 125.0 Hz (according to [17,23]), filter order 8, and third octave bandwidth was designed. The time series signal was filtered with each of these filters, and for the calculation of sound pressure level (see Equation (2)) values, a moving root-mean-square (RMS) function (sliding window method, window length 500 samples) was used.
L p = 20 · log 10 p p 0
where p is the one-third octave band filtered signal and p 0 = 2.0 × 10 5 Pa is the reference sound pressure. For the diagram, the arithmetic mean of the sound pressure levels during the chosen time periods was built separately for each third and plotted over the center frequencies.
Because of a non-disclosure agreement, only relative values for SPL are presented in this contribution, and amplitude spectra diagrams are not labeled on the ordinate axis.

4. Results

4.1. Comparison of the Measurement Methods Used by SWE

In Section 2.2, two methods to measure low frequency sound were proposed. Besides mounting a microphone on a sound reflecting plate, measurements where conducted with a microphone placed in a wooden box buried in the ground. To evaluate sound induced by the WT, one method needed to be chosen for further data evaluation beforehand. For this purpose, unweighted narrow-band spectra for a frequency range up to 20 kHz of a 10 min time period on 10 February 2019 were compared. On the basis of the SPL difference of measured signals with plate and box microphone mounting in Figure 7, the influence of the box became apparent. Below 10 Hz, the measurement technique in the box could influence the harmonics of the blade passing frequency, between 10 Hz and 40 Hz differences in SPL decrease and close to 0 dB. Above 40 Hz, the difference between both methods increased, and the influence of the box dimensions on the measurements was considerable. Peaks at 190 Hz and 565 Hz could be attributed to the first and third order mode of the box height. Since the box modes affected the measured signal in the considered frequency range, box measurements were not useful for data evaluation in the low frequency range. Advantages regarding the reduction of wind noise were not evident. In the following sections, only data from the plate mounted microphone are evaluated.

4.2. Wind Conditions and Atmospheric Conditions

A starting point for evaluation of the influence of atmospheric conditions on acoustic signals is an analysis of the measurement periods over several days. In 
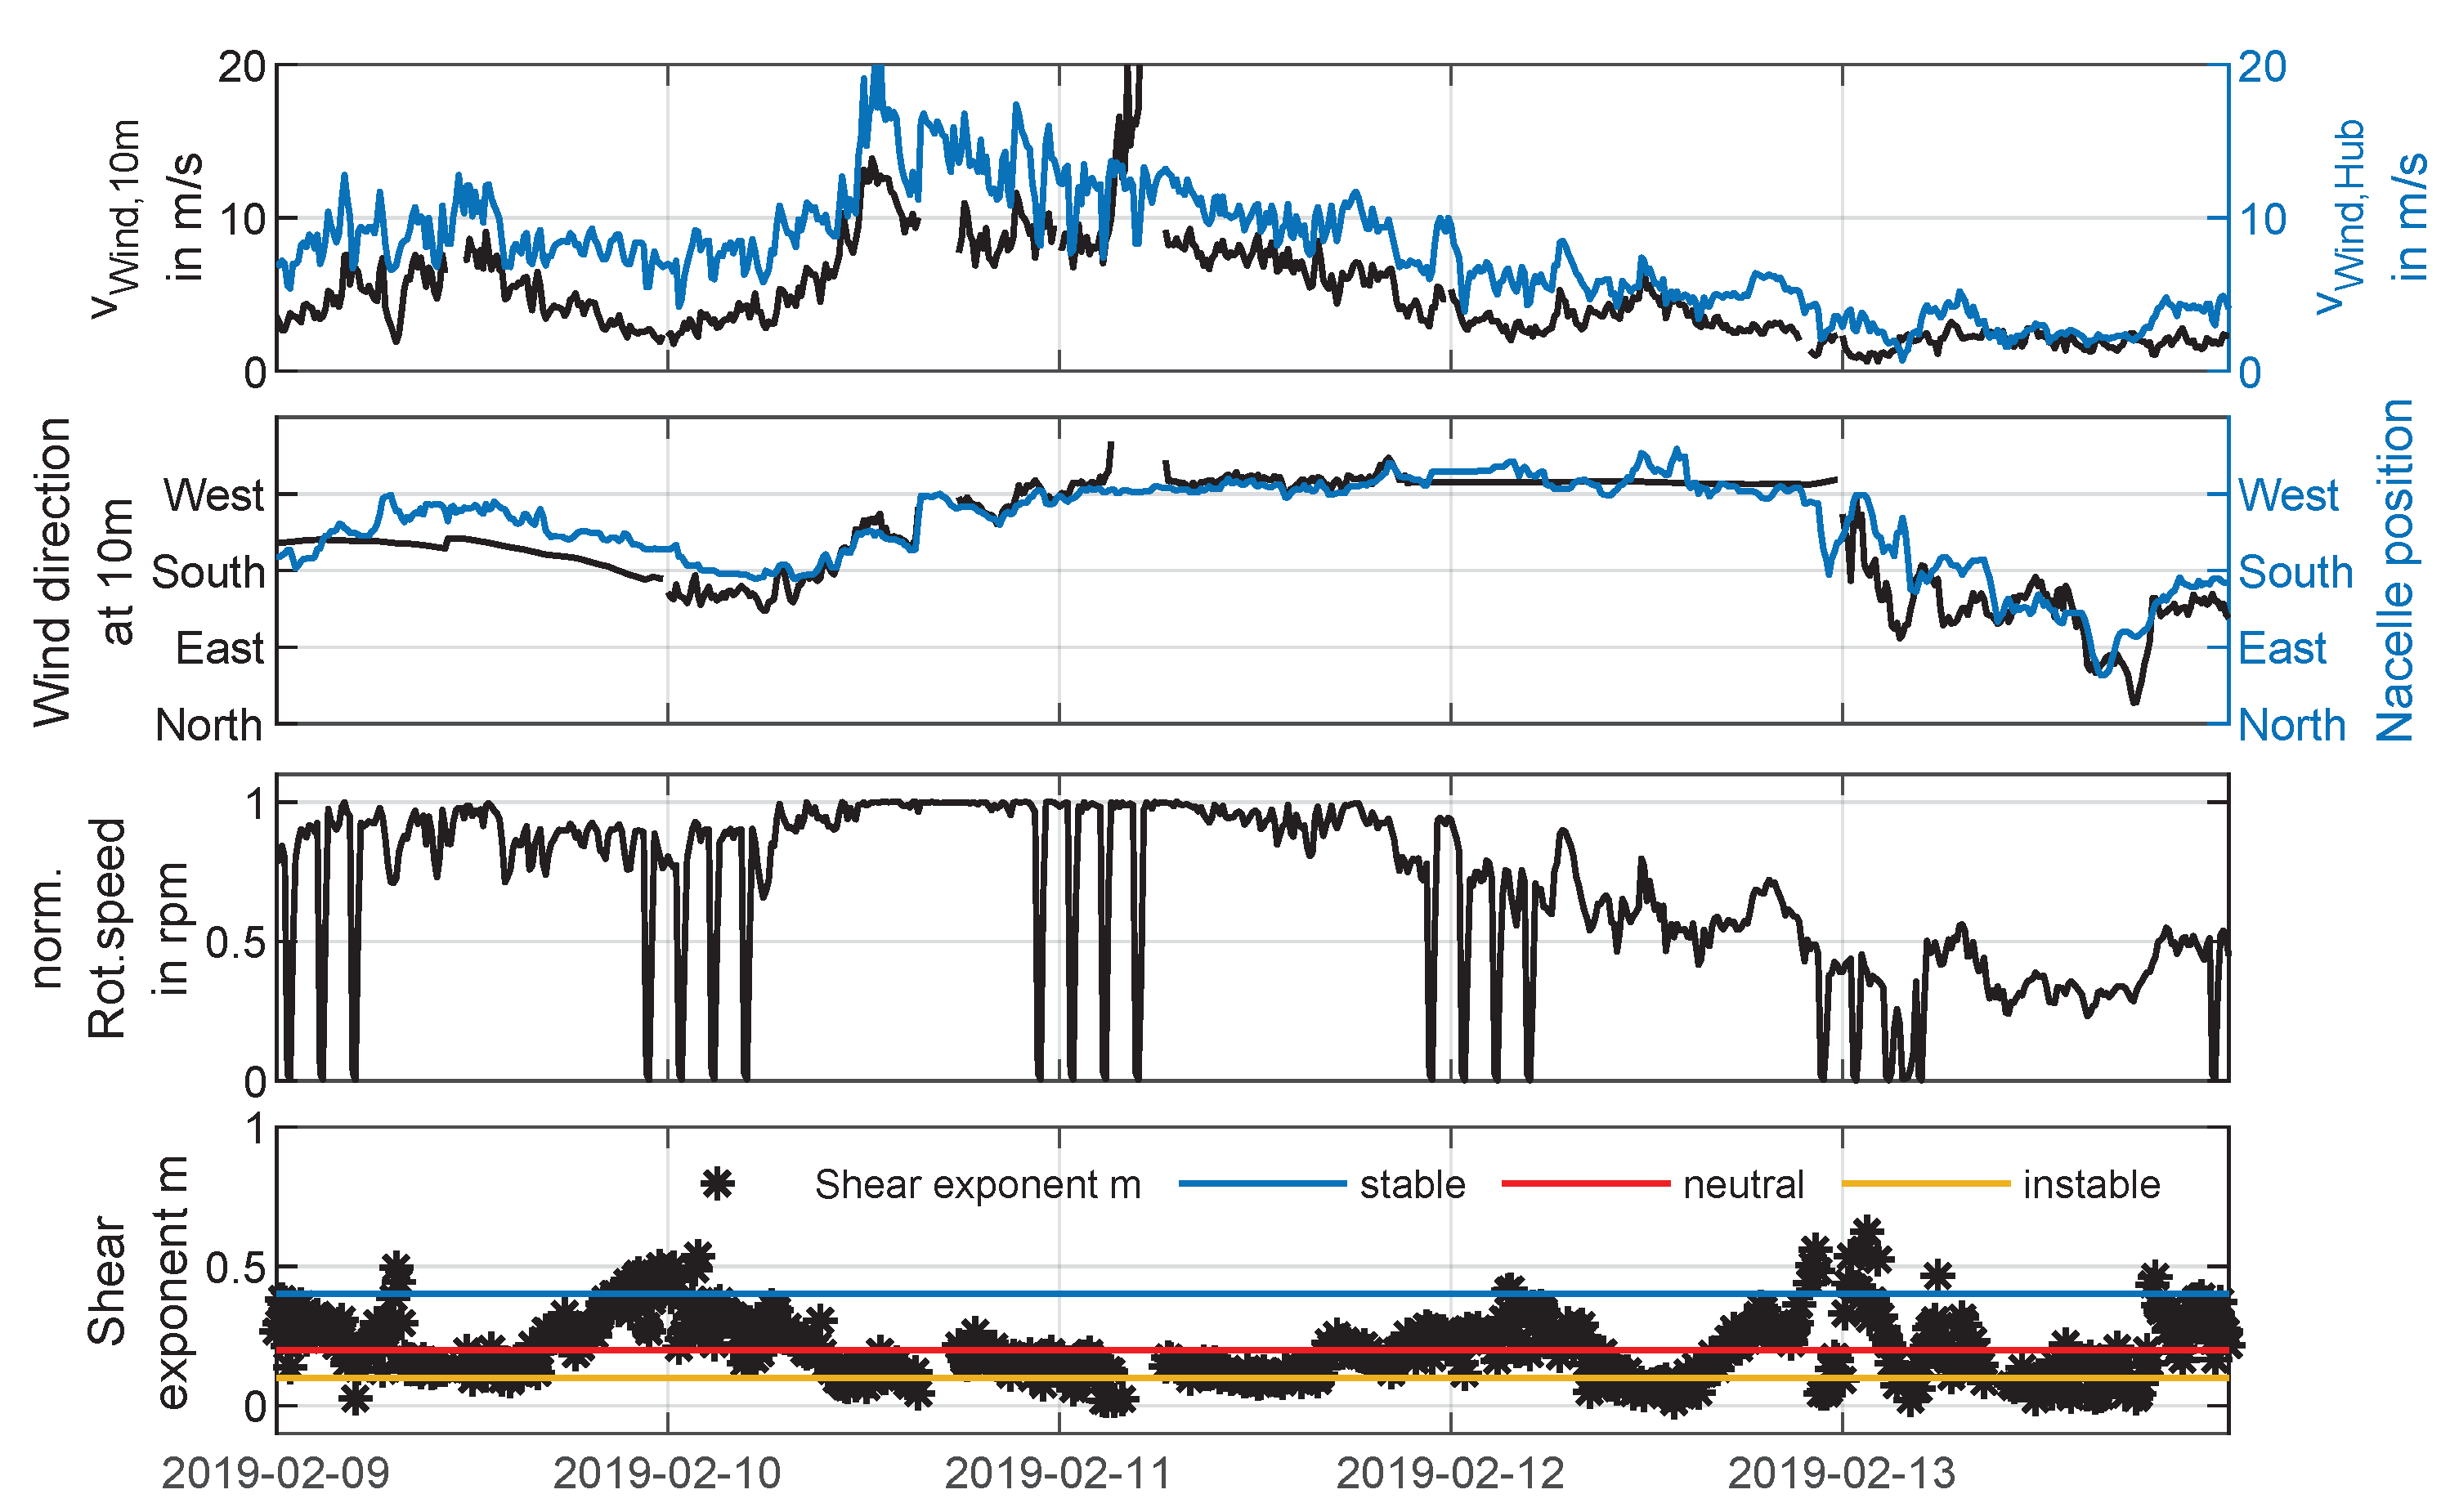
Figure 8, the 10 min averaged meteorological parameters over a measurement period of five days from 9 February 2019 to 13 February 2019 at Site 1 and location L2 are plotted. The wind speed and wind direction plot on the top show that both wind speed and wind direction measured at a 10 m height and hub height followed the same shape. In particular, the measured wind direction matched the provided data at hub height. The wind direction plot shows that measurement locations L2 and L3 were mainly crosswind from the WT during the first and last days as wind came from the south. During 11 February 2019 and 12 February 2019, position L2 was located in the downwind direction, whereas L3 was located upwind from the WT since the wind came from the western direction. The rotational speed plotted in rotations per minute (rpm) in the third plot was normalized to a maximum rotational speed. Time periods with zero rotation marked the 20 min shutdown periods during the night time. From the bottom plot, it is evident that stable atmospheric conditions mainly occurred during the night time (cf. [24]). During time periods with high wind speeds at both considered heights (e.g., 11 February 2019 and 12 February 2019), mixed air layers led to an instable or neutral atmosphere, which was more likely during the daytime. The same applied to time periods with low wind speeds at both heights (e.g., 13 February 2019).
In 
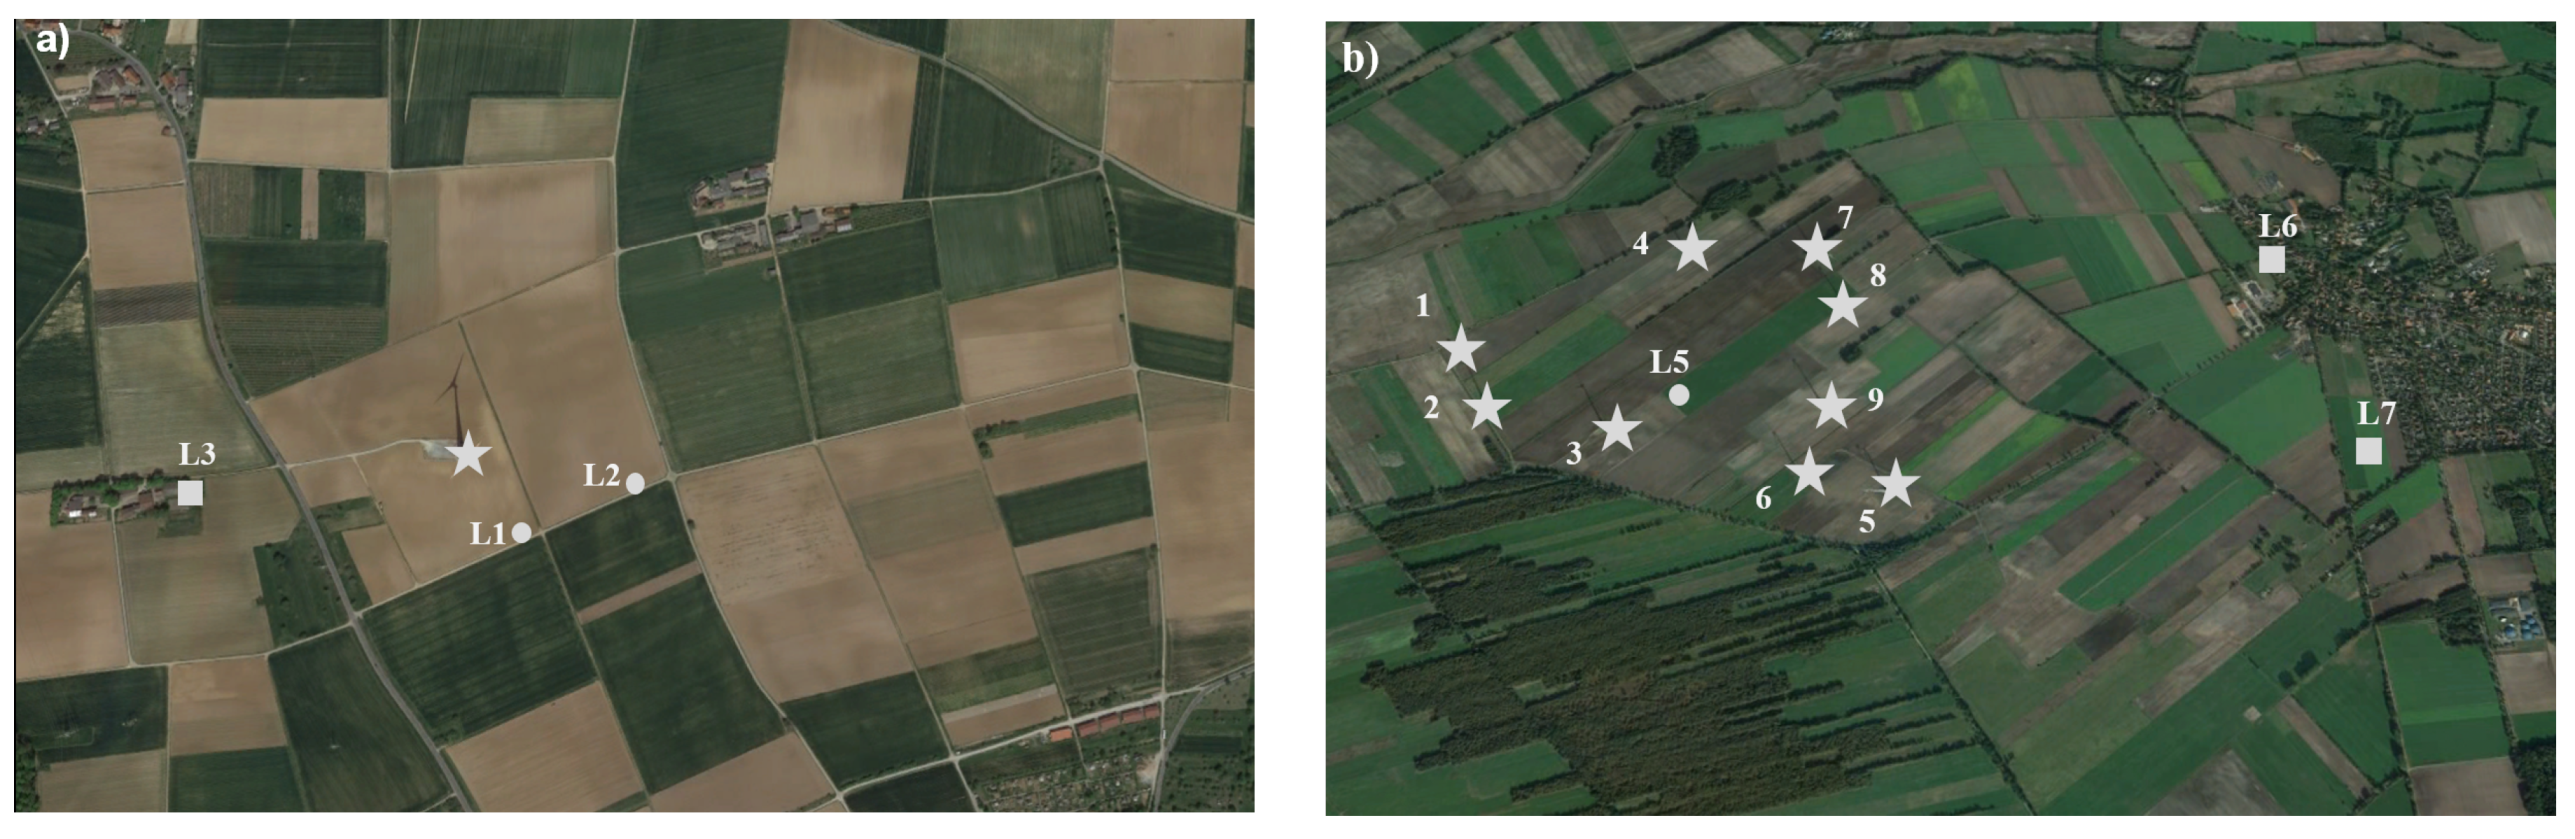
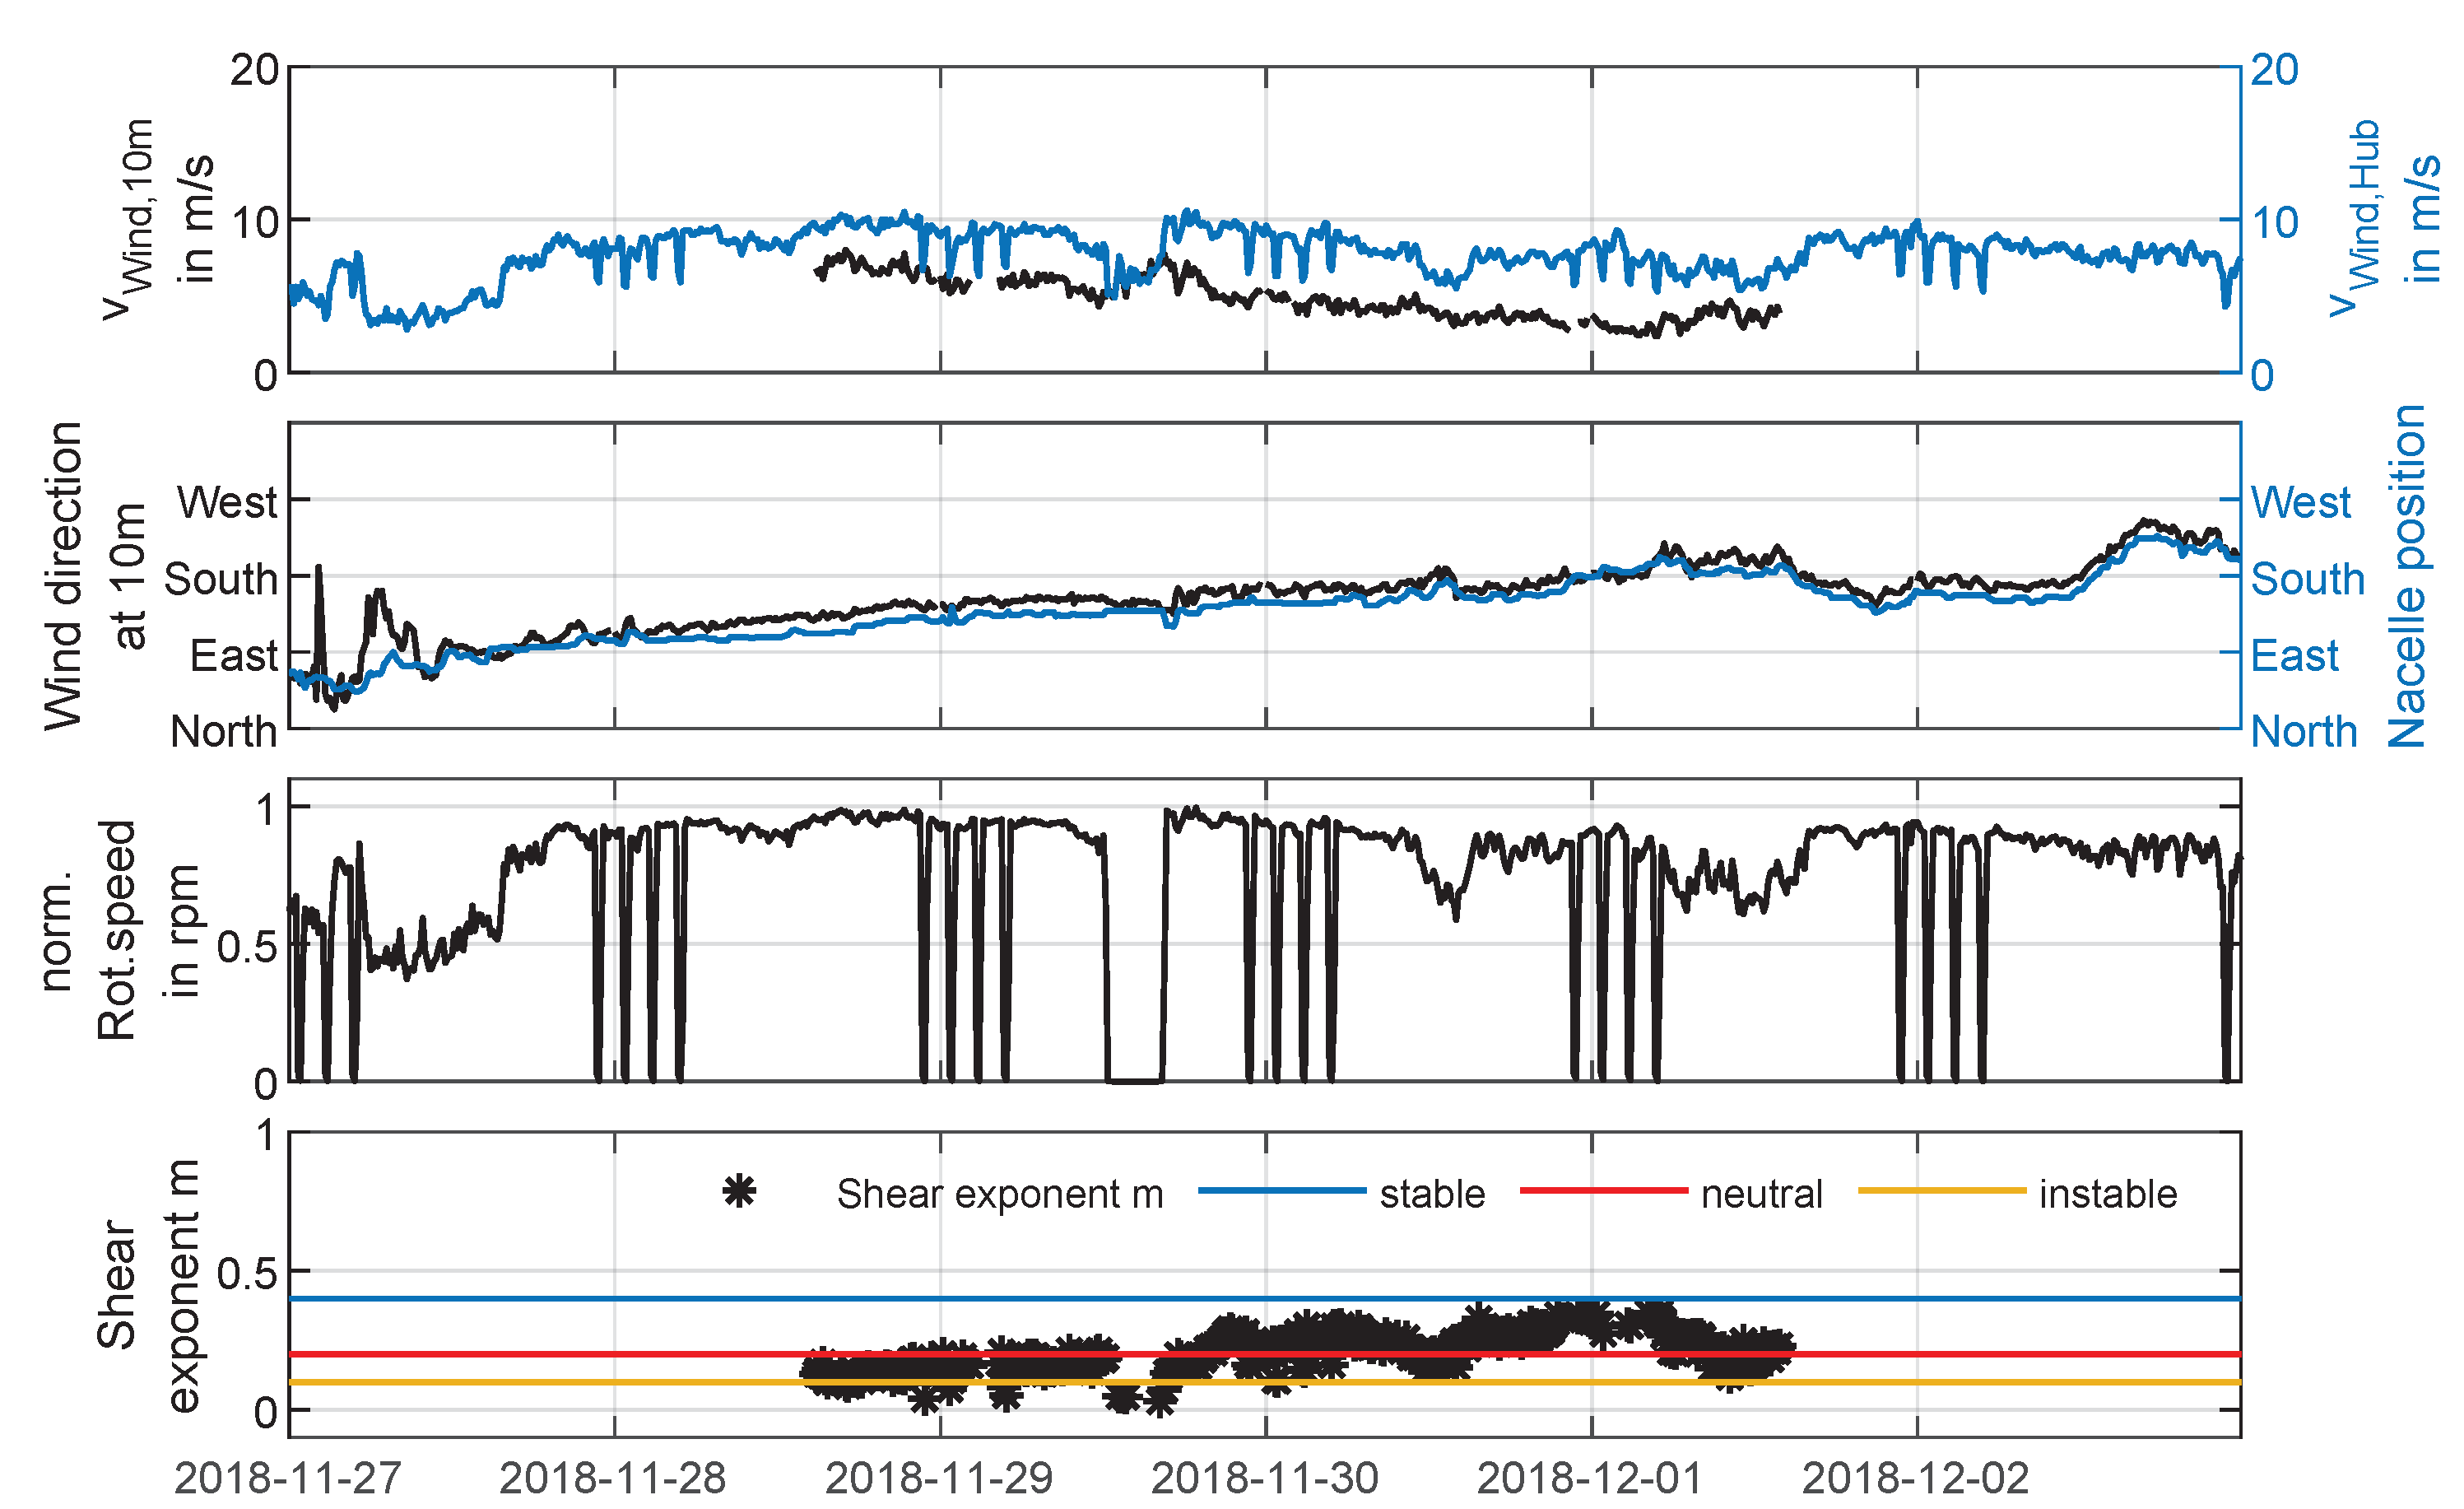
Figure 9, the same 10 min averaged parameters are plotted for a period of six days from 27 November 2018 to 2 December 2018 at Site 2, whereas data at a 10 m height were measured at location L5 and the data for hub height for WT3; see Figure 1. Due to an anemometer malfunction, met-mast wind speed data were only available for three days within this week. As already seen from the measurements at Site 1, there was a good agreement between wind direction data measured at different heights, also in a wind park. The plot shows that measurement locations L6 and L7 were mainly crosswind from the WT as the wind came from the south most of the time. Considering WT3, which was closest to L5, the measurement location L5 was also crosswind from the WT. By comparing wind speed and rotational speed at hub height, it was obvious that shutdown times during nighttime influenced the measured wind speed. Additionally, it was also specified by the WT operator not to use wind speed data of shutdown periods. This needed to be considered when evaluating the shear exponent. This could be the reason that the difference between stable and instable conditions during day and night was not as clearly distinguishable as on February 2019. However, a stable atmosphere became apparent mainly during the night.

4.3. Time Series of Sound Pressure Data

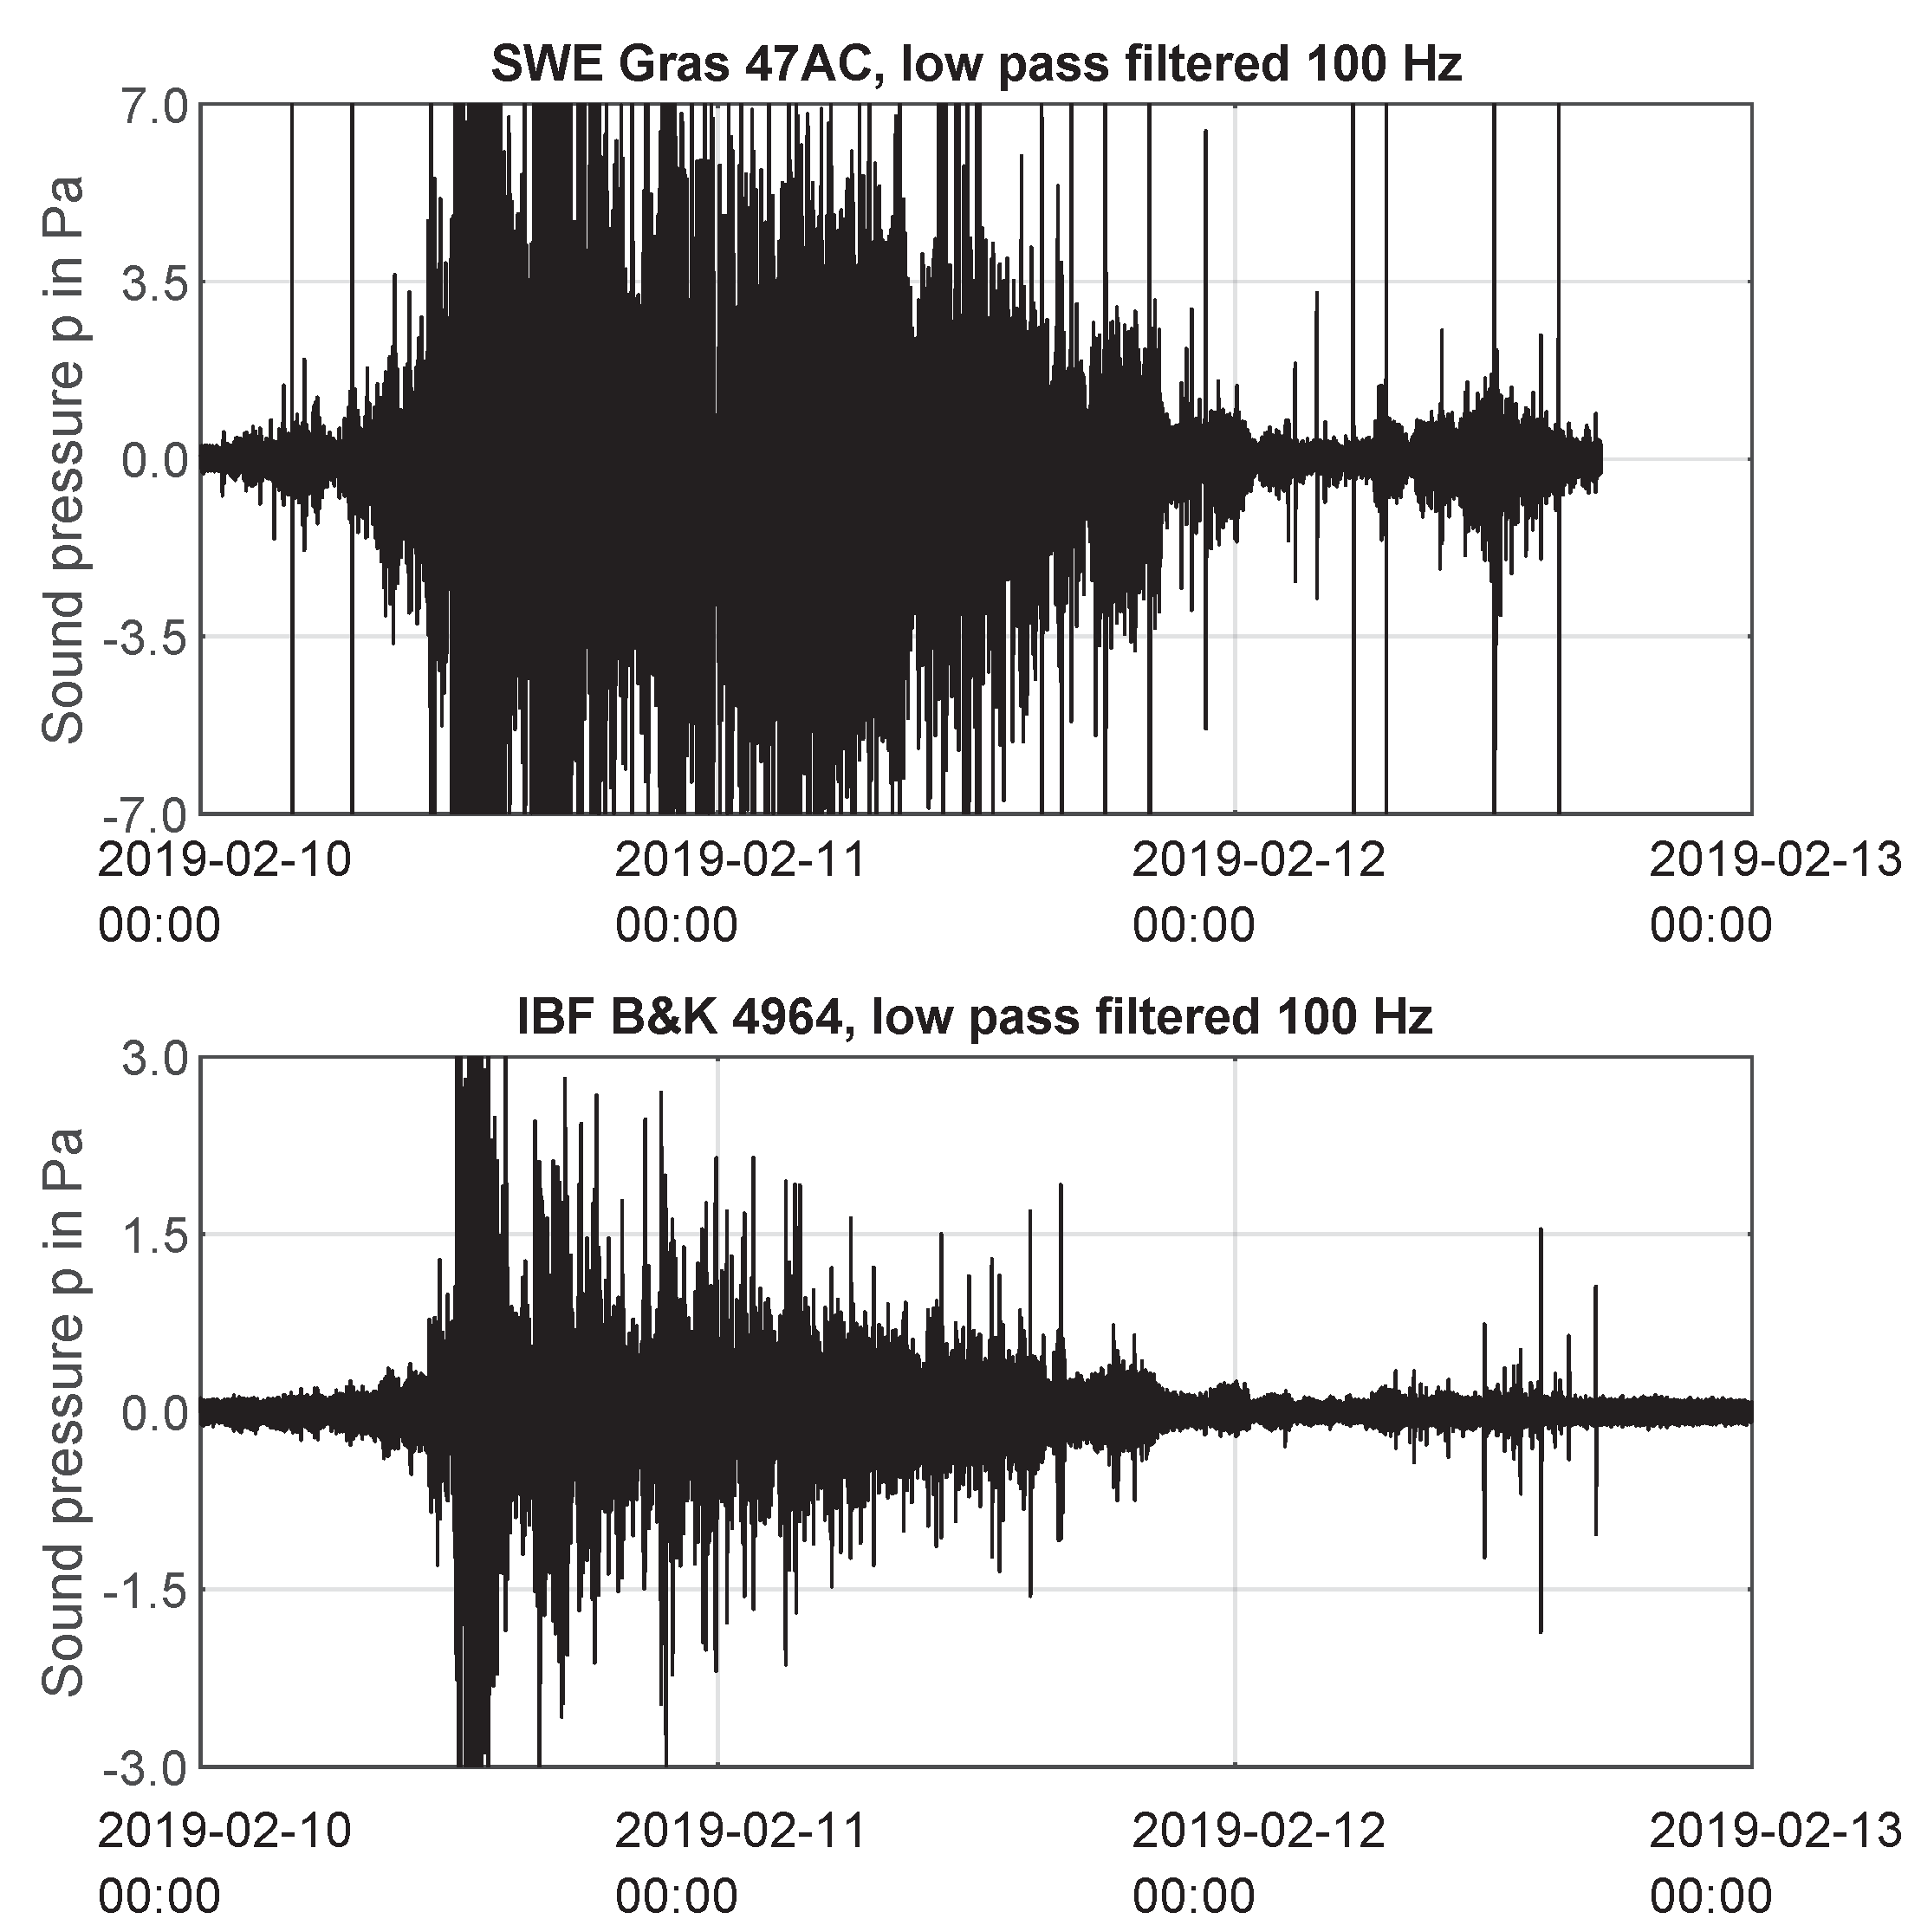
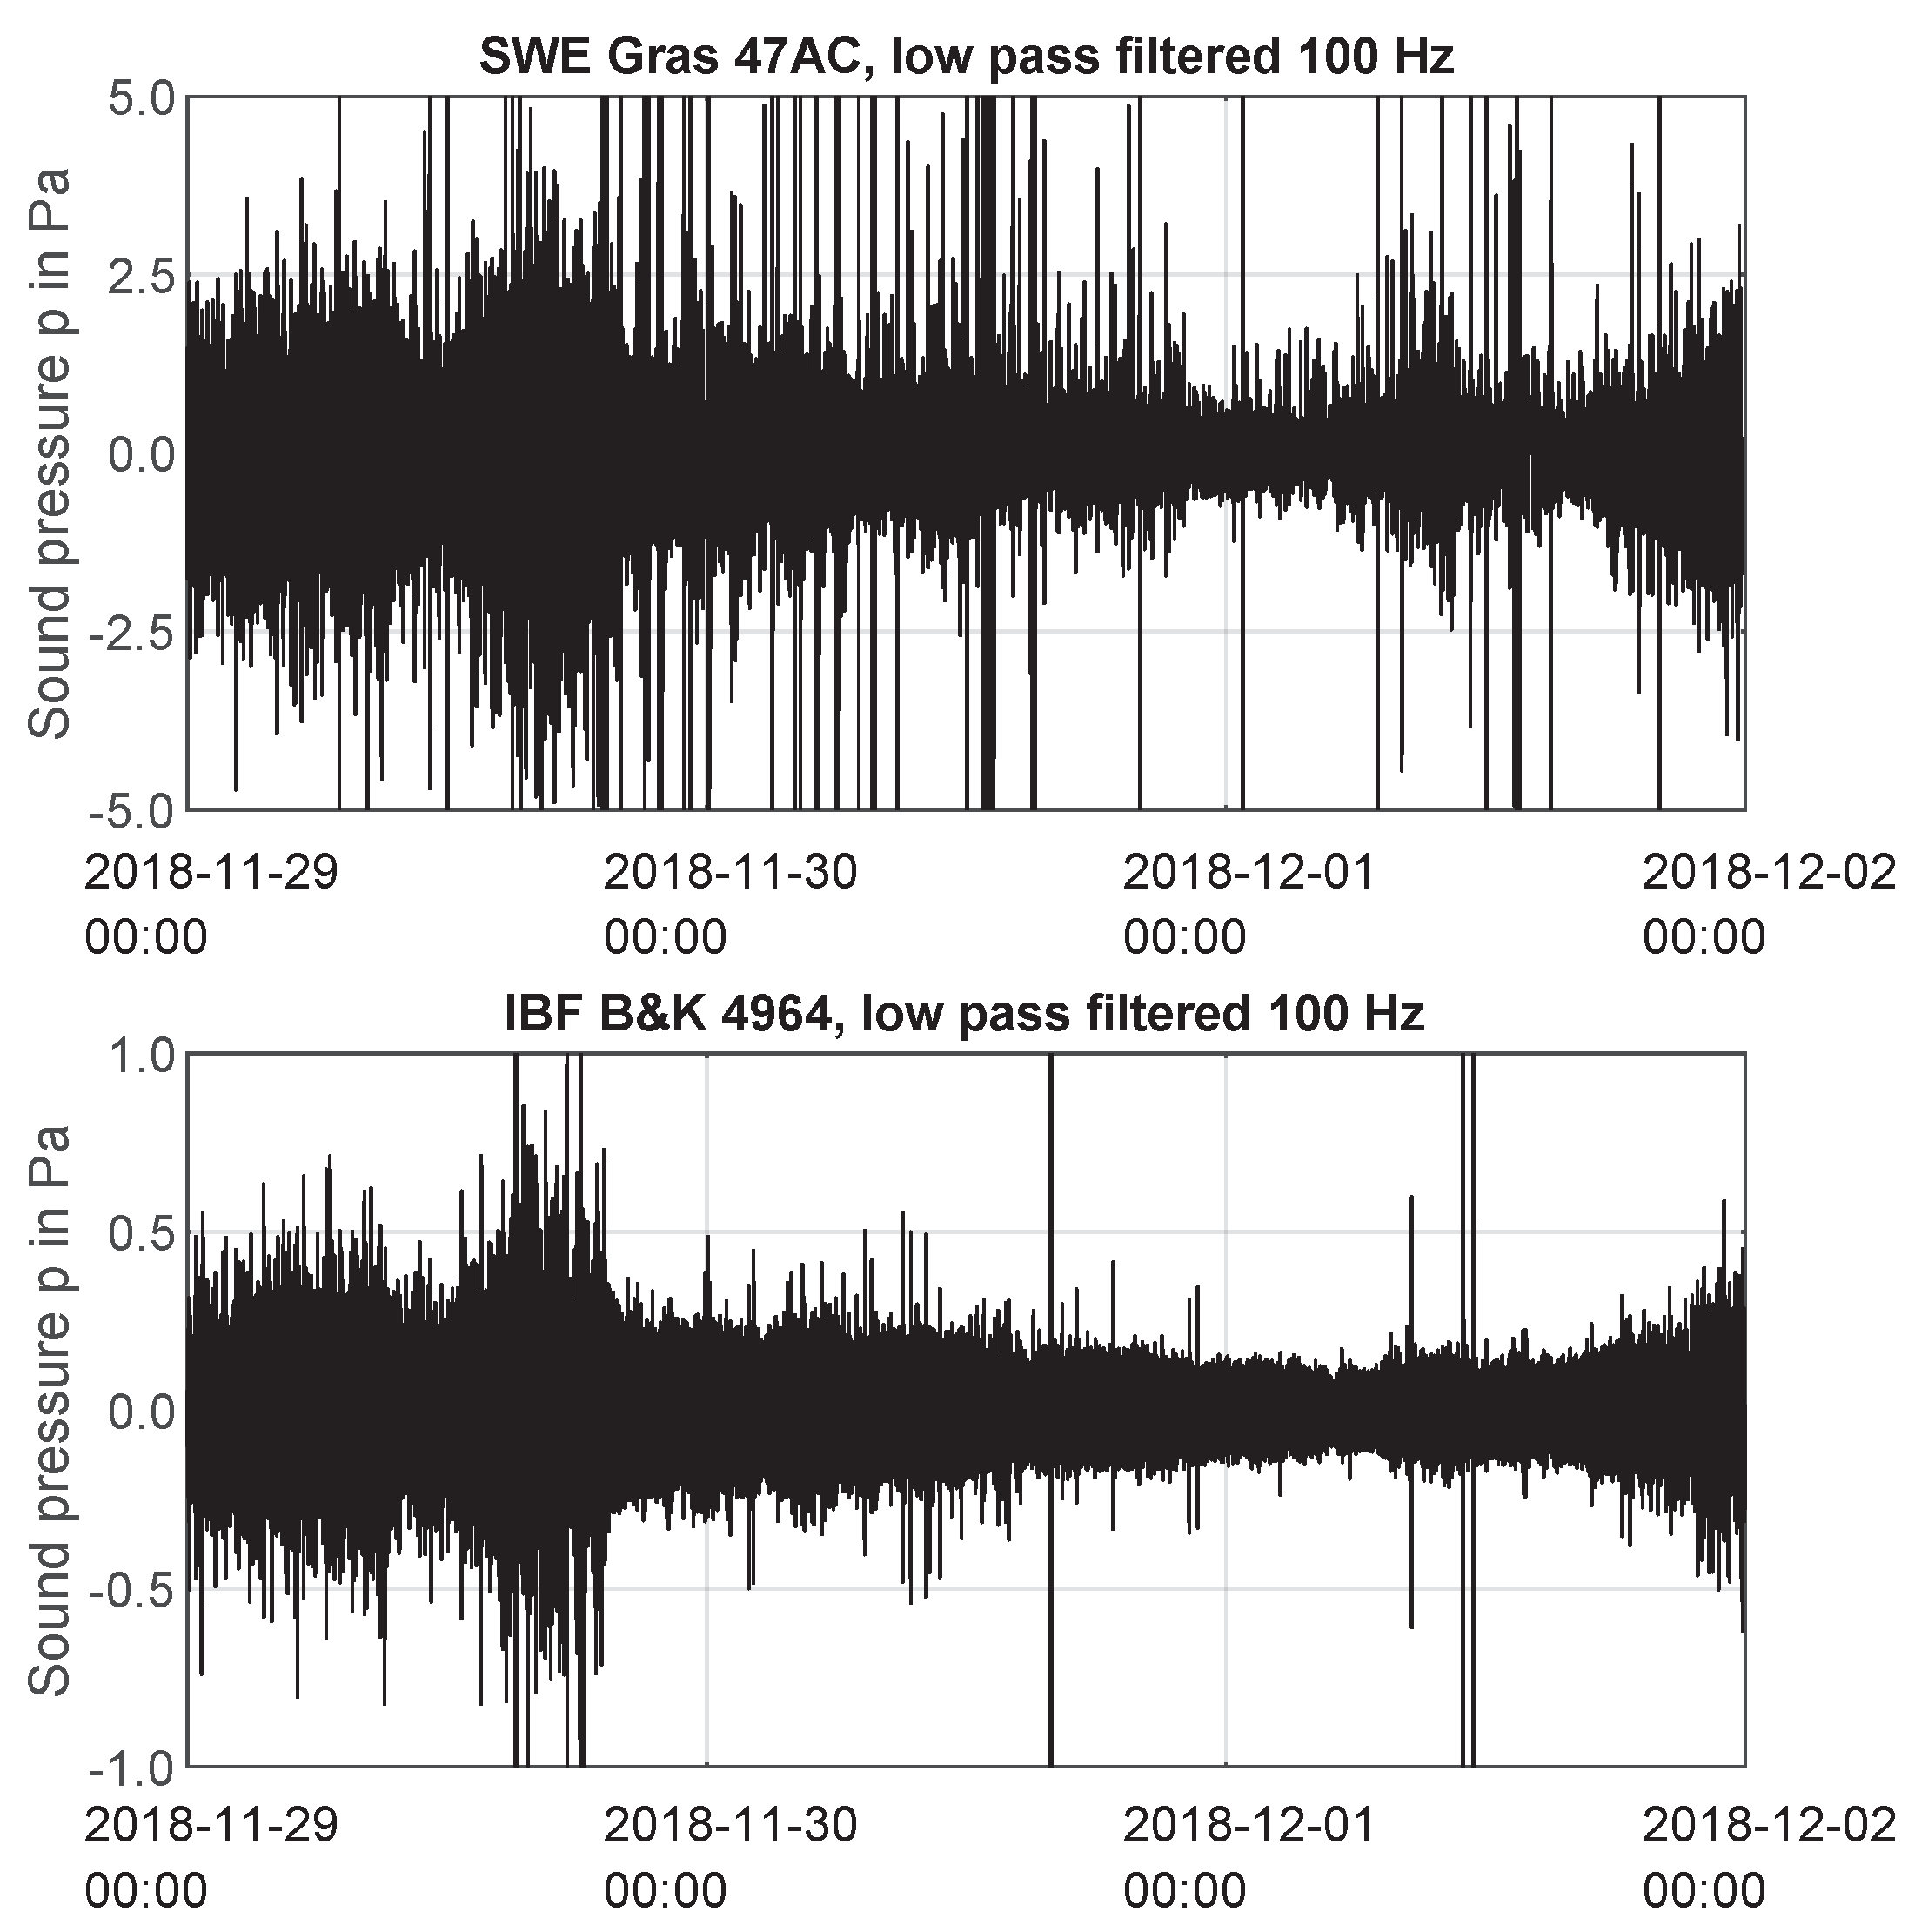
For the comparison of SWE and IBF measurements with the focus on low frequencies, the acoustic data were low-pass filtered with 100 Hz and plotted over time in Figure 10 and Figure 11. Three day time periods of measurements at Site 1 in February 2019 (SWE microphone malfunction on 12 February 2019 17:30) and at Site 2 in November 2019 are shown for a qualitative comparison.
As expected, the results showed that sound pressure amplitudes p at the point of emission were significantly higher (partially twice or more) than sound pressure amplitudes inside of buildings. One of the main reasons for that was the acoustic noise produced by wind and its effects on the natural surroundings. Beside the reduced air movement in a more or less sheltered area, the amount of other anthropogenic noise sources was also reduced, especially during the absence of residents. Thus, IBF time series of p in Figure 10 and Figure 11 showed less short-time peaks with clearly higher amplitudes. Altogether, there was a tendency that the time series of emission and immission coincided in a way that the form of an enveloping curve around the measured signals indicated simultaneous increases and decreases of the amplitudes.
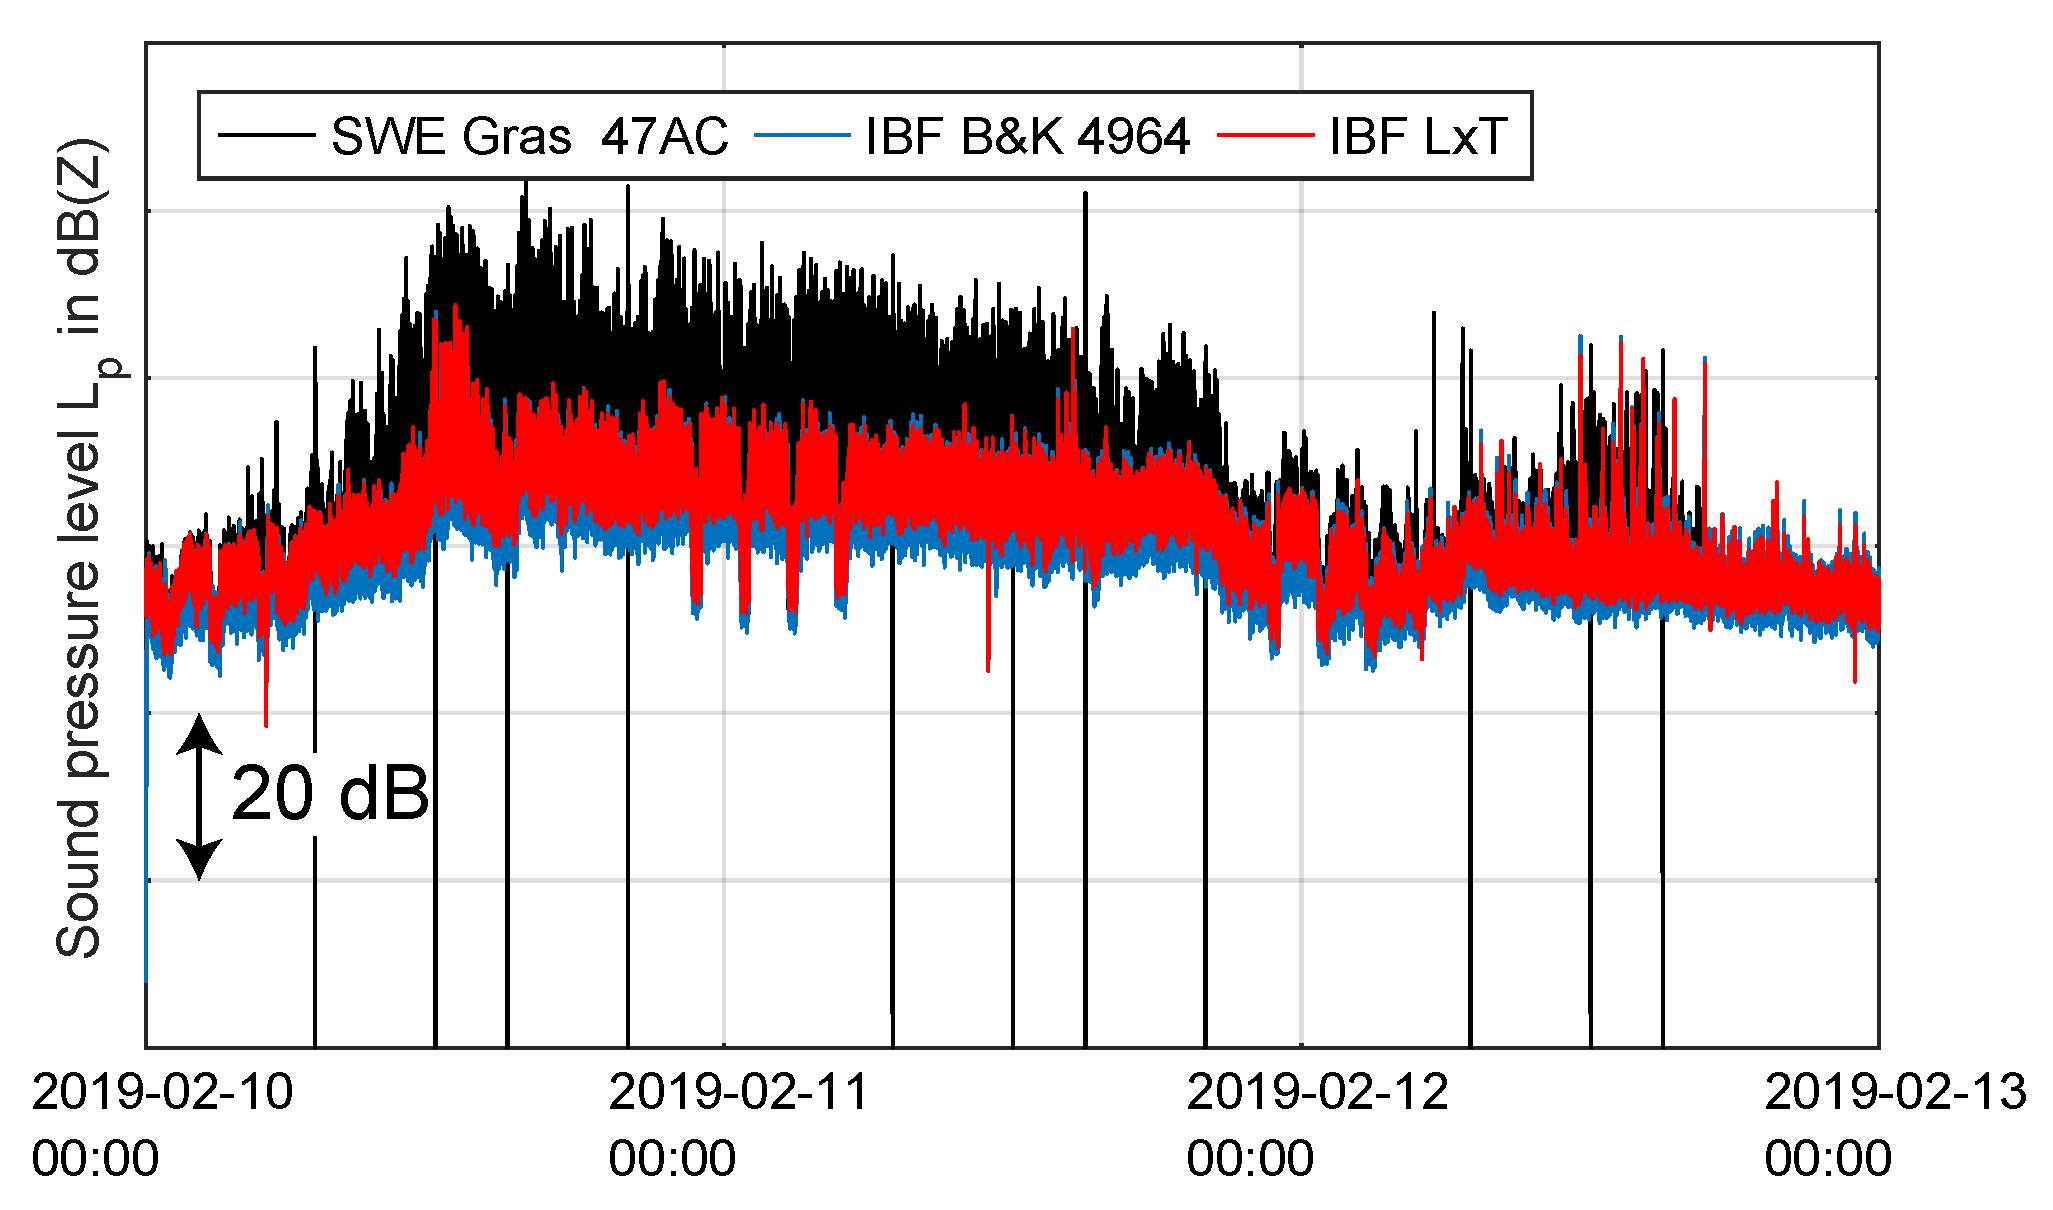
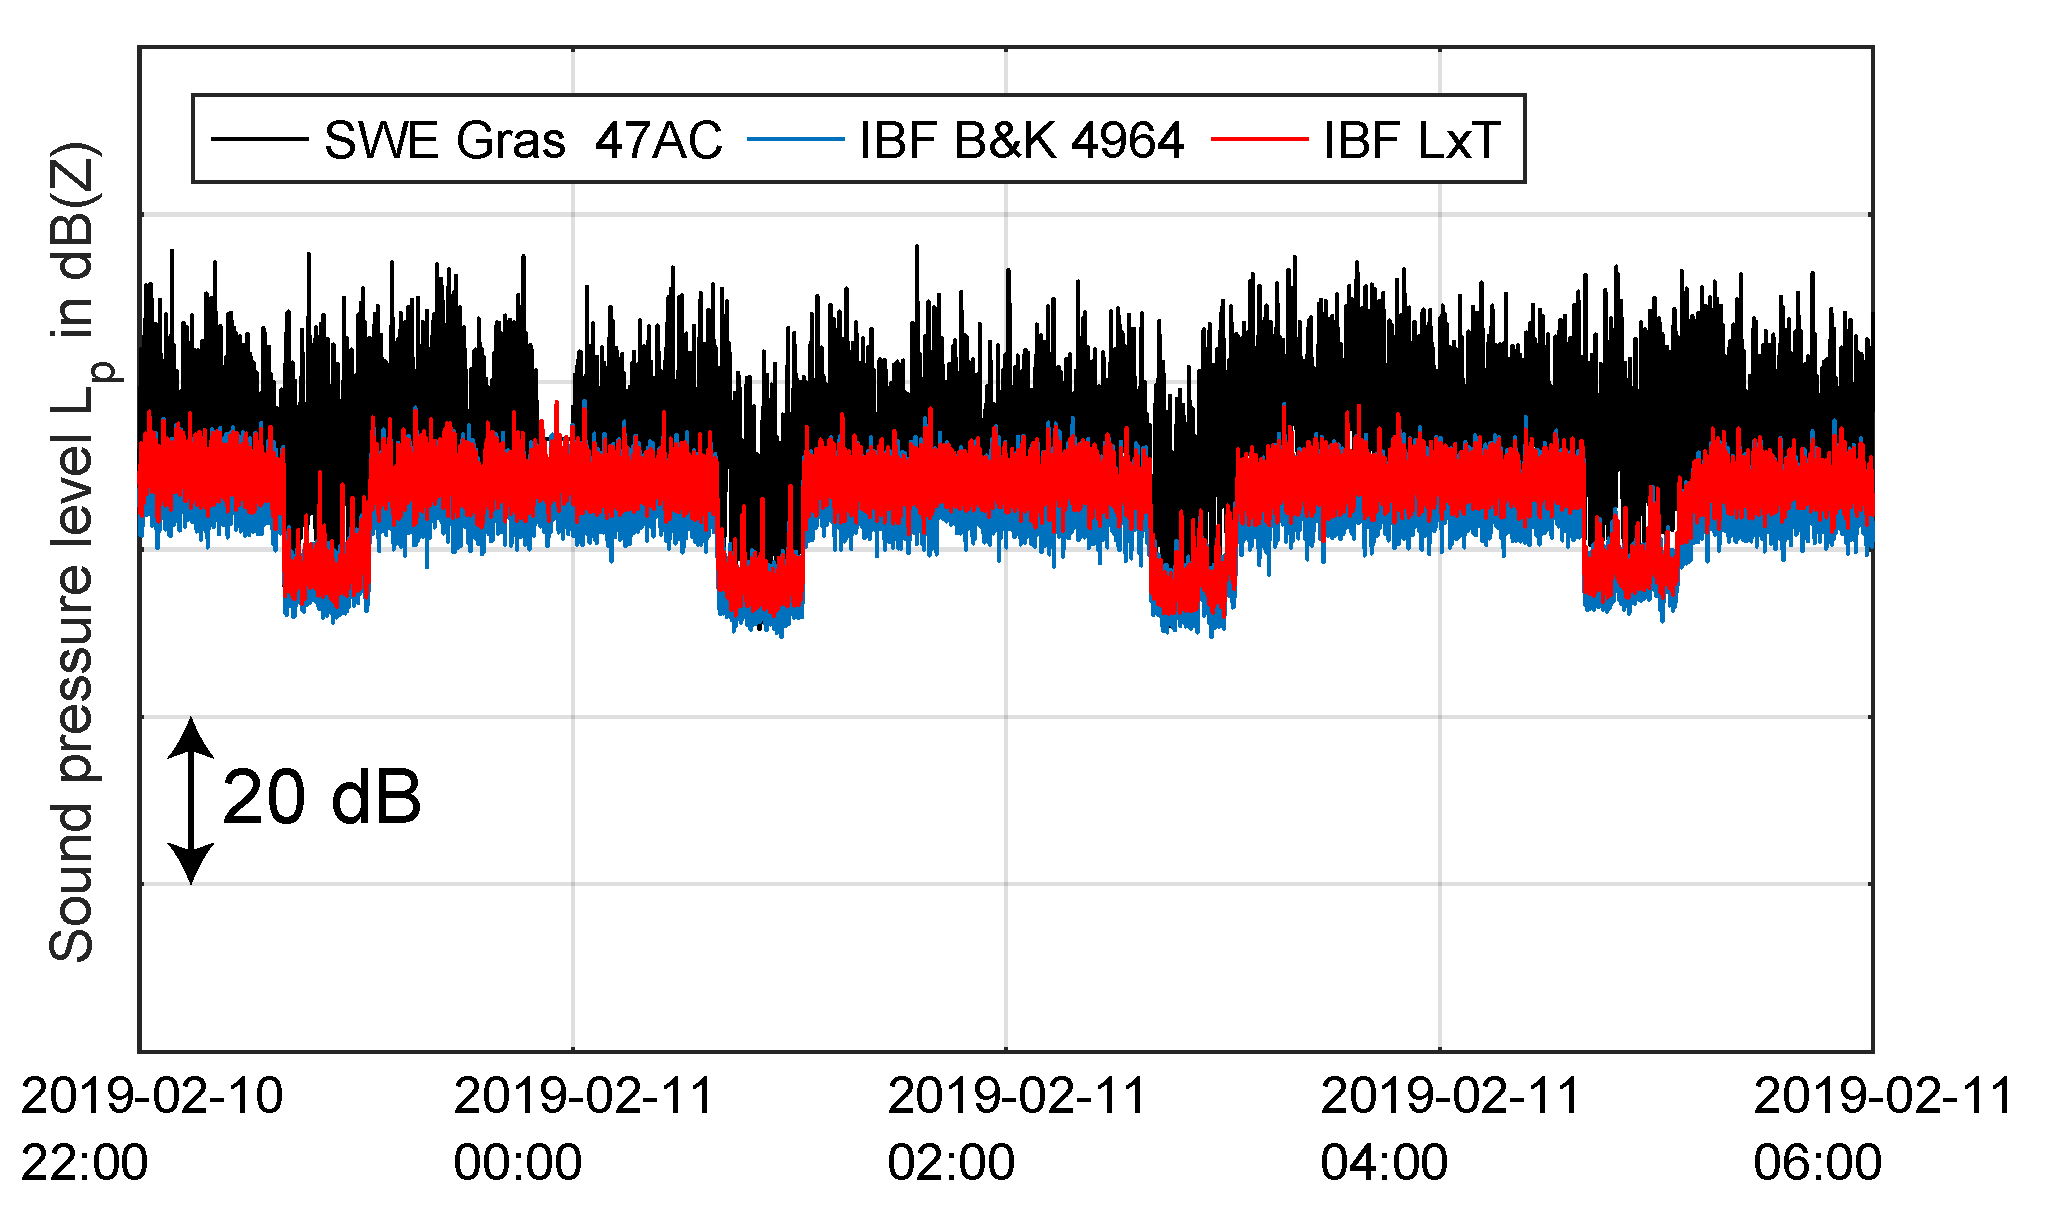
Both SWE and IBF time series data did not show a clear indication whether the wind turbine was operating or not. As noted in Section 2.1, the WT was stopped at 00:40, 02:40, 04:40, and 22:40 (UTC) every day during the presented time periods. In contrast with the p ( t ) time series, it was observed that the time series of the 10 s sound level pressure L p ( t ) (measured inside of the buildings with the Larson Davis SoundTrack LxT sound level meter) showed decreases of SPL during shutdown times. This could be confirmed, e.g., by Figure 12 and Figure 13, in which the red colored time series changes obviously for defined time periods. Based on bandpass filtered (5 Hz–100 Hz) p ( t ) values of SWE and IBF data from Figure 10 and Figure 11, the SPL was calculated using Equation (2) for both cases and also plotted in Figure 12 and Figure 13. This, on the one hand, offered the possibility to prove the plausibility of the IBF measurements with two independent measuring systems and, on the other hand, that shutdown times could be made visible. The SPL in the free field tended to be higher and more variable because of the enhanced influence from all kinds of surrounding acoustic noise sources. It is important to mention that the calculated SPL time series of SWE in Figure 12 shows unrealistic zero values of L p ( t ) due to electrical disturbances caused by automatic switching of the UPS system used, mentioned in Section 4.1.
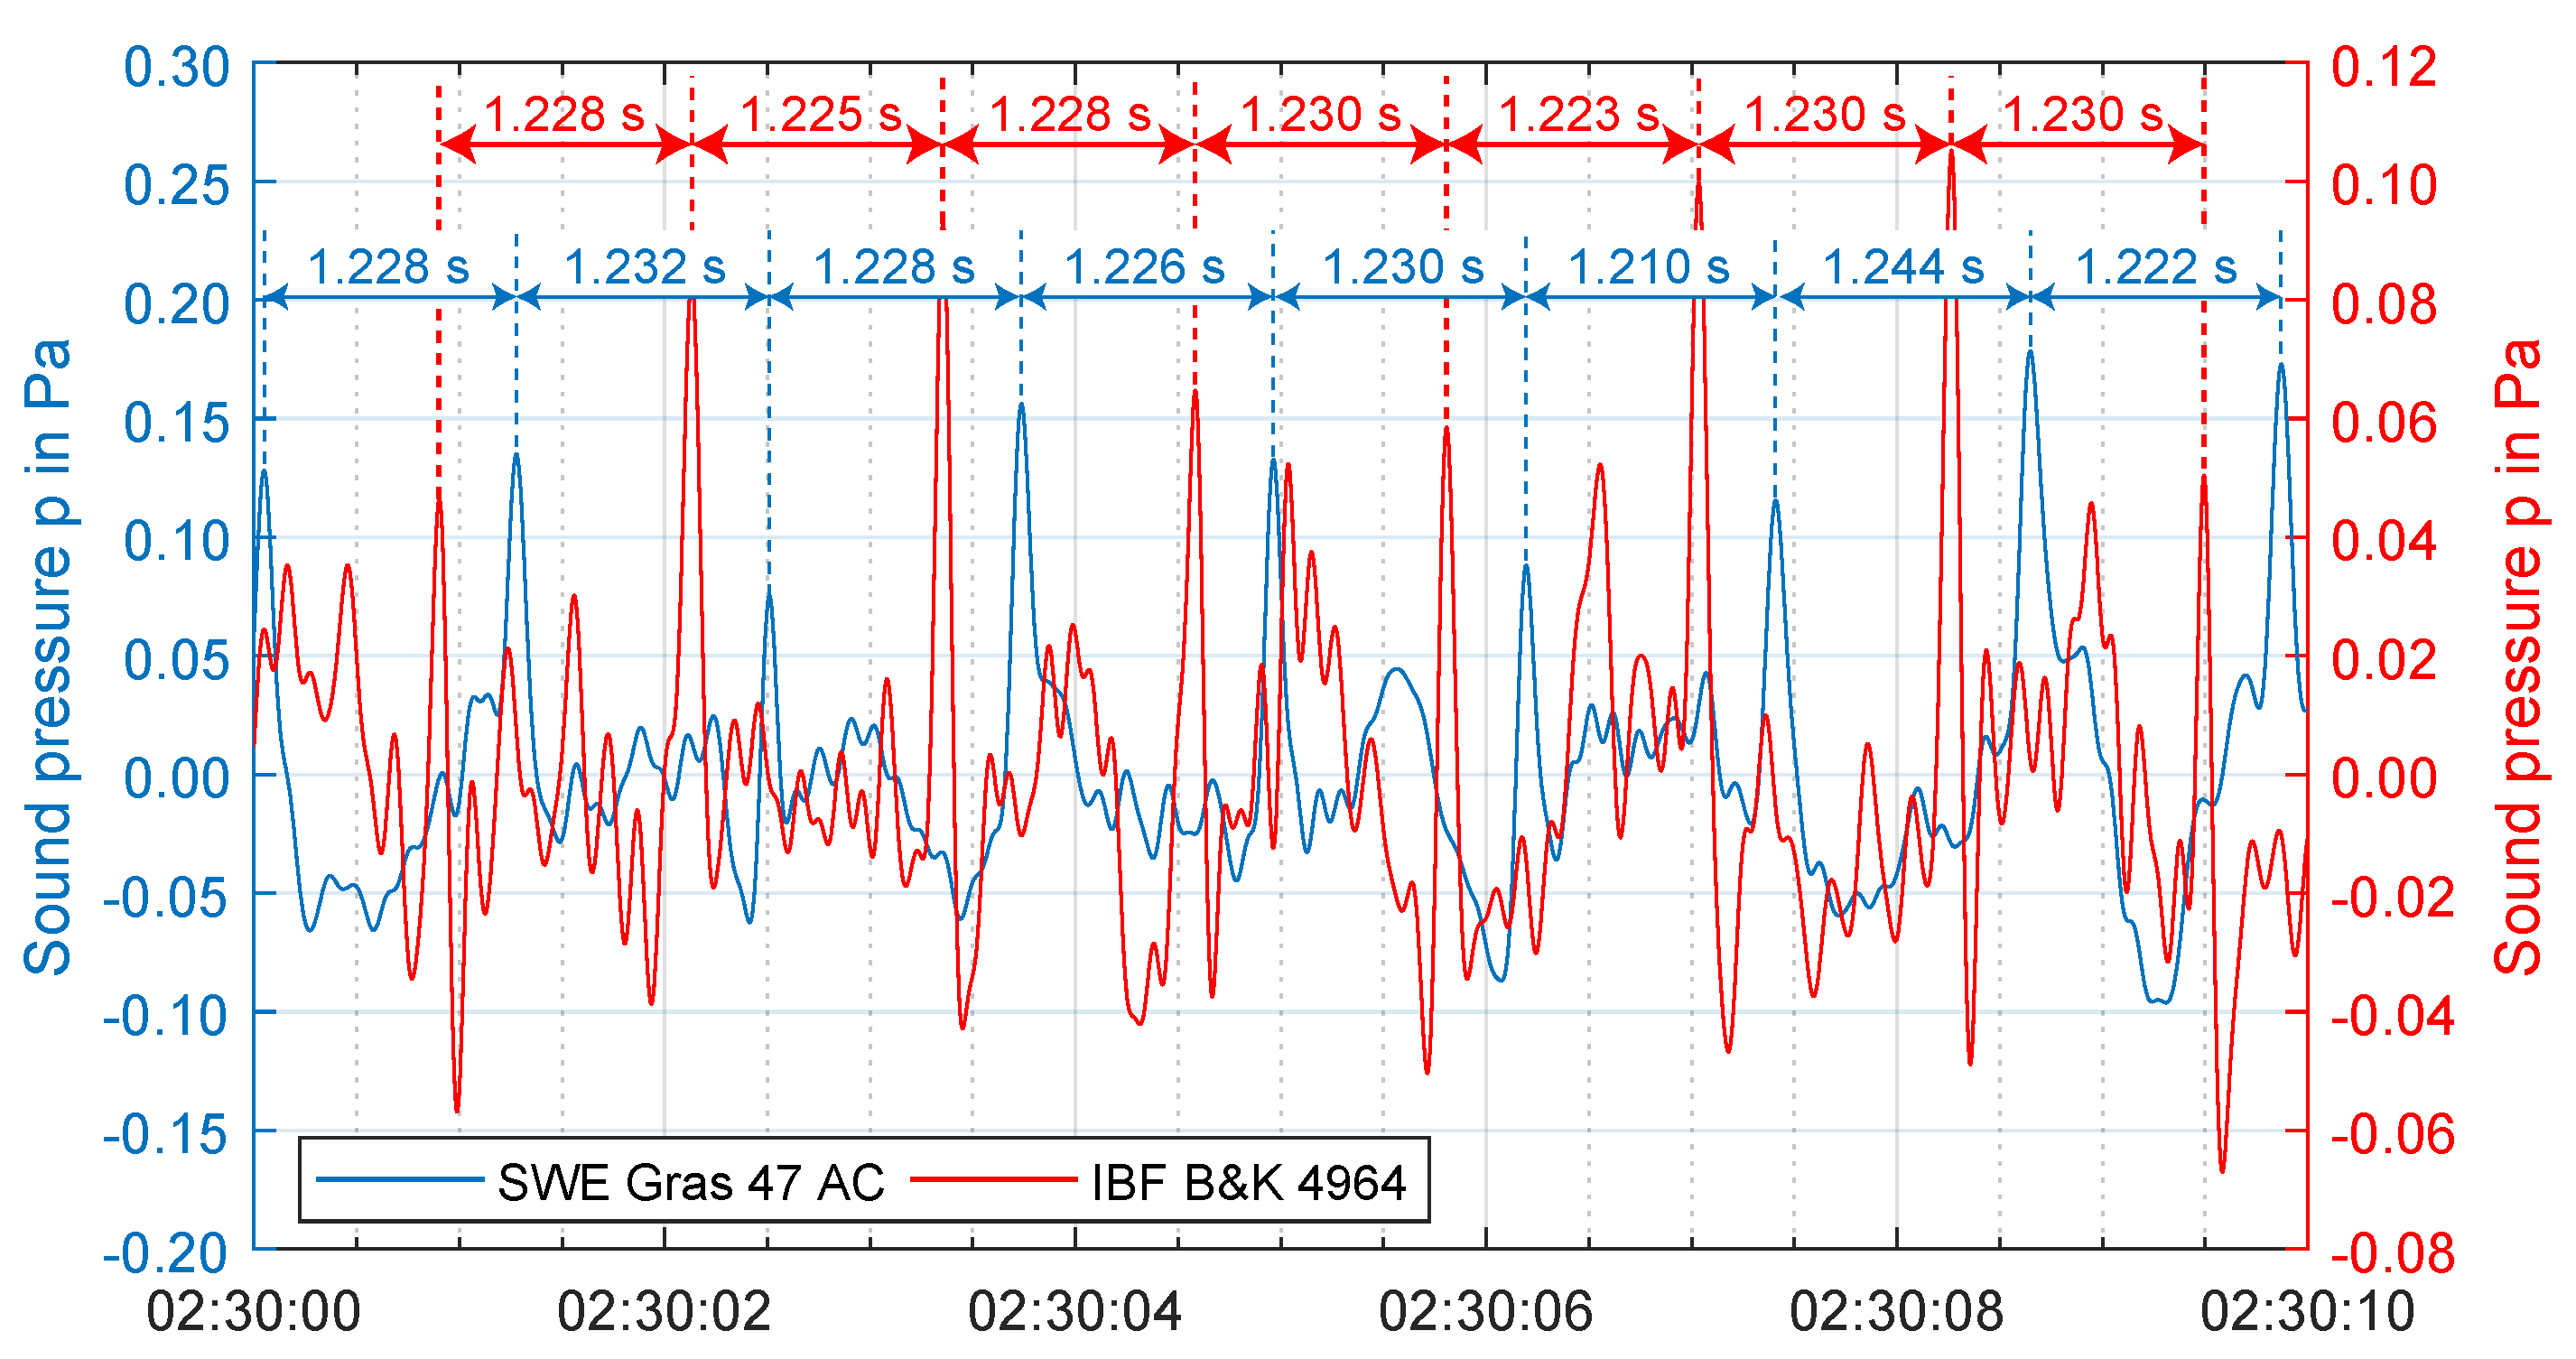
The impulsiveness of noise is often seen as critical because it favors the perceptibility of such acoustic emissions. In the case of WT noise, the passage of rotor blades in front of the tower caused this impulsive behavior, which can be seen in the time series of measured sound pressure data. As an example, sound pressure data of SWE and IBF for 10 February 2019 were bandpass filtered between 0.5 Hz and 10 Hz, and an arbitrary 10 s time sequence during the night (detailed view of Figure 10) was chosen for the plot in Figure 14. Each blade passage is clearly visible as a sharp peak of sound pressure in Figure 14 both for measured data of SWE, as well as IBF. In both cases, the time difference between preceding and following peaks was about Δ t 1.23 s , which resulted in a blade passing frequency of BPF = 1 / Δ t = 0.81 Hz , corresponding to a rotational speed of 16 rpm.

4.4. Time-Variant Spectral Representation

According to the approach described in Section 3, time variant PSD plots of measured acoustic signals at Site 1 and 2 are presented in Figure 15 and Figure 16 for a frequency range from 0.1 Hz to 140 Hz.
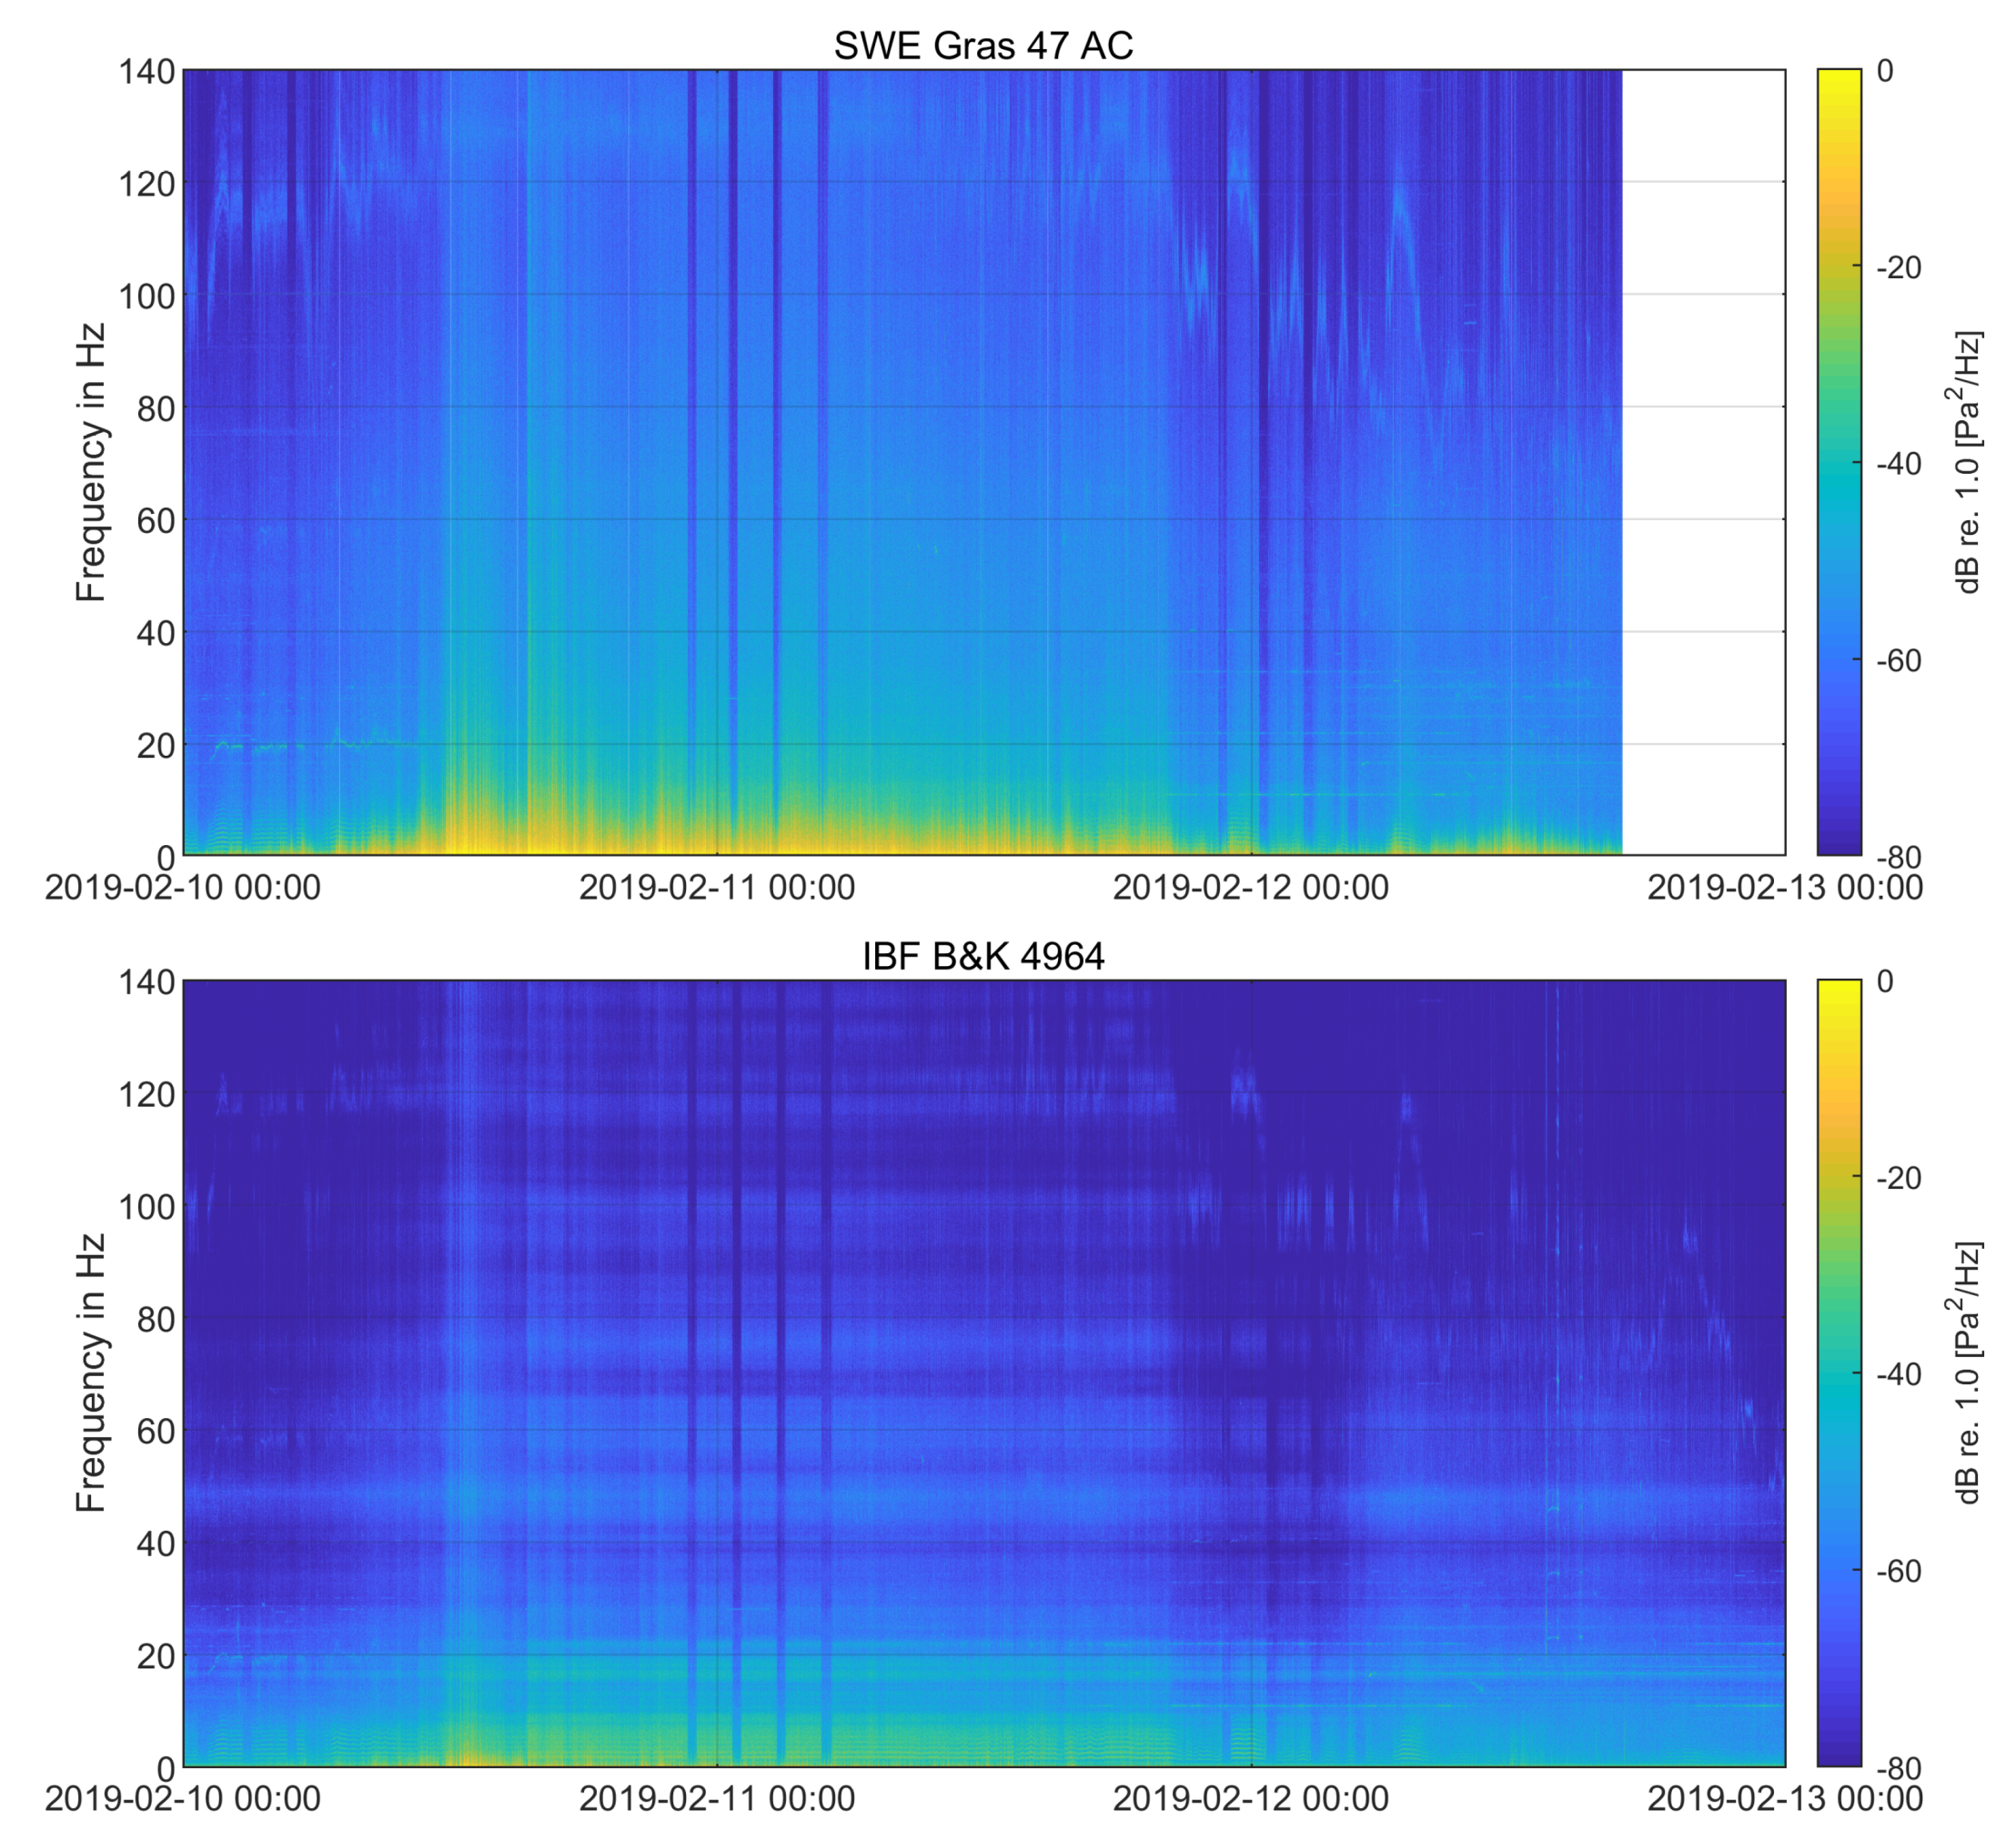
Detailed evaluation of Figure 15 yielded that shutdown periods of the WT were clearly recognizable both at place of emission (L2) and place of immission (L3) in contrast to the p-t diagrams in Figure 10. During WT shutdown, power spectral density was reduced over the full frequency range from about 0.5 Hz to 140 Hz, which is indicated through the color mapping. Of special interest for the determination of sources of low frequency acoustic noise produced by the WT were signal components that disappeared during shutdown. By regarding the first half of 10 February 2019 in Figure 15, several signal components can be observed below 10 Hz, with a varying frequency around 20 Hz and with a strongly varying frequency between 100 Hz (partly even lower) and 130 Hz, which disappeared instantly when the rotational speed of the WT dropped to zero (see Figure 8). The frequencies below 10 Hz (see Figure 17 for details) mainly occurred during a stable atmosphere and appeared to be directly correlated with the rotational speed of the wind turbine as multiples of the blade passing frequency (BPF). A more detailed discussion of these signal components is presented in Section 4.5.
Furthermore, it can be seen that the PSD intensity for the whole frequency range increased for higher wind speeds between 10 February 2019 12:00 (UTC) and 11 February 2019 21:00 (UTC). As the level decreased visibly during the shutdown times on the night of 11 February 2019, the broadband noise must be induced by the WT and was not induced by wind noise on the microphone level. This could be related to instable atmospheric conditions (see Figure 8) occurring during the considered period, which led to a higher turbulent inflow of the rotor blades. Due to [22], “in-flow turbulent sound” contributed to a broadband noise over a wide frequency range, which was less dominant during a stable atmosphere. Similar observations were made by [25], who correlated turbulent inflow noise to turbulence intensity and proved it to be no wind induced background noise.
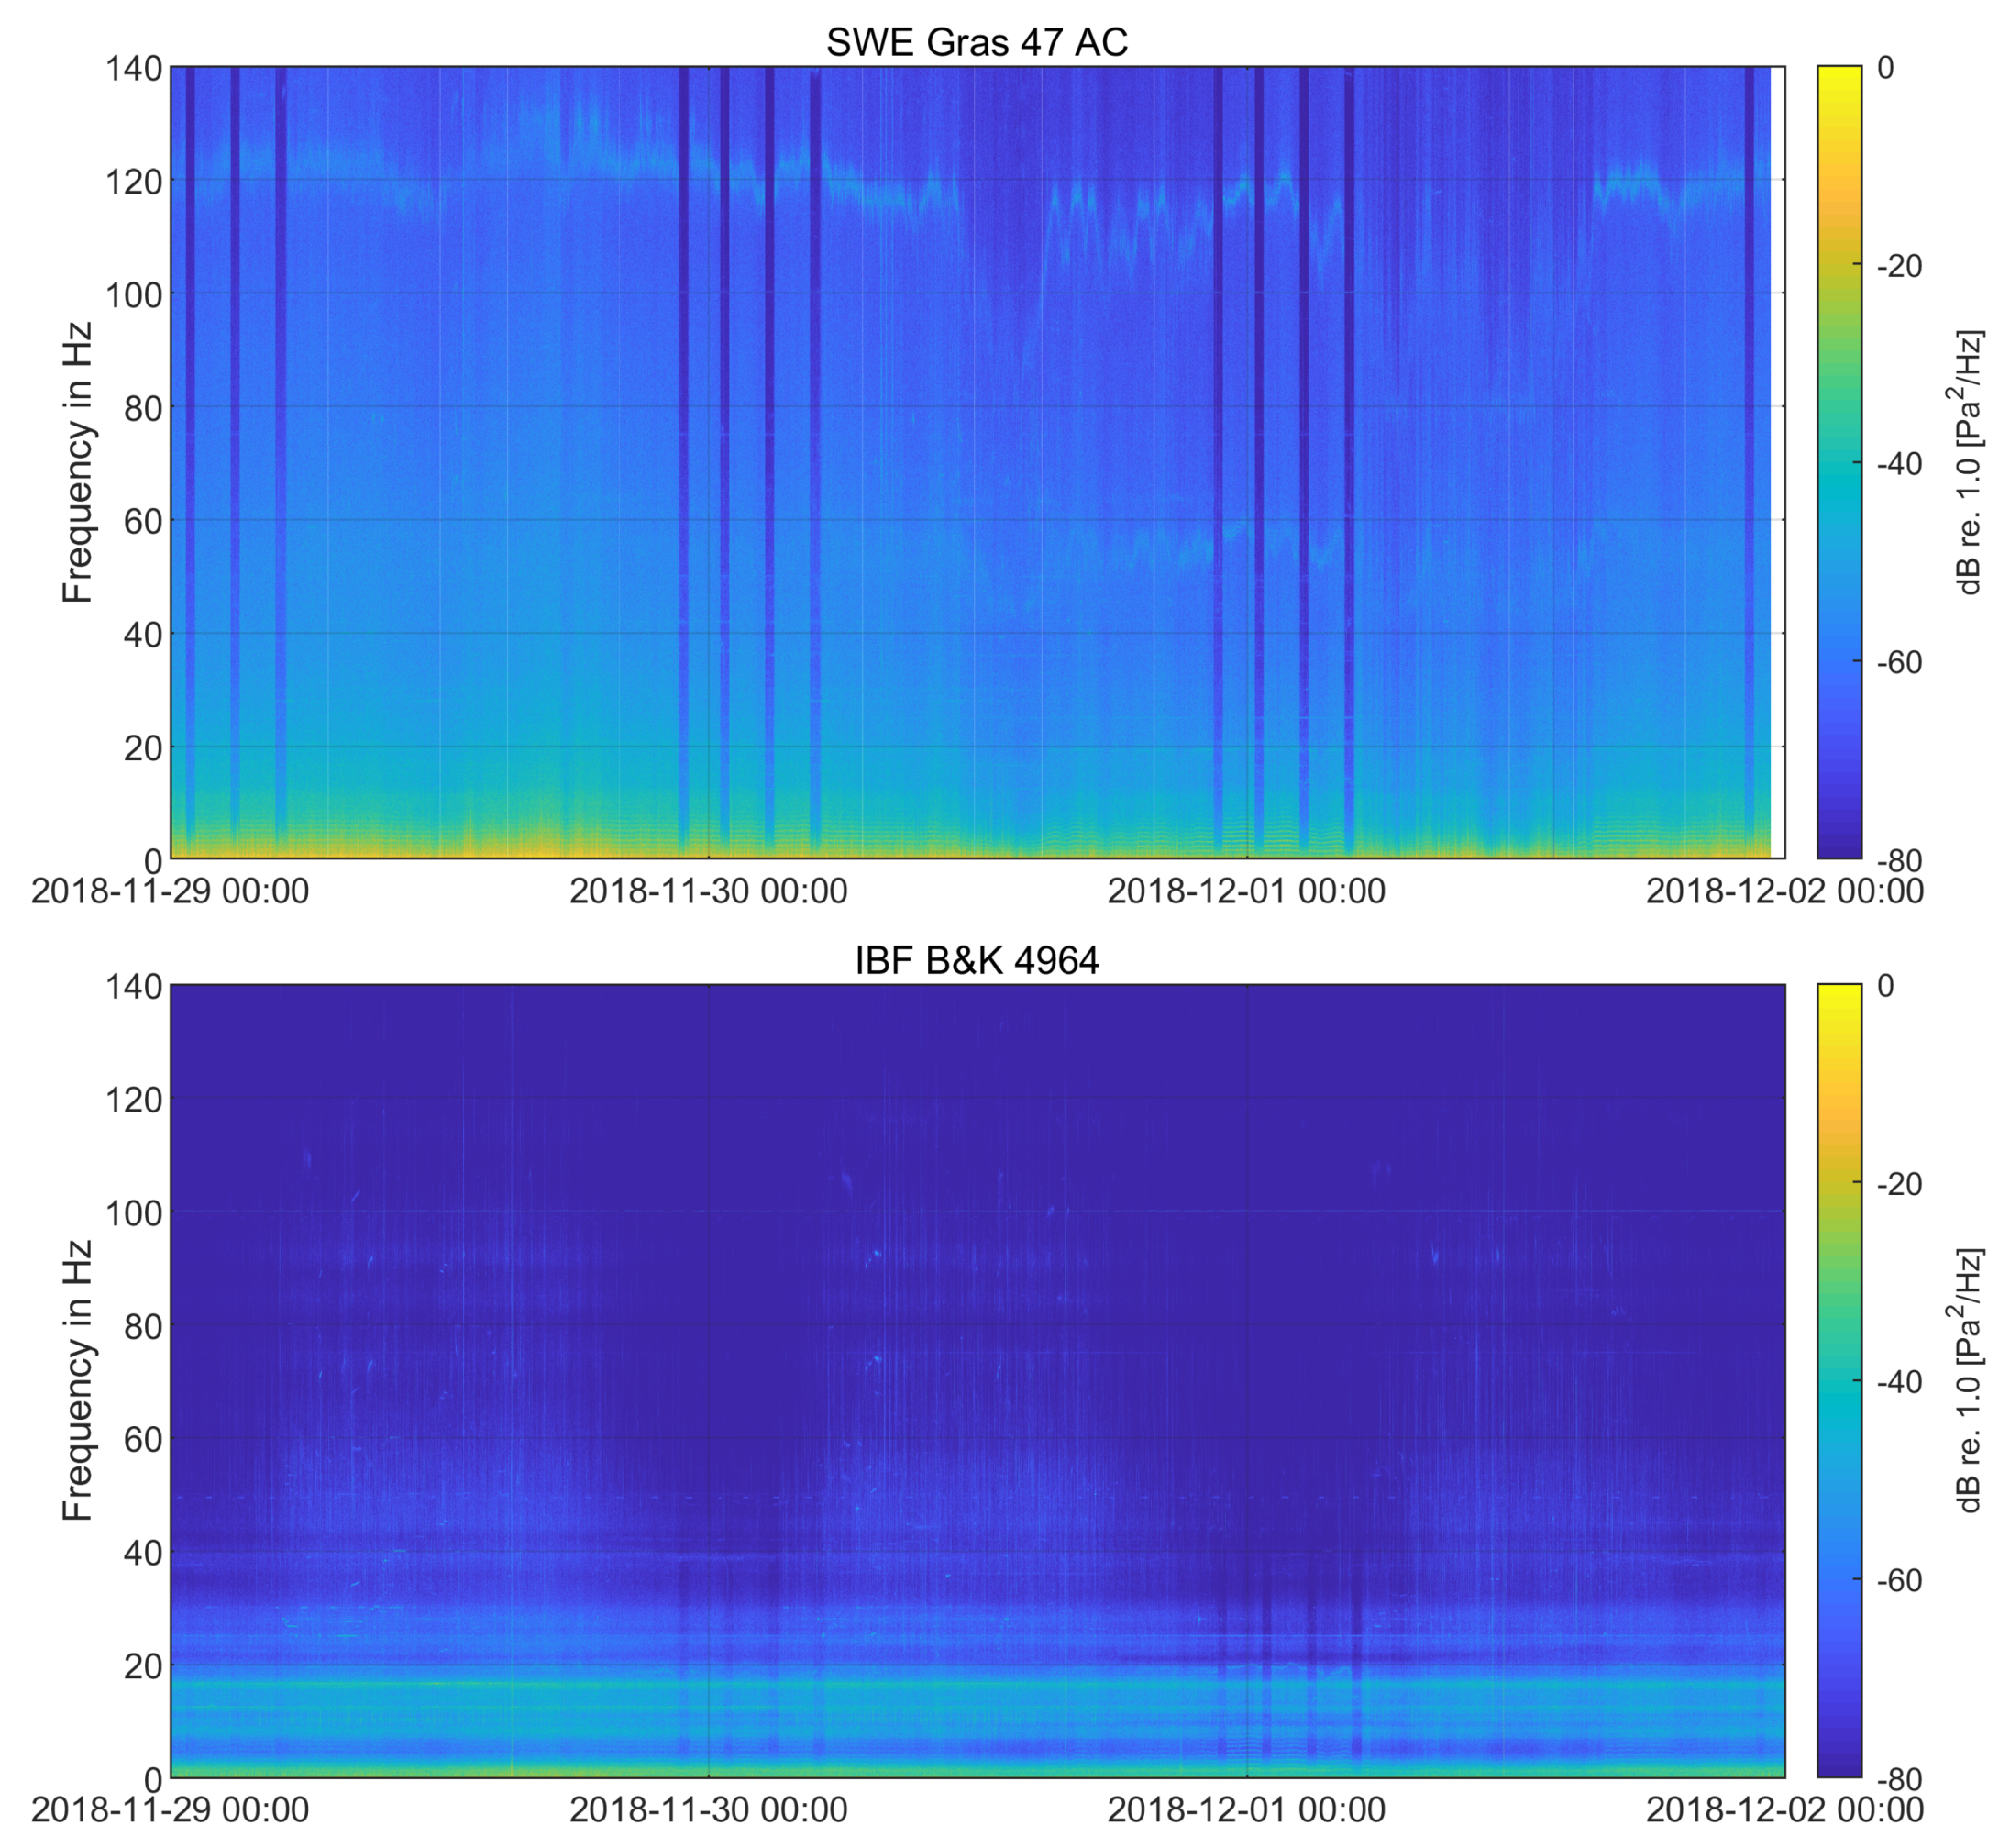
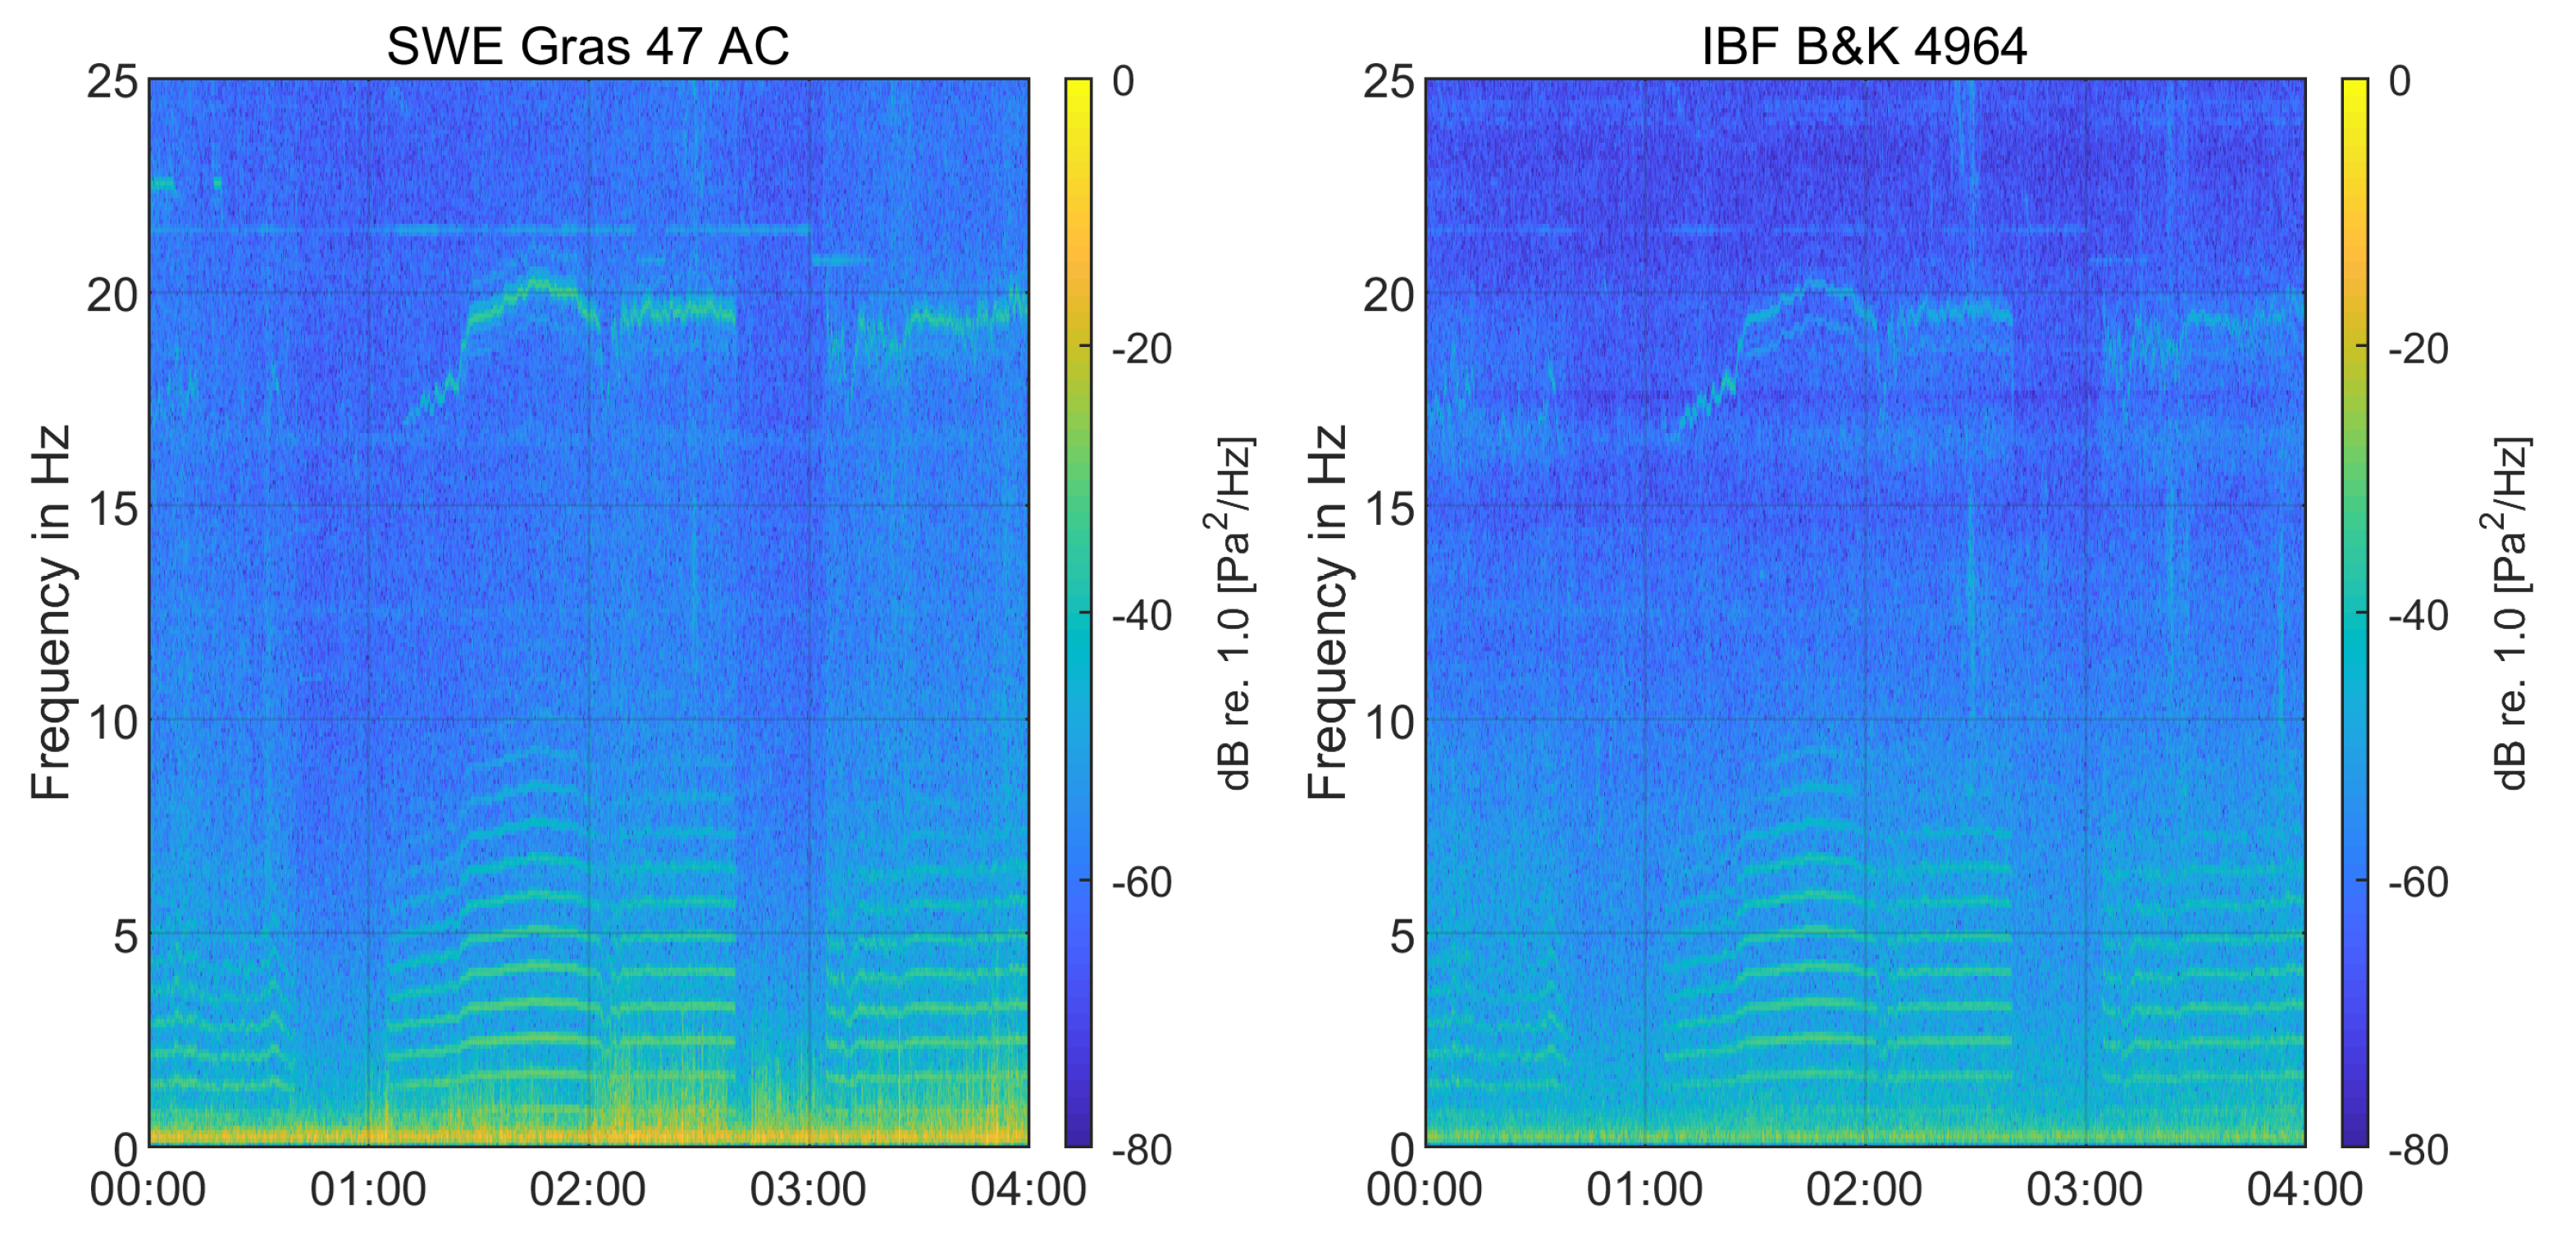
Figure 16 shows the spectrogram of acoustic data from Site 2 in northern Germany with nine wind turbines. Shutdown times of the wind farm are very clearly visible over the whole three day time period for the SWE measurements outside, and the intensity reduction was significant. Signal components below 10 Hz, around 20 Hz, 55 Hz, and 120 Hz had the highest intensities in the spectrogram, for example on 30 November 2019 at 00:00 (UTC) and 2018/12/01 at 00:00 (UTC). Inside of a building at location L6, shutdown times were only visible for frequencies below 40 Hz, and only several signal components below 10 Hz could be related to the wind farm. Other signals with frequencies of 12.8 Hz and 17.0 Hz were continuous and unaffected by WT operation.

4.5. Comparison of Sound Pressure Levels

For further analysis in the frequency range from 0.6 Hz to 120 Hz, spectra for selected 10 min periods were calculated according to Section 3 for measurements on Site 1 in February 2019. Figure 18 and Figure 19 show the comparison between rotating (on) and still (off) WT for different atmospheric conditions, classified according to Table 4. On periods where matched to off periods with mostly similar conditions concerning shear exponent m, rotational number, nacelle position, and wind speed at a 10 m height. Detailed information for each time period is given in Table 5.
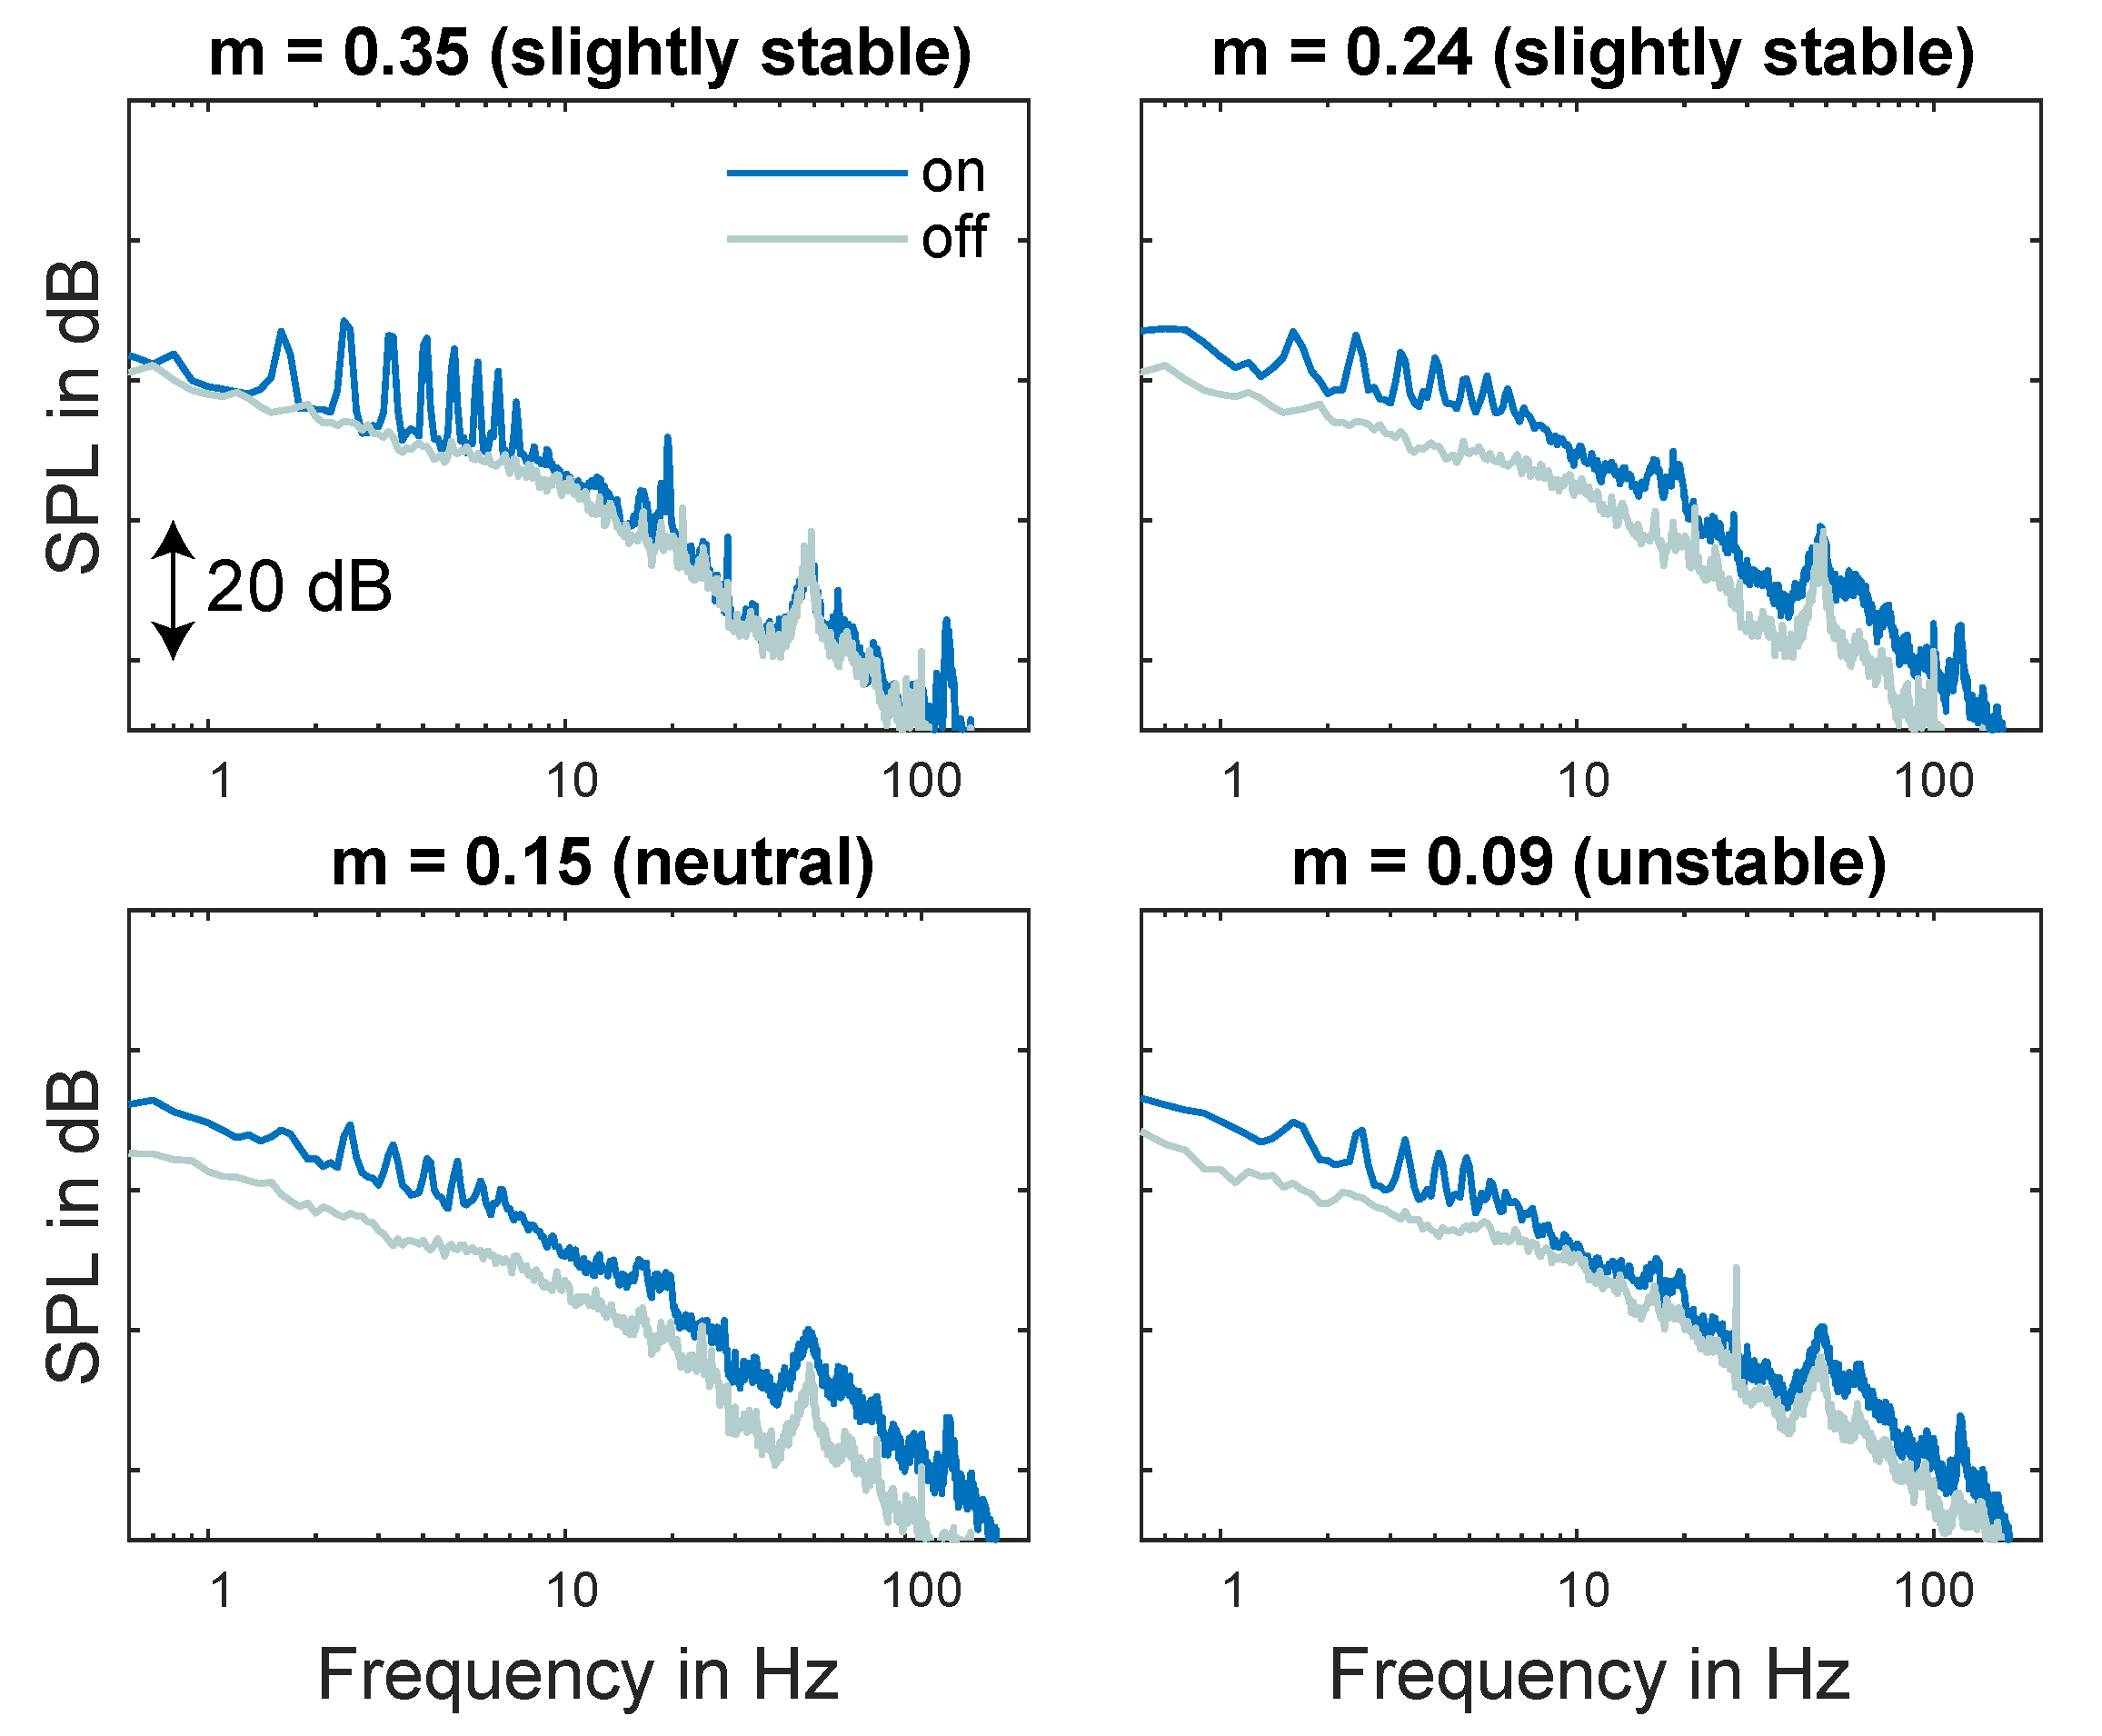
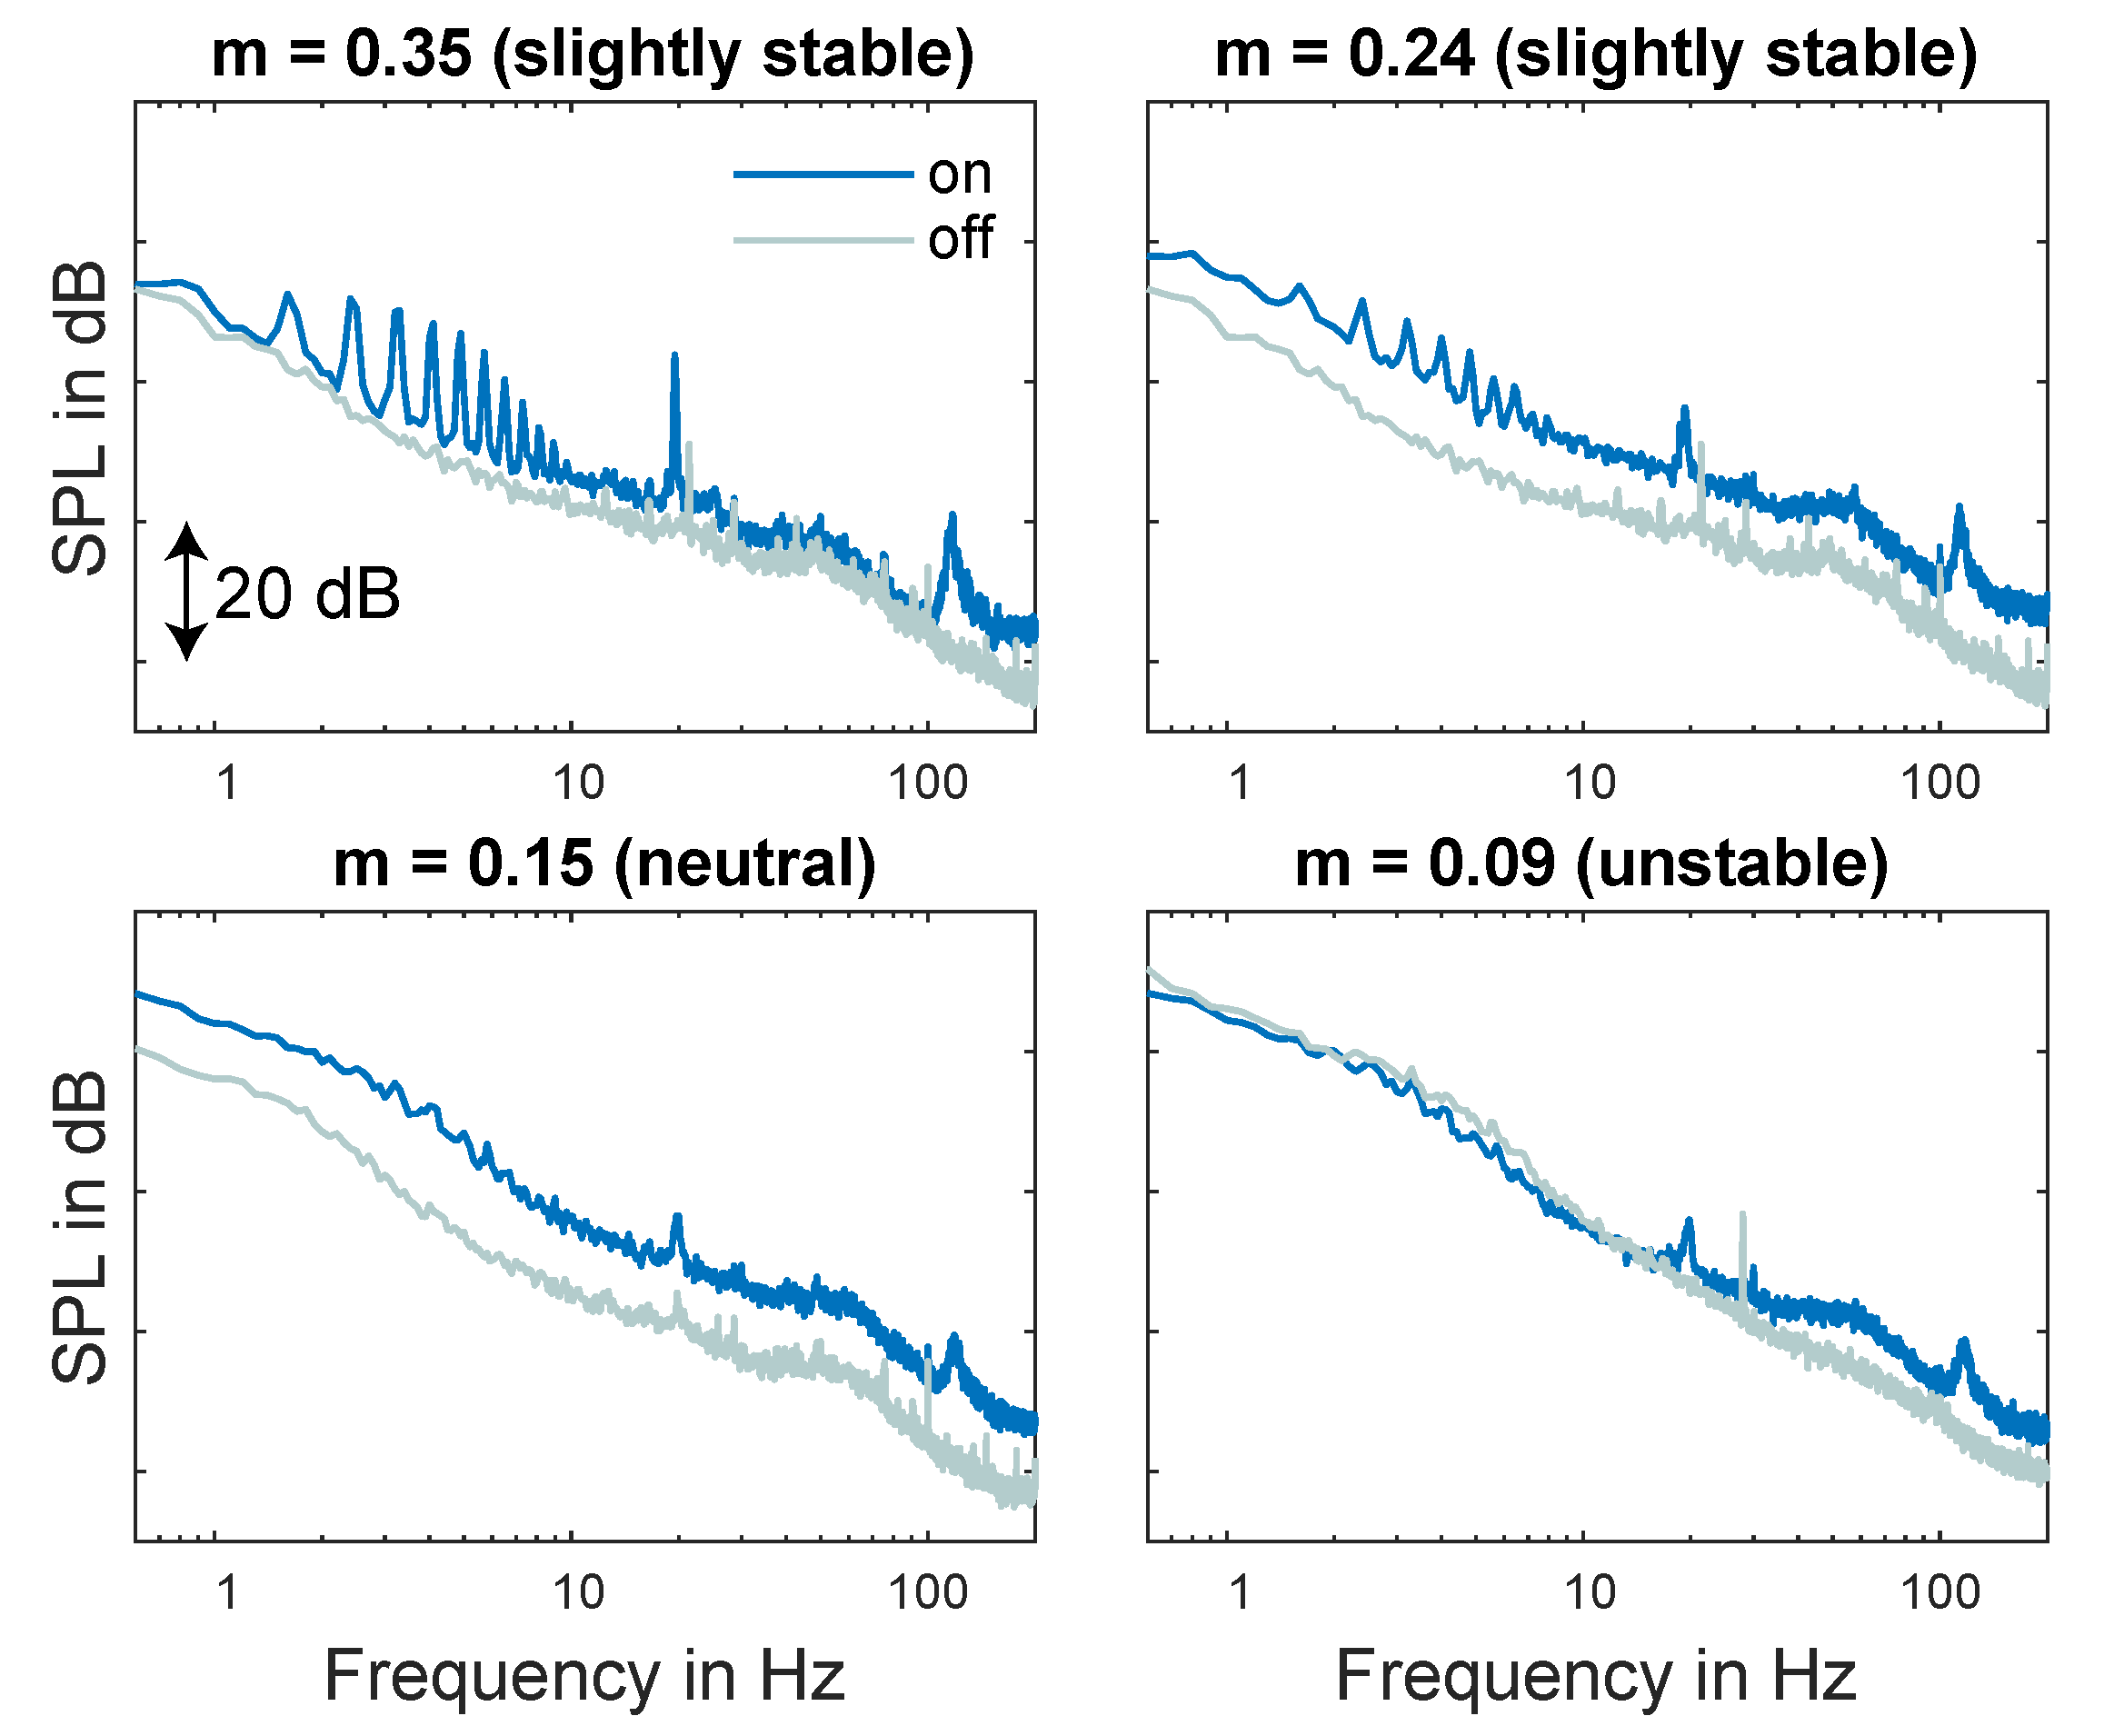
The main difference of the on/off spectra were tones below 10 Hz, around 20 Hz, and 120 Hz, which were identified in Section 4.4 and Figure 15. The outside spectra showed that during stable conditions, the BPF tones at 0.8 Hz and higher harmonics up to 10 Hz were the most dominant; whereas tones at 19 Hz and 117 Hz were also present for neutral and instable conditions. It was also visible that with decreasing shear exponent m < 0.2 to instable atmospheric conditions, the SPL of both background noise and WT noise was increasing. This resulted in a masking of BPF peaks below 10 Hz. The same frequencies could be identified inside at measurement location L3 (Figure 19). The tones of the BPF were dominant with the stable condition, but in contrast to the outside spectra, still visible during the neutral and instable condition. A peak at 16.6 Hz may be a room mode, whereas the tone around 48 Hz, which was dominant during rotating, but also still WT was related to electric noise (probably a three phase asynchronous machine).
By comparing inside with outside measurements, a rough assumption of the decrease in SPL over distance was possible. Here, it must be taken into account that measurement locations L2 and L3 were located in opposite directions related to the WT, and the attenuation over distance was just an indication. 
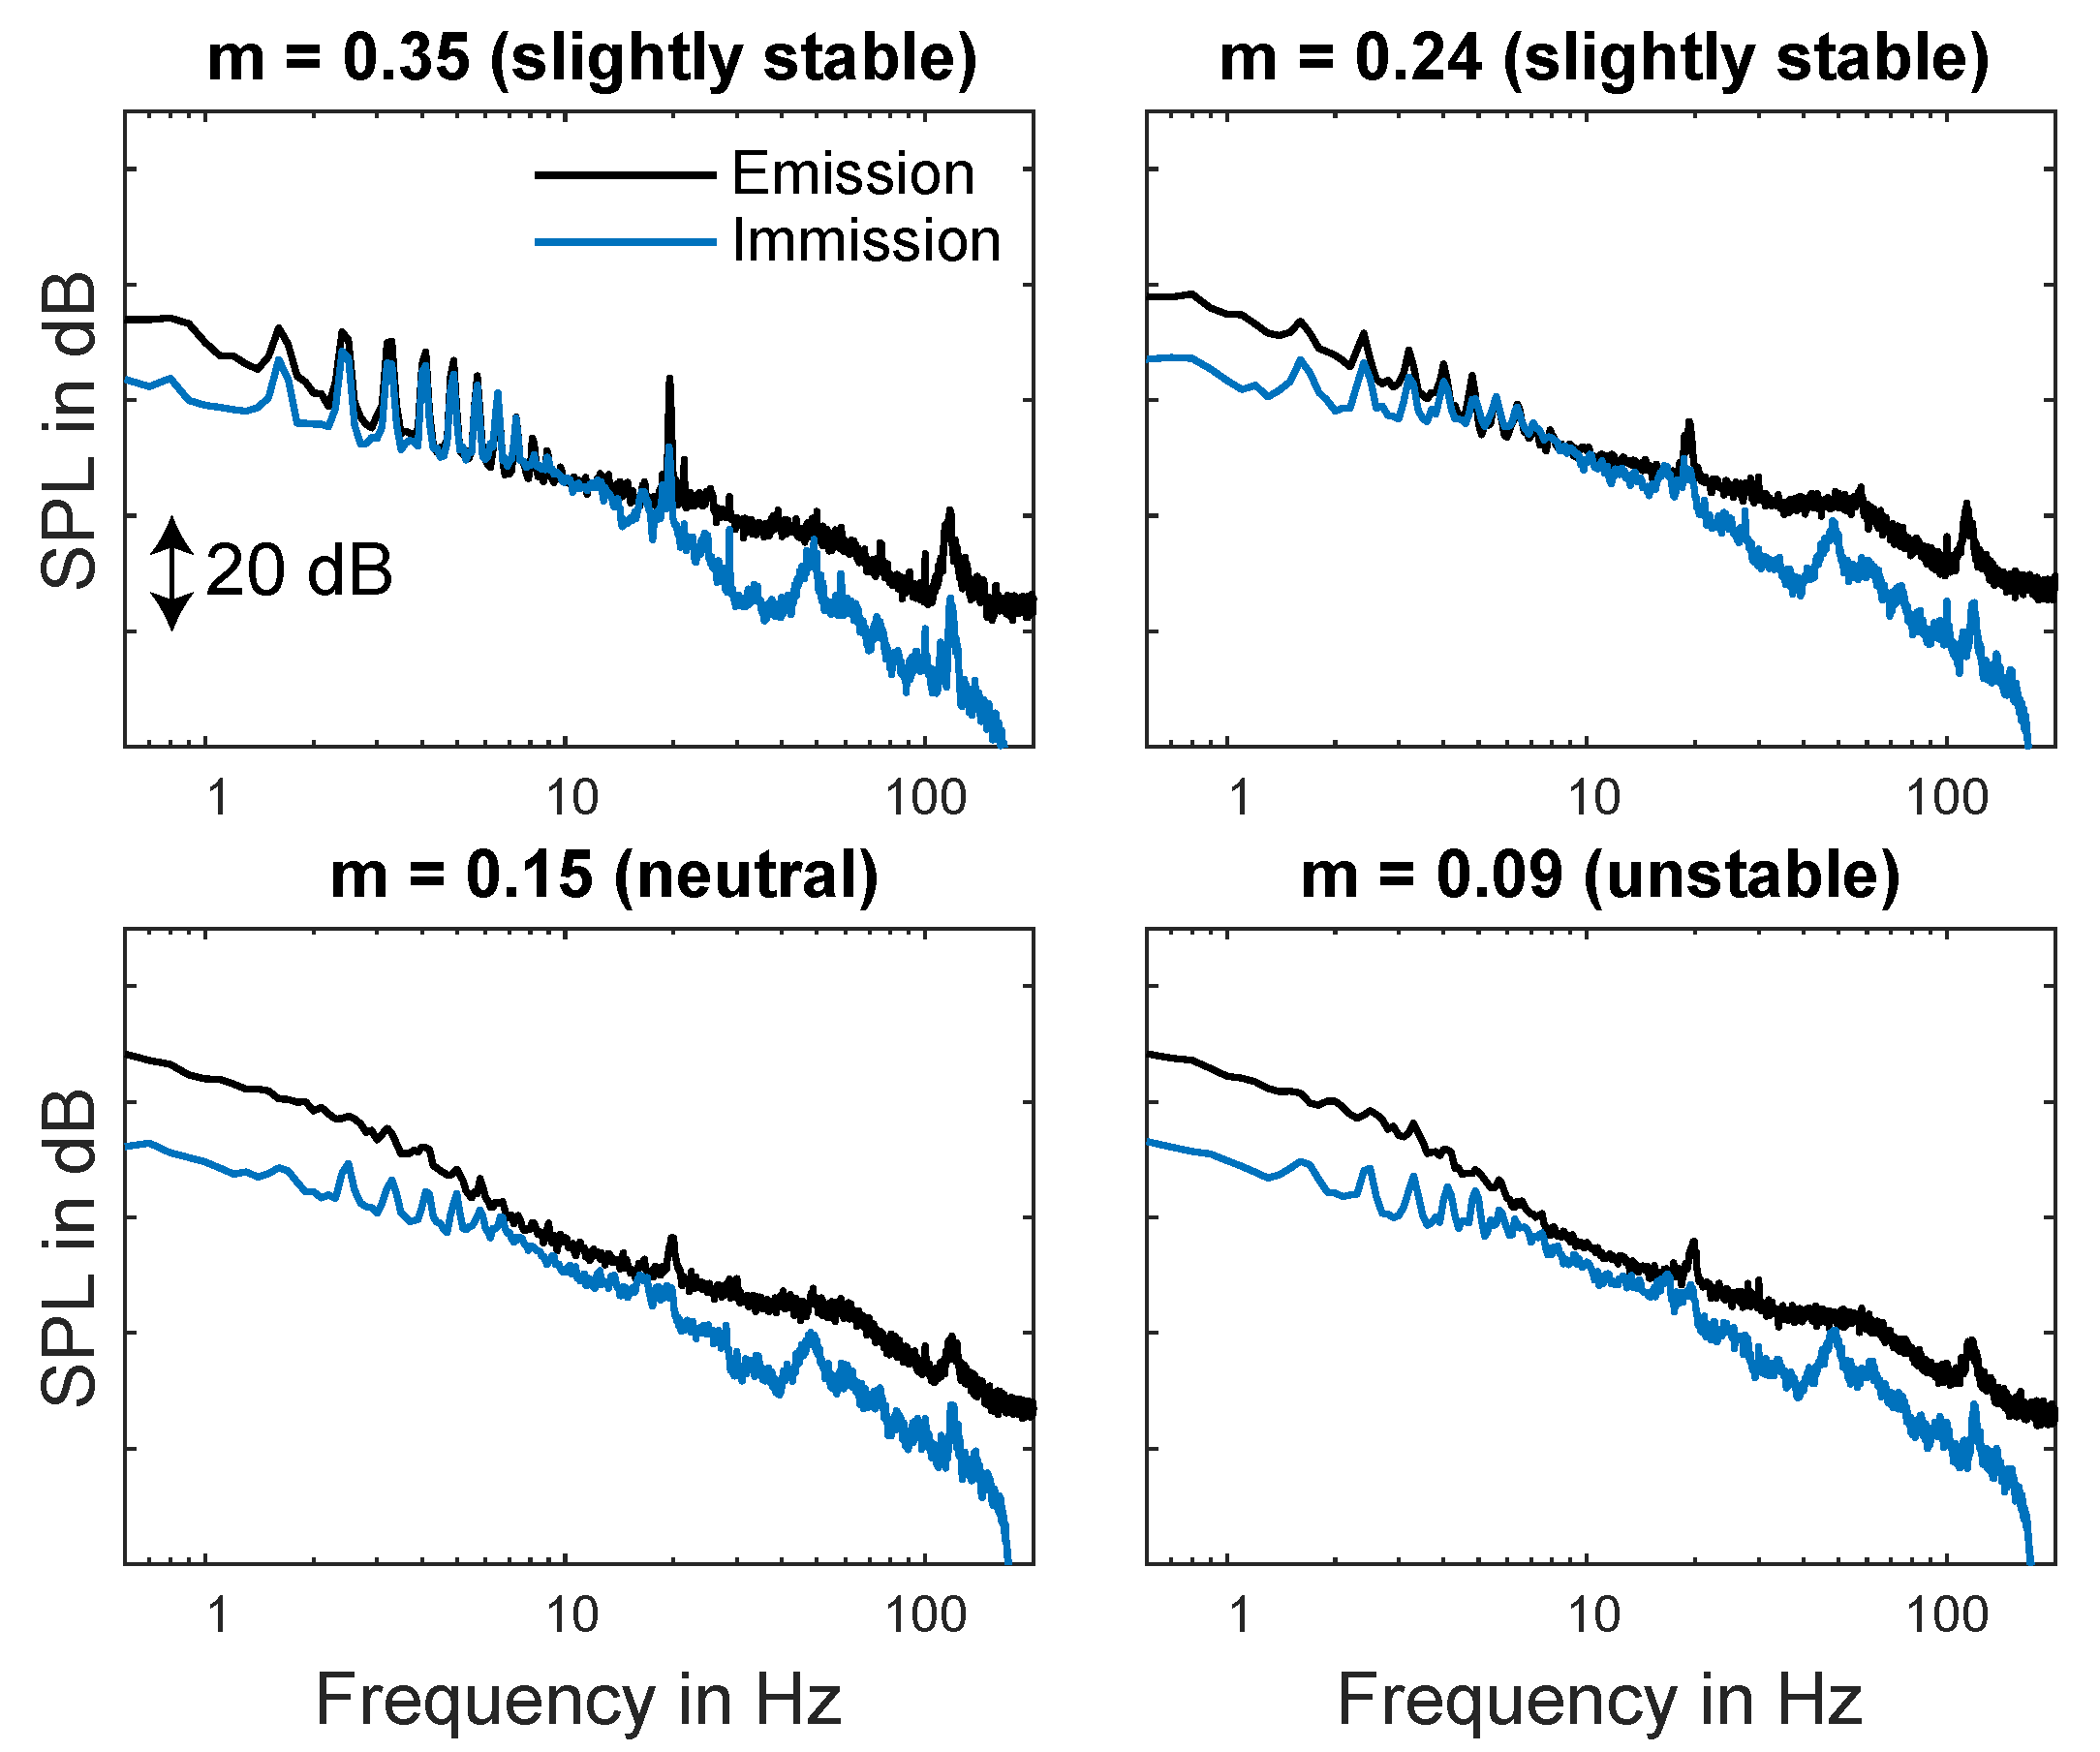
Figure 20 shows frequency spectra from Figure 18 and Figure 19 for different atmospheric conditions. Below 10 Hz, there was a maximum decrease in SPL from outside to inside of 5 dB at 0.8 Hz during stable conditions. For less stable conditions, the SPL difference between inside and outside increased due to increasing wind noise. It was also visible that BPF tones were more dominant inside during unstable conditions, since there was no masking by background noise. Furthermore, all four plots of Figure 20 showed that there was no attenuation over distance for a frequency around 6 Hz. Besides a low air absorption in the low frequency range, there seemed to be no sound insulation by the facade. This was confirmed by [4], who showed that due to the mass law, the outside-to-inside reduction of the facade had its minimum around 10 Hz.
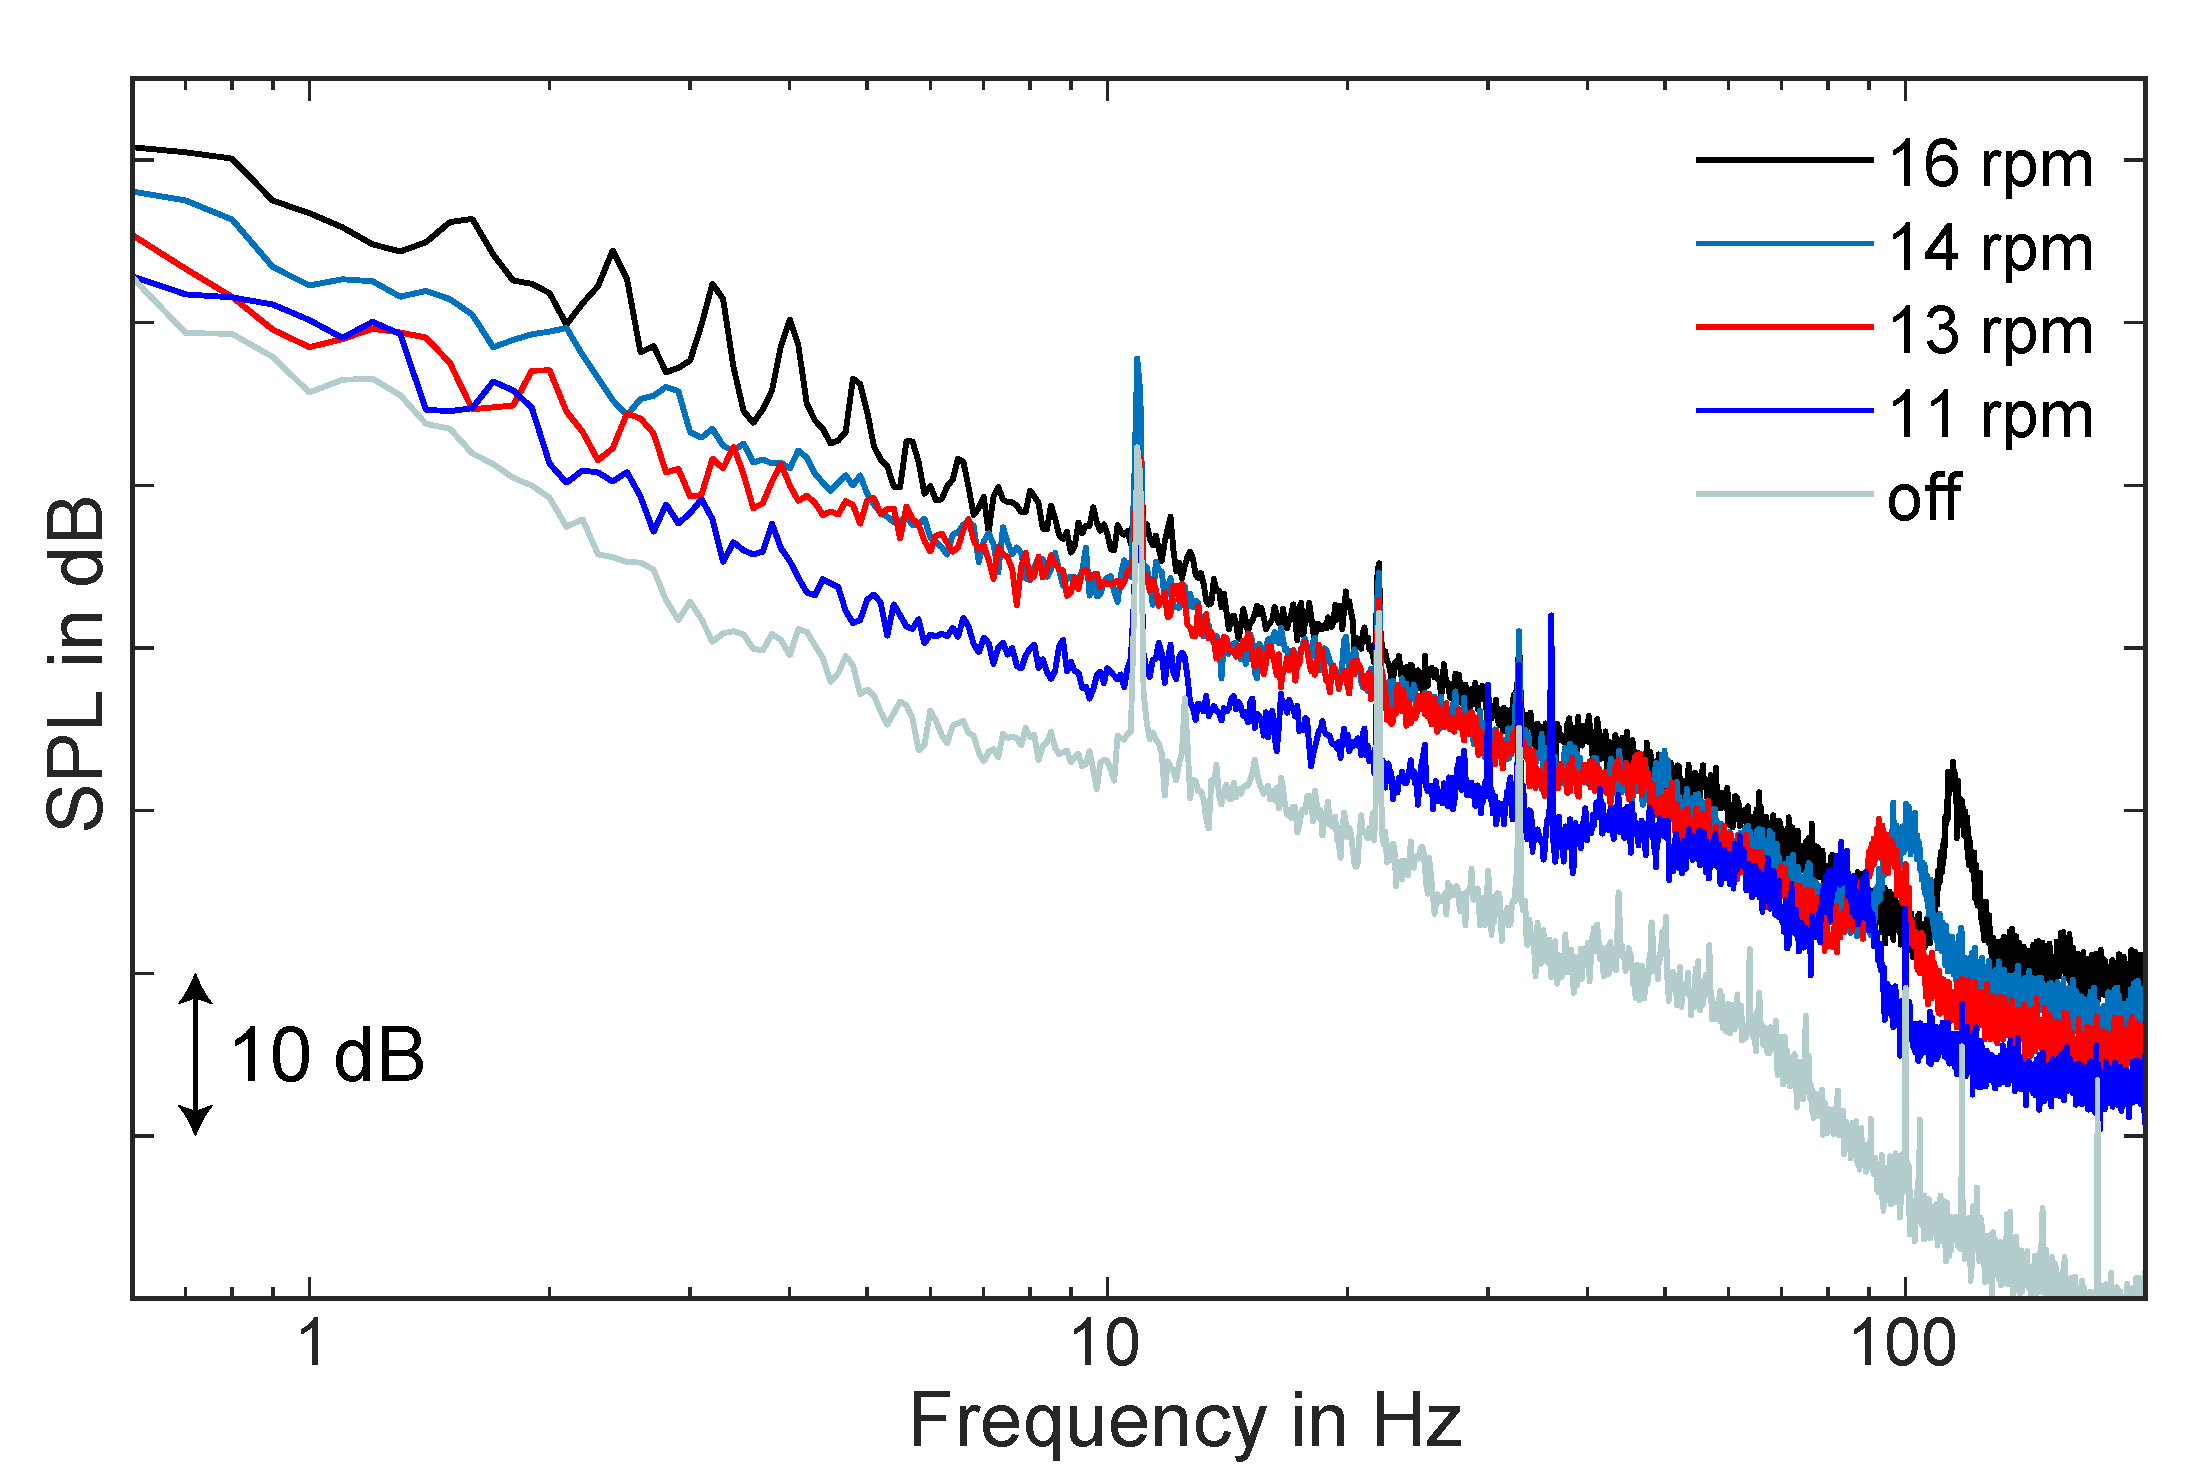
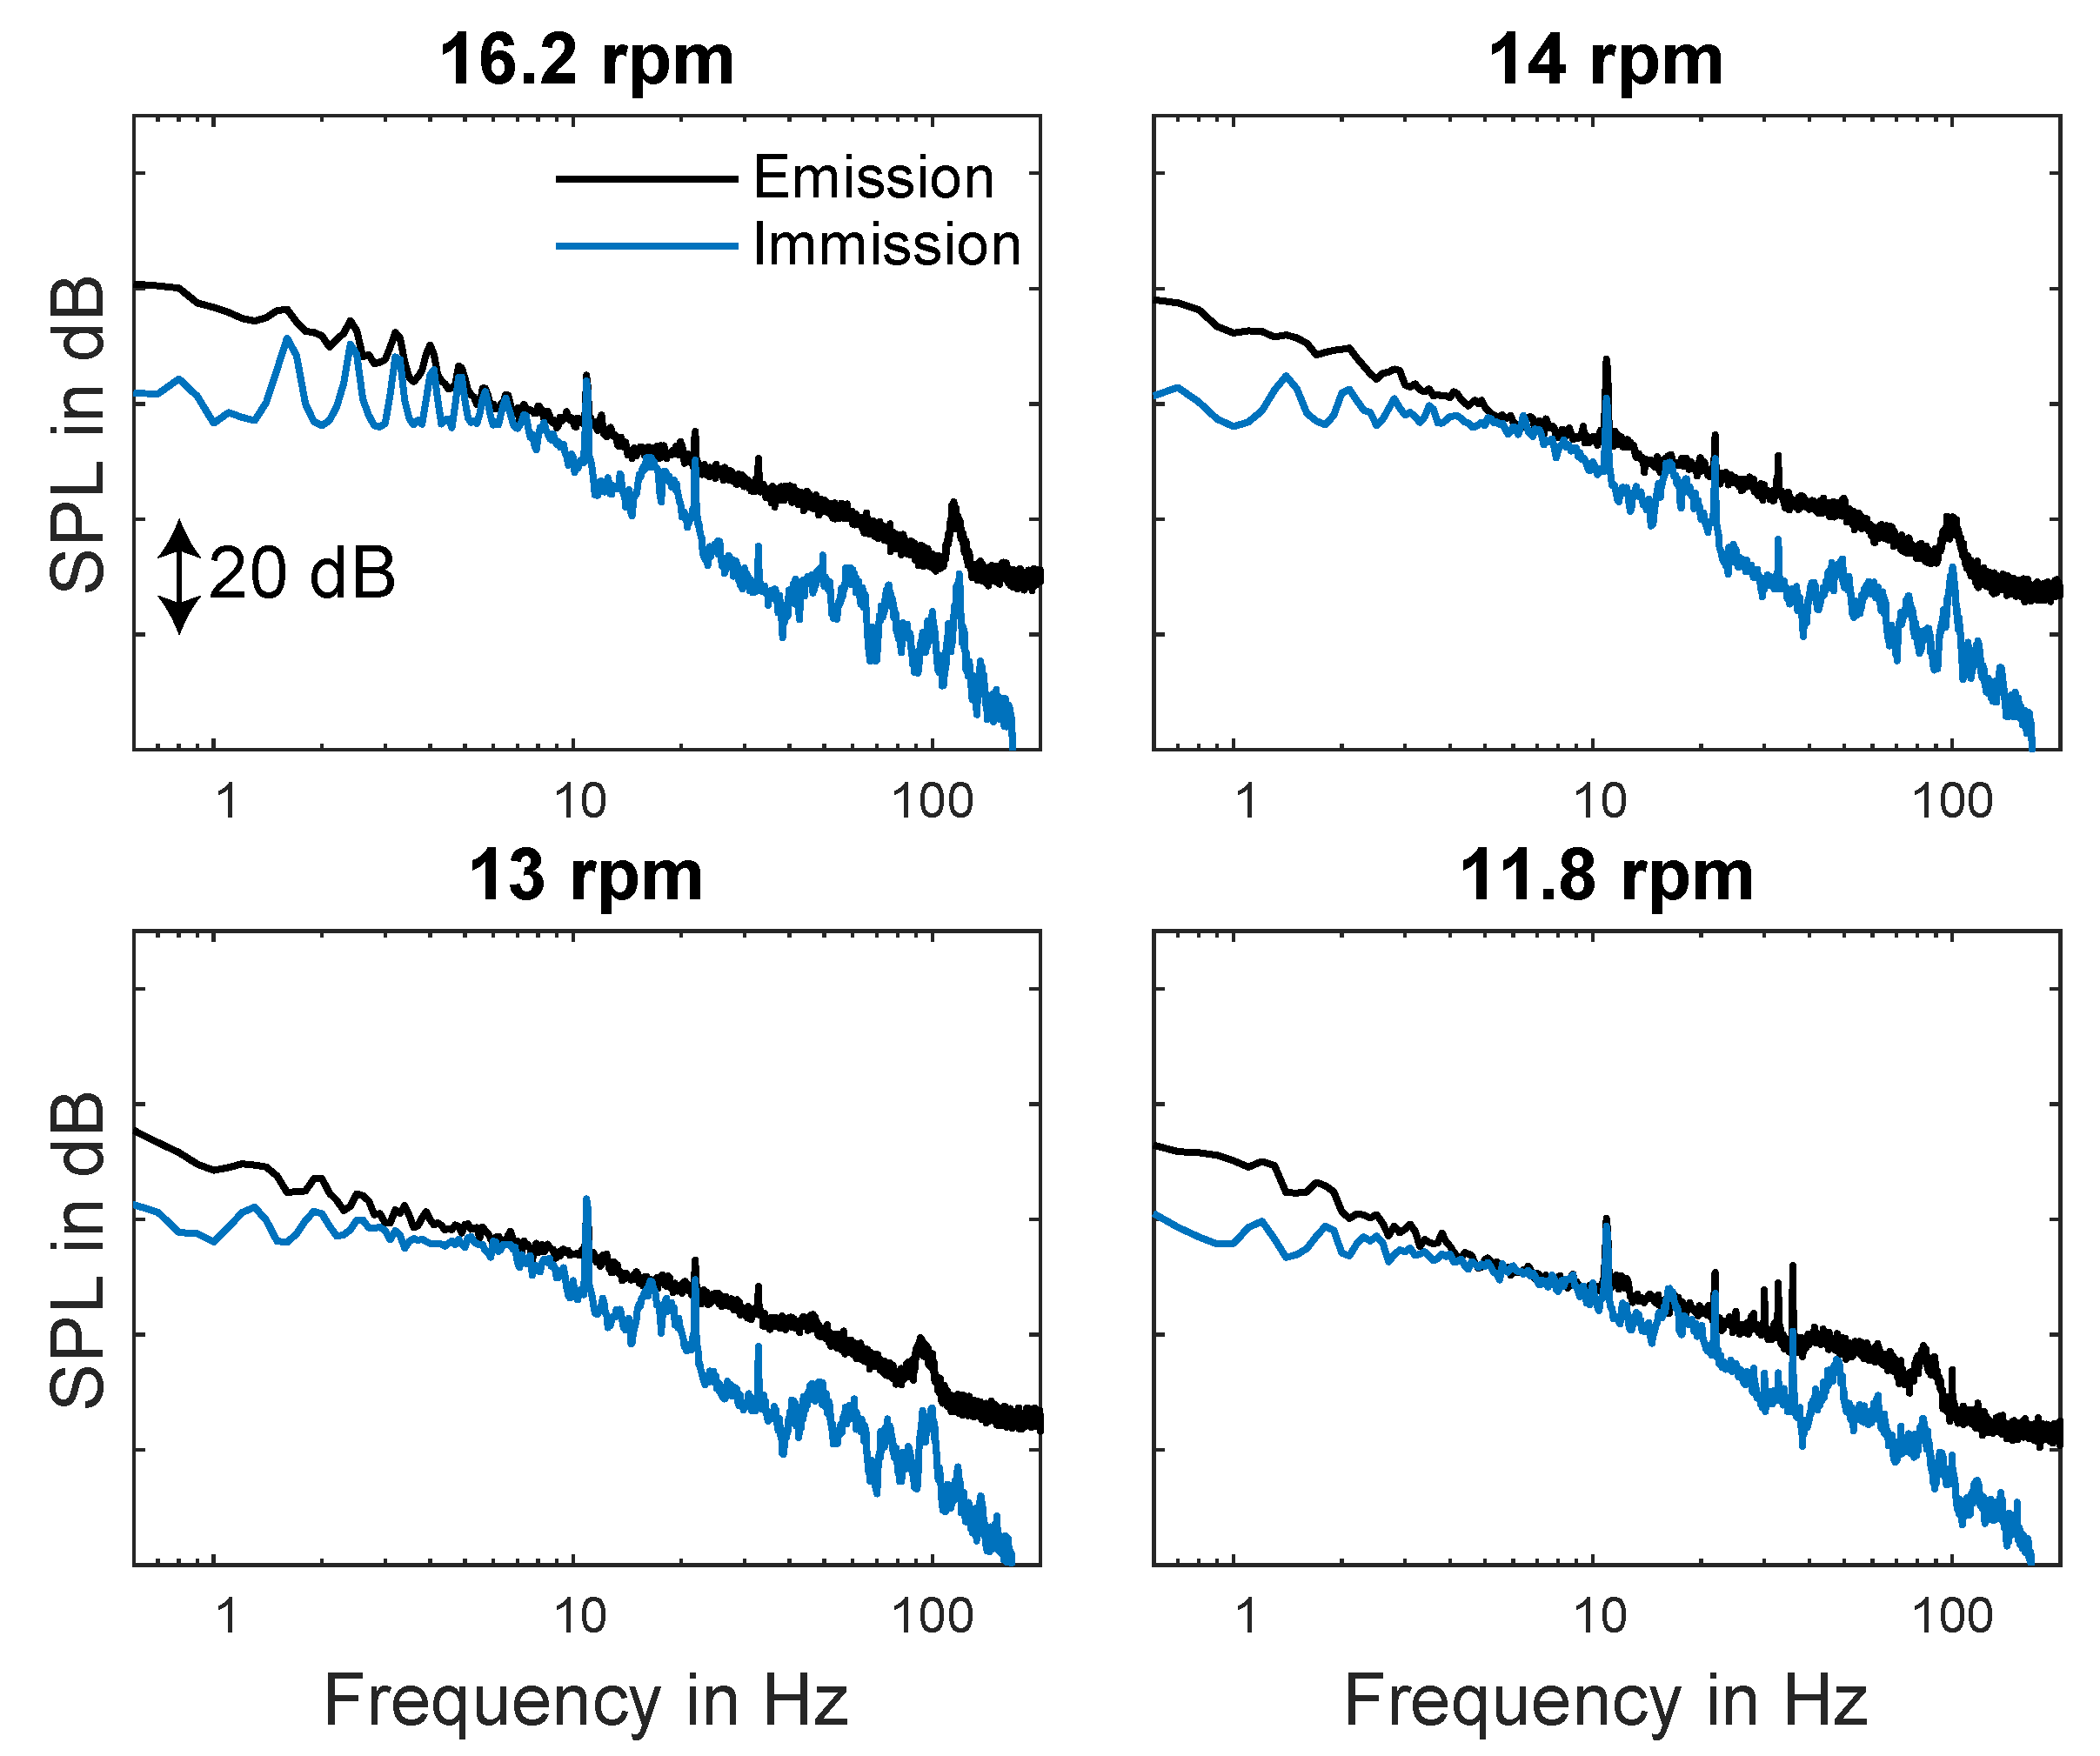
Furthermore, the influence of rotational speed and thus varying power output of the WT on acoustic signals was evaluated. Therefore, the spectra of 10 minute time periods on 12 February 2019 for different rotational speeds, but neutral atmospheric conditions, a similar wind speed at a 10 m height, and nacelle position were compared. Detailed information of each time period is listed in Table 6. As expected, it can be seen in Figure 21 that the rotational speed of the WT had an effect on the measured BPF in terms of frequency, as well as the dominance of the peaks. Thus, the strong variation of WT tones identified in Figure 15 and Figure 16 around 20 Hz and between 80 Hz and 130 Hz could be clearly related to a variation of rotational speed. A comparison between spectra measured outside and inside in Figure 22 showed that BPF tones were most dominant with the highest rotational speed.
In many cases, acoustic noise is measured with the use of sound pressure level meters, which often means that only information about SPL and the frequency components of the signal are recorded and plotted in one-third octave spectra. To complement the results of the shown narrow-band spectra (Figure 18, Figure 19, Figure 20, Figure 21 and Figure 22) obtained through direct measurements of sound pressure p ( t ) , one-third octave spectra were generated according to Section 3. This offered the possibility to insert a curve of the hearing threshold. For the considered frequency range between 1 Hz and 125 Hz, the threshold values were composed by two different literature sources. Frequencies below 8 Hz were proposed by [23], and the frequency range between 8 Hz and 125 Hz was according to [26]. 
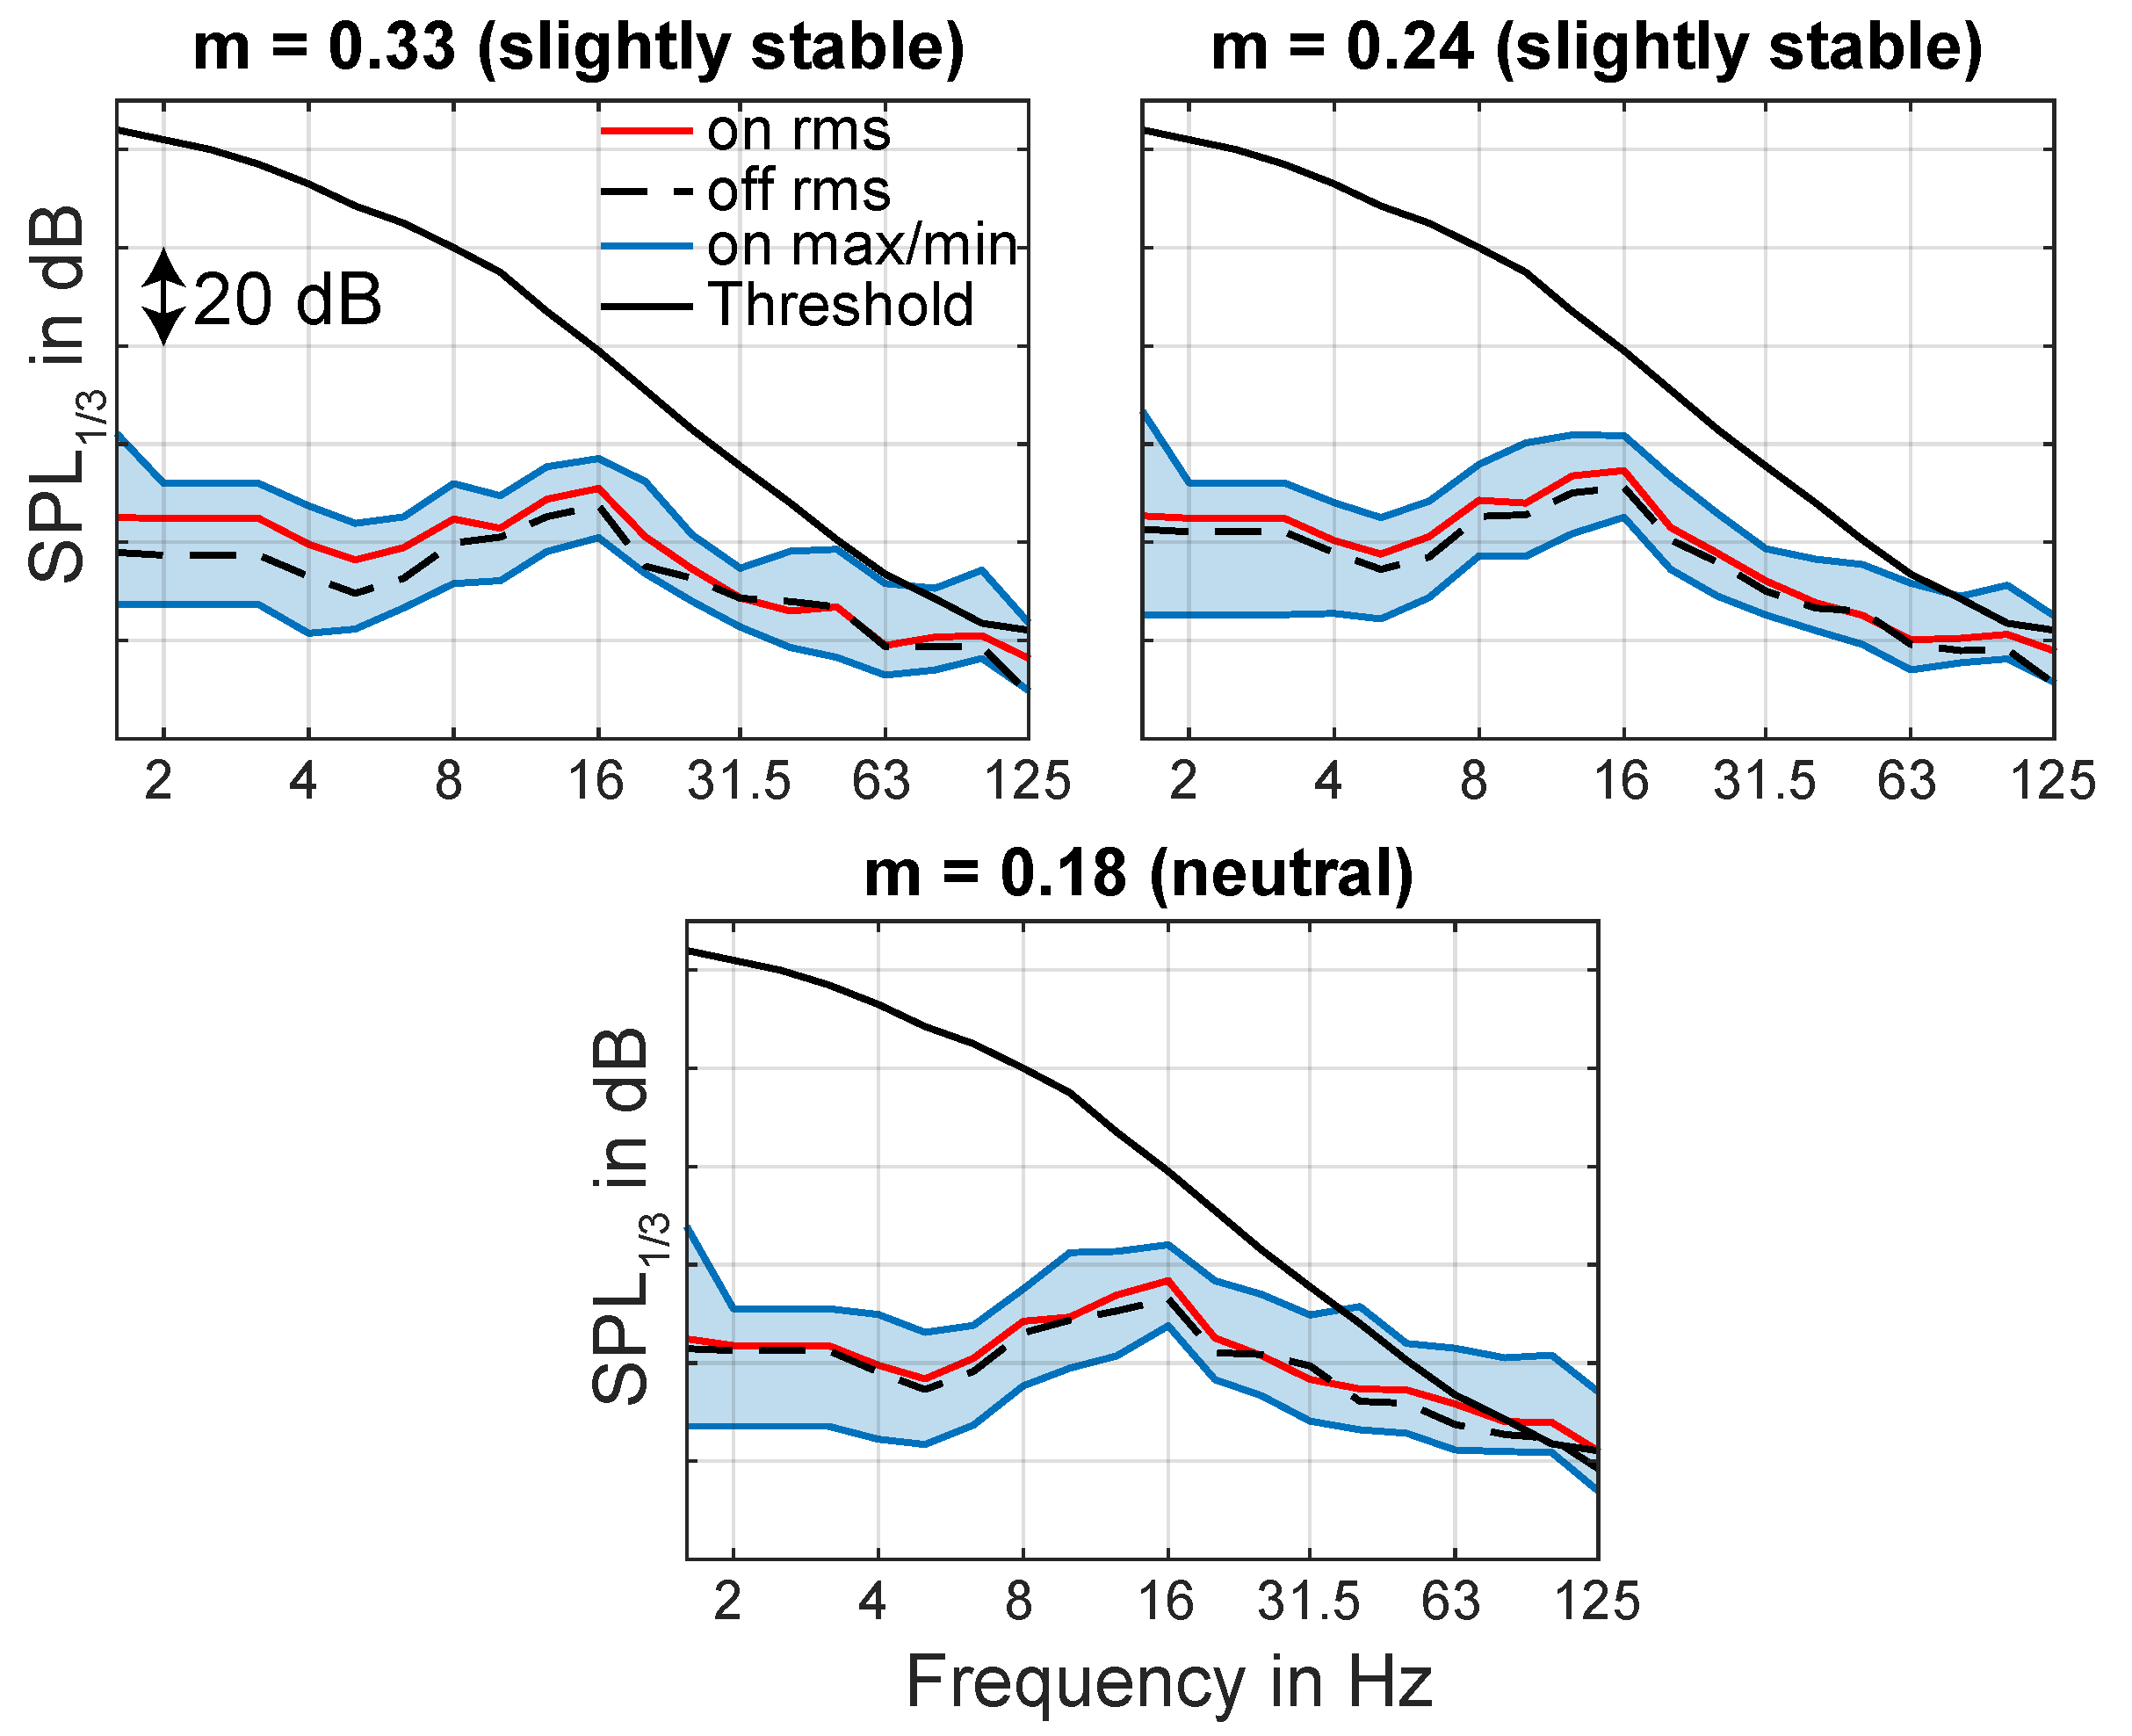
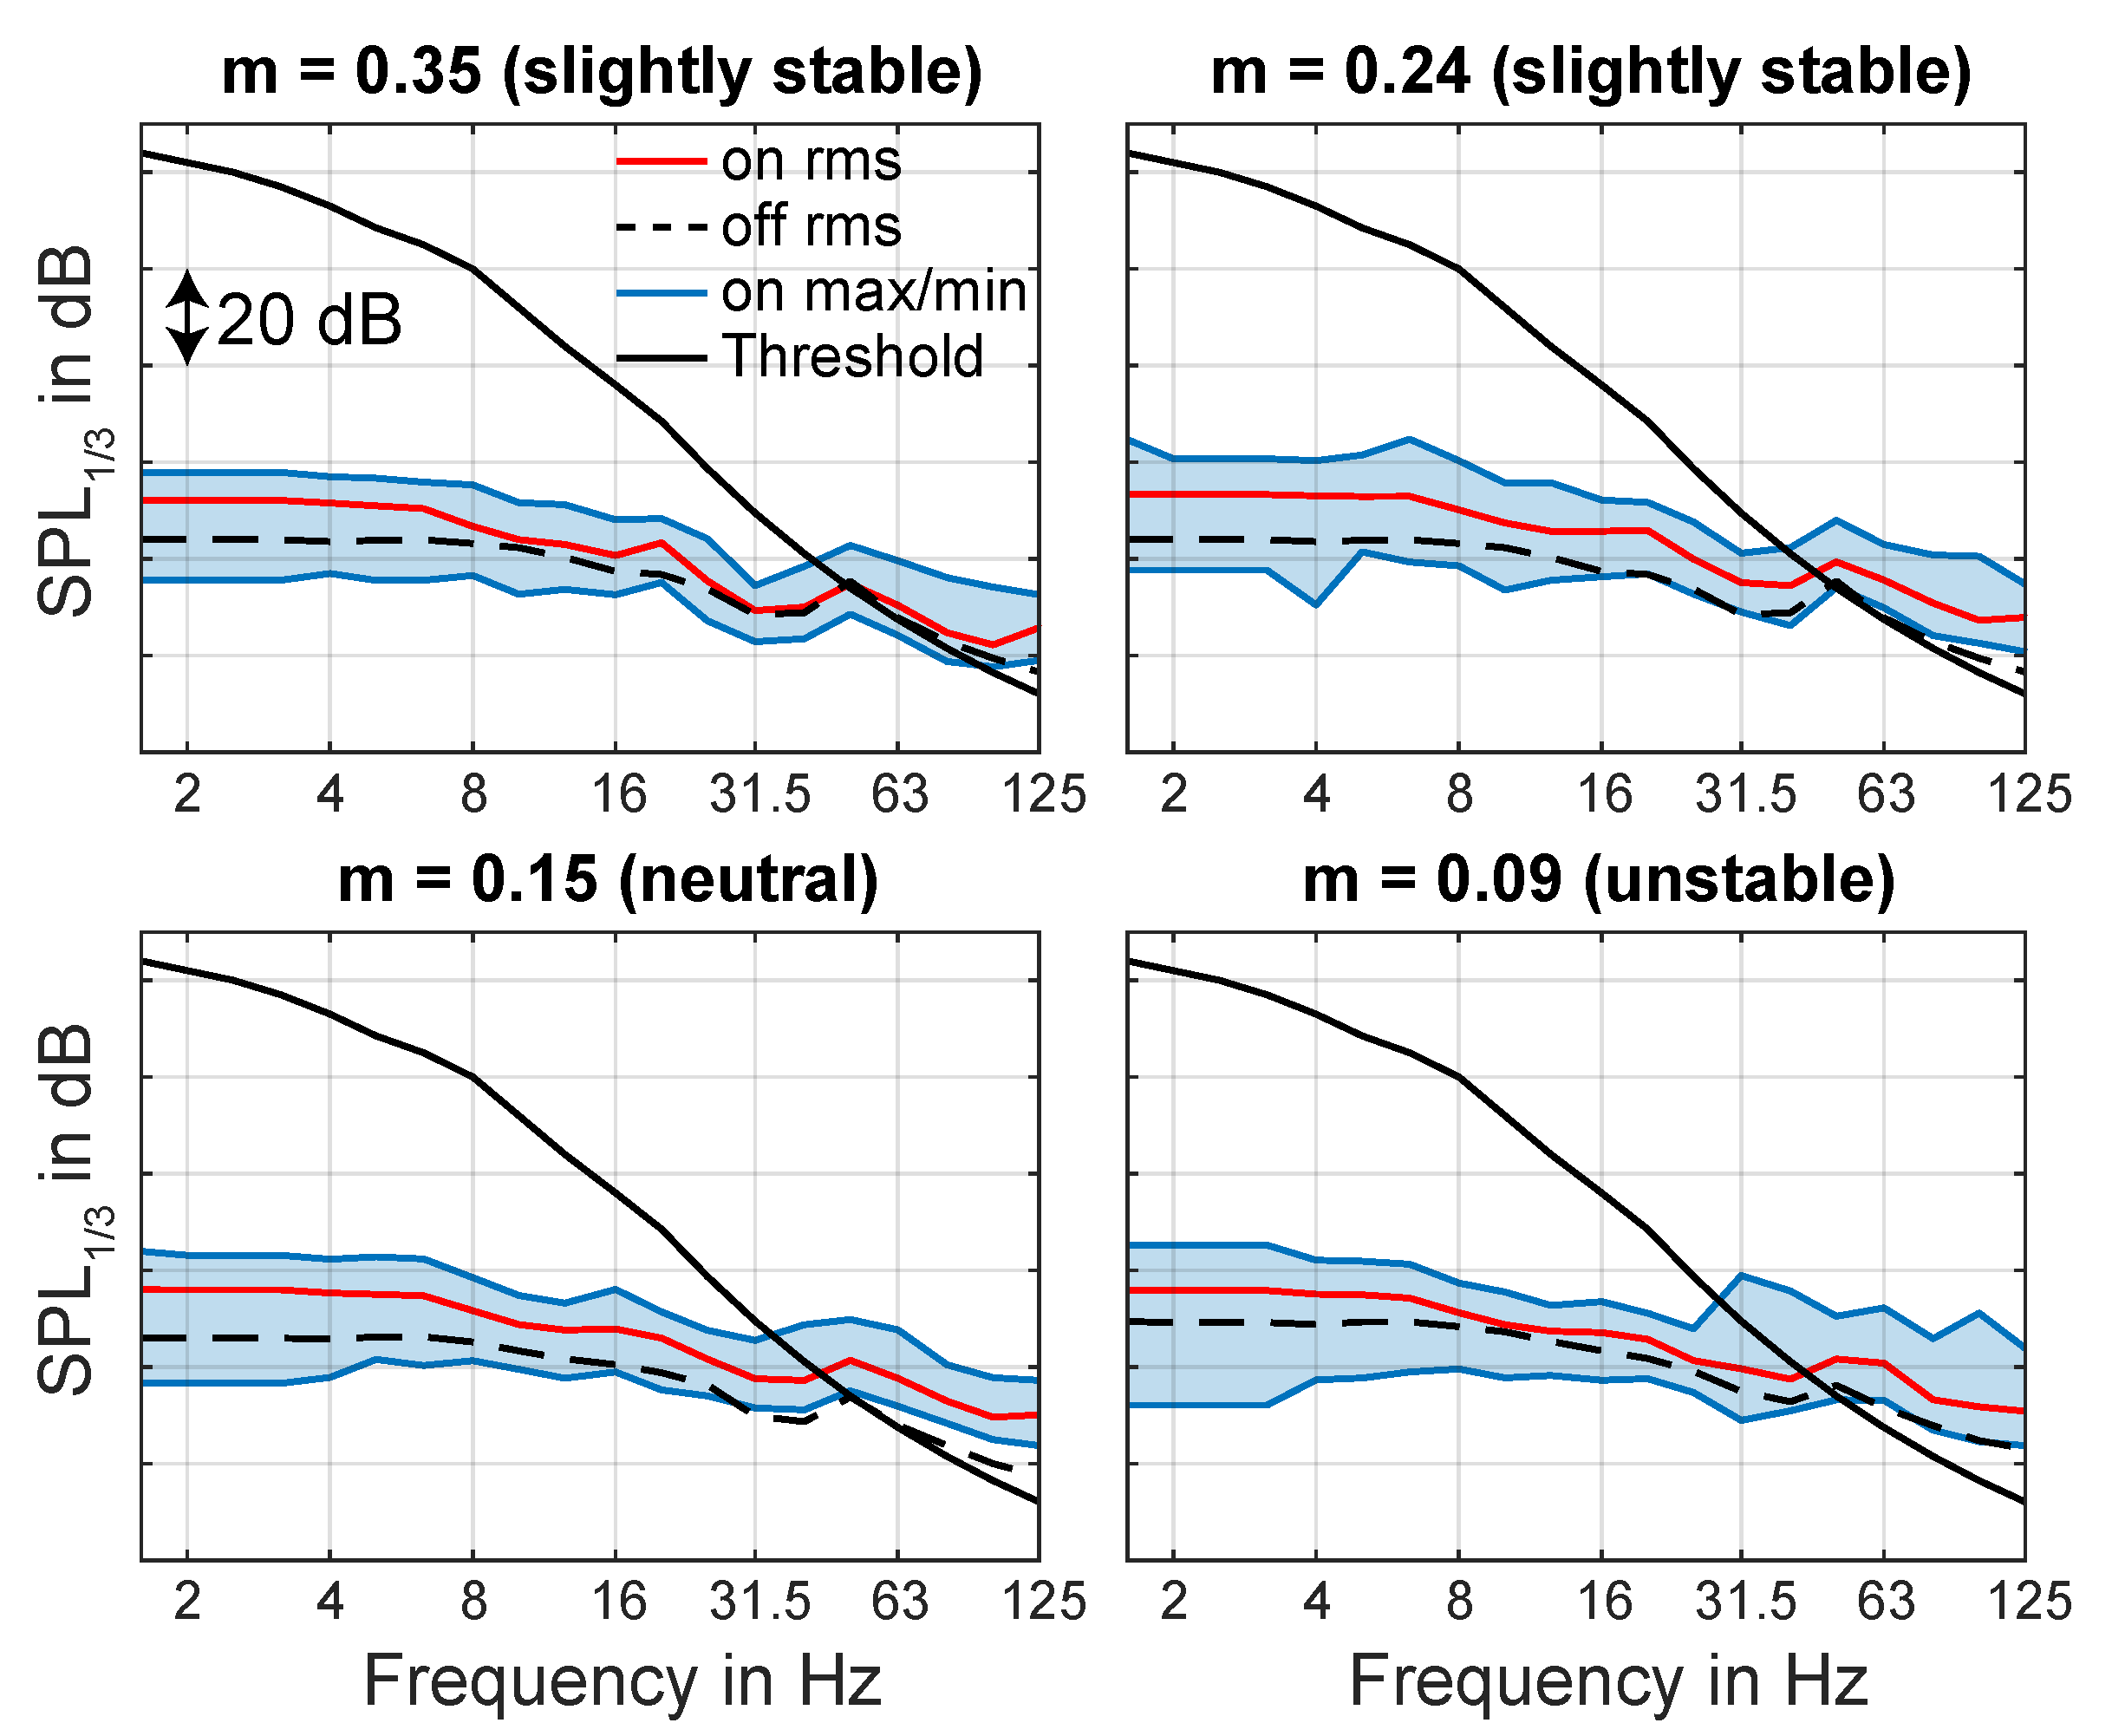
Figure 23 shows the unweighted on/off one-third octave spectra measured inside at location L3 for the described time periods in Table 5 compared with the human hearing threshold. It can be seen that infrasonic sound is below the hearing threshold. For slightly stable conditions (m = 0.35), the WT rms sound spectrum with rotating WT exceeded the threshold above 50 Hz. For slightly stable (m = 0.24), neutral, and instable conditions, the threshold exceeded 40 Hz. The influence of atmospheric conditions was less obvious when plotting one-third octave spectra compared to the narrow-band-spectra in Figure 19.
As already described by [13], the large variation of maximum and minimum SPL for each considered 10 min period spectrum could lead to a better perception by residents or even annoyance. It was also confirmed by [27] that with increasing amplitude-modulation depth, which could be related to the high variation of SPL, the annoyance of residents increased. However, it was also stated that low frequency components were not the main factors of annoyance. In this case, it also has to be noted that the measurements at Site 1 were conducted inside of a wooden shelter with clearly less damping effect on incoming acoustic waves compared to ordinary massive buildings and windows.
For comparison, unweighted one-third octave spectra for three different atmospheric conditions with the same rotational speed for Site 2 and measurement location L6 are shown in Figure 24. The 10 min time periods where chosen to match the previous conditions in Figure 23. Detailed information for each time period is given in Table 7.
For slightly stable conditions, the WT rms sound spectrum with rotating WT exceeded the threshold above 125 Hz, and for neutral conditions, the threshold exceeded 63 Hz. The higher distance between the closest WT (WT8; see Figure 1) of about 1450 m was clearly visible due to lower SPL, although L6 was located beside a wind farm. A peak in the 16 Hz third octave band not related to the WT as also occurring during shutdown was also observed in [3] and related to a resonance of the building structure. The peak was much more dominant on Site 2 than Site 1, which could be explained by the masonry construction of the building in L6 compared to the single-wall construction of Location L3 and therefore different structural resonances.
To which extent the acoustic signals of the WT contributed to annoyance needs further investigation.

4.6. Limitations of the Study

Measurements of low frequency acoustic noise emitted by WT in populated areas are a challenging task. The presented results of this study were therefore limited in various ways. For example, the results of measurements inside could differ depending on the floor level, room dimensions, and mostly because of anthropogenic noise besides wind turbines. This led to the limitation that almost exclusively time periods during the night were evaluated, although the intensity of low frequency noise could be higher during the day.
A further limitation was that only one microphone could be placed near the WT and two microphones inside of buildings at the same time. As a consequence, the propagation of acoustic waves in different directions (directivity) could not be investigated. Furthermore, the decay of acoustic signals with distance was not evaluated in detail because more measurement locations, respectively infrasound microphones, would be necessary.
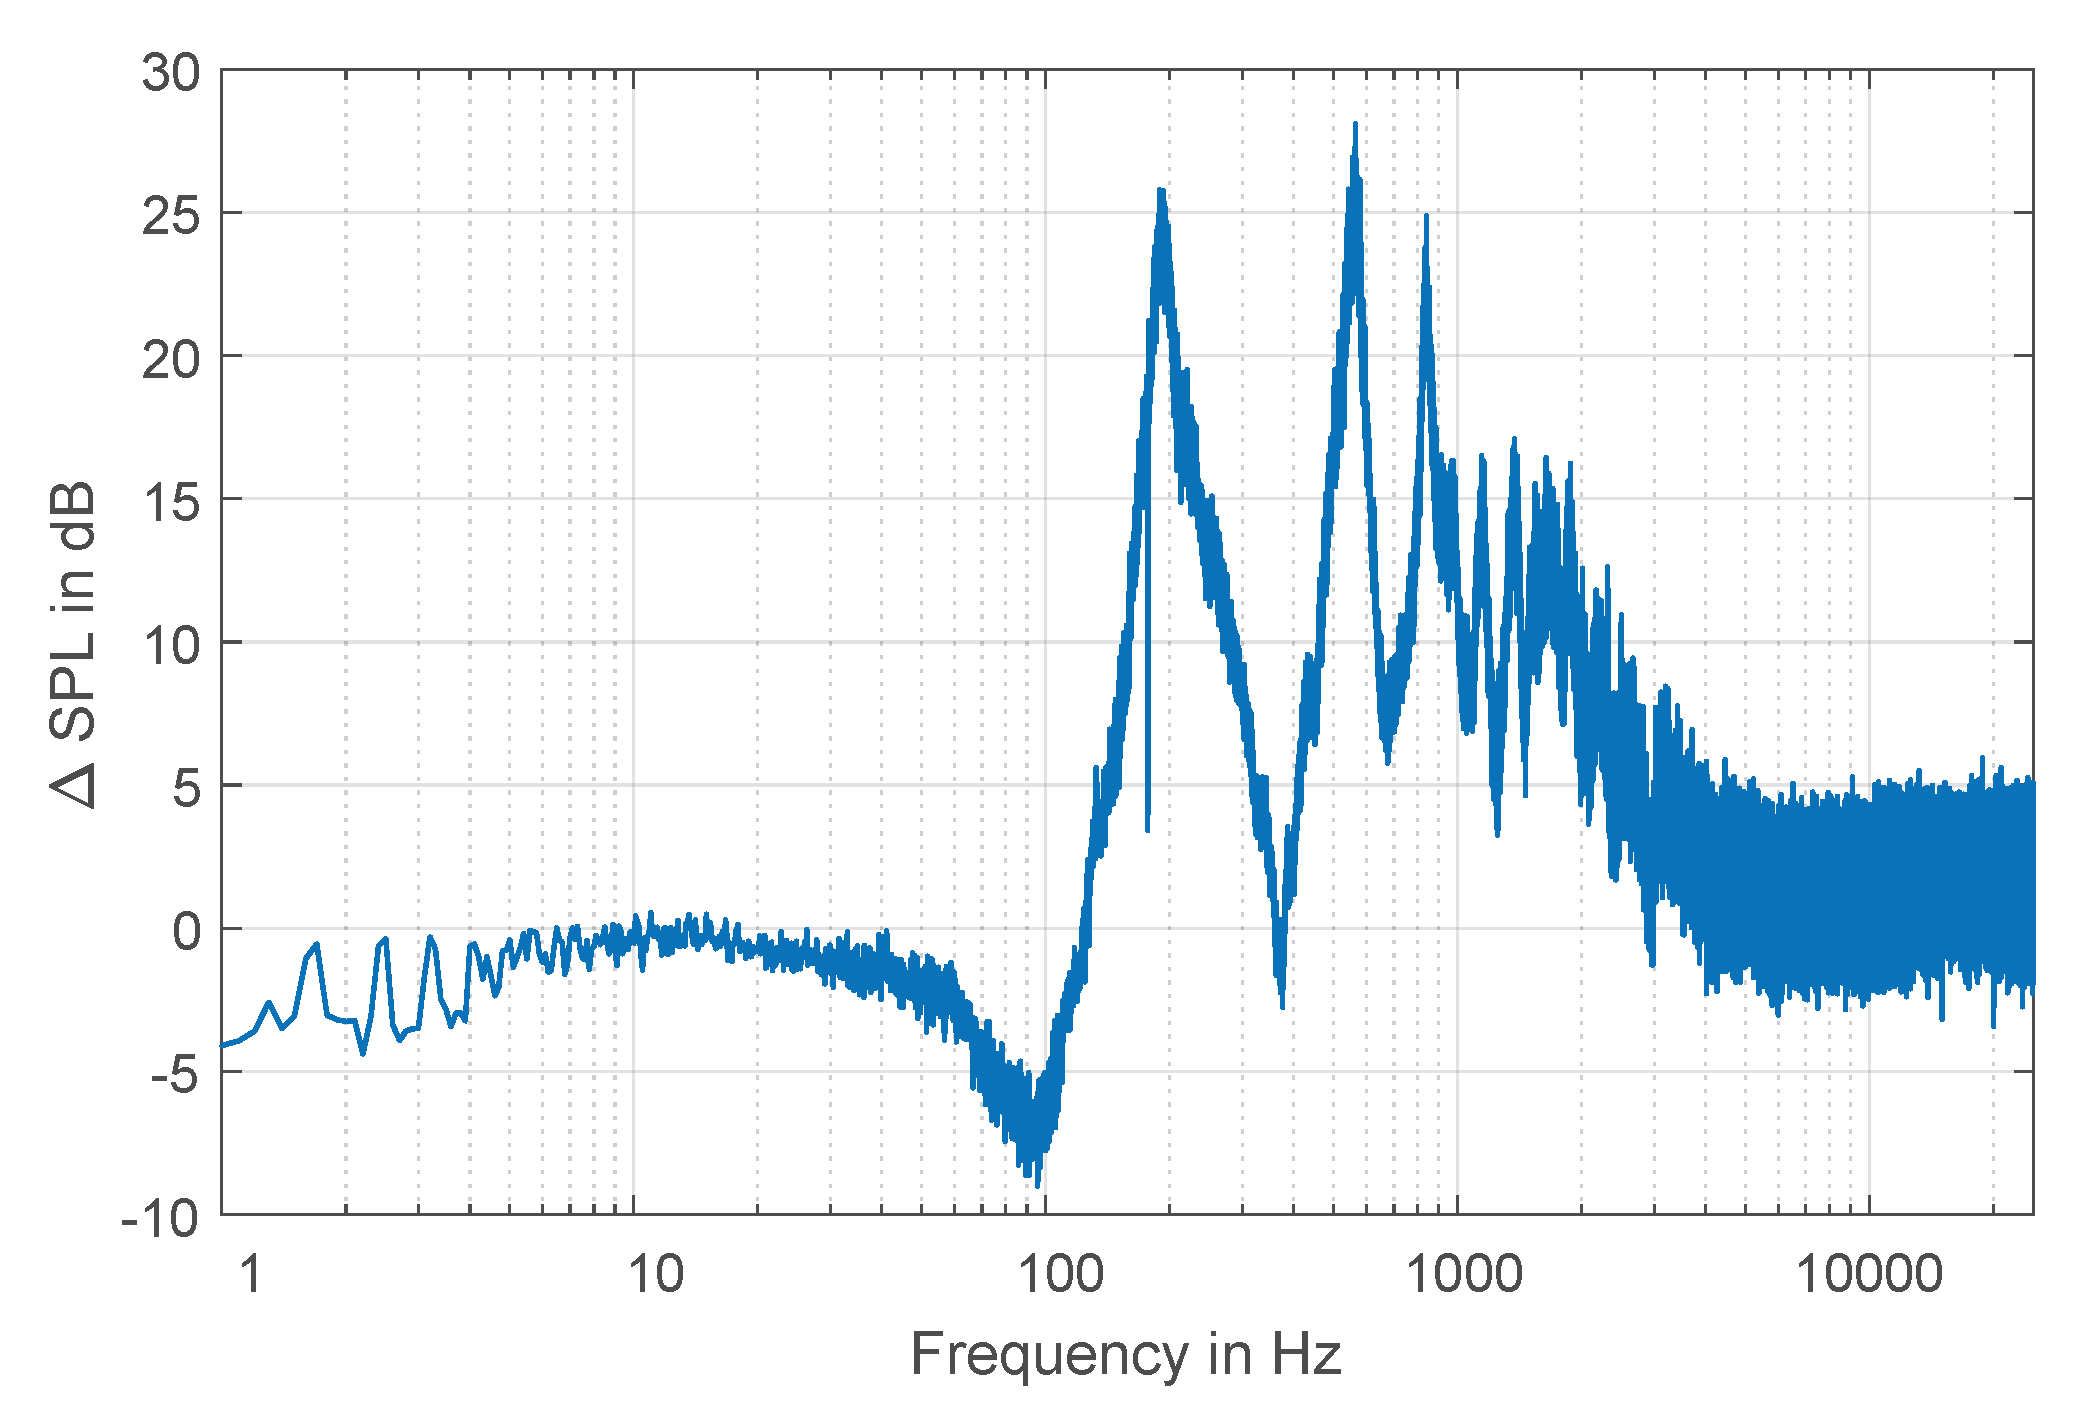
One key factor for reliable results is the measuring equipment itself. The measurement of sound pressure for frequencies below 20 Hz is strongly influenced by the cartridge thermal noise of the microphone capsule, the 1 / f -noise of the microphone preamplifier with corner frequencies around 10 to 20 Hz, and the 1 / f -noise of the recording systems. The noise of a microphone preamplifier is dominant for systems without weighting filters (e.g., A-weighting). Tests under acoustic low noise conditions in the laboratory by night have been carried out to get a better insight into this topic. For the noise test of the recording system, the input was connected to a resistive load with the value of the output impedance of the microphone. The noise spectra of the recording system within 0.1 Hz to 50 Hz itself were more than 30 dB lower compared to the spectra including the microphone. Robust capsules with a 1 inch, or better 2 inch, diameter and therefore higher sensitivity for field measurements are a better choice for infrasound applications, but they were not available on the market for ordinary users at the time of this project. Nevertheless, the comparison of spectra in Figure 19 for non-operating and operating WT showed that the first BPF of around 0.8 Hz was well detectable. This was only possible if the measured values lied significantly above the noise of the microphone, especially the 1 / f -noise of the microphone preamplifier.

5. Conclusions

The presented work was one of the results of an interdisciplinary research group with the aim to investigate the low frequency acoustic and seismic emissions of wind turbines and their effects on the surrounding environment. In particular, long-term acoustic measurements conducted with G.R.A.S. 47AC, Brüel & Kjær 4964, and PCB 378A07 infrasound microphones were presented herein. Measurements were performed near wind turbines of the same type in northern Germany (wind farm, 9 WT), as well as in southern Germany (individual WT). The peculiarities of this project were, on the one hand, that time synchronous acoustic measurements were conducted near the wind turbine/wind farm (outside) and inside of nearby residential buildings based on the actual complaints of these residents. On the other hand, wind turbines were switched off during the measuring periods at specific times to compare permanent background noise with noise through WT operation.
In retrospect, the planned shutdown periods of the wind turbines were essential because it was difficult to identify WT emissions throughout the sheer amount of interfering noise caused by traffic, agricultural machinery, wind, and electricity. Measurement data also showed that shutdown times were not clearly visible in time series of low frequency sound pressure. However, in diagrams with sound pressure level (SPL) over time, changes in WT rotational speed immediately resulted in a change of SPL, especially for high-pass filtered ( f > 5 Hz ) source signals, even at greater distances of about 1.5 km from WT.
To obtain an overview of the frequency components and their intensity (power spectral density (PSD)) over time, spectrograms of different measurement periods were presented. By plotting time-variant spectra for time periods of 10 s using a frequency resolution of 0.1 Hz, very detailed information was preserved. Both measurements inside and outside showed shutdown times of the WT as a significant decrease of intensity over the considered frequency range 1 Hz f 140 Hz in spectrogram representation. Furthermore, it was possible to trace frequency components over time to distinguish which signals were due to WT operation and which signals were not. The dependencies regarding the rotational speed of the wind turbine were obvious.
Moreover, it was shown that atmospheric stability expressed with shear exponent m according to [15] had a great influence on the transmission of acoustic signals from location of emission (outside) to the location of immission (inside). For stable and slightly stable conditions frequency components due to WT operation below 10 Hz (mainly harmonics of blade passing frequency), around 20 Hz, and above 100 Hz showed dominant peaks in narrow-band spectra both outside and inside. In the case of neutral or unstable conditions, these mentioned dominant frequency peaks nearly disappeared in measurements outside and decreased in measurements inside. Total sound pressure level remained similar. The reason for this was the effect that turbulent in-flow generated broadband noise combined with wind induced noise, and thus, peaks in the spectrum were masked. In general, the visibility of higher harmonic frequencies of BPF at the location of immission was more independent of atmospheric stability, and sound pressure levels were normally lower than outside. If time periods with WT operation and shutdown were compared, amplitude spectra clearly differed. Frequency components connected to the WT stood out from the background noise in a significant way.
As a further aspect, the influence of different rotational speeds of the wind turbine regarding the sound pressure level was investigated for similar (neutral) atmospheric conditions. Results showed that the higher the rotational speed (up to 16 rpm), the higher the SPL. Thereby, especially the significance of characteristic frequency peaks (BPF harmonics, etc.) and also the frequency decreased with lower rotational speeds. Especially the tone between 80 Hz and 130 Hz was highly dependent on rotational speed and was measured both inside and outside.
Conclusively, thirdoctave spectra (SPL mean value) of selected time periods were evaluated and the results compared to commonly used hearing thresholds for low frequency sound (e.g., [17,23]). Besides the fact that the representation as the third octave spectra effects made no further differentiation between characteristic frequency peaks possible, the overall sound pressure level was higher during WT operation for stable, slightly stable, and neutral atmospheric stability. The frequency content around 20 Hz was remarkably high, which differed considerably from the rest of the spectrum and also compared to background noise during WT shutdown. This meant that the potential for perceptibility was increased in this frequency range, but still, the sound pressure levels were very low.
For further investigations in the field of low frequency wind turbine noise, the following recommendations can be derived from this contribution. Long-term measurements enable the detection of fluctuating weather conditions. Thus, many different wind speeds and positions of the microphone in relation to the WT are represented in the measurements. Shutdown times especially during the night time are required to identify wind turbine noise and background noise. Furthermore, the combined measurements at the emission and immission point should be conducted. This would enable the identification of WT noise components at the point of immission, but also conclusions concerning sound propagation.

Author Contributions

E.B. and I.K. conducted field measurements with P.R., evaluated the measurement data independently under the supervision of G.H. and P.W.C., and contributed to the writing of the manuscript together. All authors read and agreed to the published version of the manuscript.

Funding

This research was funded by the German Federal Ministry for Economic Affairs and Energy represented by Project Management Jülich (PtJ) Grant Number 0325839C.

Acknowledgments

The authors are grateful for the financial support by the German Federal Ministry for Economic Affairs and Energy represented by Project Management Jülich (PtJ). Furthermore, the authors would like to thank the wind turbine operators and rural residents for their participation.

Conflicts of Interest

The authors declare no conflict of interest. The funders had no role in the design of the study; in the collection, analyses, or interpretation of data; in the writing of the manuscript, or in the decision to publish the results.

Abbreviations

The following abbreviations are used in this manuscript:
BPFBlade passing frequency
CCPConstant current power
GPSGlobal positioning system
IBFInstitute of Soil Mechanics and Rock Mechanics
L1Measurement location 1
SPLSound pressure level
SWEStuttgart Wind Energy
UPSUninterruptible power supply
UTCCoordinated Universal Time
WTWind turbine

References

  1. Bundesverband WindEnergie e.V. German Wind Energy in Numbers. 2019. Available online: https://www.wind-energie.de/english/statistics/statistics-germany/ (accessed on 13 February 2020).
  2. Doolan, C. A review of wind turbine noise perception, annoyance and low frequency emission. Wind Eng. 2013, 37, 97–104. [Google Scholar] [CrossRef]
  3. Hansen, K.; Zajamšek, B.; Hansen, C. Comparison of the noise levels measured in the vicinity of a wind farm for shutdown and operational conditions. In Proceedings of the INTERNOISE 2014—43rd International Congress on Noise Control Engineering: Improving the World through Noise Control, Melbourne, Australia, 16–19 November 2014; pp. 1–11. [Google Scholar]
  4. Shepherd, K.P.; Hubbard, H.H. Physical characteristics and perception of low frequency noise from wind turbines. Noise Control Eng. J. 1991, 36, 5–15. [Google Scholar] [CrossRef]
  5. Health Protection Agency. Health Protection Agency. Health Effects of Exposure to Ultrasound and Infrasound—Report of the Independent Advisory Group on Non-Ionising Radiation. In Documents of the Health Protection Agency; Health Protection Agency: London, UK, 1 February 2010. [Google Scholar]
  6. Van Kamp, I.; van den Berg, F. Health Effects Related to Wind Turbine Sound, Including Low-Frequency Sound and Infrasound. Acoust. Aust. 2018, 46, 31–57. [Google Scholar] [CrossRef] [Green Version]
  7. Hübner, G.; Pohl, J.; Hoen, B.; Firestone, J.; Rand, J.; Elliott, D.; Haac, R. Monitoring annoyance and stress effects of wind turbines on nearby residents: A comparison of U.S. and European samples. Environ. Int. 2019, 132, 105090. [Google Scholar] [CrossRef] [PubMed]
  8. Hansen, C.; Hansen, K. Recent Advances in Wind Turbine Noise Research. Acoustics 2020, 2, 13. [Google Scholar] [CrossRef] [Green Version]
  9. Yasuhiro, S. Journal of Geophysical Research: Preface. J. Geophys. Res. Atmos. 2002, 107, 9855–9868. [Google Scholar] [CrossRef]
  10. Zajamsek, B.; Yauwenas, Y.; Doolan, C.J.; Hansen, K.L.; Timchenko, V.; Reizes, J.; Hansen, C.H. Experimental and numerical investigation of blade–tower interaction noise. J. Sound Vib. 2019, 443, 362–375. [Google Scholar] [CrossRef] [Green Version]
  11. Doolan, C. Wind turbine noise mechanisms and some concepts for its control. In Proceedings of the Australian Acoustical Society Conference 2011, Acoustics 2011: Breaking New Ground, Gold Coast, QLD, Australia, 2–4 November 2011; Volume 40, pp. 494–500. [Google Scholar]
  12. Tonin, R. Sources of wind turbine noise and sound propagation. Acoust. Aust. 2012, 40, 20–27. [Google Scholar]
  13. Zajamšek, B.; Hansen, K.L.; Doolan, C.J.; Hansen, C.H. Characterisation of wind farm infrasound and low frequency noise. J. Sound Vib. 2016, 370, 176–190. [Google Scholar] [CrossRef]
  14. Oerlemans, S.; Sijtsma, P.; Méndez López, B. Location and quantification of noise sources on a wind turbine. J. Sound Vib. 2007, 299, 869–883. [Google Scholar] [CrossRef]
  15. Van Den Berg, G.P. Effects of the wind profile at night on wind turbine sound. J. Sound Vib. 2004, 277, 955–970. [Google Scholar] [CrossRef]
  16. Van Den Berg, G.P. Wind turbine power and sound in relation to atmospheric stability. Wind Energy 2008, 11, 151–169. [Google Scholar] [CrossRef]
  17. DIN 45680:1997-03. Measurement and Assessment of Low-Frequency Noise Immissions in the Neighbourhood; Beuth Verlag: Berlin, Germany, 1 March 1997. [Google Scholar]
  18. Technische Anleitung zum Schutz gegen Lärm (TA Lärm). Sechste Allgemeine Verwaltungsvorschrift zum Bundes-Immissionsschutzgesetz. 26 August 1998. Available online: http://www.verwaltungsvorschriften-im-internet.de/bsvwvbund_26081998_IG19980826.htm (accessed on 13 February 2020).
  19. Calarco, F.; Cheng, P.W.; Zieger, T.; Ritter, J. Acoustic and seismic emissions from wind turbines. In Proceedings of the DEWEK, Bremen, Germany, 17–18 October 2017. [Google Scholar]
  20. IEC 61400:2012-11. Wind Turbines—Part 11: Acoustic Noise Measurement Techniques; VDE-Verlag: Berlin, Germany, 1 November 2012. [Google Scholar]
  21. Turnbull, C.; Turner, J.; Walsh, D. Measurement and level of infrasound from wind farms and other sources. Acoust. Aust. 2012, 40, 45–50. [Google Scholar]
  22. Van Den Berg, G.P. The beat is getting stronger: The effect of atmospheric stability on low frequency modulated sound of wind turbines. J. Low Freq. Noise Vib. Act. Control 2005, 24, 1–24. [Google Scholar] [CrossRef] [Green Version]
  23. Møller, H.; Pedersen, C.S. Hearing at low and infrasonic frequencies. Noise Health 2004, 6, 37–57. [Google Scholar] [PubMed]
  24. Van Den Berg, G.P. The Sound of High Winds: The Effect of Atmospheric Stability on Wind Turbine Sound and Microphone Noise. Ph.D. Thesis, University of Groningen, Groningen, The Netherlands, 2006. [Google Scholar]
  25. Buck, S.; Oerlemans, S.; Palo, S. Experimental characterization of turbulent inflow noise on a full-scale wind turbine. J. Sound Vib. 2016, 385, 219–238. [Google Scholar] [CrossRef]
  26. DIN 45680:2013-09-Draft. Measurement and Assessment of Low-Frequency Noise Immissions; Beuth Verlag: Berlin, Germany, 1 September 2013. [Google Scholar]
  27. Hafke-Dys, H.; Preis, A.; Kaczmarek, T.; Biniakowski, A.; Kleka, P. Noise annoyance caused by amplitude modulated sounds resembling the main characteristics of temporal wind turbine noise. Arch. Acoust. 2016, 41, 221–232. [Google Scholar] [CrossRef] [Green Version]
Figure 1. Site plans of the wind turbine sites: (a) Site 1 in southern Germany with one single WT (star), measurement positions of SWE (circle) and IBF (square); (b) Site 2 in northern Germany with 9 WT.
Acoustics 02 00020 g001
Figure 2. Microphone placed on a plate with two windshields according to IEC 61400-11.
Acoustics 02 00020 g002
Figure 3. Microphone placed in a wooden box at the ground level.
Acoustics 02 00020 g003
Figure 4. Container used as the control center for the measurement instrumentation and a 10 m high met-mast equipped with an anemometer, barometer, thermometer, hygrometer, and camera.
Acoustics 02 00020 g004
Figure 5. Schematic measurement setup for the SWE equipment. Electric power supply from the WT for the container, which contained the data acquisition system to record the data from the microphones and meteorological sensors and uninterruptible power supply (UPS).
Acoustics 02 00020 g005
Figure 6. Combined acoustic and seismic measuring instruments of IBF during the measurement inside of a building near Site 2.
Acoustics 02 00020 g006
Figure 7. Difference of sound pressure level measured on 10 February 2019 02:50–03:00 with the microphone mounted on a wooden plate and in a wooden box.
Acoustics 02 00020 g007
Figure 8. Wind speed and direction at a 10 m height, wind speed at hub height, nacelle position, rotational speed, and atmospheric stability determined with shear exponent m for location L2 during the measurement period from 9 February 2019 00:00 (UTC) to 13 February 2019 23:50 (UTC) averaged over 10 min. Wind speed at hub height, nacelle position, and rotational speed were obtained from the wind turbine manufacturer.
Acoustics 02 00020 g008
Figure 9. Wind speed and direction at a 10 m height, wind speed at hub height, nacelle position, rotational speed, and atmospheric stability determined with shear exponent m for location L5 during the measurement period from 27 November 2018 00:00 (UTC) to 12 December 2018 23:50 (UTC) averaged over 10 min. Wind speed at hub height, nacelle position, and rotational speed were obtained from the wind turbine manufacturer.
Acoustics 02 00020 g009
Figure 10. Time series of sound pressure data between 10 February 2019 and 12 February 2019 at Site 1. Top: emissions, bottom: immissions.
Acoustics 02 00020 g010
Figure 11. Time series of sound pressure data between 28 November 2019 and 30 November 2019 at Site 2. Top: emissions, bottom: immissions.
Acoustics 02 00020 g011
Figure 12. Time series of sound pressure level between 10 February 2019 and 12 February 2019 at Site 1. Calculated with bandpass 5 Hz–100 Hz for SWE Gras 47AC and IBF B&K 4964 and measured values of IBF SoundTrack LxT.
Acoustics 02 00020 g012
Figure 13. Time series of sound pressure level including WT shutdowns between 10 February 2019 22:00 (UTC) and 11 February 2019 06:00 (UTC) at Site 1. Calculated with bandpass 5 Hz–100 Hz for SWE Gras 47AC and IBF B&K 4964 and measured values of IBF SoundTrack LxT.
Acoustics 02 00020 g013
Figure 14. Detailed 10 s time series of sound pressure beginning at 10 February 2019 02:30:00 (UTC). Calculated with bandpass filter 0.5 Hz–10 Hz for SWE Gras 47AC and IBF B&K 4964.
Acoustics 02 00020 g014
Figure 15. Spectrogram of sound pressure data between 10 February 2019 and 12 February 2019 at Site 1. Top: emissions, bottom: immissions.
Acoustics 02 00020 g015
Figure 16. Spectrogram of sound pressure data between 28 November 2019 and 30 November 2019 at Site 2. Top: emissions, bottom: immissions (Location L6).
Acoustics 02 00020 g016
Figure 17. Spectrogram of sound pressure data for 10 February 2019 between 00:00 and 04:00 at Site 1. Left: SWE, right: IBF.
Acoustics 02 00020 g017
Figure 18. Comparison between on/off unweighted SPL measured outdoors at L2 for different atmospheric conditions. The measurement periods are marked in Table 5.
Acoustics 02 00020 g018
Figure 19. Comparison between on/off unweighted SPL measured indoors at L3 for different atmospheric conditions. The measurement periods are marked in Table 5.
Acoustics 02 00020 g019
Figure 20. Comparison of unweighted SPL measured for different atmospheric conditions between emission (L2) and immission (L3). The measurement periods are marked in Table 5.
Acoustics 02 00020 g020
Figure 21. Comparison of unweighted SPL measured outdoors at location L2 for different rotational speeds. The measurement periods are marked in Table 6.
Acoustics 02 00020 g021
Figure 22. Comparison between emission (L2) and immission (L3) unweighted SPL measured for different rotational speeds. The measurement periods are marked in Table 6.
Acoustics 02 00020 g022
Figure 23. Comparison between on/off one-third octave band unweighted sound pressure level measured inside at location L3 for different atmospheric conditions marked in Table 5 and the hearing threshold according to [23,26].
Acoustics 02 00020 g023
Figure 24. Comparison between on/off one-third octave band unweighted sound pressure level measured inside at location L6 for different atmospheric conditions marked in Table 7 and the hearing threshold according to [23,26].
Acoustics 02 00020 g024
Table 1. Technical data of the acoustic measuring instruments used by SWE.
ManufacturerG.R.A.S
Type of capsule47AC
Sensitivity8 mV/Pa
Frequency range (±1 dB)1 Hz–10 kHz
Lower limiting frequency (−3 dB)0.09 Hz
Dynamic range20–148 dB
Table 2. Technical data of the meteorological measuring instruments used by SWE.
Measurement Device3 Axis Ultrasonic AnemometerThermo-Hygro Transmitter-CompactBaro Transmitter
ManufacturerGillThiesThies
ModelWindmaster PRO1.1005.54.2413.1157.10.241
Range0–65 m/s wind speed0–100% r.h. humidity300–1100 hPa pressure
0–359 ° wind direction−30–+70 ° C temperature
300–370 m/s speed of sound
Table 3. Technical data of the acoustic measuring instruments used by IBF.
ManufacturerBrüel & KjærPCB PiezotronicsLarson Davis
Model-378A07SoundTrack LxT
Type of capsule4964377A07377B02
Type of preamplifier2671-W-001426E01PRMLxT1L
Sensitivity50 mV/Pa5.8 mV/Pa50 mV/Pa
Frequency range (±1 dB)0.04 Hz–10 kHz0.25 Hz–10 kHz5 Hz–10 kHz
Lower limiting frequency (−3 dB)<1.2 Hz<0.1 Hz1.0–2.4 Hz
Dynamic range14.6–146 dB>134 dB re 20 μ Pa>146 dB re 20 μ Pa
Table 4. Shear exponent m and classification of atmospheric stability.
Atmospheric StabilityShear Exponent
very-slightly unstable m 0.1
neutral 0.1 < m < 0.2
slightly stable 0.2 < m < 0.4
moderately-very stable 0.4 m
Table 5. Ten minute periods during 10 February 2019 with constant rotational speed and similar wind speed at a 10 m height for comparison of acoustic transmission for different atmospheric conditions. Measurement of 11 February 2019.
Operational ModeTime PeriodShear Exponent mAtmospheric StabilityRotational Speed in rpmNacelle PositionWind Speed at 10 m in m/s
On02:30–02:400.35slightly stable16.2SW3.4
Off02:50–03:000.22slightly stable0S3.4
On07:50–08:000.24slightly stable16.1SE4.2
Off02:50–03:000.22slightly stable0S3.4
On09:50–10:000.15neutral16.4SW6.1
Off04:50–05:000.17neutral0SE4.3
On10:20–10:300.09unstable16.6S6.8
Off00:50–01:00 0.05unstable0W6.7
Table 6. Ten minute periods during 12 February 2019 with neutral to slightly stable atmospheric conditions and similar wind speed at a 10 m height for the comparison of acoustic transmission for different rotational speeds of the WT.
Operational ModeTime PeriodShear Exponent mAtmospheric StabilityRotational Speed in rpmNacelle PositionWind Speed at 10 m in m/s
On00:10–00:200.22slightly stable16.2NW4.6
Off00:50–01:000.11neutral0NW2.8
On02:20–02:300.22slightly stable14.0NW3.8
Off02:50–03:000.16neutral0NW3.2
On02:30–02:400.24slightly stable13.0NW3.2
Off02:50–03:000.16neutral0NW3.2
On04:10–04:200.22slightly stable11.8NW3.2
Off02:50–03:000.16neutral0NW3.2
Table 7. Ten minute periods during 30 November 2019 with constant rotational speed and similar wind speed at a 10 m height for comparison of acoustic transmission for different atmospheric conditions. No measurements available.
Operational ModeTime PeriodShear Exponent mAtmospheric StabilityRotational Speed in rpmNacelle PositionWind Speed at 10 m in m/s
On23:10–23:200.33slightly stable16.9S3.3
Off22:50–23:00 0S
On02:10–02:200.24slightly stable16.1SE4.4
Off02:50–03:000.14slightly stable0SE4.4
On11:00–11:100.18neutral16.0SE5.0
Off04:50–05:000.16neutral0SE4.4

