Article

Contactless Liquid Height and Property Estimation Using Surface Acoustic Waves

1
Mechanical Engineering Department, Umm Al-Qura University, Makkah 21955, Saudi Arabia
2
Mechanical Engineering Department, University of South Florida, Tampa, FL 33620, USA
*
Author to whom correspondence should be addressed.
Acoustics 2020, 2(2), 366-381; https://doi.org/10.3390/acoustics2020021
Submission received: 24 April 2020 / Revised: 30 May 2020 / Accepted: 4 June 2020 / Published: 6 June 2020

Abstract

:
The propagation of surface acoustic waves over a solid plate is highly influenced by the presence of liquid media on the surface. At the solid–liquid interface, a leaky Rayleigh wave radiates energy into the liquid, causing a signification attenuation of the surface acoustic wave amplitude. In this study, we take advantage of this spurious wave mode to predict the characteristics of the media, including the volume or height. In this study, the surface acoustic waves were generated on a thick 1018 steel surface via a 5 MHz transducer coupled through an angle beam wedge. A 3D-printed container was inserted on the propagation path. The pulse-echo time-domain responses of the signal were recorded at five different volumes (0, 400, 600, 1000, and 1800 µL). With the aid of parametric CAD analysis, both the position and distance of the entire traveling wave in the liquid layer were modeled and verified with experimental studies. The results indicated that the average drop in the reflected wave amplitude due to liquid loading is −62.5% compared to the empty container, with a percentage of error within 10% for all cases. The localized-time frequency components of the reflected wave were obtained via a Short-Time Fourier Transform technique. Up to 10% reduction (500 KHz) in the central frequency was observed due to the liquid volume increasing. The method discussed herein could be useful for many applications, where some of the liquid’s parameters or the ultrasonic wave behavior in the liquid need to be assessed.

Graphical Abstract

1. Introduction

Surface acoustic waves (SAWs) have been widely utilized to detect surface defects in many structural health monitoring applications. The propagation of SAWs over a thick solid plate is highly influenced by the presence of liquid on the surface. Therefore, the estimation of the defect location or depth can be inaccurate since the output signal includes additional wave packets, which is caused by the presence of liquid on the surface. In this study, we take advantage of these spurious wave packets to understand the characteristics of the liquid media. At the solid–liquid interface, a leaky Rayleigh wave is actuated, which radiates energy into the liquid, causing a signification drop in the SAW amplitude [1,2,3]. Due to the difference in the acoustic impedance between the solid and liquid at the interface, a refracted longitudinal wave propagates into the liquid layer until it hits the liquid–air boundary and returns to the solid surface.
The theory of elastic wave propagation along an interface between two media has been well studied. For instance, Stonely solved the wave propagation along a solid–solid interface (Stoneley’s waves) [4], whereas Scholte studied the wave propagation along a solid–liquid interface (Scholte’s waves) [5,6]. The Rayleigh wave and leaky Rayleigh wave at the solid–liquid interface were studied [6]. The leaky Rayleigh wave exists at the interface when the longitudinal velocity of the liquid is smaller than the shear wave velocity in the solid half-space [7,8]. The propagation of surface waves along the solid–liquid interface, where the liquid velocity is higher than the shear velocity in the solid, was investigated theoretically and experimentally by Padilla for the existence of a surface wave at a plastic–liquid interface [9]. The multiple pulsed leaky Rayleigh wave component propagation in the liquid layer over an aluminum plate was experimentally studied, and the velocity of the pulsed leaky Rayleigh wave was found to be higher than the Rayleigh wave velocity, while the amplitude of the pulsed leak Rayleigh components was increased [1].
SAW (or Rayleigh wave)-based devices, which are typically made of anisotropic materials such as LiNbO3, where the SAW characteristics depend on the orientation, have gained considerable attention [10]. The sensitivity of SAWs to liquid-loading on the SAW devices has led to a wide range of applications such as liquid shear viscosity measurement [11], glycerin concentration sensing in a microfluidic channel [12], early ovarian cancer detection [13,14], particle and cell separation [15,16,17], and liquid mixing and pumping in microchannels [18,19]. Other useful applications of SAWs are quantifying cell growth [20], quantifying bolt tension in bolted joints [21,22], and pH sensing in cultures [23]. By contrast, only a few applications have taken advantage of the effect of liquid-loading over a solid material (isotropic) on SAWs. One possible application would be estimating liquid height using SAWs. In literature, there are a couple of methods for determining liquid height via using a single or multiple ultrasonic transducer(s), where the basic principle works on the discrepancy in the acoustic impedance of the two media. In one of the studies, the liquid height was measured utilizing two ultrasonic transducers coupled to a tank wall. The first transducer transmits the bulk shear wave that propagates along the solid member in a zigzag path, and the second transducer receives the reflected wave from the solid–liquid interface. Based on the attenuated amplitude of the signal, the acoustic impedance of the liquid can be measured [24]. A non-contact ultrasonic PING sensor was utilized to measure water height with the aid of a microcontroller to calculate the change in the arrival times of the echoes from water [25]. Another method measured liquid height by utilizing three transducers; one transmitter was located between the two echo receiving transducers, and these transducers were encapsulated to overcome the coupling issue. The measurement was achieved by moving the transducers along the container wall, and a noticeable difference in the reflected wave energy was observed when the transmitter moved from the above liquid level to the below liquid level [26].
The advantages of employing SAWs in detecting surface flaws are that they propagate close to the free surface of a specimen, are easy to excite and record, and are less complicated compared to other types of ultrasonic waves [27,28,29]. The proposed method to measure fluid height via SAWs is simple, fast, and inexpensive. Moreover, the proposed methodology has the capability to measure a small amount of fluid on a solid surface, such as a spill from a distance, with a small error. The measurement can be achieved by exciting the SAW through an off-shelf piezoelectric transducer connected to the angle beam wedge. The wave reflected from the liquid propagates back towards the transducer, and the received signal is recorded via an oscilloscope. Performing a thorough analysis of the time domain response of the received signal determines the arrival time of the leaky Rayleigh wave from the solid–fluid interface and the arrival time of the reflected wave from the top surface of the fluid. In the final step, a height equation that is derived from Snell’s law and the fluid proprieties can be utilized to accurately find the height.
There are two primary aims of this study. The first goal is to investigate the effect of liquid loading on the propagating SAWs over a solid surface and how the reflected wave from a defect changes due to the existence of liquid media in the propagation path. The second aim is to investigate the capability of measuring the liquid level that is present on the specimen’s surface via SAWs. Understanding how a liquid influences the SAW signal is essential when the SAWs are utilized in a structural health-monitoring application. It is also vital to estimate the liquid properties if the height and surface parameters are known.

2. Methodology

2.1. Operation Principle

When the surface acoustic wave (SAW) arrives at the first point of contact between the liquid and solid surface, some energy radiates into liquid due to the difference in the acoustic impedance between the two media. The acoustic impedance strongly depends on the density and velocity of the medium, where the density is much higher in solids than in liquids.
Z = ρ c
where Z is the acoustic impedance (rayl/m2), ρ is the density of medium (kg/m3), and c is the sound speed through the material (m/s). The reflection coefficient can be expressed in Equation (2):
R = ρ 2 C 2 ρ 1 C 1 ρ 1 C 1 + ρ 2 C 2
Along the liquid–solid interface, the wave propagates as a leaky Rayleigh wave (LRW) with a higher velocity compared to the SAW (Rayleigh wave), and its amplitude decays, since energy continues radiating into the liquid [1,2,3]. Due to the difference in the speed of sound between the liquid and leaky Rayleigh wave, the wave at the interface is refracted from the solid to the liquid at angle θ1 with respect to the normal axis. Besides, the shear wave cannot be supported in the liquid layer [29].
The leaky Rayleigh wave velocity, which depends on the types of the two materials at the interface, can be found through experimentation. For example, the speed of sound was experimentally measured for the air–aluminum interface as 2964 m/s, whereas the SAW for aluminum is 2952 m/s [1]. In this study, we experimentally obtained the leaky Rayleigh wave velocity, which is presented in the experiment results section.
The refraction angle θ1 can be estimated by substituting the longitudinal wave velocity of deionized water (CLw), the leaky Rayleigh wave velocity (CLR), and the propagation angle of the SAW (θR) into Snell’s law (see Appendix A).
Once the refracted wave in the liquid reaches the liquid–air boundary, it is reflected with angle θ2 with respect to the normal axis at the interface due to the large difference in the speed of sound for the two media. Hence, no refraction occurs into the air, and Snell’s law can no longer be satisfied. The critical incident angle of liquid can be obtained by substituting θair = 90° and CLw and Cair into Snell’s law (see Appendix A).
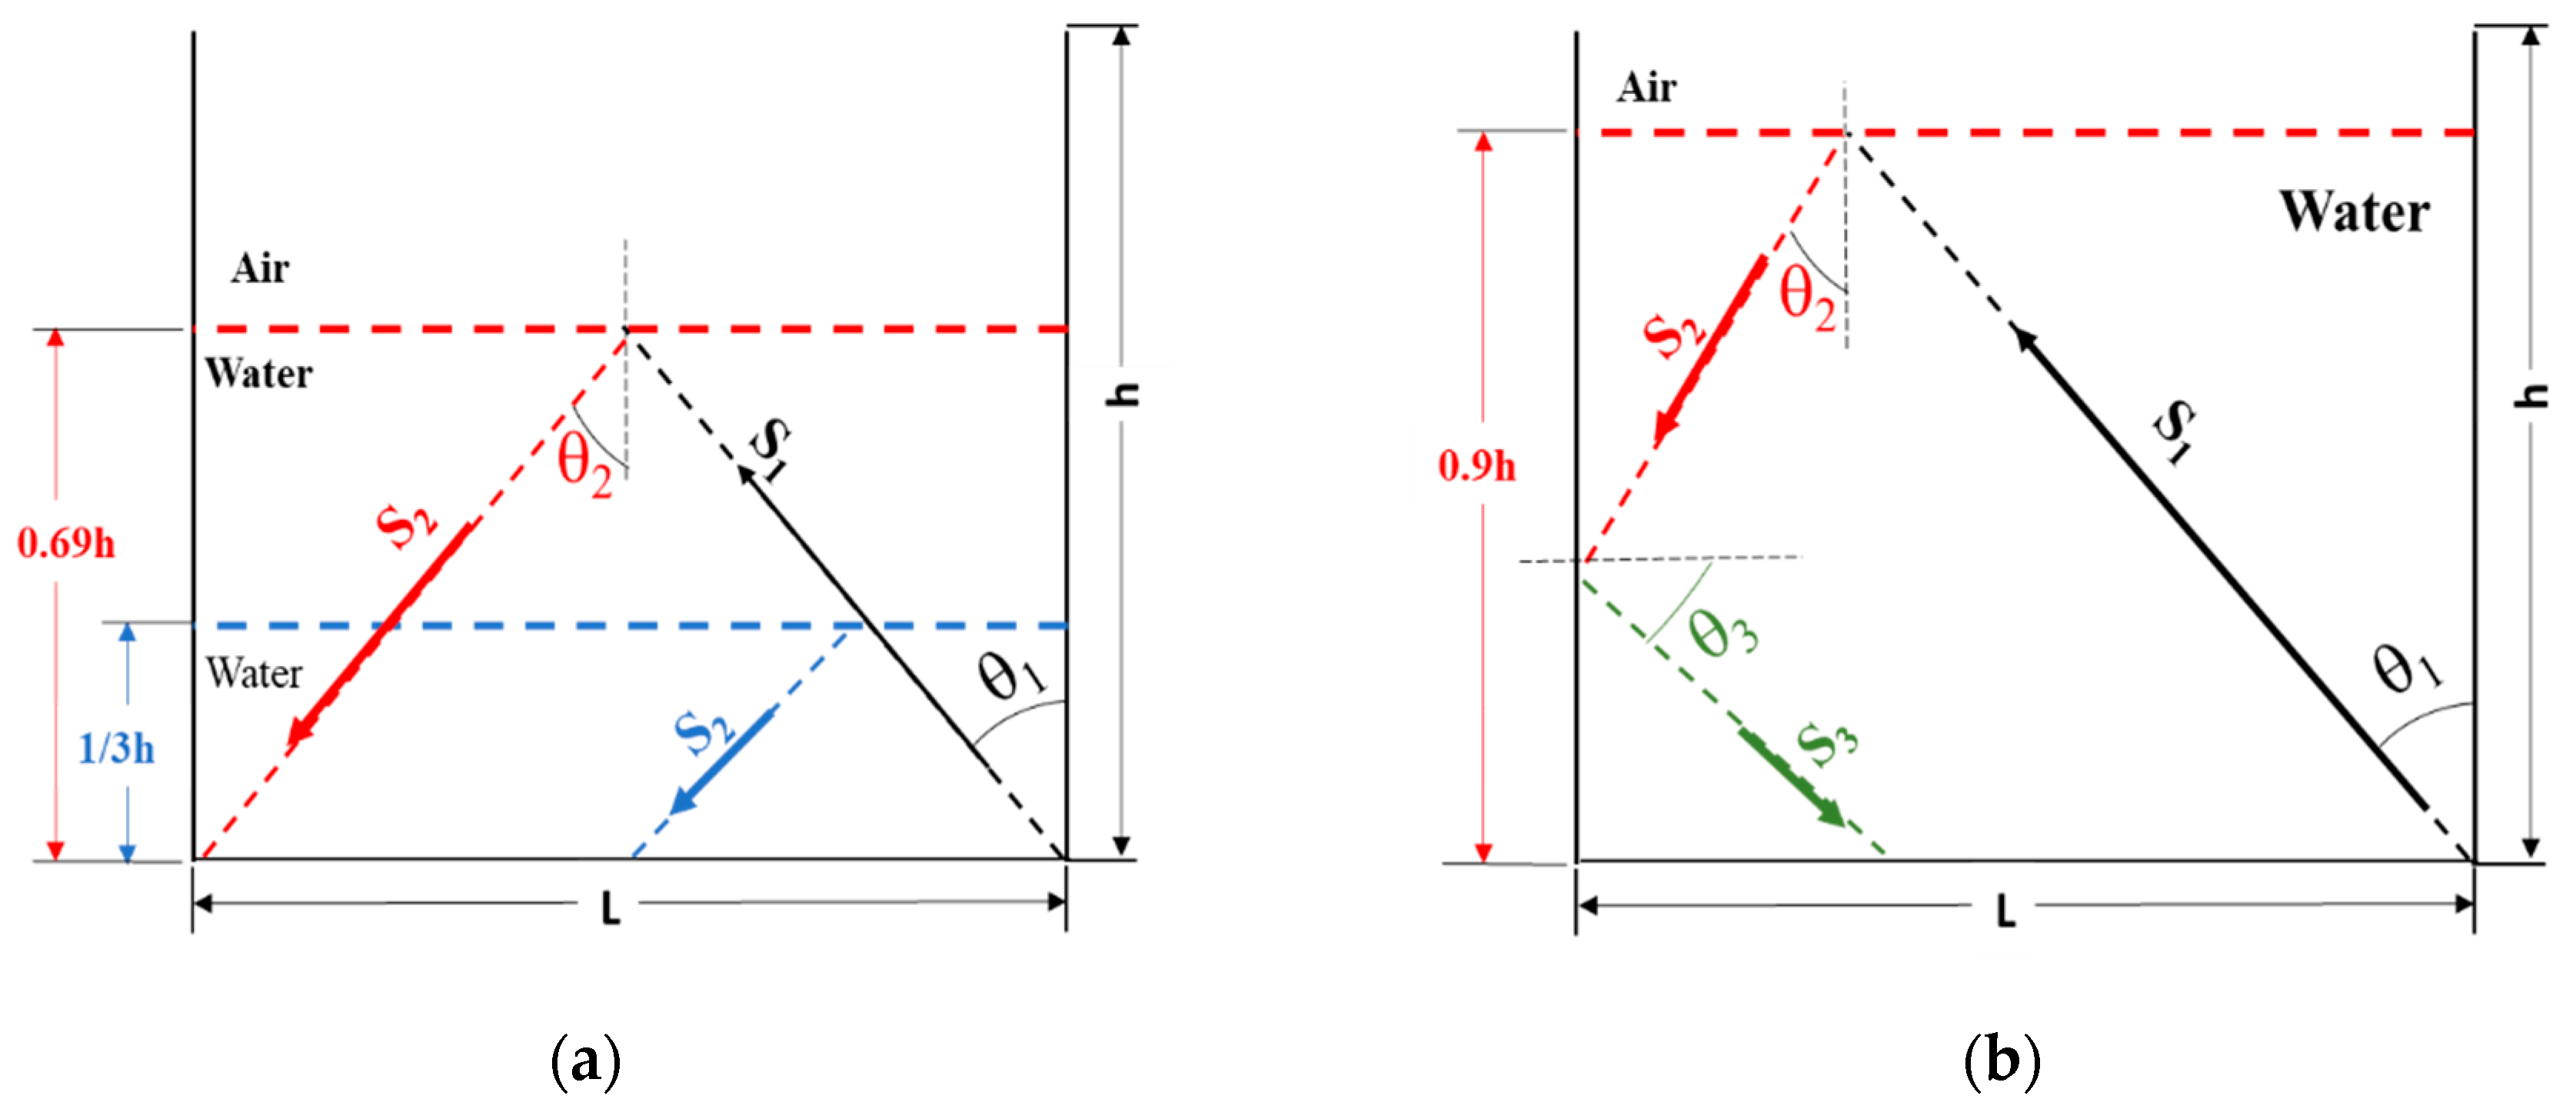
If the incident angle from the liquid is higher than the critical angle, the wave will be reflected entirely at the liquid–air interface, as illustrated in Figure 1a. If the incident angle from the liquid is equal to the critical angle, the refracted wave travels parallel to the interface between the air and liquid, as shown in Figure 1b. In this study, as the θ1 >> critical, the wave will be reflected with angle θ2, which is equal to θ1, as illustrated in Figure 1a.

2.2. Liquid Height Estimation

The liquid height can be estimated by using the arrival time of the leaky Rayleigh wave (tA), which occurs at the solid–fluid interface, and the arrival time of the reflected wave from the top surface of the fluid (tB). Besides these values, the theoretical speed of sound for the fluid and the refraction angle at the interface (θ1) are used in determining the liquid height.
Since the liquid is held in a finite container, two cases are expected to exist, as shown in Figure 2. The first case occurs when the propagating wave in the liquid hits the liquid–air boundary and reflects directly to the solid–liquid interface. By contrast, in the second case, the reflected wave hits the container edge before reaching the solid–liquid interface. These two cases rely mainly on the ratio of the liquid height to the particular container dimensions. Based on the calculation of incident angle θ1, θ3, and the geometric dimensions of the container, the first case occurs if the height is approximately in the range of (0 < h < 0.86 L). By contrast, the second case occurs if the height is higher than 0.86 L.
The total distance the propagating wave travels in the media is S1 + S2, as illustrated in Figure 2a. S1 and S2 are the distances traveled by the incident wave from the solid–liquid interface (upward) and liquid–air interface (downward), respectively, and L is the actual length of the container. Since the incident angle from the liquid (θ1) and the reflected angle at the liquid-air interface (θ2) are equal, S1 = S2. For the experimental tests, the total distance traveled by a propagating wave in a medium can be expressed as:
S 1 + S 2 = C L w × ( t B t A )
where tB is the arrival time of the reflected wave from the liquid–air interface, and tA is the arrival time of a leaky Rayleigh wave at the solid–liquid interface. For accuracy purposes, both arrival times should be chosen at the same phase. By substituting S1 = S2 into Equation (3), we get
2 S 1 = C L w × ( t B t A )
From the geometry, the liquid height can be determined as:
S 1 = h cos ( θ 1 )
Substituting Equation (4) into Equation (5), we get:
h = C L w 2 × ( t B t A ) × cos ( θ 1 )
As can be observed from Equation (6), the liquid height is a function of CLw, the traveling time and the incident angle at the solid–liquid interface. The derivation of the equations for the second case can be found in Appendix A.

2.3. Experimental Setup

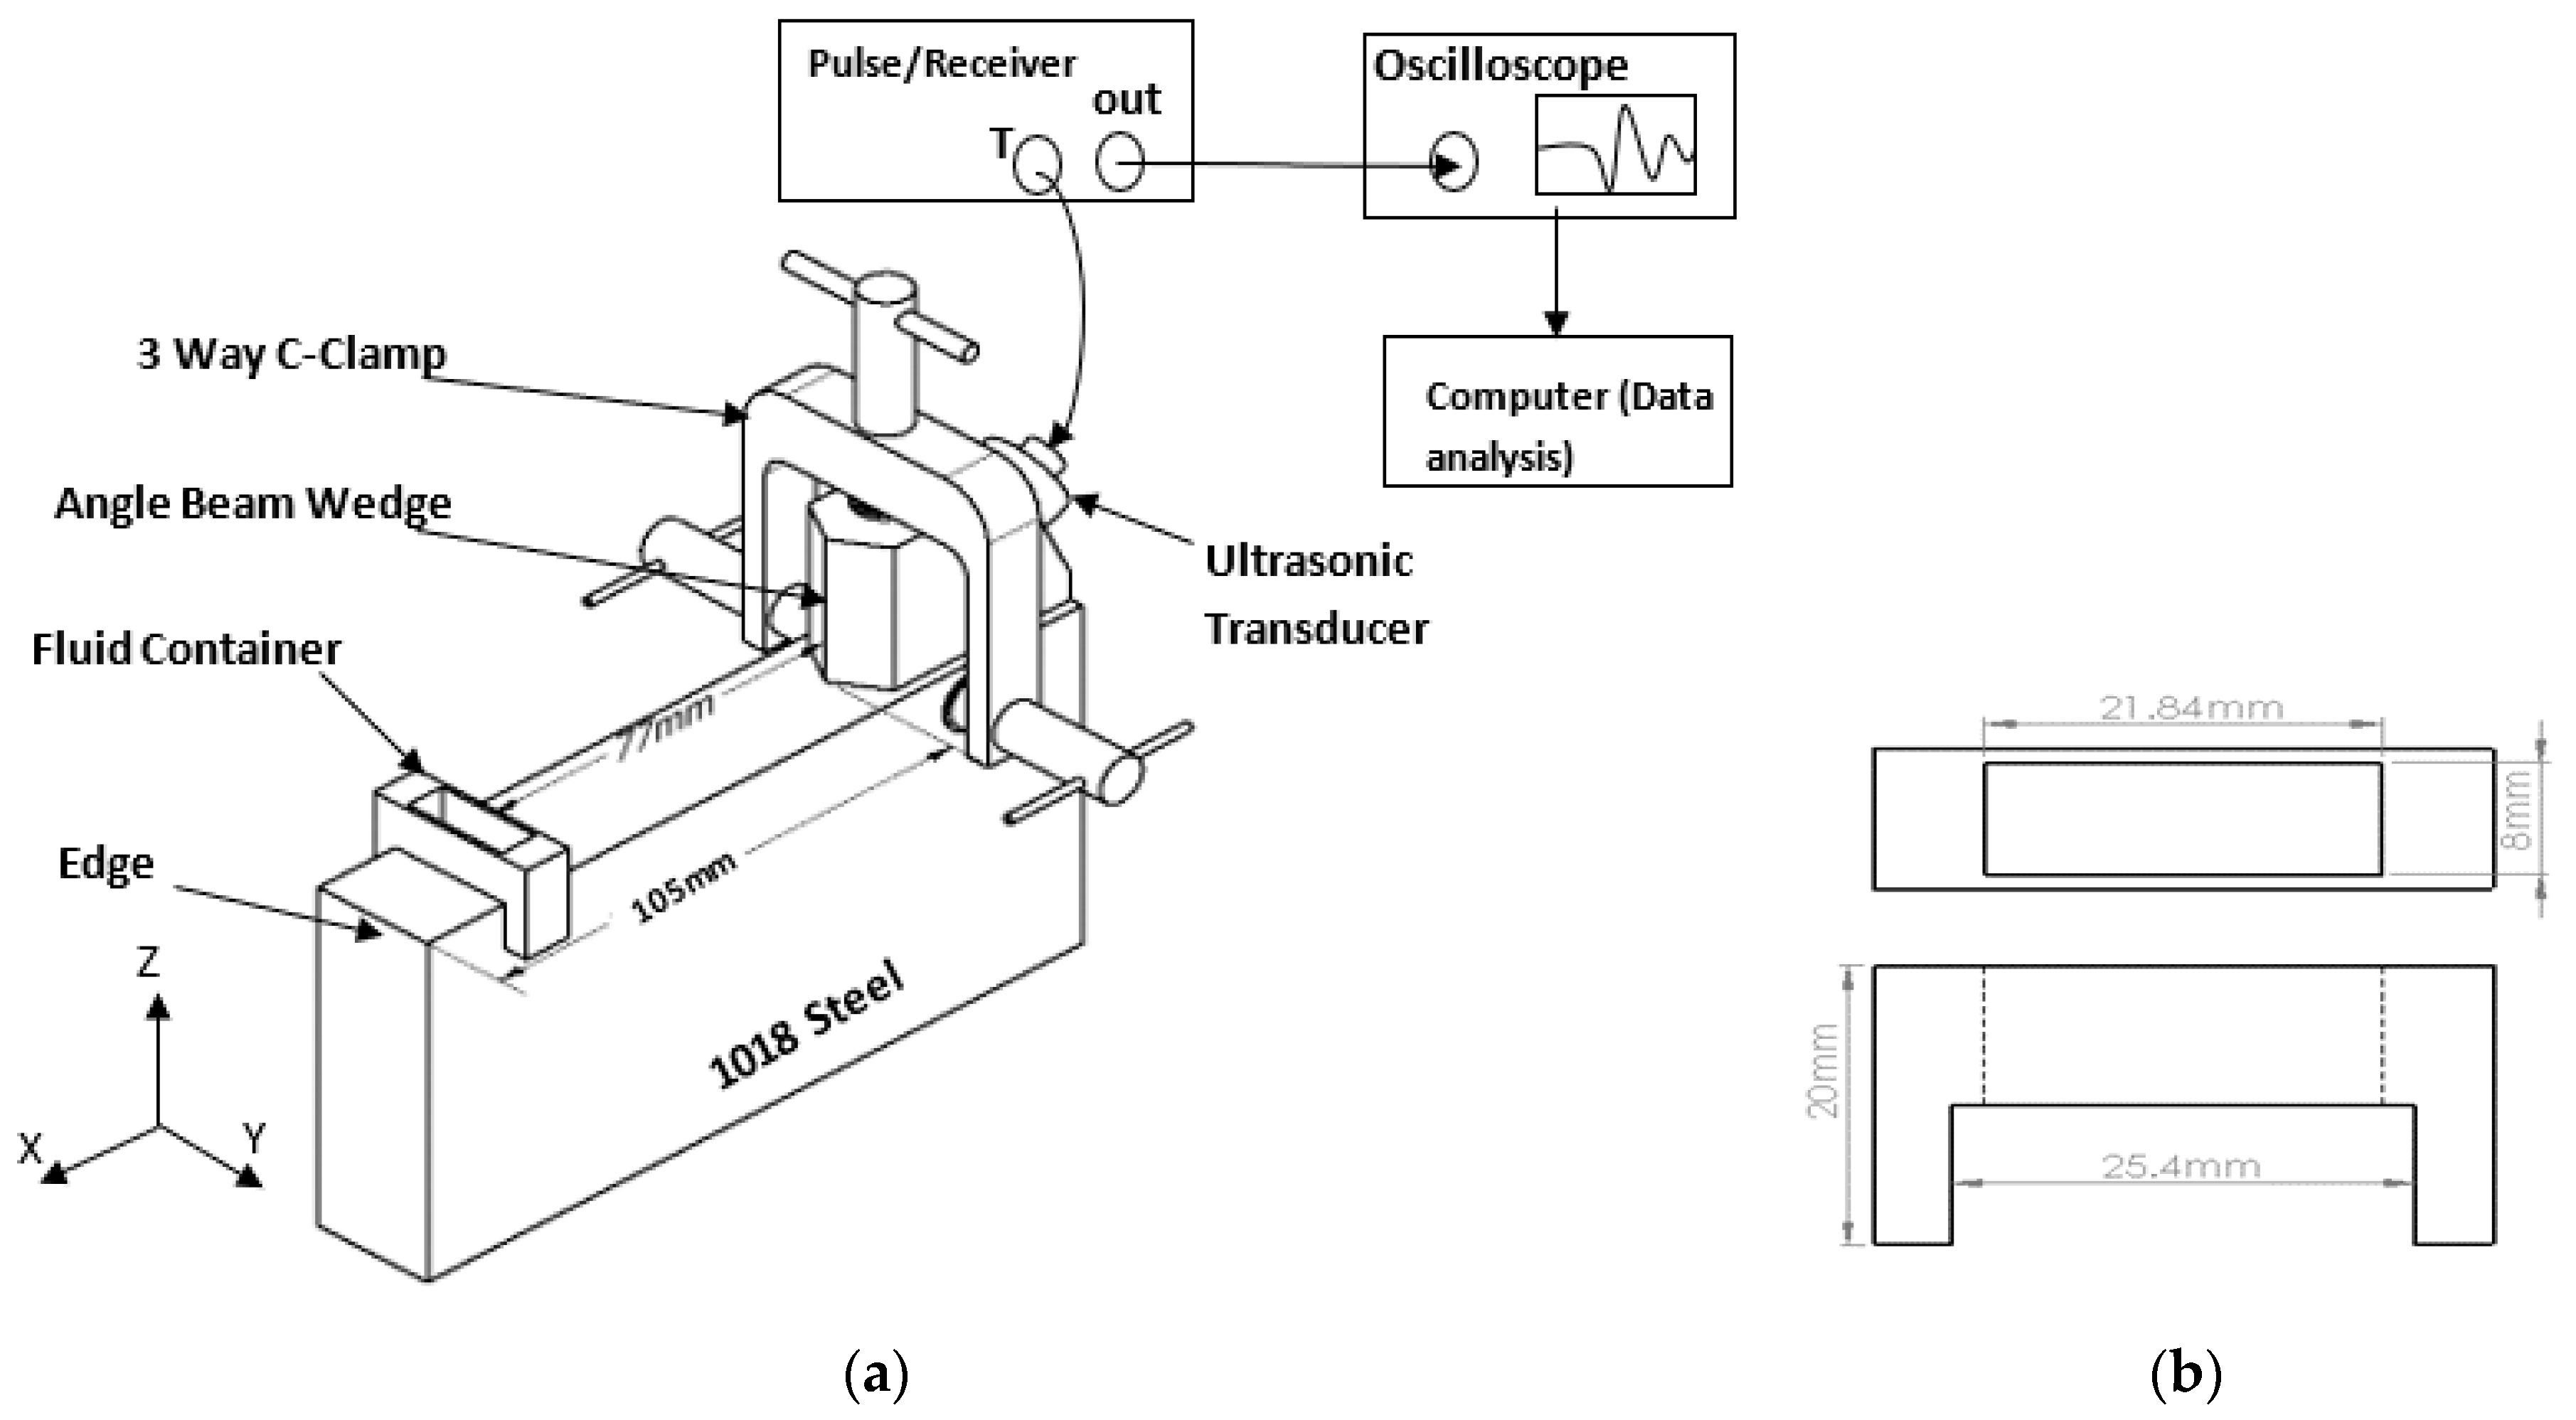
The pulse-echo technique is utilized in this study, in which an ultrasonic wave is generated and received through using only one transducer. The generation of a SAW (Rayleigh wave) that propagates on the free surface of a solid specimen requires using a normal beam transducer, a comb transducer, or a transducer that is attached to an angle beam wedge placed on the specimen’s surface. The purpose of the angle beam wedge is to convert the longitudinal wave generated via the ultrasonic transducer into a Rayleigh wave at the interface between the wedge surface and the specimen’s surface [30]. Snell’s law should be considered to calculate the appropriate incident angle inside the wedge to achieve the desired angle of SAW propagation (90°). As illustrated in Figure 3, the angle beam wedge (ABWML-5T 90, Olympus NDT, Waltham, MA, USA) used in this experiment is made of plastic (Lucite), with a longitudinal wave velocity of 2700 m/s. By substituting the longitudinal velocity of the wedge and the theoretical Rayleigh wave velocity for a 1018 steel (2953 m/s) into Snell’s law, the incident angle inside the wedge is found to be 66.12°.
The ultrasonic pulser/receiver (5072PR, Olympus NDT, Waltham, MA, USA) is utilized to excite a pulse to a 5 MHz transducer (C541-SM, Olympus NDT, Waltham, MA, USA), which is attached to the angle beam wedge. The received signal can then be amplified before it is transferred to a digital oscilloscope. The amplifier is built in the pulser/receiver, which can be used to control either the gain (+dB) or the attenuation (−dB) of the received signal. The pulser/receiver has a low pass filter at 10 MHz and a high pass filter at 1 MHz. The signal is recorded with 128 averaging to increase the signal-to-noise ratio with a digital Oscilloscope (TDS2001C, Tektronix, Beaverton, OH, USA). The sampling time rate was kept constant at 25 µs for the 5 MHz transducer in all recorded signals to avoid aliasing. The pulser/receiver settings are listed in Table 1.
The containers were filled with a precise amount of deionized (DI) water via an Eppendorf Research Pipette that can hold 0 to 100 µL of liquid. The pipette’s accuracy was verified by dropping 100 µL of DI water onto a sensitive scale (Scaout Pro SP402, Ohaus Inc., Parsippany, NJ, USA), and the obtained reading on the scale was used for calibration. The 3D-printed containers, which fit on the specimen’s surface, are made of Polylactic Acid material (PLA). The geometric dimensions of the container are 10 mm × 22 mm × 8 mm. To measure the actual covered area by the liquid, the container is fully occupied with liquid (2000 mm3) and then the volume is divided by the height of the container (10 mm), which gives the area as 200 mm2. The primary purpose of using the container is to maintain the consistency of the area covered by liquid while recording the signal. Initial sets of experiments were conducted to verify that placing the container on the free surface of the specimen had no impact on the propagation of the SAWs. The experiment results confirm that there is no reflection from the containers, since the interface between the specimen’s surface and the container has no real area of contact. The distance between the container and transducer was selected to be 77 mm, which ensured that the container was placed beyond the near field distance (N), which can be estimated using Equation (7).
N = D 2 f 4 C
where D is the transducer diameter, f is the signal frequency, and C is material sound speed. Substituting D = 12.7 mm (0.5 in), f = 5 MHz, and C = 2953 m/s (Rayleigh wave speed) into equation, the near field distance (N) will be 68.27 mm. The material properties for DI water, air, the PLA material, and 1081 steel are listed in Table 2.
The experimental procedure is as follows. First, the angle beam wedge is placed on the specimen surface after applying an ultrasonic couplant between the two surfaces to facilitate the ultrasonic wave transmission and reception from the wedge on the specimen surface and vice versa. A three-way C-clamp is used to ensure the wedge remains stationary throughout the experiment and to provide adequate contact between the specimen surface and wedge. Next, the container is placed on the free surface of the specimen (1018 Steel) 77 mm from the wedge tip, whereas the edge is 105 mm from the angle beam wedge. The container area in contact with the specimen is wrapped with a thread sealing tape to prevent the medium from leaking. The reflected signal from the edge for the empty container is selected as the reference for the experimental studies. Thirty seconds after filling the container with DI water, the received signal reflected from the edge of the specimen and the liquid are recorded separately to assist in the data analysis process. The data collection step is repeated for all the different liquid volumes investigated.
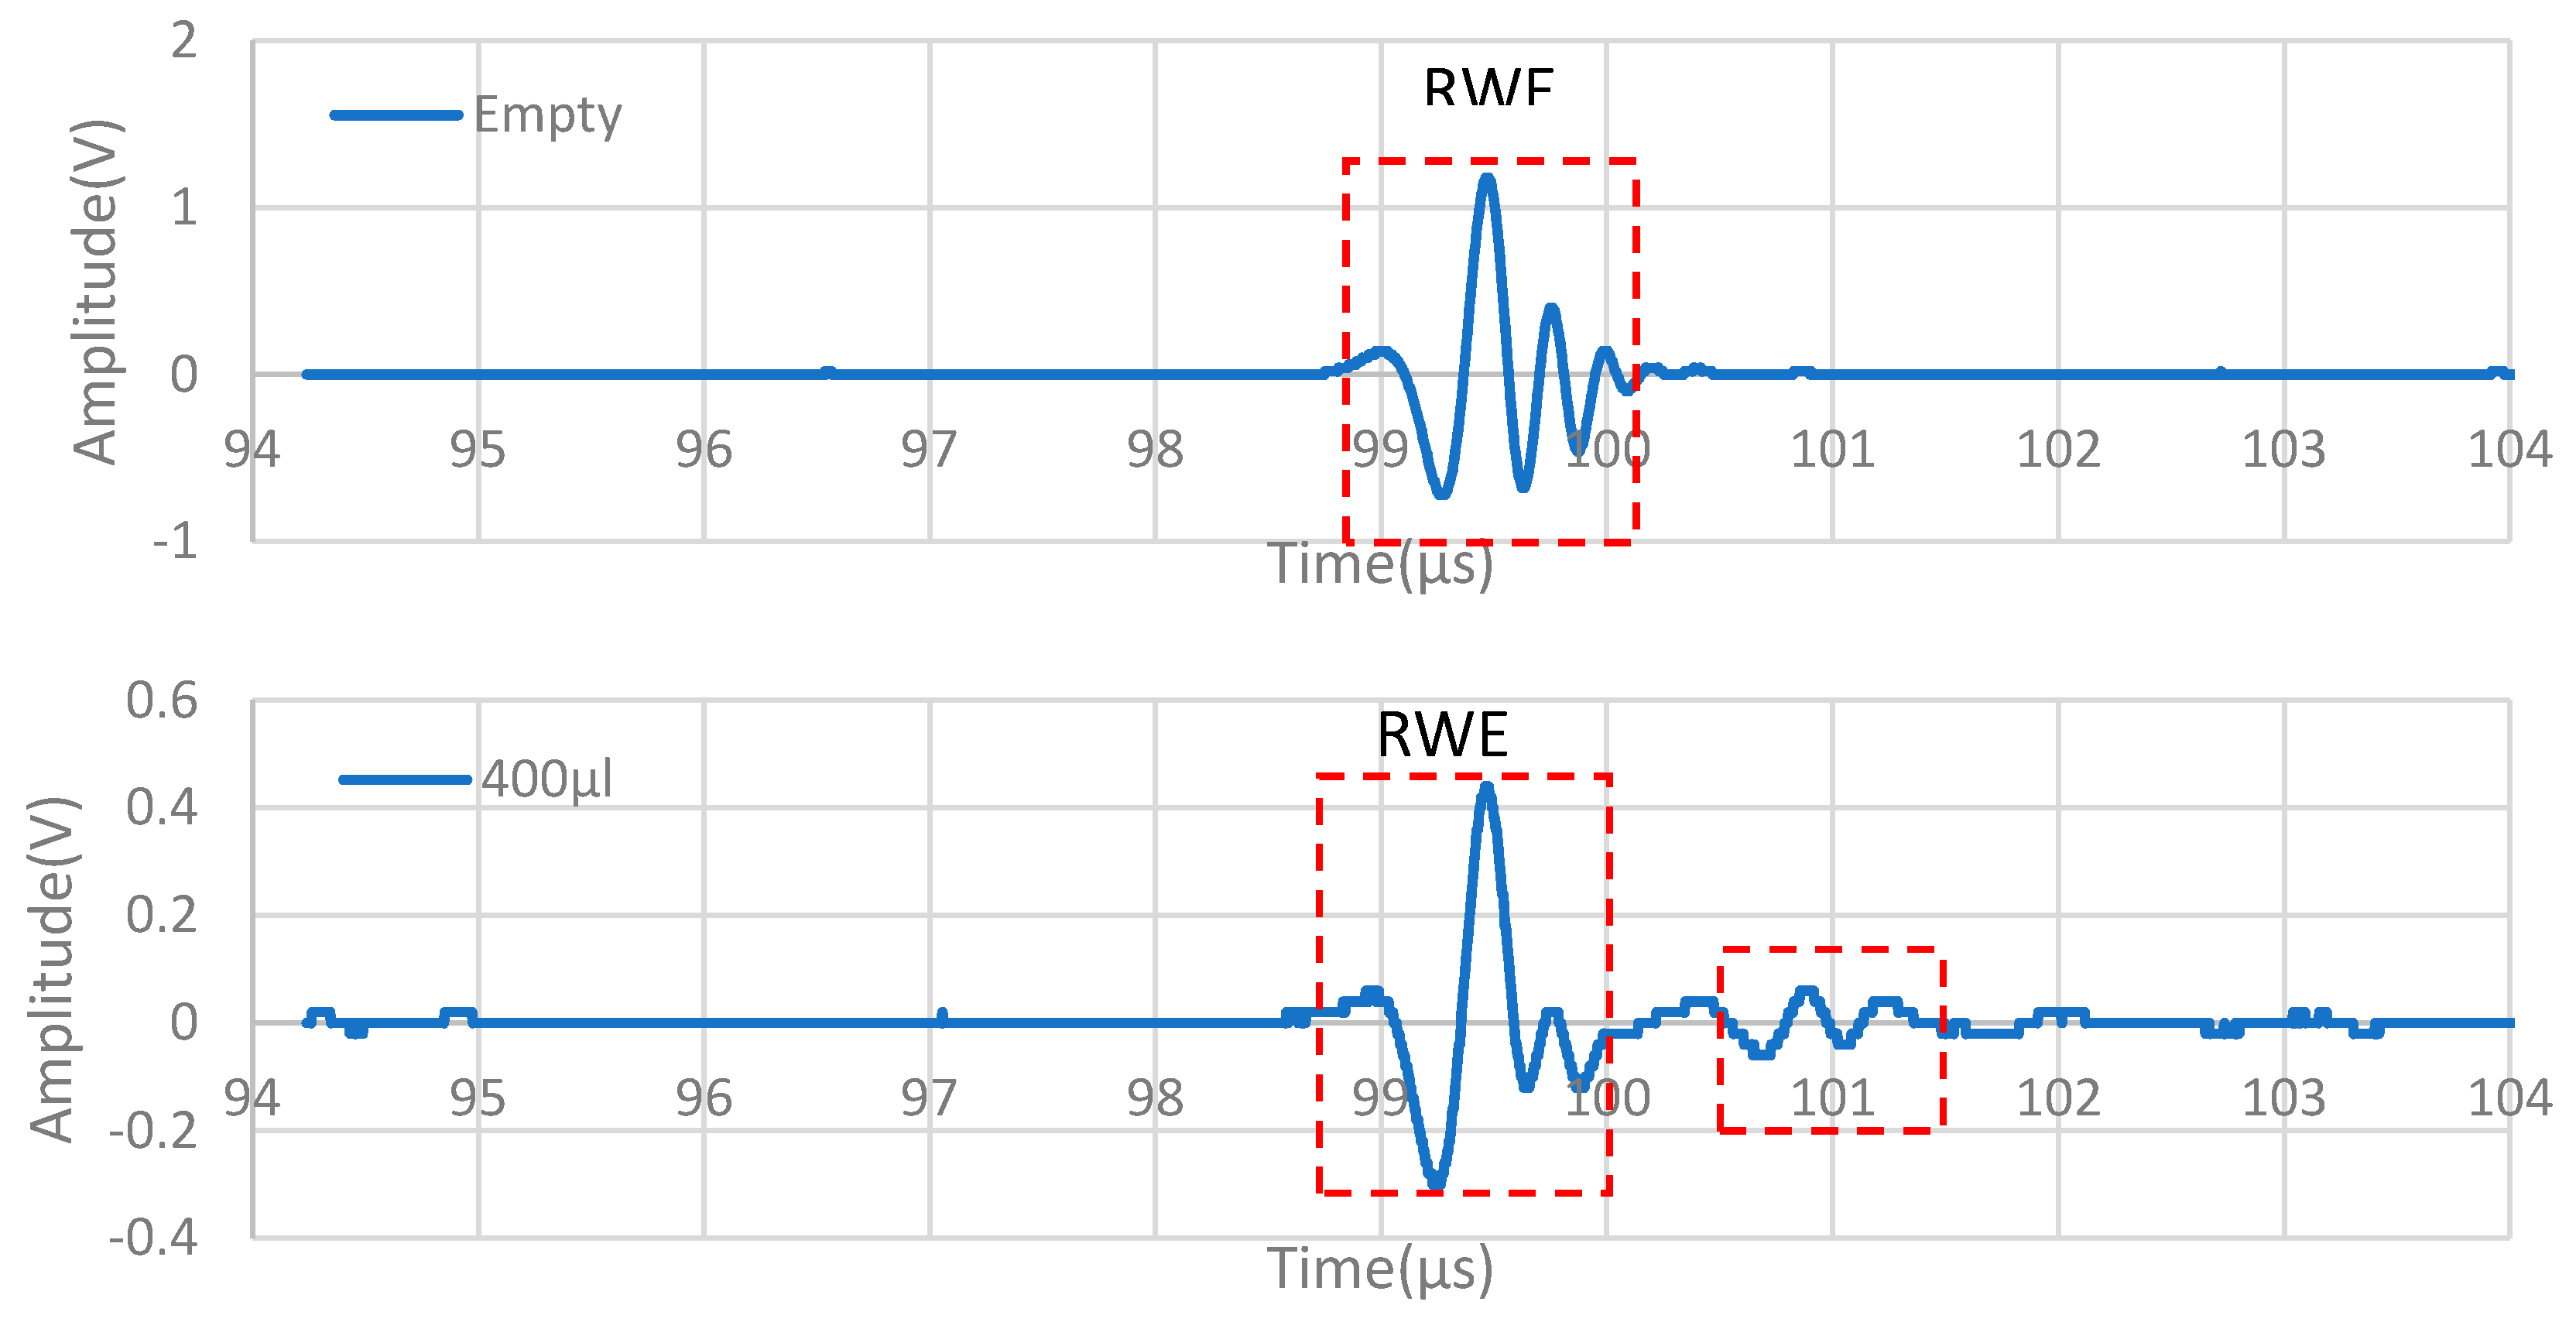
The entire signal for the empty container is shown in Figure 4. It can be observed from this figure that reflection from the wedge-specimen interface is present at 29.2 µs in the data, and the reflection from the specimen edge is at time 99 µs. Based on the experimental observation after filling the container with liquid, the reflection of the wave from the medium will take place right after 80 µs. For better comparison among all cases, we decided to have two separate windows for the received signal shown on the Oscilloscope, one for the reflection from the specimen edge (RWE) and the other one for the reflection from the liquid (RWL) as shown in Figure 4.

3. Results and Discussion

3.1. The Effect of the Presence of Liquid Media on the Propagation Path of the Reflected Wave from a Defect (Edge)

It is imperative to study how the wave reflected from the edge is influenced when a small area of a tested specimen surface is occupied by liquid matter in the propagation path, mainly when the medium is between the transducer and the defect to be detected. In general, the amplitude of SAWs significantly attenuates as the liquid interacts with the solid (solid–liquid interaction) due to the dissipation of the signal energy into the liquid.
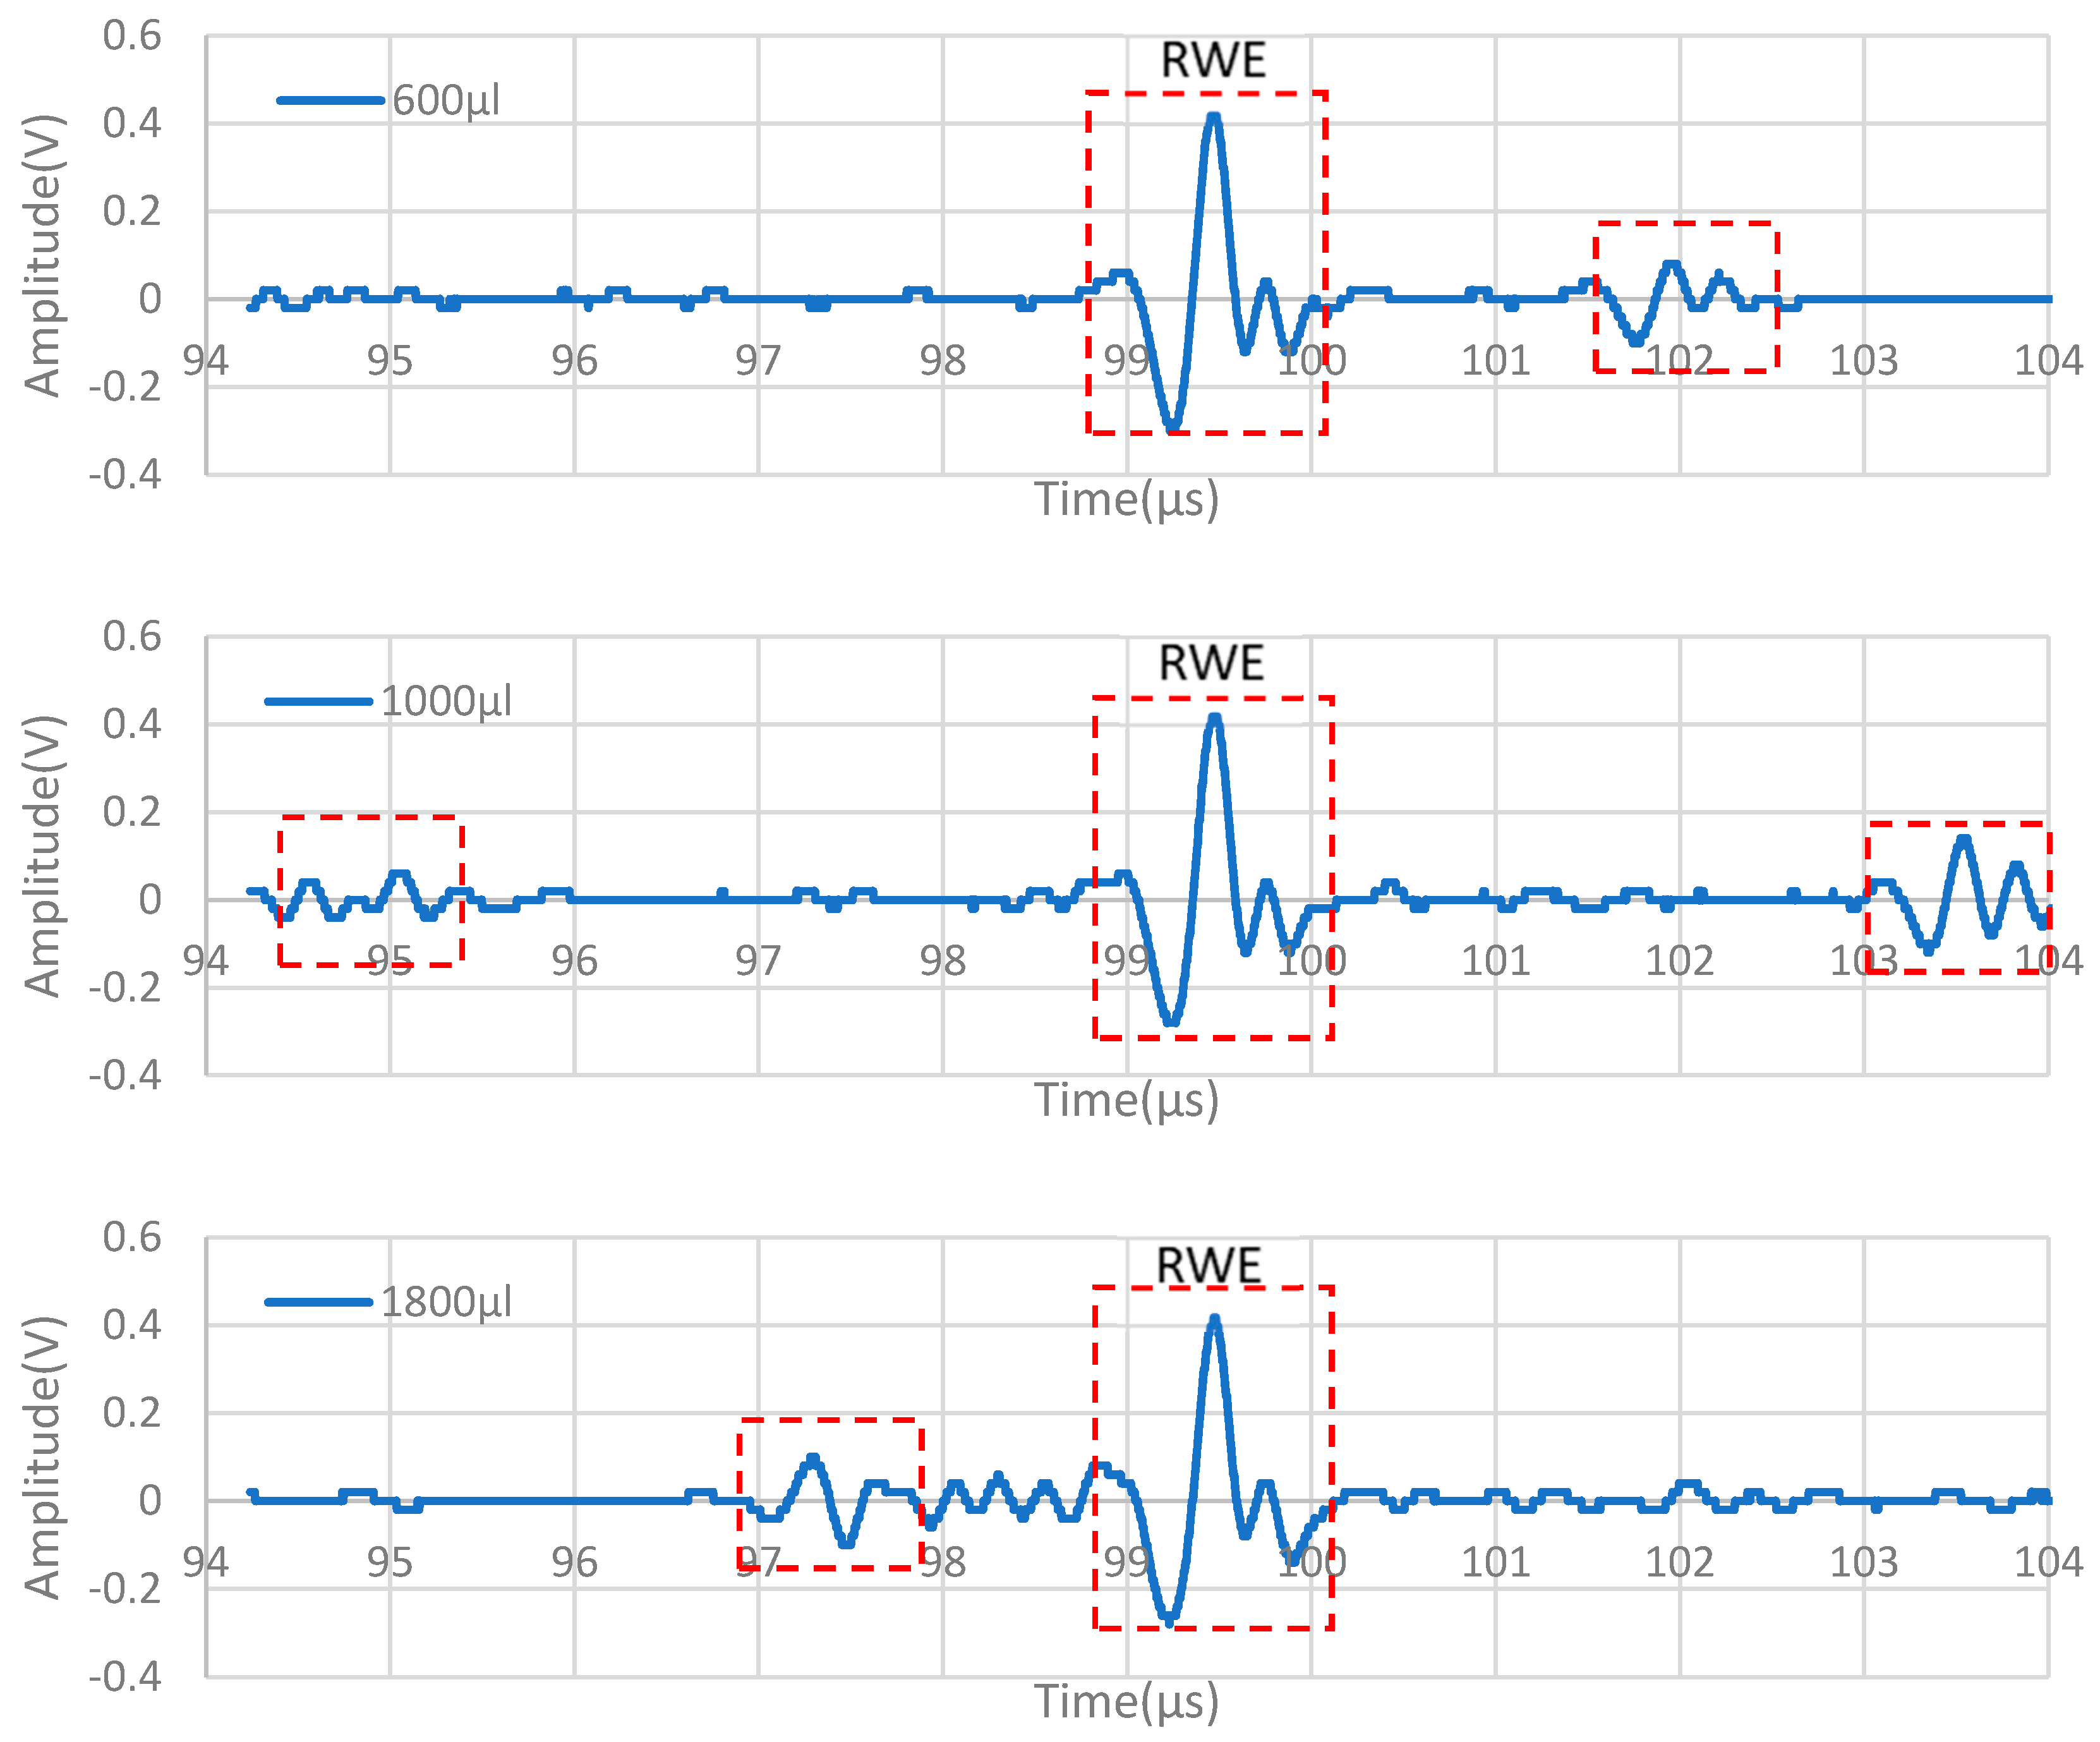
The results indicate that the peak-to-peak amplitude of the reflected wave from the edge declines sharply when 400 µL of DI water is added to the liquid container and slightly decreases or remains almost constant as the liquid volume increases (Figure 5). This indicates that the change in the amplitude is more sensitive to the area than to the liquid volume present in the propagation path.
The average percentage of the peak-to-peak amplitude drop due to liquid exitance was −62.5%, as shown in Table 3. The maximum amplitude of the reflected wave from the edge remains constant in all cases, which occurs at the time of 99.464 µs (TP-RWE). It is important to note that the wave reflected from the defect (edge or corner in this study) was not affected by the presence of DI water on the surface. By utilizing Equation (8)—where vR is the theoretical velocity of the Rayleigh wave in 1018 steel (2953 m/s) and Tp-wedge is the time associated with the maximum reflection at the angle beam wedge, which is 29.2 μs—the obtained distance was 103.74 mm, where the actual distance between the transducer and the edge was 105 mm. The reasonably low 1.9% error herein could be due to the theoretical Rayleigh wave velocity or the measurement accuracy.
d = ( T ( P R W E ) T ( P w e d g e ) ) × v R 2
The results further show that wave packets appear before and after the wave reflected from the edge, and they shift to the right as the volume of liquid increases, as shown in Figure 5. These waves are multiple reflections from the top surface of the liquid. The shift in time occurs because the reflected wave travels longer in liquid as the height of liquid increases.

3.2. The Reflected Wave from the Liquid on the Propagation Path

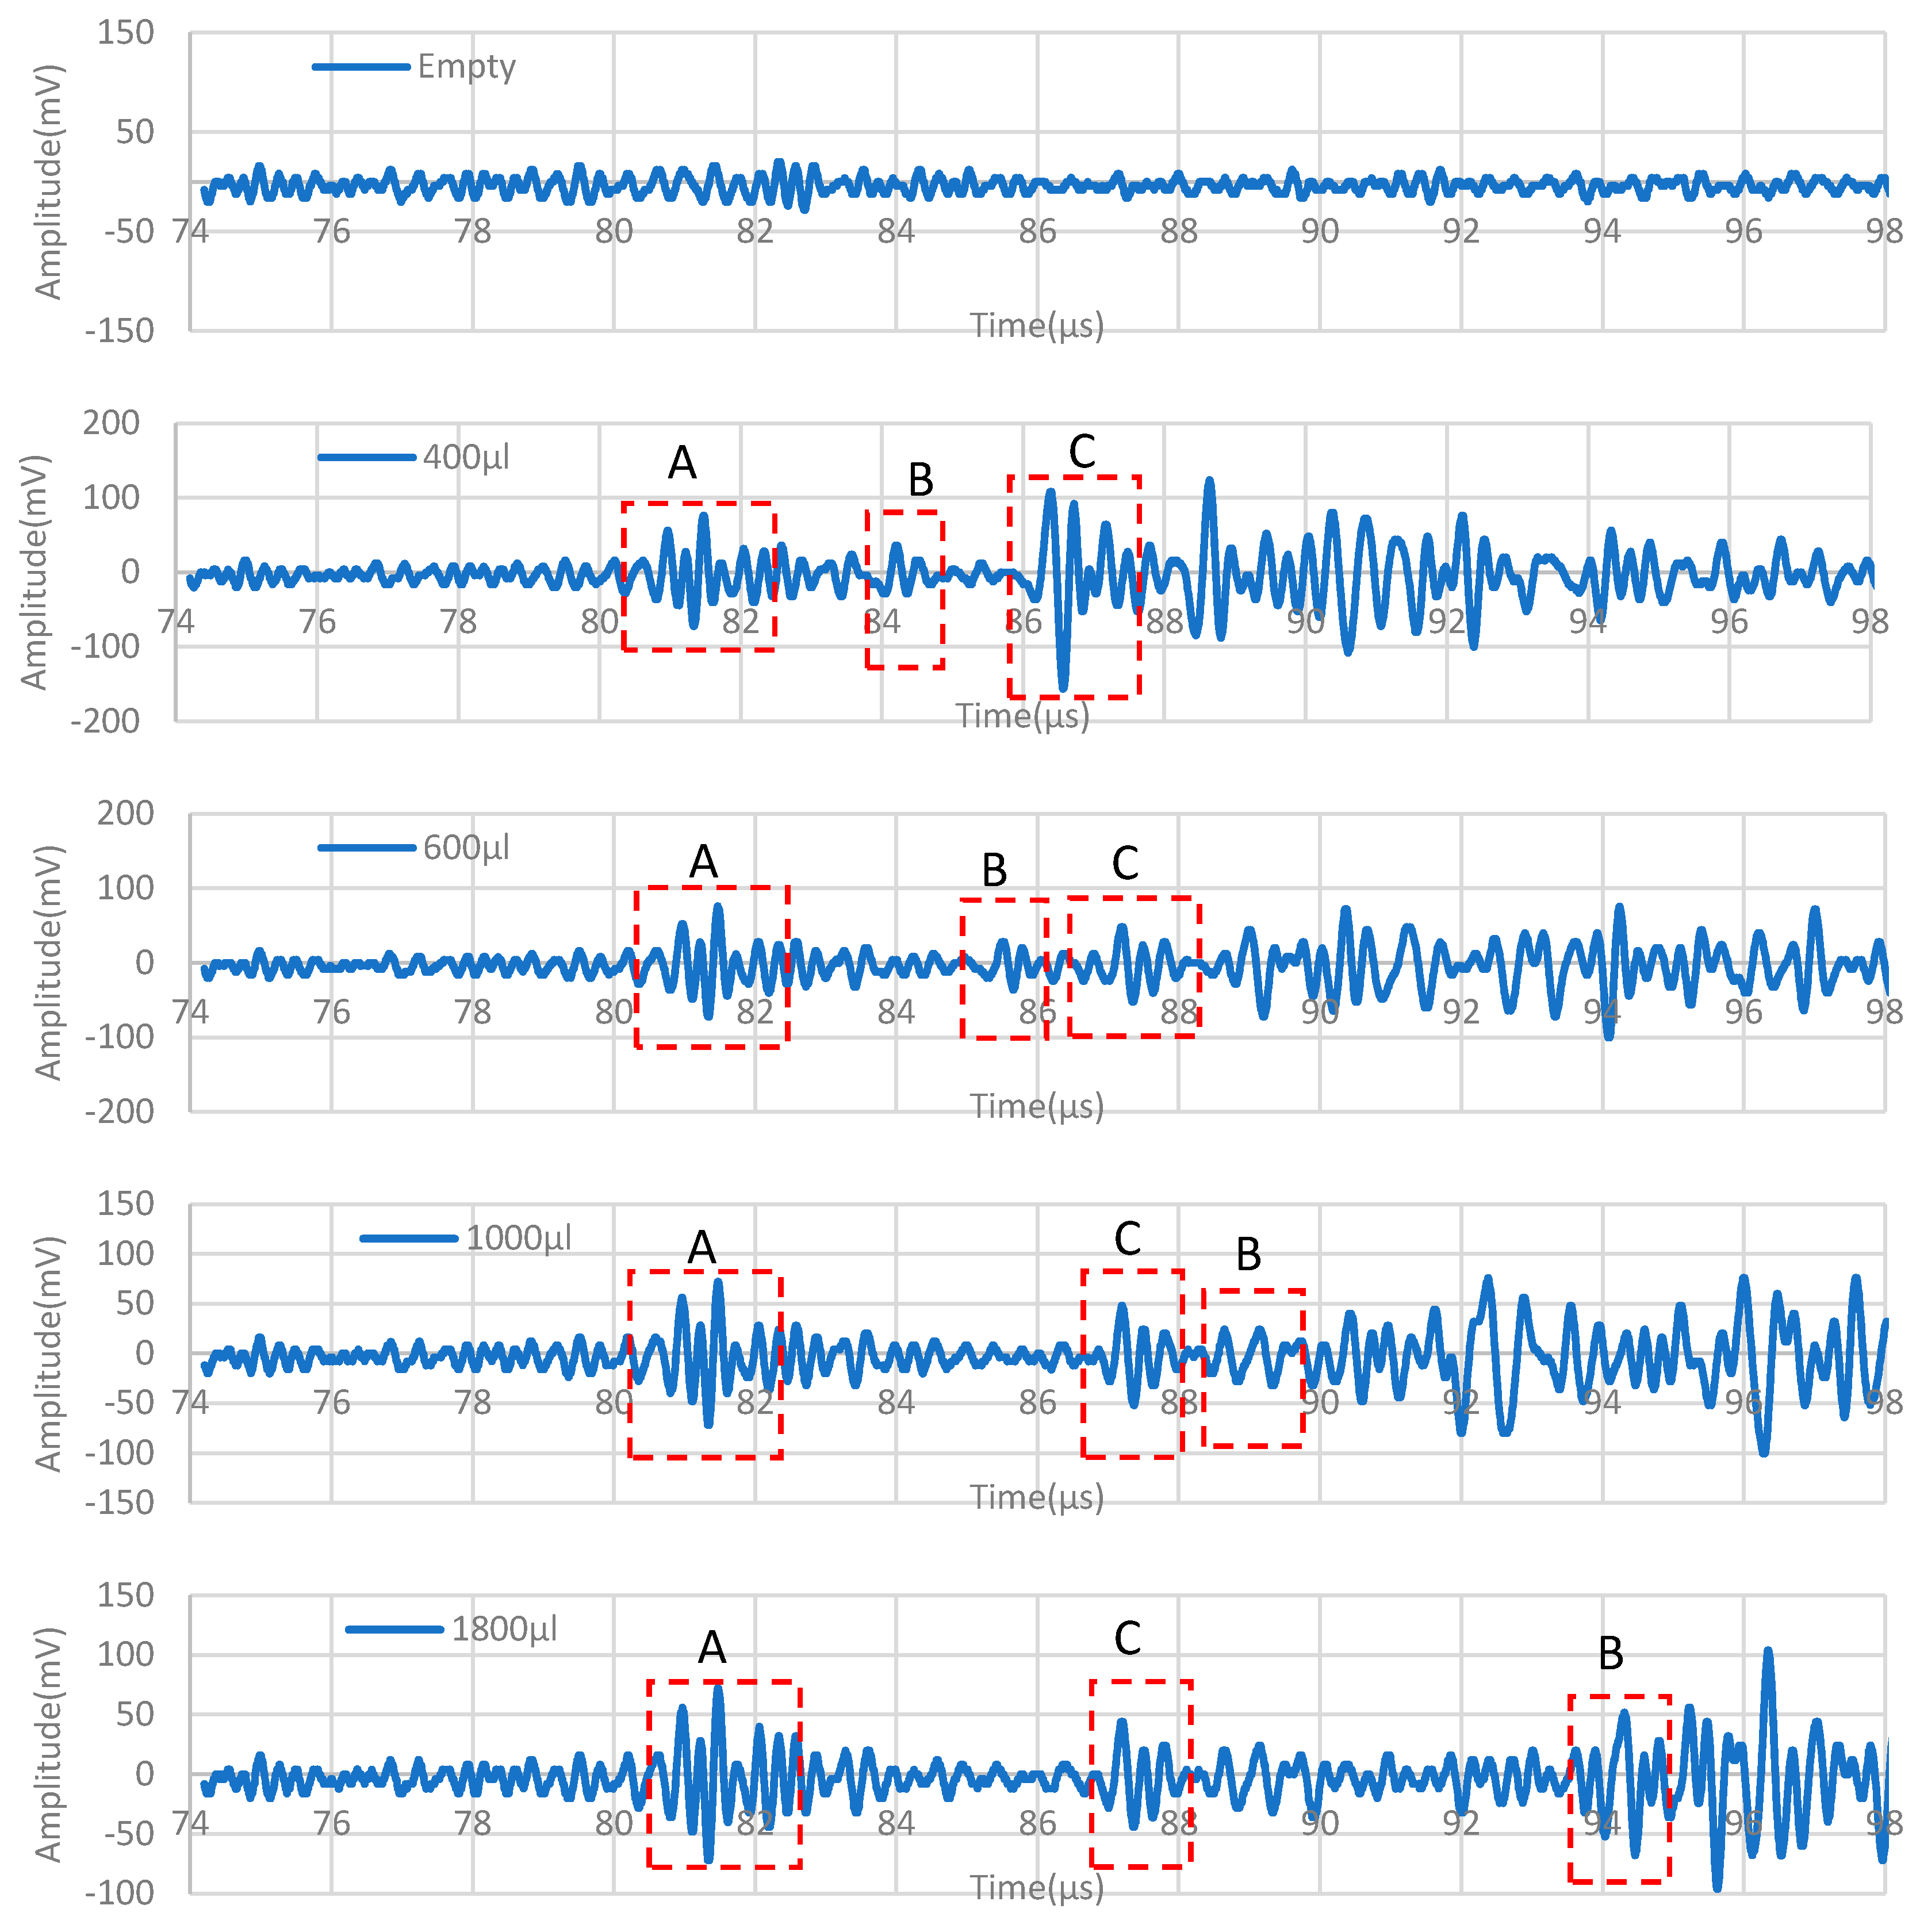
Figure 6 shows the time-domain responses of the wave reflected from the DI water for all the volumes investigated. Based on observations of the exact location of reflections from the liquid, a window between the times of 74 and 98 μs was selected, which covers the region before the RWE. By choosing this window, not only can the first reflected wave from the liquid be easily detected, but the behavior of the reflected signal can also be precisely analyzed, for example, the peak-to-peak amplitude of the reflected wave from the liquid. During the experiments, we carefully analyzed the obtained time-domain signal of each case. In order to ensure the reflection of the signal was coming from the top surface of the fluid, we disturbed the top surface with a needle, and it was observed that the amplitude of the reflection died out. The dotted box (A), the dotted box (B), and the dotted box (C) in Figure 6. represent the first leaky Rayleigh wave at the solid–liquid interface at the beginning of the container, the first reflected wave from the top surface of the liquid, and the second leaky Rayleigh wave at the end of the container, respectively.
From the results of all the cases, it can be noted that the amplitude of the signal dramatically changes when the container is filled with 400 μL of liquid around the time of 80.96 µs, as seen in Figure 6. One can observe that the amplitude of the leaky Rayleigh wave is attenuated as it travels along the solid–liquid interface in all cases except one case (400 µL). The velocity of the leaky Rayleigh wave at the beginning of the container can be obtained by utilizing Equation (8), where the maximum amplitude occurs at the time of 80.96 µs, the actual distance between the transducer and container is 77 mm, and the time at the wedge is 29.2 µs. Hence, the velocity obtained is 2975 m/s. The results further show that the first reflected wave from the top surface of the liquid arrives earlier than the first leaky Rayleigh wave in the cases of 400 µL and 600 µL, whereas it arrives later than the first leaky Rayleigh wave in the case of 1000 µL and 1800 µL. The reason for that is that the total distance of the upward and downward propagating longitudinal waves in the liquid layer for 400 µL and 600 µL is less than that for the reaming cases (1000 µL and 1800 µL).

3.3. Estimating Liquid Height

The arrival times of the reflected waves from the liquid are listed in Table 4 for clarity. By substituting these times into Equations (3) and (6), the total traveled distance in the liquid (S1 + S2) and h are obtained for all cases. The actual liquid height is obtained from the relationship between the liquid volume and the cross-sectional area of the liquid, which is 200 mm2. The purpose of this section is to validate the feasibility of the method by comparing the obtained height from Equation (6) with the actual height of the fluid measured. Additionally, the obtained speed of sound for water is compared with its theoretical value.
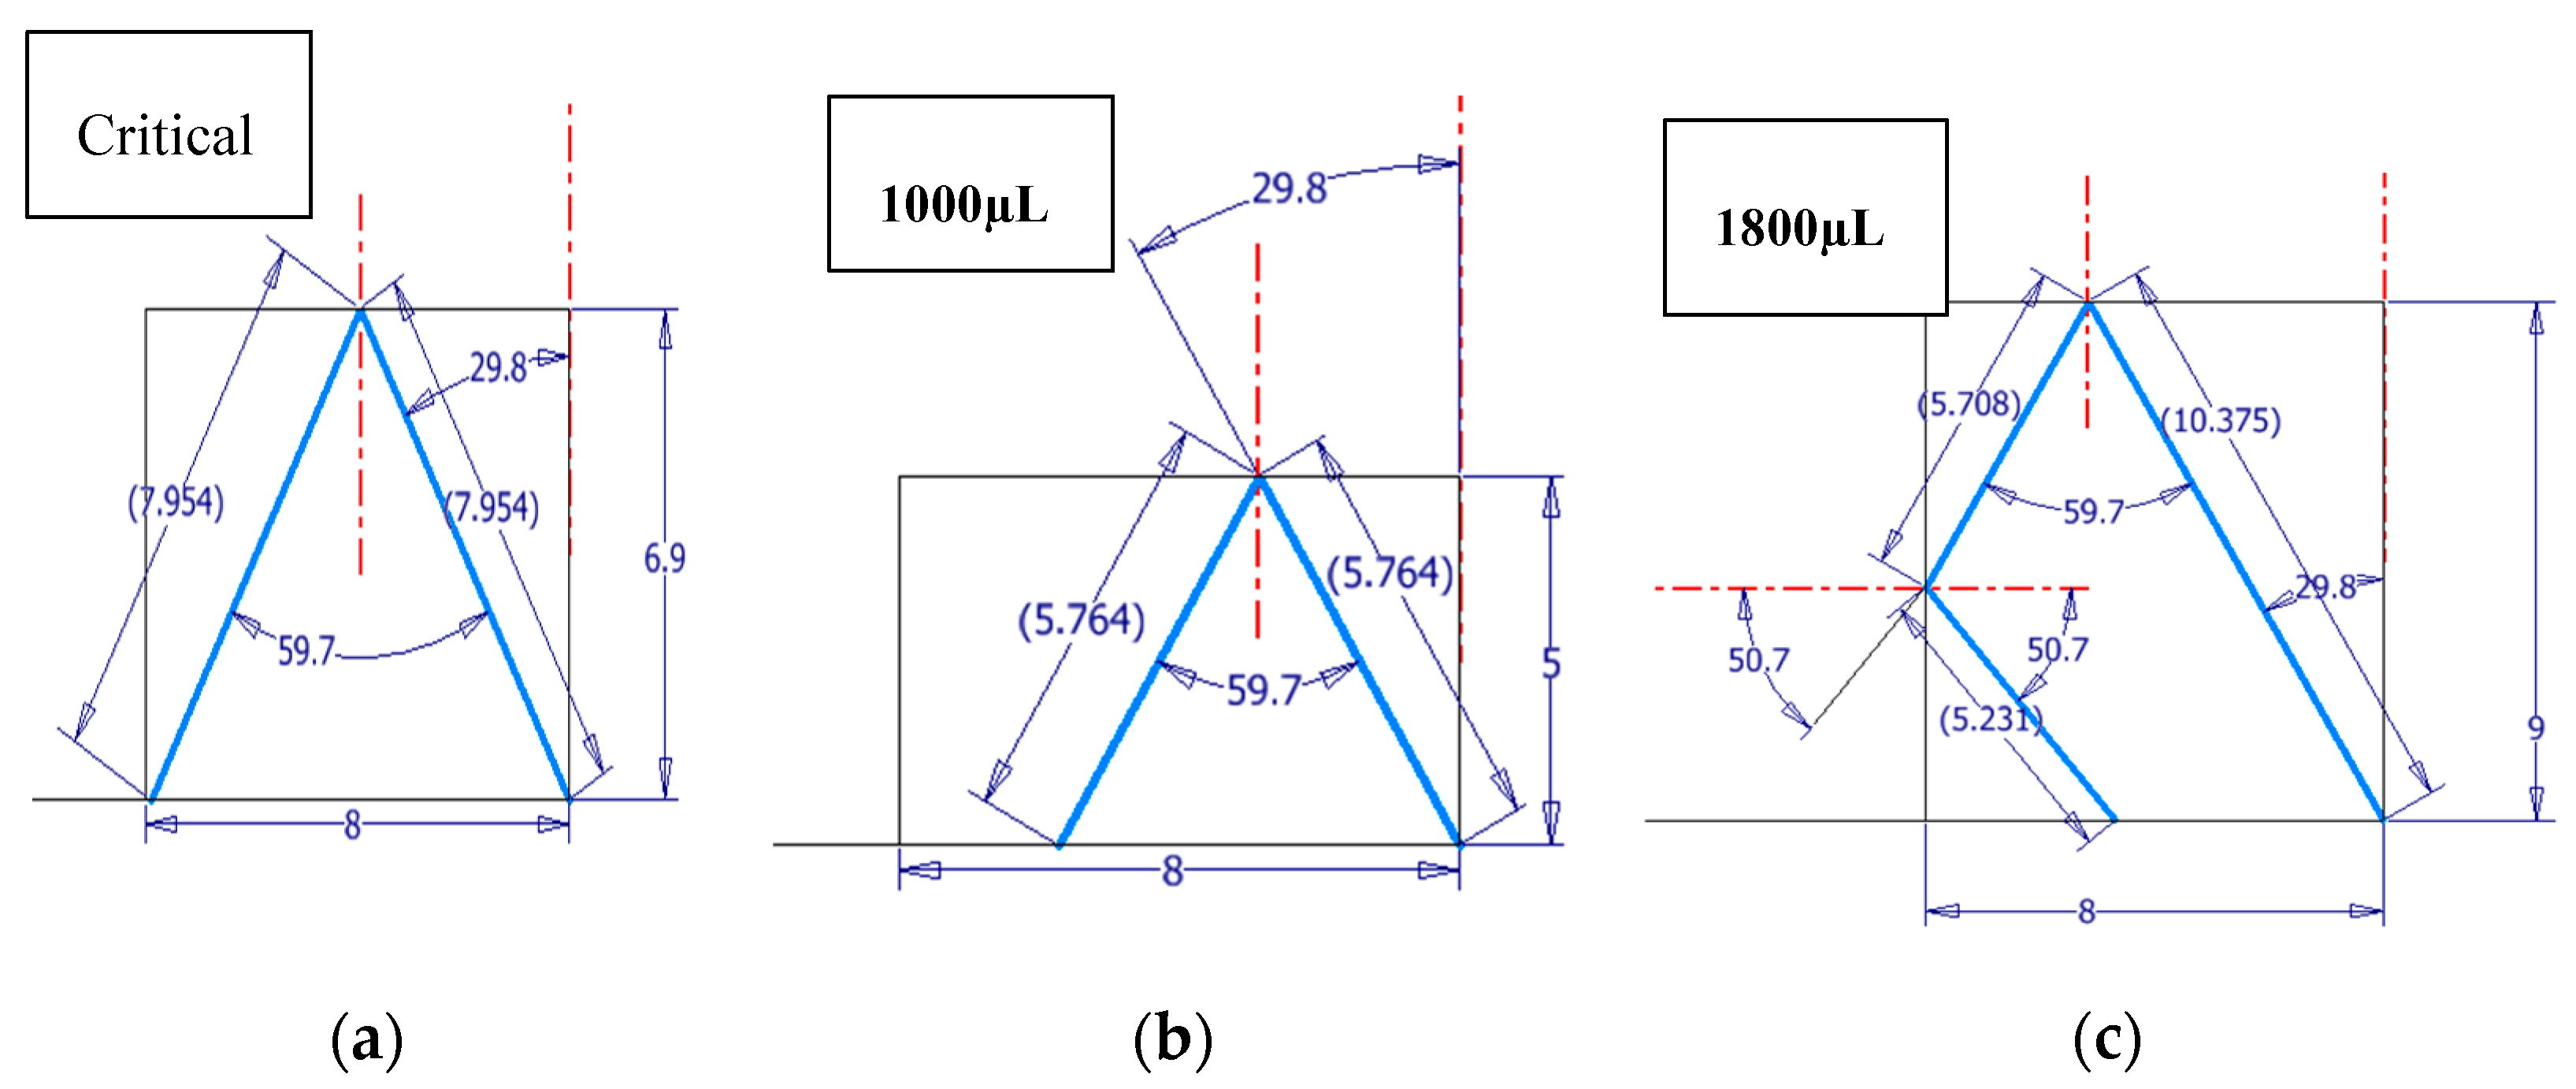
The percentage errors in the liquid height for 400 µL, 600 µL, 1000 µL, and 1800 µL are 3.7%, −2.6%, −1.4%, and 9.8%, respectively. As expected, in the case of 1800 µL, the error is high because the height is above 0.86 L, so the obtained (S1 + S2) is not accurate. This case represents the second case that is explained in Appendix A.2. To address this issue, the total traveled distance was found via parametric CAD software (Inventor Autodesk 201), as illustrated in Figure 7, for the critical case, 1000 µL, and 1800 µL. From this figure, one can observe that the total traveled distance (S1 + S2) for 1000 µL exactly matches the value found in Table 4. By contrast, for 1800 µL, the total traveled distance does not exactly match the table. The corrected value for the case of 1800 µL from the figure is 21.31 mm, which gives a CLW of 1383 m/s and height of 9.24 mm. Therefore, the error for 1800 µL is dramatically reduced to 2.7%.
The error in the height estimation might be caused by several factors, such as the theoretical value of the speed of sound in water and air, which mainly varies with the temperature, the surface tension phenomenon, and the estimated area of the liquid container.

3.4. Short-Time Fourier Transform Analysis for Both the Reflected Wave from the Defect (Edge) and the Liquid

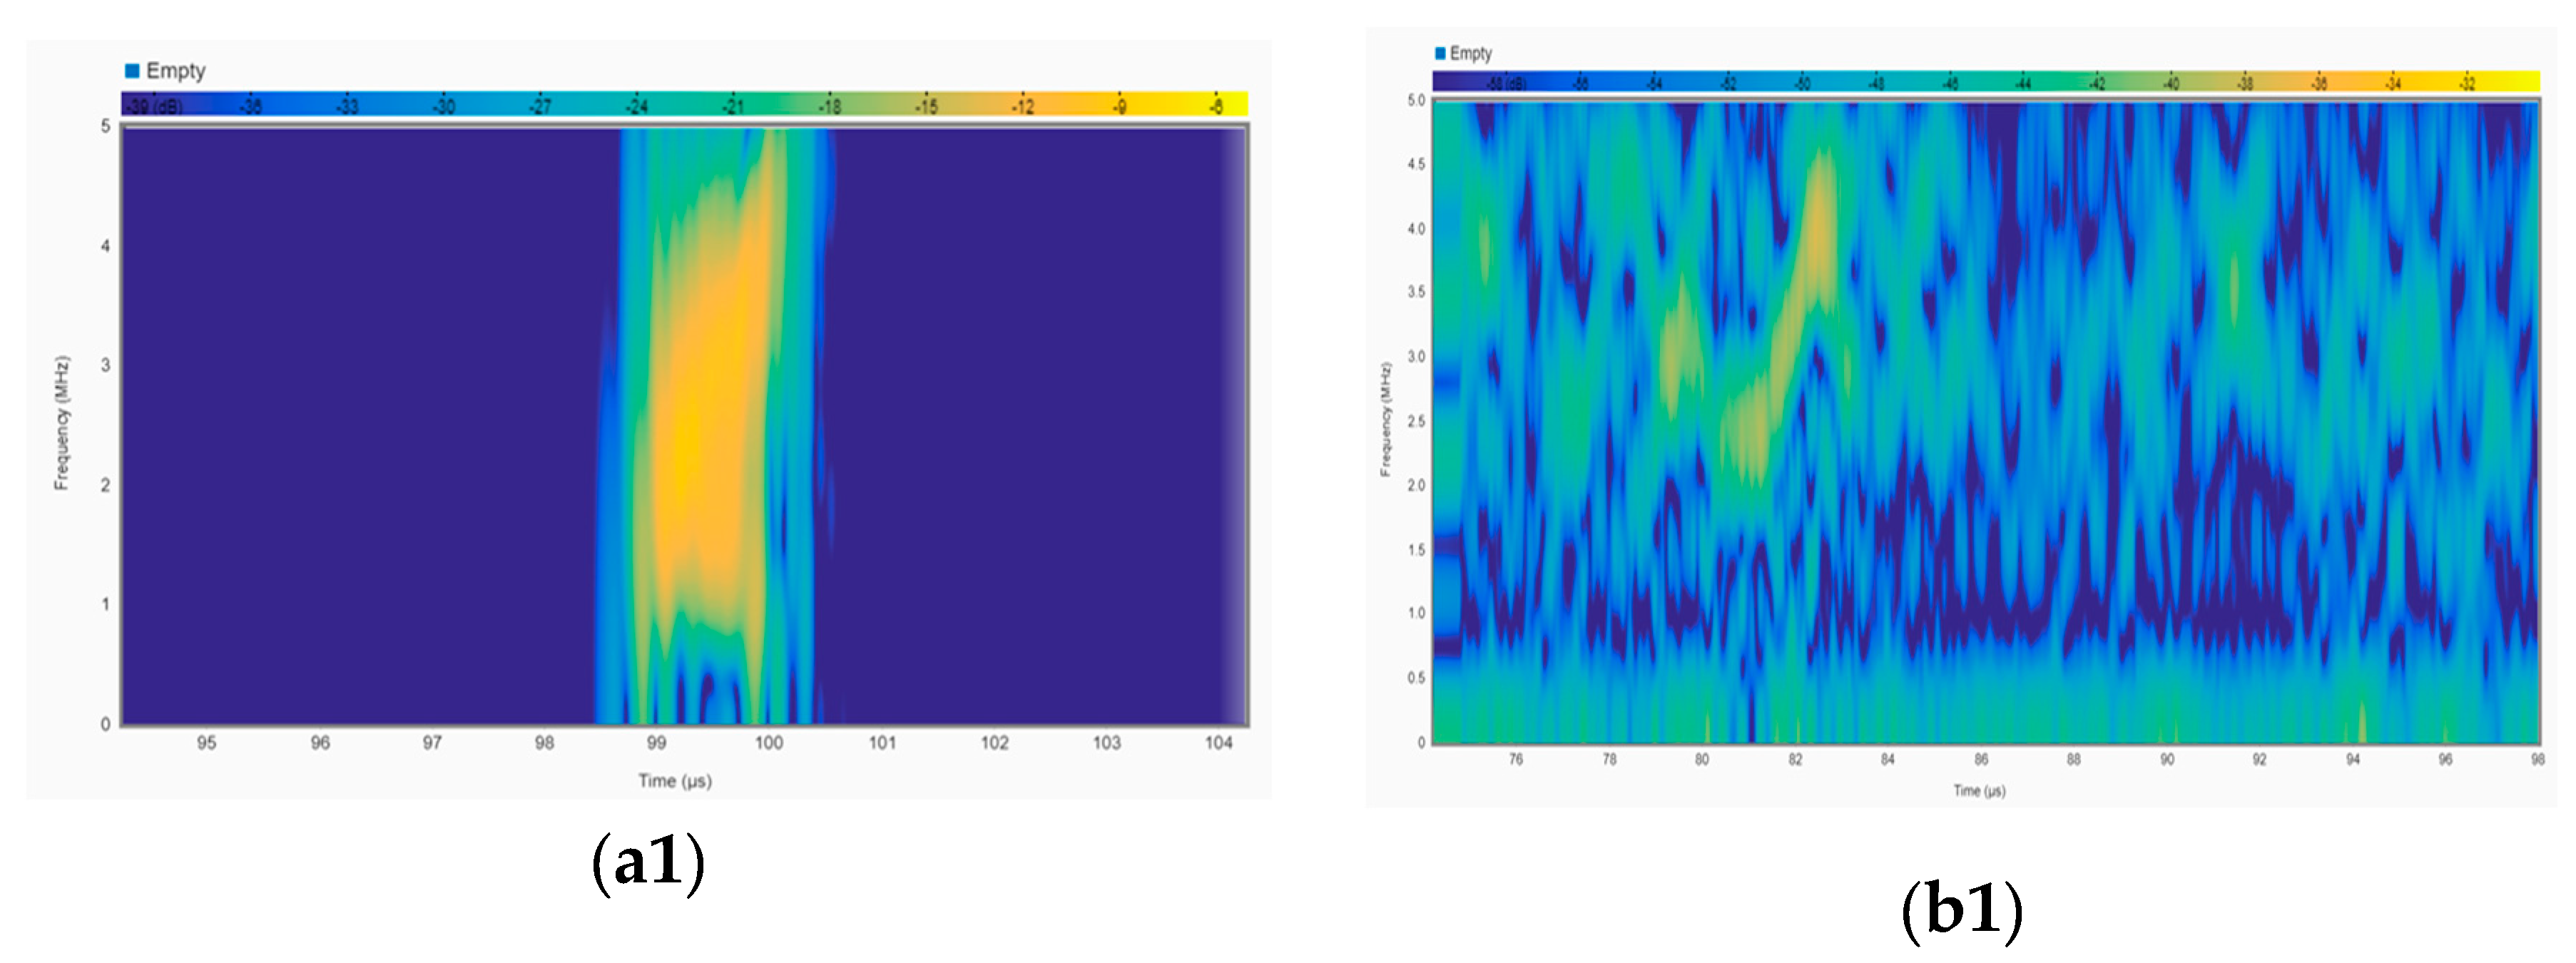
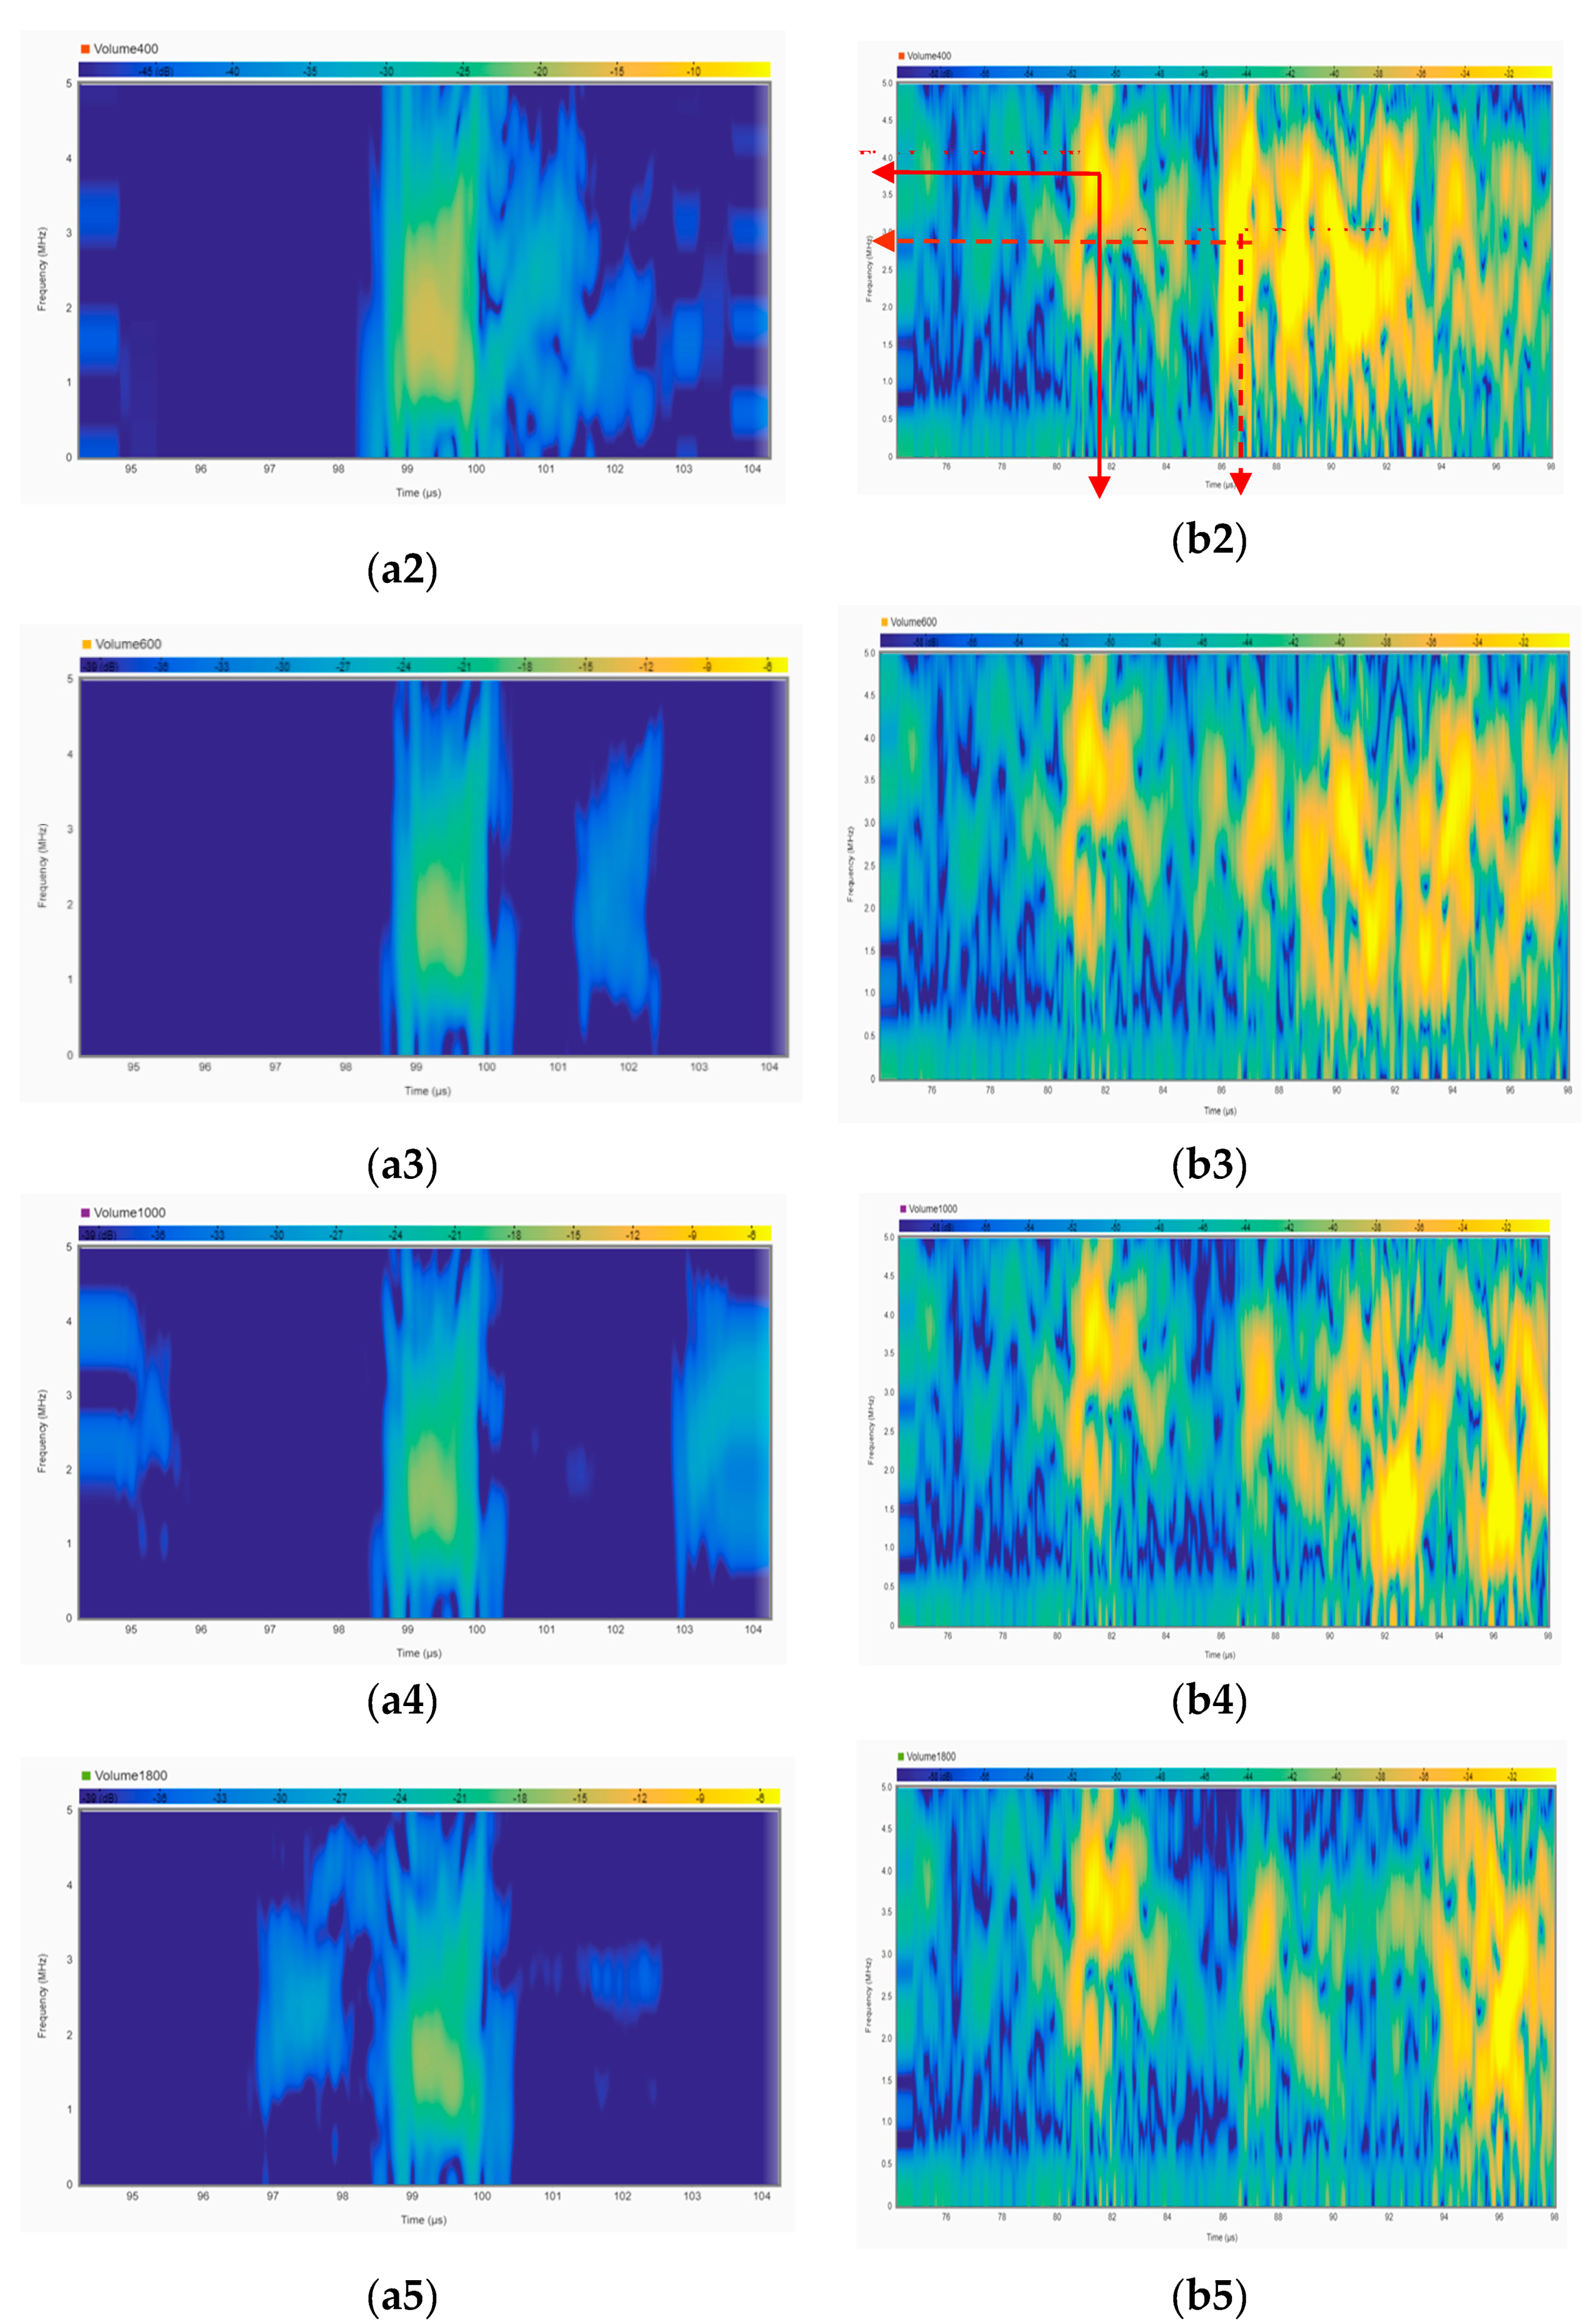
The goal of Short-Time Fourier Transform Analysis (STFT) is to determine the effect of fluid existence and fluid volume on the signal frequency. STFT is a useful technique to convert the time domain response of the signal into the frequency-time domain for a selected window. The resolutions of time and frequency are inversely proportional; as the frequency resolution increases, the time resolution decreases, and vice versa [32]. The longer the window is, the higher the frequency resolution that will be obtained with a lower time resolution [33]. For this reason, a trade-off between frequency resolution and time resolution should be carefully implemented depending on which is more important for a particular study. In this study, we utilized MATLAB (signal processing) to obtain the STFT for the RWE (Reflected Wave from the Edge) and RWL (Reflected Wave from the Liquid) windows. The time resolution was set to be 1 µs. The settings for the leakage and overlap are 1% and 99%, respectively. Figure 8 represents the STFT of the RWE and RWL for all cases. For instance, Figure 8a1,b1 show the STFT results for the empty case obtained for the RWE and RWL, respectively. Figure 8a2,b2 show the STFT for 400 µL cases obtained for the RWE and RWL, respectively, and so on. The x-axis represents the time in µs, and the y-axis represents the frequency in MHz. The light-yellow(-dB), which is close to 0 dB, represents the dominant frequency components of the signal at a specific time. If the yellow color becomes darker or changes to blue in a particular region, it indicates that a lower frequency component of the signal is localized.
From Figure 8a1–a5, it can be observed that the central frequency of the RWE for all cases is lower than in the case of the empty container. A slight change in the fundamental frequency as the volume of liquid increases can be seen. Besides, multiple reflections from liquid appear before and after the RWE as the volume of liquid increases. From Figure 8b1–b5, it can be observed the first leaky Rayleigh wave, at the first edge/corner of the container, with a frequency of 3.5 to 4 MHz, occurs at a time between 80 µs and 82 µs for all cases except the empty container. The second leaky Rayleigh wave, at the end edge/corner of the container, appears at a time between 86 µs and 88 µs. The first leaky Rayleigh wave and the second leaky Rayleigh wave are denoted with solid red arrows and dashed red arrows, respectively, in Figure 8b2. Additionally, multiple reflections from the top surface of the liquid appear as the light-yellow color between or after the two Leaky Rayleigh waves based on the liquid volume, as previously explained in Section 3.2. Note that the first and second Leaky Rayleigh waves occurred at the same time plots (Figure 8b2–b5).

4. Conclusions

In this paper, the impact of liquid presence on a solid surface on surface acoustic waves (SAWs) was experimentally investigated. Additionally, with the aid of the fact that when a SAW interacts with a liquid as it is traveling along the solid surface, some of its energy is transmitted through the liquid and some energy is reflected, the liquid height can be accurately estimated via analyzing the time domain response of the received signal. The results show that the peak-to-peak amplitude of the received SAW signal is dramatically reduced when liquid is present on the solid surface by almost 62.5% compared to the free surface (no liquid). With an increase in liquid volume, the peak-to-peak amplitude is slightly decreased, which indicates that the SAW is more sensitive to the area being covered by a liquid than the volume of the liquid. The results further show the capability of utilizing SAW to precisely measure the liquid height, with a small error that does not exceed 10% in all the tested cases in this study.

Author Contributions

Conceptualization, H.A. and R.G.; methodology, H.A. and R.G.; software, H.A.; validation, H.A.; formal analysis, H.A.; investigation, H.A.; resources, R.G.; data curation, H.A. and R.G.; writing—original draft preparation, H.A.; writing—review and editing, R.G.; visualization, H.A.; supervision, R.G.; project administration, R.G.; funding acquisition, R.G. All authors have read and agreed to the published version of the manuscript.

Funding

This research received no external funding.

Conflicts of Interest

The authors declare no conflict of interest.

Appendix A

Appendix A.1. Finding the Refraction Angle

To find the refraction angle at the solid–fluid interface (θ1), Equation (A1) can be utilized. The theoretical value of CLw at a temperature of 20 °C, CLR, and θLR are 1480 m/s, 2975.3 m/s, and 90°, respectively. By substituting these values into Snell’s law, as illustrated in Equation (A1), we get:
C L R sin ( θ 1 ) = C L w sin ( θ R )
2975.3   sin ( θ 1 ) = 1480   sin ( 90 )
θ 1 = 29.83 °
The critical incident angle of the liquid can be obtained by substituting θair = 90°, CLw, and Cair into Snell’s law, as in Equation (A4):
C a i r sin ( θ a i r ) = C L W sin ( θ c r i t c a l )
343   sin ( 90 ) = 1480   sin ( θ c r i t i c a l )
θ c r i t i c a l = 13.40 °

Appendix A.2. The Derivation Equation for the Second Case when h > 0.86 L

Equation (6) can no longer be applicable if the incident wave reflected from the liquid–air interface will hit the container edge at some height before it is reflected toward the solid surface with an incident angle of θ3, and it travels a distance of S3. Therefore, the total distance traveled in the liquid is S1 + S2 + S3, as shown in Figure 2b. The angle θ3 is measured by substituting the longitudinal velocity of the PLA container, which is experimentally determined to be between 2200 m/s and 2300 m/s, depending on various conditions [31], the velocity of the liquid, and angle θ2 into Snell’s law. The obtained angle θ3 is 50.7° when using the velocity of 2300 m/s.
The error in the height measurement will be high if Equation (6) is utilized, since the S3 value is neglected. Hence, a modification of Equation (6) should be implemented to improve the accuracy of the height measurement. Through analyzing the vector (S1, S2, S3) components with trigonometry as illustrated in Figure 2b, the imaginary part (y) and the real part (x) are derived in terms of θ1, θ3, and L as:
y :     S 1 cos θ 1 S 2 cos θ 1 S 3 sin θ 3 = 0
x :     S 1 sin θ 1 + S 2 sin θ 1 S 3 cos θ 3 = L S 3 cos θ 3
By substituting S1 = h/cosθ1 into the previous equations and solving for S2 and S3 in terms of h, θ1, θ3, and L, we obtain:
y :               S 2 = h cos θ 1 S 3 sin θ 3 cos θ 1
x :             S 2 = L sin θ 1 h cos θ 1
Solving the two equations, S3 can be found as:
S 3 = 2 h ( L × cot θ 1 ) sin θ 3
If h = 10 mm, L = 8 mm, θ1 = 29.83°, and θ3 = 50.7° and substituting these values into Equations (5), (A10), and (A11), we get S1, S2, and S3 equal to 11.52 mm, 4.55 mm, and 7.816 mm, respectively. It can be observed that S1 < S2 + S3, which verifies the fact that Equation (6) cannot be applicable when h > 0.86 L. Note that Equation (A11) shows that the height (h) in this case is a function of S3, whereas it is a function of S2 in Equation (A9).

References

  1. Chamuel, J.R. Laboratory studies on pulsed leaky Rayleigh wave components in a water layer over a solid bottom. In Shear Waves in Marine Sediments; Springer: Berlin/Heidelberg, Germany, 1991; pp. 59–66. [Google Scholar]
  2. Cheeke, J.D.N. Fundamentals and Applications of Ultrasonic Waves; CRC Press: Boca Raton, FL, USA, 2016. [Google Scholar]
  3. Überall, H. Surface waves in acoustics. Phys. Acoust. 1973, 10, 1–60. [Google Scholar]
  4. Stoneley, R. Elastic waves at the surface of separation of two solids. In Proceedings of the Royal Society of London. Series A, Containing Papers of a Mathematical and Physical Character; Royal Society: London, UK, 1924; Volume 106, pp. 416–428. [Google Scholar]
  5. Thompson, D.O.; Chimenti, D.E. Review of Progress in Quantitative Nondestructive Evaluation; Springer Science & Business Media: Berlin/Heidelberg, Germany, 2012; Volume 18. [Google Scholar]
  6. Zhu, J.; Popovics, J.S.; Schubert, F. Leaky Rayleigh and Scholte waves at the fluid–solid interface subjected to transient point loading. J. Acoust. Soc. Am. 2004, 116, 2101–2110. [Google Scholar] [CrossRef] [Green Version]
  7. Brekhovskikh, L. Waves in Layered Media; Elsevier: Amsterdam, The Netherlands, 2012; Volume 16. [Google Scholar]
  8. Ewing, M.W. Elastic Waves in Layered Media; McGraw-Hill: New York, NY, USA, 1957. [Google Scholar]
  9. Padilla, F.; de Billy, M.; Quentin, G. Theoretical and experimental studies of surface waves on solid-fluid interfaces when the value of the fluid sound velocity is located between the shear and the longitudinal ones in the solid. J. Acoust. Soc. Am. 1999, 106, 666–673. [Google Scholar] [CrossRef]
  10. Gedge, M.; Hill, M. Acoustofluidics 17: Theory and applications of surface acoustic wave devices for particle manipulation. Lab Chip 2012, 12, 2998–3007. [Google Scholar] [CrossRef] [PubMed] [Green Version]
  11. Ricco, A.; Martin, S. Acoustic wave viscosity sensor. Appl. Phys. Lett. 1987, 50, 1474–1476. [Google Scholar] [CrossRef]
  12. Yildirim, B.; Senveli, S.U.; Gajasinghe, R.W.; Tigli, O. Surface Acoustic Wave Viscosity Sensor with Integrated Microfluidics on a PCB Platform. IEEE Sens. J. 2018, 18, 2305–2312. [Google Scholar] [CrossRef]
  13. Franier, B.D.L.; Thompson, M. Early stage detection and screening of ovarian cancer: A research opportunity and significant challenge for biosensor technology. Biosens. Bioelectron. 2019, 135, 71–81. [Google Scholar] [CrossRef] [PubMed]
  14. Onen, O.; Sisman, A.; Gallant, N.D.; Kruk, P.; Guldiken, R. A urinary Bcl-2 surface acoustic wave biosensor for early ovarian cancer detection. Sensors 2012, 12, 7423–7437. [Google Scholar] [CrossRef] [Green Version]
  15. Guldiken, R.; Jo, M.C.; Gallant, N.D.; Demirci, U.; Zhe, J. Sheathless size-based acoustic particle separation. Sensors 2012, 12, 905–922. [Google Scholar] [CrossRef]
  16. Jo, M.C.; Guldiken, R. Active density-based separation using standing surface acoustic waves. Sens. Actuators A Phys. 2012, 187, 22–28. [Google Scholar] [CrossRef]
  17. Jo, M.C.; Guldiken, R. Particle manipulation by phase-shifting of surface acoustic waves. Sens. Actuators A Phys. 2014, 207, 39–42. [Google Scholar] [CrossRef]
  18. Jo, M.C.; Guldiken, R. Dual surface acoustic wave-based active mixing in a microfluidic channel. Sens. Actuators A Phys. 2013, 196, 1–7. [Google Scholar] [CrossRef]
  19. Wang, T.; Ni, Q.; Crane, N.; Guldiken, R. Surface acoustic wave based pumping in a microchannel. Microsyst. Technol. 2017, 23, 1335–1342. [Google Scholar] [CrossRef]
  20. Wang, T.; Green, R.; Nair, R.R.; Howell, M.; Mohapatra, S.; Guldiken, R.; Mohapatra, S.S. Surface acoustic waves (SAW)-based biosensing for quantification of cell growth in 2D and 3D cultures. Sensors 2015, 15, 32045–32055. [Google Scholar] [CrossRef] [PubMed]
  21. Alhazmi, H.; Guldiken, R. Quantification of Bolt Tension by Surface Acoustic Waves: An Experimentally Verified Simulation Study. Acoustics 2019, 1, 794–807. [Google Scholar] [CrossRef] [Green Version]
  22. Martinez, J.; Sisman, A.; Onen, O.; Velasquez, D.; Guldiken, R. A synthetic phased array surface acoustic wave sensor for quantifying bolt tension. Sensors 2012, 12, 12265–12278. [Google Scholar] [CrossRef] [Green Version]
  23. Wang, T.; Green, R.; Guldiken, R.; Mohapatra, S.; Mohapatra, S. Multiple-layer guided surface acoustic wave (SAW)-based pH sensing in longitudinal FiSS-tumoroid cultures. Biosens. Bioelectron. 2019, 124, 244–252. [Google Scholar] [CrossRef]
  24. Lynnworth, L.C.; Seger, J.L.; Bradshaw, J.E. Ultrasonic System for Measuring Fluid Impedance or Liquid Level. U.S. Patent 4,320,659, 23 March 1982. [Google Scholar]
  25. Mohammed, S.L.; Al-Naji, A.; Farjo, M.M.; Chahl, J. Highly Accurate Water Level Measurement System Using a Microcontroller and an Ultrasonic Sensor. In IOP Conference Series: Materials Science and Engineering; IOP Publishing: Bristol, England, 2019; Volume 518, p. 042025. [Google Scholar]
  26. Zhang, B.; Wei, Y.-J.; Liu, W.-Y.; Zhang, Y.-J.; Yao, Z.; Zhang, L.; Xiong, J.-J. A novel ultrasonic method for liquid level measurement based on the balance of echo energy. Sensors 2017, 17, 706. [Google Scholar] [CrossRef] [Green Version]
  27. Giurgiutiu, V. Structural Health Monitoring with Piezoelectric Wafer Active Sensors: With Piezoelectric Wafer Active Sensors; Elsevier: Amsterdam, The Netherlands, 2007. [Google Scholar]
  28. Hevin, G.; Abraham, O.; Pedersen, H.; Campillo, M. Characterization of surface cracks with Rayleigh waves: A numerical model. NDT & E Int. 1998, 31, 289–297. [Google Scholar] [CrossRef]
  29. Rose, J.L. Ultrasonic Waves in Solid Media; Cambridge University Press: Cambridge, UK, 2004. [Google Scholar]
  30. Ohara, Y.; Oshiumi, T.; Nakajima, H.; Yamanaka, K.; Wu, X.; Uchimoto, T.; Takagi, T.; Tsuji, T.; Mihara, T. Ultrasonic phased array with surface acoustic wave for imaging cracks. AIP Adv. 2017, 7, 065214. [Google Scholar] [CrossRef] [Green Version]
  31. Parker, N.; Mather, M.; Morgan, S.; Povey, M. Longitudinal acoustic properties of poly (lactic acid) and poly (lactic-co-glycolic acid). Biomed. Mater. 2010, 5, 055004. [Google Scholar] [CrossRef] [PubMed] [Green Version]
  32. Kehtarnavaz, N.; Kim, N. Digital Signal Processing System-Level Design Using LabVIEW; Elsevier: Amsterdam, The Netherlands, 2011. [Google Scholar]
  33. Giannakopoulos, T.; Pikrakis, A. Introduction to Audio Analysis: A MATLAB® Approach; Academic Press: Cambridge, MA, USA, 2014. [Google Scholar]
Figure 1. (a) Schematic representation of a wave traveling in the liquid when the reflected angle at the solid–liquid interface is larger than the critical angle; (b) Schematic representation of a wave traveling in the liquid when the reflected angle at the solid–liquid interface is equal to the critical reflected angle.
Acoustics 02 00021 g001
Figure 2. (a) Schematic representation of a wave traveling at a different level of liquid, including the critical case, which occurs at h < 0.86 L (first case); (b) Schematic representation of a wave traveling in the liquid when the liquid height is higher than 0.86 L (case 2).
Acoustics 02 00021 g002
Figure 3. (a) Schematic diagram for the experiment setup; (b) The container dimensions used in this study.
Acoustics 02 00021 g003
Figure 4. The entire signal received for the empty container, including the selected windows for the reflection from the liquid and the reflection from the edge.
Acoustics 02 00021 g004
Figure 5. Time domain response for the reflected wave from the edge for all cases.
Acoustics 02 00021 g005aAcoustics 02 00021 g005b
Figure 6. Time domain responses for the reflected wave from the liquid for all cases.
Acoustics 02 00021 g006
Figure 7. The CAD results for the wave traveling in the liquid, showing the actual total traveled distance for three cases: the (a) critical case; (b) 1000 µL case, and (c) 1800 µL case.
Acoustics 02 00021 g007
Figure 8. (a) Short-Time Fourier Transform for the reflection from edge/corner in all cases: (a1) empty, (a2) 400 µL, (a3) 600 µL, (a4) 1000 µL, and (a5) 1800 µL; (b) STFT for the reflection from the liquid in all cases: (b1) empty, (b2) 400 µL, (b3) 600 µL, (b4) 1000 µL, and (b5) 1800 µL.
Acoustics 02 00021 g008aAcoustics 02 00021 g008b
Table 1. The pulser/receiver settings used during the experimental studies.
PRF(Hz)EnergyDamping (50 Ω)High Pass Filter (HPF)Low Pass Filter (LPF)Amplifier (Gain)
100131 MHz10 MHz30 db
Table 2. The material properties for deionized (DI) water, air, the PLA material, and 1081 steel.
Deionized Water1018 SteelAirPLA (25 °C)
Density, ρ (g/cm3)17.8700.0011.24
Speed of Sound (m/s)14802953 (C.R.)330–3432200~2300 [31]
Table 3. The percentage drop in the peak-to-peak amplitude of the reflected wave from the edge for all cases.
Empty400 µL600 µL1000 µL1800 µL
P–P amplitude (V)1.900.740.720.700.70
% = x e m p t y e m p t y × 100 -−61.05−62.11−63.16−63.16
Table 4. Velocity and height measurement.
Actual Height
(mm)
tA
(µs)
tB
(µs)
tc
(µs)
CLW
(m/s)
Error in CLW
(%)
S1 + S2
(mm)
h
(mm)
Error in h
(%)
400 µL280.9684.1987.181427.5−3.54%4.82.073.7
600 µL380.9685.5187.181520.12.71%6.72.92−2.6
1000 µL580.9688.6487.2115011.42%11.44.93−1.4
1800 µL980.9696.3687.221347.4−8.96%22.89.899.8/2.7 *
* Represents the calibrated error in hours for the case of 1800 µL as explained in Section 3.3.