A Systematic Content Review of Artificial Intelligence and the Internet of Things Applications in Smart Home

 ,
,  ,
,  , ,
, ,  ,
,  and
and 
Abstract
1. Introduction
1.1. Challenges and Motivation
1.2. Significance of This Review
2. Review Method
2.1. Step 1: Database Selection
2.2. Step 2: Primary Search
2.3. Step 3: Bibliography and Content Analysis
3. Bibliographic Analysis
4. Content Analysis and Data Mining
4.1. Group 1: IoT and Users
4.2. Group 2: Power and Energy
4.3. Group 3: Energy Management and Artificial Intelligence
4.3.1. Energy Management Systems
- (1)
- The architecture part working is based on Z-wave technology and is called PLUG-N-HARVEST, which includes four layers: adaptive dynamic building envelope (ADBE) that is related to an insulated aluminum façade, which is flexible, and energy collection device. Interconnected elements ecosystem (IEE) that includes all the sensors and automation devices. Security and safety mechanisms (SSM) that include fault detection and controlling the data. EMS, including three sub-systems—intelligent management and control system (IMCS), optimal OEMS, and demand response flexibility forecasting and optimization (DRFFO).
- (2)
- The cooperative part, which is a building management system (BMS) that consists of five security-by-design protocols, such as XACML, KeyRock, DCapBAC, EEC, and HTTPS. The model works based on the following steps: Firstly, the data is gathered by sensors attached to the building and collect the real-time data, and local stations or online services, which report and predict the weather information. Secondly, the EMSs (such as IMCS, OEMS, and DFRRO) can have access to the gathered data via BMS. Thirdly, IMCS makes the best control decisions and transfers them to the building actuators (such as heating ventilation and air conditioning (HVAC), adaptable/dynamic building envelope (ADBE), renewable energy system, and energy storage) via the BMS. Three different real-world prototypes are tested in order to show the proposed architecture (PLUG-N-HARVEST) in three countries (Germany, Greece, and Spain). Implementing the prototypes shows that the ‘security-by-design Internet communications’ (refers to the security part of the research) and ‘building equipment and cloud management systems’ (refers to the PLUG-N-HARVEST) work efficiently together. The ‘energy consumption’ and ‘comfort conditions’ are also upgraded by the use of cloud intelligent management, and this result is based on the prototype implemented in Spain.
- (1)
- proposed architecture model layers, such as (1-1) an edge node is able to do these tasks: taking the data of energy generation and consumption, taking the environmental data, pre-processing and filtering all the data gathered, controlling the performance of actuators, classifying models, predicting models, processing the communication, and implementing various user interfaces. (1-2) the fog node is able to do these tasks: learning prediction and classification models, analyzing, storing data, taking data, using AI algorithms, developing interfaces like human-machine interface (HMI), or machine-to-machine interfaces (M2M). (1-3) The smart grid is able to do these tasks: supporting application programming interface (API) management, security activities, maintenance activities, connecting the nodes in terms of cooperation, and supporting cloud service. (1-4) The cloud service is used in other services, such as taking care of numerous devices and big data, cloud data analytics, using dark data, developing an application, event management, being an interface or gateway between the hardware and software services.
- (2)
- steps of the proposed computing model, such as (2-1) designing devices, actuators, nodes, the cloud type, architecture of smart grid, and new services, (2-2) data flow that consists of several stages like capturing data by sensors, filtering data, transferring data between nodes and the smart grid, saving data, transferring data between nodes and management layer, transferring data to the cloud service, controlling data, and interfaces between human-machine and machine-machine. (2-3) Learning includes these stages: pattern identification models to identify the type of energy load, generation prediction to make a regression model, predictive maintenance to identify singular events, training other processes based on AI. (2-4) the operation comprises steps, all of which are related to processes, for one: supervision processes. (2-5) this step includes supervision, management, and maintenance. The proposed model is evaluated experimentally by means of a system that includes both wind and solar energy. The system is installed in a house, by which the effectiveness of the proposed method is proved. Based on the mentioned experiment, the advantages of the system are being easy to design, install, and operate, and being cost-efficient. All related services to the smart grid are suggested to be integrated into a developed API in the future.
4.3.2. Artificial Intelligence and Indoor Systems
4.3.3. Care Systems
5. Directions for Further Studies
- Extending insights derive at a home level to neighborhood, community, city level and vice versa for more meaningful smart decisions/actions-Federated learning
- Authentication, authorization, and compliance with policies like the General Data Protection Regulation (GDPR)
- Tracking the logs of data and corresponding actions to enhance systems and future actions, as well as find faults and responsible parties for incorrect actions (Blockchain can be a potential solution.)
- Implementation of high performance and cost-efficient sensors; for example, the use of small wireless, self-powered, and long-life sensors and actuators that are pervasive that users do not even feel they exist. The coverage of wireless signals, absorption, and reflections should be considered.
- Simplified modes of internal networks and wireless power transmission need improvements in a way to accommodate devices, sensors, and actuators for real-time functioning.
- Development of miniature sensors and tools, such as motors and solenoids, which are required for automating the interactions, including the control of windows, blinds, and doors.
- Connection to smart building systems and developing novel mechanisms to connect to pathfinding systems for implementing emergency scenarios and evacuation, considering the total failure of networks and power supply.
- An effective data quality management/control technique
- An effective data generation technique based on an initial set of relatively small datasets.
6. Conclusions
Author Contributions
Funding
Conflicts of Interest
Abbreviations
| Acronyms | |
| 3D | Three dimensional |
| AAL | Ambient assisted living |
| AI | Artificial intelligence |
| AI-SIoT | Artificial intelligence and semantic Internet of things |
| API | Application program interface |
| AR | Augmented reality |
| AWCS | Asynchronous weak commitment search |
| BLE | Bluetooth |
| CART | Classification and regression tree |
| CB | Class balancer |
| CC | Connectivity checker |
| CCM | Cloud classification model |
| CDMA | Code division multiple access |
| CNN | Convolutional neural network |
| CoG | Center of gravity |
| CR | Cognitive radio |
| CSI | Channel state information |
| CSVD | Class estimated basis space singular value decomposition |
| CSVD-NMF | Classification using non-negative matrix factorization |
| CV | Computer vision |
| DIP | Dual-in-line package |
| DP Proxy | Differentially private proxy |
| DRW | Directed random walk |
| DSM | Demand-side system management |
| ECG | Electrocardiogram |
| EMS | Energy management system |
| EoI | Eyes of things |
| EPIC | Efficient and privacy-preserving traffic obfuscation |
| FPS | Frame per second |
| FSM | Finite state machine |
| GIS | Geographic information system |
| GPRS | General package radio services |
| GPS | Global positioning system |
| GUI | Graphical user interface |
| HCM | Hybrid classification model |
| HD | House demand |
| HEMS | Home energy management system |
| HLFA | High-level feature aggregator |
| HLFP | High-level feature provider |
| HRI | Human-robot interaction |
| HRV | Heart rate variability |
| HVAC | Heating cooling and air conditioning |
| HyFIS | Hybrid neural fuzzy inference system |
| IHCAM-PUSH | Intelligent hybrid context-aware model for patients under supervision at home |
| IM | Independent model |
| IMU | Inertial measurement unit |
| IoH | Intelligence of home |
| IoT | Internet of things |
| IOU | Intersection-over-union |
| JADE | Java agent development framework |
| JRip | Ripper classifier |
| JSON | Javascript object notation |
| LDB | Local database |
| LDR | Light-dependent resistor |
| LED | Light-emitting diode |
| LSTM | Long short-term memory |
| M2M | Machine to Machine |
| MAS | Multi-agent system |
| MDK | Movidius’ development kit |
| MFCC | Mel-frequency cepstral coefficients |
| MSPC | Medical service provider cloud |
| NASA- TLX | National Aeronautics and space administration-task load index |
| NB | Naïve Bayes’ |
| NLP | Natural language processing |
| OCMM | Outpatient’s cloud monitoring |
| OEM | Original equipment manufacturer |
| OLMM | Outpatient’s local monitoring module |
| PAS | Power alert system |
| PC | Price clustering |
| PCM | Personal classification model |
| PF | Price forecasting |
| PIR | Passive infrared |
| PMV | Predicted mean vote |
| PSO- SQP | Particle swarm optimization- sequential quadratic programming |
| PTSD | Post-traumatic stress disorder |
| PU | Primary users |
| QoE | Quality of experience |
| QoS | Quality of service |
| RF | Random forest |
| RIFD | Radiofrequency identification |
| RMC | Remote monitoring cloud |
| RMSE | Root mean square error |
| RNN | Random neural network |
| ROM | Read-only memory |
| ROS | Robot operating system |
| RSSI | Received signal strength indication |
| RTEMS | Real-time executive for multiprocessor system |
| SDNN | Standard deviation of normal RR intervals |
| SM | Shared model |
| SHMS | Self-learning home management system |
| SHS | Smart home simulator |
| SLAM | Simultaneous localization and mapping |
| SMOTE | Synthetic minority over-sampling technique |
| SoC | System-on-chip |
| SSM | Supply-side management |
| STDMA | Spatial reuse time division multiple access |
| SUS | System usability scale |
| SVM | Support vector machine |
| TCP | Transmission control protocol |
| TCPROS | Transmission control protocol for robot operating system |
| UI | User interface |
| VUI | Voice user interface |
| VR | Virtual reality |
| WiFi | Wireless fidelity |
| WLAN | Wireless local area network |
References
- Marikyan, D.; Papagiannidis, S.; Alamanos, E. A systematic review of the smart home literature: A user perspective. Technol. Soc. Chang. 2019, 138, 139–154. [Google Scholar] [CrossRef]
- Balta-Ozkan, N.; Amerighi, O.; Boteler, B. A comparison of consumer perceptions towards smart homes in the UK, Germany and Italy: Reflections for policy and future research. Technol. Anal. Strateg. Manag. 2014, 26, 1176–1195. [Google Scholar] [CrossRef]
- Gonçalves, I.; Gomes, Á.; Antunes, C.H. Optimizing the management of smart home energy resources under different power cost scenarios. Appl. Energy 2019, 242, 351–363. [Google Scholar] [CrossRef]
- Hong, J.; Shin, J.; Lee, D. Strategic management of next-generation connected life: Focusing on smart key and car–home connectivity. Technol. Soc. Chang. 2016, 103, 11–20. [Google Scholar] [CrossRef]
- Sepasgozar, S.M.; Hawken, S.; Sargolzaei, S.; Foroozanfa, M. Implementing citizen centric technology in developing smart cities: A model for predicting the acceptance of urban technologies. Technol. Soc. Chang. 2019, 142, 105–116. [Google Scholar] [CrossRef]
- Ringel, M.; Laidi, R.; Djenouri, D. Multiple benefits through smart home energy management solutions—A simulation-based case study of a single-family-house in algeria and Germany. Energies 2019, 12, 1537. [Google Scholar] [CrossRef]
- Silverio-Fernández, M.; Renukappa, S.; Suresh, S. What is a smart device?-a conceptualisation within the paradigm of the internet of things. Vis. Eng. 2018, 6, 3. [Google Scholar] [CrossRef]
- Ma, W.; Adesope, O.O.; Nesbit, J.C.; Liu, Q. Intelligent tutoring systems and learning outcomes: A meta-analysis. J. Educ. Psychol. 2014, 106, 901. [Google Scholar] [CrossRef]
- O’Shea, K.; Nash, R. An introduction to convolutional neural networks. arXiv 2015, arXiv:1511.08458. [Google Scholar]
- Wu, X.; Zhu, X.; Wu, G.-Q.; Ding, W. Data mining with big data. IEEE Trans. Knowl. Data Eng. 2013, 26, 97–107. [Google Scholar]
- Sarikaya, A.; Correll, M.; Bartram, L.; Tory, M.; Fisher, D. What do we talk about when we talk about dashboards? IEEE Trans. Vis. Comput. Graph. 2018, 25, 682–692. [Google Scholar] [CrossRef] [PubMed]
- LeCun, Y.; Bengio, Y.; Hinton, G. Deep learning. Nature 2015, 521, 436. [Google Scholar] [CrossRef] [PubMed]
- Gottfredson, L.S. Mainstream Science on Intelligence: An Editorial with 52 Signatories, History, and Bibliography. Intelligence 1997, 24, 13–23. [Google Scholar] [CrossRef]
- Anastasi, A. What counselors should know about the use and interpretation of psychological tests. J. Couns. Dev. 1992, 70, 610–615. [Google Scholar] [CrossRef]
- Raja, S.; Mandour, K. Smart Homes: Perceived Benefits and Risks by Swedish Consumers. Bachelor’s Thesis, Malmö University, Malmö, Sweden, 2019. [Google Scholar]
- Schuld, M.; Sinayskiy, I.; Petruccione, F. An introduction to quantum machine learning. Contemp. Phys. 2015, 56, 172–185. [Google Scholar] [CrossRef]
- Kröse, B.; Krose, B.; van der Smagt, P.; Smagt, P. An Introduction to Neural Networks; MIT Press: Cambrige, MA, USA, 1993. [Google Scholar]
- Thorarinsson, A.; Simmonds, A. Real time, on-line monitoring for every project. In Proceedings of the Eighth International Symposium on Field Measurements in Geomechanics; Technische Universität Braunschweig: Berlin, Germany, 2011. [Google Scholar]
- Harper, R. Inside the Smart Home; Science & Business Media: Berlin, Germerny, 2006. [Google Scholar]
- Ricquebourg, V.; Menga, D.; Durand, D.; Marhic, B.; Delahoche, L.; Loge, C. The smart home concept: Our immediate future. In Proceedings of the 2006 1st IEEE international conference on e-learning in industrial electronics, Hammamet, Tunisia, 18–20 December 2006; pp. 23–28. [Google Scholar]
- Park, S.H.; Won, S.H.; Lee, J.B.; Kim, S.W. Smart home–digitally engineered domestic life. Pers. Ubiquitous Comput. 2003, 7, 189–196. [Google Scholar] [CrossRef]
- Redriksson, V. What Is a Smart Home or Building. 2005. Available online: https://internetofthingsagenda.techtarget.com/definition/smart-home-or-building# (accessed on 26 March 2020).
- Palensky, P.; Dietrich, D. Demand side management: Demand response, intelligent energy systems, and smart loads. IEEE Trans. Ind. Inform. 2011, 7, 381–388. [Google Scholar] [CrossRef]
- Hu, Q.; Li, F. Hardware design of smart home energy management system with dynamic price response. IEEE Trans. Smart Grid 2013, 4, 1878–1887. [Google Scholar] [CrossRef]
- Darby, S. The effectiveness of feedback on energy consumption. A Rev. Defra Lit. Metering Billing Direct Disp. 2006, 486, 26. [Google Scholar]
- Charron, R. A Review of Low and Net-Zero Energy Solar Home Initiatives. CANMET Energy Technology Centre-Varennes, NRCan. 2005. Available online: http://canmetenergy-canmetenergie.nrcan-rncan.gc.ca/fichier.php/codectec/En/2005-133/2005-133_e.pdf (accessed on 26 March 2020).
- Elma, O.; Selamogullari, U.S. A new home energy management algorithm with voltage control in a smart home environment. Energy 2015, 91, 720–731. [Google Scholar] [CrossRef]
- Nilsson, A.; Wester, M.; Lazarevic, D.; Brandt, N. Smart homes, home energy management systems and real-time feedback: Lessons for influencing household energy consumption from a Swedish field study. Energy Build. 2018, 179, 15–25. [Google Scholar] [CrossRef]
- Mehdi, G.; Roshchin, M. Electricity consumption constraints for smart-home automation: An overview of models and applications. Energy Procedia 2015, 83, 60–68. [Google Scholar] [CrossRef]
- IEA. Smart Grid. Available online: https://www.iea.org/publications/freepublications/publication/smartgrids_roadmap.pdf (accessed on 26 March 2020).
- John, J. Global Smart Home Market to Exceed $53.45 Billion by 2022: Zion Market Research; Zion Market Research: Maharashtra, India, 2018. [Google Scholar]
- Birol, F. Energy Efficiency Market Report 2016; International Energy Agency: Paris, France, 2016; p. 141. [Google Scholar]
- Wilson, C.; Hargreaves, T.; Hauxwell-Baldwin, R. Benefits and risks of smart home technologies. Energy Policy 2017, 103, 72–83. [Google Scholar] [CrossRef]
- Bem, D.J. Writing a review article for Psychological Bulletin. Psychol. Bull. 1995, 118, 172. [Google Scholar] [CrossRef]
- Palmatier, R.W.; Houston, M.B.; Hulland, J. Review articles: Purpose, process, and structure. J. Acad. Mark. Sci. 2018, 46, 1–5. [Google Scholar] [CrossRef]
- Shirowzhan, S.; Sepasgozar, S.M.E.; Li, H.; Trinder, J. Spatial compactness metrics and Constrained Voxel Automata development for analyzing 3D densification and applying to point clouds: A synthetic review. Autom. Constr. 2018, 96, 236–249. [Google Scholar] [CrossRef]
- Suter, G.W. Review papers are important and worth writing. Environ. Toxicol. Chem. 2013, 32, 1929–1930. [Google Scholar] [CrossRef]
- Alaa, M.; Zaidan, A.; Zaidan, B.; Talal, M.; Kiah, M.L.M. A review of smart home applications based on Internet of Things. J. Netw. Comput. Appl. 2017, 97, 48–65. [Google Scholar] [CrossRef]
- Stojkoska, B.L.R.; Trivodaliev, K.V. A review of Internet of Things for smart home: Challenges and solutions. J. Clean. Prod. 2017, 140, 1454–1464. [Google Scholar] [CrossRef]
- Alhussein, M.; Haider, S.I.; Aurangzeb, K. Microgrid-Level Energy Management Approach Based on Short-Term Forecasting of Wind Speed and Solar Irradiance. Energies 2019, 12, 1487. [Google Scholar] [CrossRef]
- Marin-Perez, R.; Michailidis, I.T.; Garcia-Carrillo, D.; Korkas, C.D.; Kosmatopoulos, E.B.; Skarmeta, A. PLUG-N-HARVEST Architecture for Secure and Intelligent Management of Near-Zero Energy Buildings. Sensors 2019, 19, 843. [Google Scholar] [CrossRef] [PubMed]
- La Tona, G.; Luna, M.; Di Piazza, A.; Di Piazza, M.C. Towards the Real-World Deployment of a Smart Home EMS: A DP Implementation on the Raspberry Pi. Appl. Sci. 2019, 9, 2120. [Google Scholar] [CrossRef]
- Ferrández-Pastor, F.J.; García-Chamizo, J.M.; Gomez-Trillo, S.; Valdivieso-Sarabia, R.; Nieto-Hidalgo, M. Smart Management Consumption in Renewable Energy Fed Ecosystems. Sensors 2019, 19, 2967. [Google Scholar] [CrossRef] [PubMed]
- Javed, A.; Larijani, H.; Ahmadinia, A.; Gibson, D. Smart random neural network controller for HVAC using cloud computing technology. IEEE Trans. Ind. Inform. 2016, 13, 351–360. [Google Scholar] [CrossRef]
- Joo, I.-Y.; Choi, D.-H. Distributed optimization framework for energy management of multiple smart homes with distributed energy resources. IEEE Access 2017, 5, 15551–15560. [Google Scholar] [CrossRef]
- Chammas, M.; Makhoul, A.; Demerjian, J. An efficient data model for energy prediction using wireless sensors. Comput. Electr. Eng. 2019, 76, 249–257. [Google Scholar] [CrossRef]
- Parsa, A.; Najafabadi, T.A.; Salmasi, F.R. A Hierarchical Smart Home Control System for Improving Load Shedding and Energy Consumption: Design and Implementation. IEEE Sens. J. 2018, 19, 3383–3390. [Google Scholar] [CrossRef]
- Sundaravadivel, P.; Kesavan, K.; Kesavan, L.; Mohanty, S.P.; Kougianos, E. Smart-Log: A deep-learning based automated nutrition monitoring system in the IoT. IEEE Trans. Consum. Electron. 2018, 64, 390–398. [Google Scholar] [CrossRef]
- Erol, B.A.; Majumdar, A.; Lwowski, J.; Benavidez, P.; Rad, P.; Jamshidi, M. Improved Deep Neural Network Object Tracking System for Applications in Home Robotics. In Computational Intelligence for Pattern Recognition, Pedrycz, W., Chen, S.M., Eds.; Springer: Berlin/Heidelberg, Germany, 2018; Volume 777, pp. 369–395. [Google Scholar]
- Winnicka, A.; Kęsik, K.; Połap, D.; Woźniak, M.; Marszałek, Z. A Multi-Agent Gamification System for Managing Smart Homes. Sensors 2019, 19, 1249. [Google Scholar] [CrossRef]
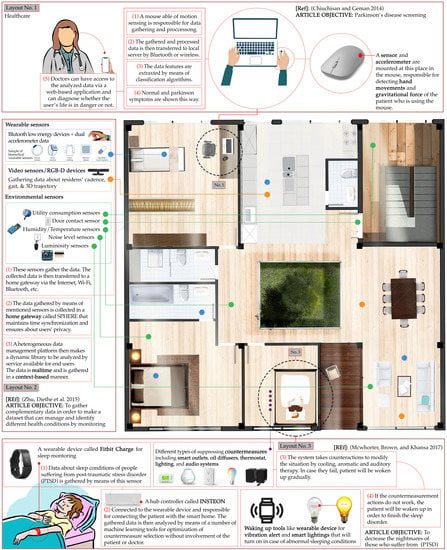
- McWhorter, J.; Brown, L.; Khansa, L. A wearable health monitoring system for posttraumatic stress disorder. Biol. Inspired Cogn. Archit. 2017, 22, 44–50. [Google Scholar] [CrossRef]
- Hassan, M.K.; El Desouky, A.I.; Elghamrawy, S.M.; Sarhan, A.M. Intelligent hybrid remote patient-monitoring model with cloud-based framework for knowledge discovery. Comput. Electr. Eng. 2018, 70, 1034–1048. [Google Scholar] [CrossRef]
- Austerjost, J.; Porr, M.; Riedel, N.; Geier, D.; Becker, T.; Scheper, T.; Marquard, D.; Lindner, P.; Beutel, S. Introducing a virtual assistant to the lab: A voice user Interface for the intuitive control of laboratory instruments. SLAS Technol. Transl. Life Sci. Innov. 2018, 23, 476–482. [Google Scholar] [CrossRef] [PubMed]
- Zhu, N.; Diethe, T.; Camplani, M.; Tao, L.; Burrows, A.; Twomey, N.; Kaleshi, D.; Mirmehdi, M.; Flach, P.; Craddock, I. Bridging e-health and the internet of things: The sphere project. IEEE Intell. Syst. 2015, 30, 39–46. [Google Scholar] [CrossRef]
- Chiuchisan, I.; Geman, O. An approach of a decision support and home monitoring system for patients with neurological disorders using internet of things concepts. WSEAS Trans. Syst. 2014, 13, 460–469. [Google Scholar]
- Enshaeifar, S.; Barnaghi, P.; Skillman, S.; Markides, A.; Elsaleh, T.; Acton, S.T.; Nilforooshan, R.; Rostill, H. The internet of things for dementia care. IEEE Internet Comput. 2018, 22, 8–17. [Google Scholar] [CrossRef]
- Jaouhari, S.E.; Palacios-Garcia, E.J.; Anvari-Moghaddam, A.; Bouabdallah, A. Integrated Management of Energy, Wellbeing and Health in the Next Generation of Smart Homes. Sensors 2019, 19, 481. [Google Scholar] [CrossRef]
- Fink, A. Conducting Research Literature Reviews: From the Internet to Paper; Sage publications: Los Angeles, CA, USA, 2019. [Google Scholar]
- Tranfield, D.; Denyer, D.; Smart, P. Towards a Methodology for Developing Evidence-Informed Management Knowledge by Means of Systematic Review. Br. J. Manag. 2003, 14, 207–222. [Google Scholar] [CrossRef]
- Zhong, B.; Wu, H.; Li, H.; Sepasgozar, S.; Luo, H.; He, L. A scientometric analysis and critical review of construction related ontology research. Autom. Constr. 2019, 101, 17–31. [Google Scholar] [CrossRef]
- Sepasgozar, S.M.; Karimi, R.; Shirowzhan, S.; Mojtahedi, M.; Ebrahimzadeh, S.; McCarthy, D. Delay Causes and Emerging Digital Tools: A Novel Model of Delay Analysis, Including Integrated Project Delivery and PMBOK. Buildings 2019, 9, 191. [Google Scholar] [CrossRef]
- Sepasgozar, S.M.; Li, H.; Shirowzhan, S.; Tam, V.W. Methods for monitoring construction off-road vehicle emissions: a critical review for identifying deficiencies and directions. Environ. Sci. Pollut. Res. 2019, 26, 15779–15794. [Google Scholar] [CrossRef]
- Filho, G.P.R.; Mano, L.Y.; Valejo, A.D.B.; Villas, L.A.; Ueyama, J. A Low-Cost Smart Home Automation to Enhance Decision-Making based on Fog Computing and Computational Intelligence. IEEE. Lat. Am. Trans. 2018, 16, 186–191. [Google Scholar] [CrossRef]
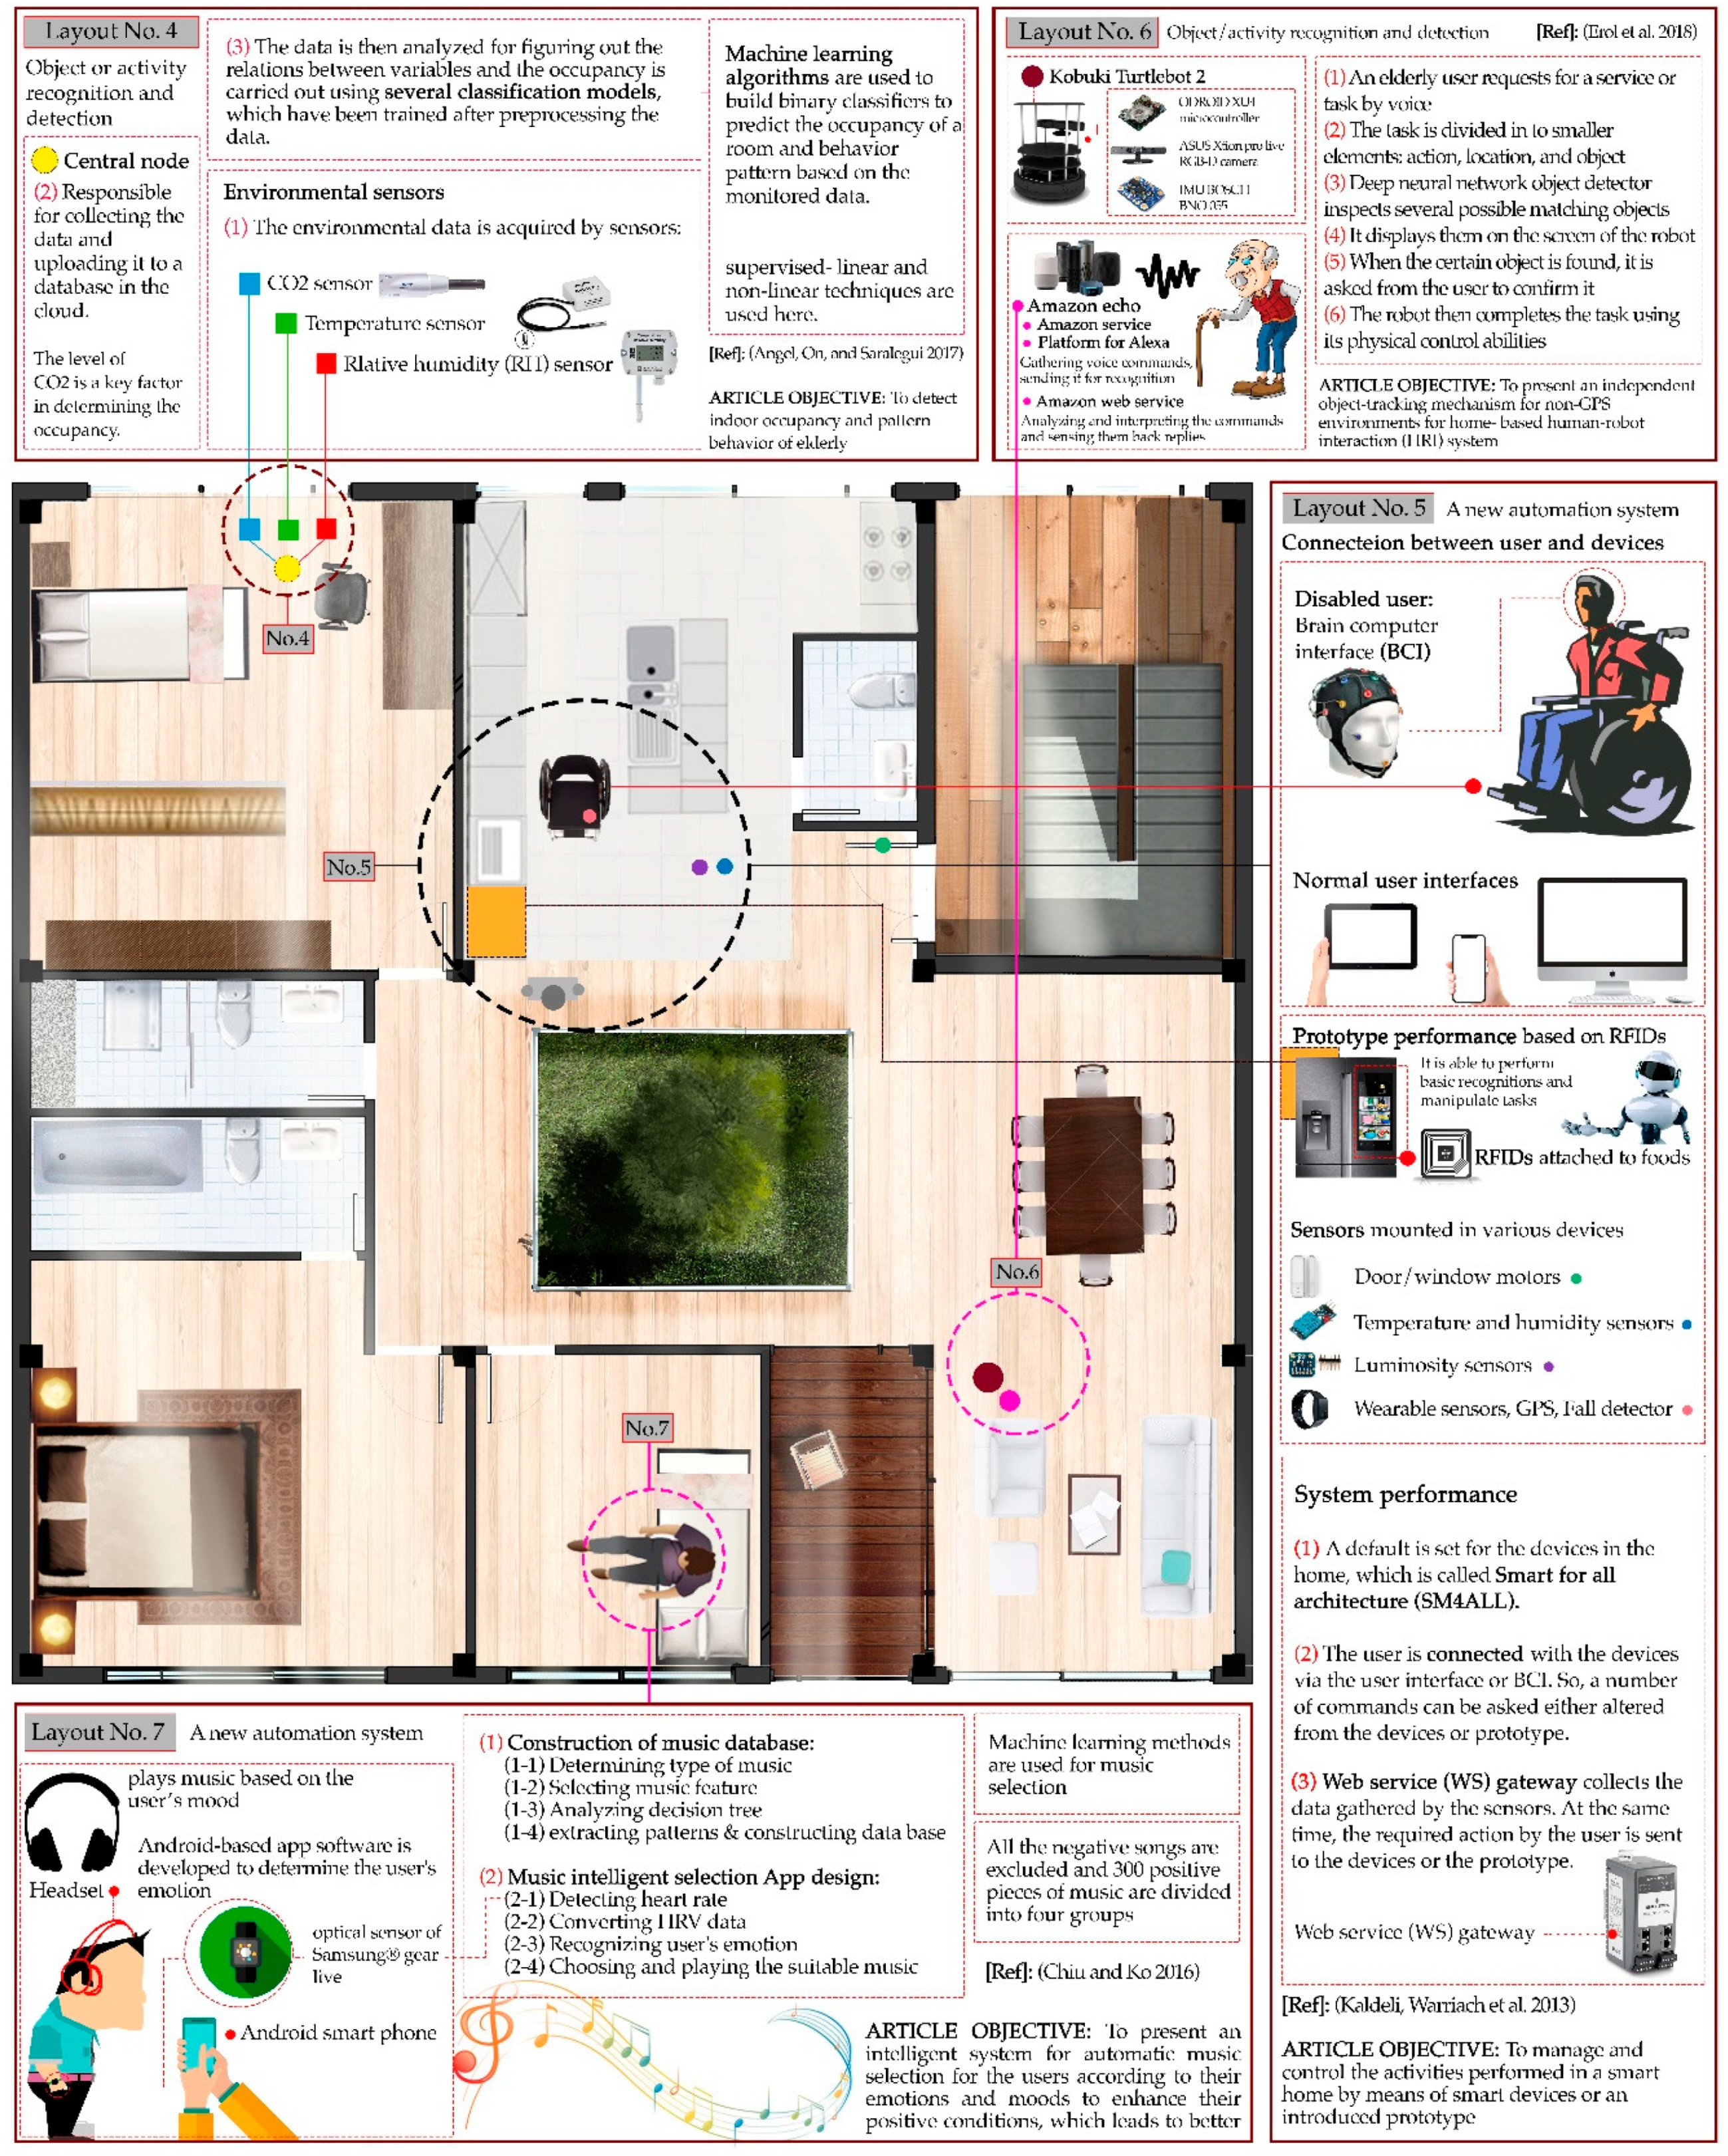
- Chiu, M.-C.; Ko, L.-W. Develop a personalized intelligent music selection system based on heart rate variability and machine learning. Multimed. Tools Appl. 2017, 76, 15607–15639. [Google Scholar] [CrossRef]
- Chatterjee, S.; Kar, A.K.; Gupta, M.P. Success of IoT in Smart Cities of India: An empirical analysis. Gov. Inf. Q. 2018, 35, 349–361. [Google Scholar] [CrossRef]
- Sivanathan, A.; Gharakheili, H.H.; Loi, F.; Radford, A.; Wijenayake, C.; Vishwanath, A.; Sivaraman, V. Classifying IoT Devices in Smart Environments Using Network Traffic Characteristics. IEEE Trans. Mob. Comput. 2019, 18, 1745–1759. [Google Scholar] [CrossRef]
- Kim, S. Revealing household characteristics using connected home products. Inf. Sci. 2019, 486, 52–61. [Google Scholar] [CrossRef]
- Venkatesh, V.; Morris, M.G.; Davis, G.B.; Davis, F.D. User acceptance of information technology: Toward a unified view. MIS Q. Manag. Inf. Syst. 2003, 27, 425–478. [Google Scholar] [CrossRef]
- Davis, F.D. User acceptance of information technology; system characteristics, user perceptions and behavioral impacts. Int. J. Manag. Mach. Stud. 1993, 38, 475–487. [Google Scholar] [CrossRef]
- Foroozanfar, M.; Sepasgozar, S.M.E.; Arbabi, H. An empirical investigation on construction companies’ readiness for adopting sustainable technology. In Proceedings of the 34th International Symposium on Automation and Robotics in Construction and Mining (ISARC 2017), Taipei, Taiwan, 1 January 2017; pp. 925–936. [Google Scholar]
- Sepasgozar, S.M.; Davis, S.; Loosemore, M.; Bernold, L. An investigation of modern building equipment technology adoption in the Australian construction industry. Eng. Constr. Archit. Manag. 2018, 25, 1075–1091. [Google Scholar] [CrossRef]
- Sepasgozar, S.M.; Davis, S. Construction Technology Adoption Cube: An Investigation on Process, Factors, Barriers, Drivers and Decision Makers Using NVivo and AHP Analysis. Buildings 2018, 8, 74. [Google Scholar] [CrossRef]
- Shirowzhan, S.; Sepasgozar, S.M.E.; Edwards, D.J.; Li, H.; Wang, C. BIM compatibility and its differentiation with interoperability challenges as an innovation factor. Autom. Constr. 2020, 112, 103086. [Google Scholar] [CrossRef]
- Jiang, H. Mobile Fire Evacuation System for Large Public Buildings Based on Artificial Intelligence and IoT. IEEE Access 2019, 7, 64101–64109. [Google Scholar] [CrossRef]
- Sodagari, S. Application of Asynchronous Weak Commitment Search in Self Organized Cognitive Radio Networks. Int. J. Wirel. Inf. Netw. 2017, 24, 404–412. [Google Scholar] [CrossRef]
- Lynggaard, P. Using machine learning for adaptive interference suppression in wireless sensor networks. IEEE Sens. J. 2018, 18, 8820–8826. [Google Scholar] [CrossRef]
- Liu, J.; Zhang, C.; Fang, Y. EPIC: A Differential Privacy Framework to Defend Smart Homes Against Internet Traffic Analysis. IEEE Internet Things J. 2018, 5, 1206–1217. [Google Scholar] [CrossRef]
- Jiang, X.; Gao, Y.; Fang, Z.; Wang, P.; Huang, B. An End-to-End Human Segmentation by Region Proposed Fully Convolutional Network. IEEE Access 2019, 7, 16395–16405. [Google Scholar] [CrossRef]
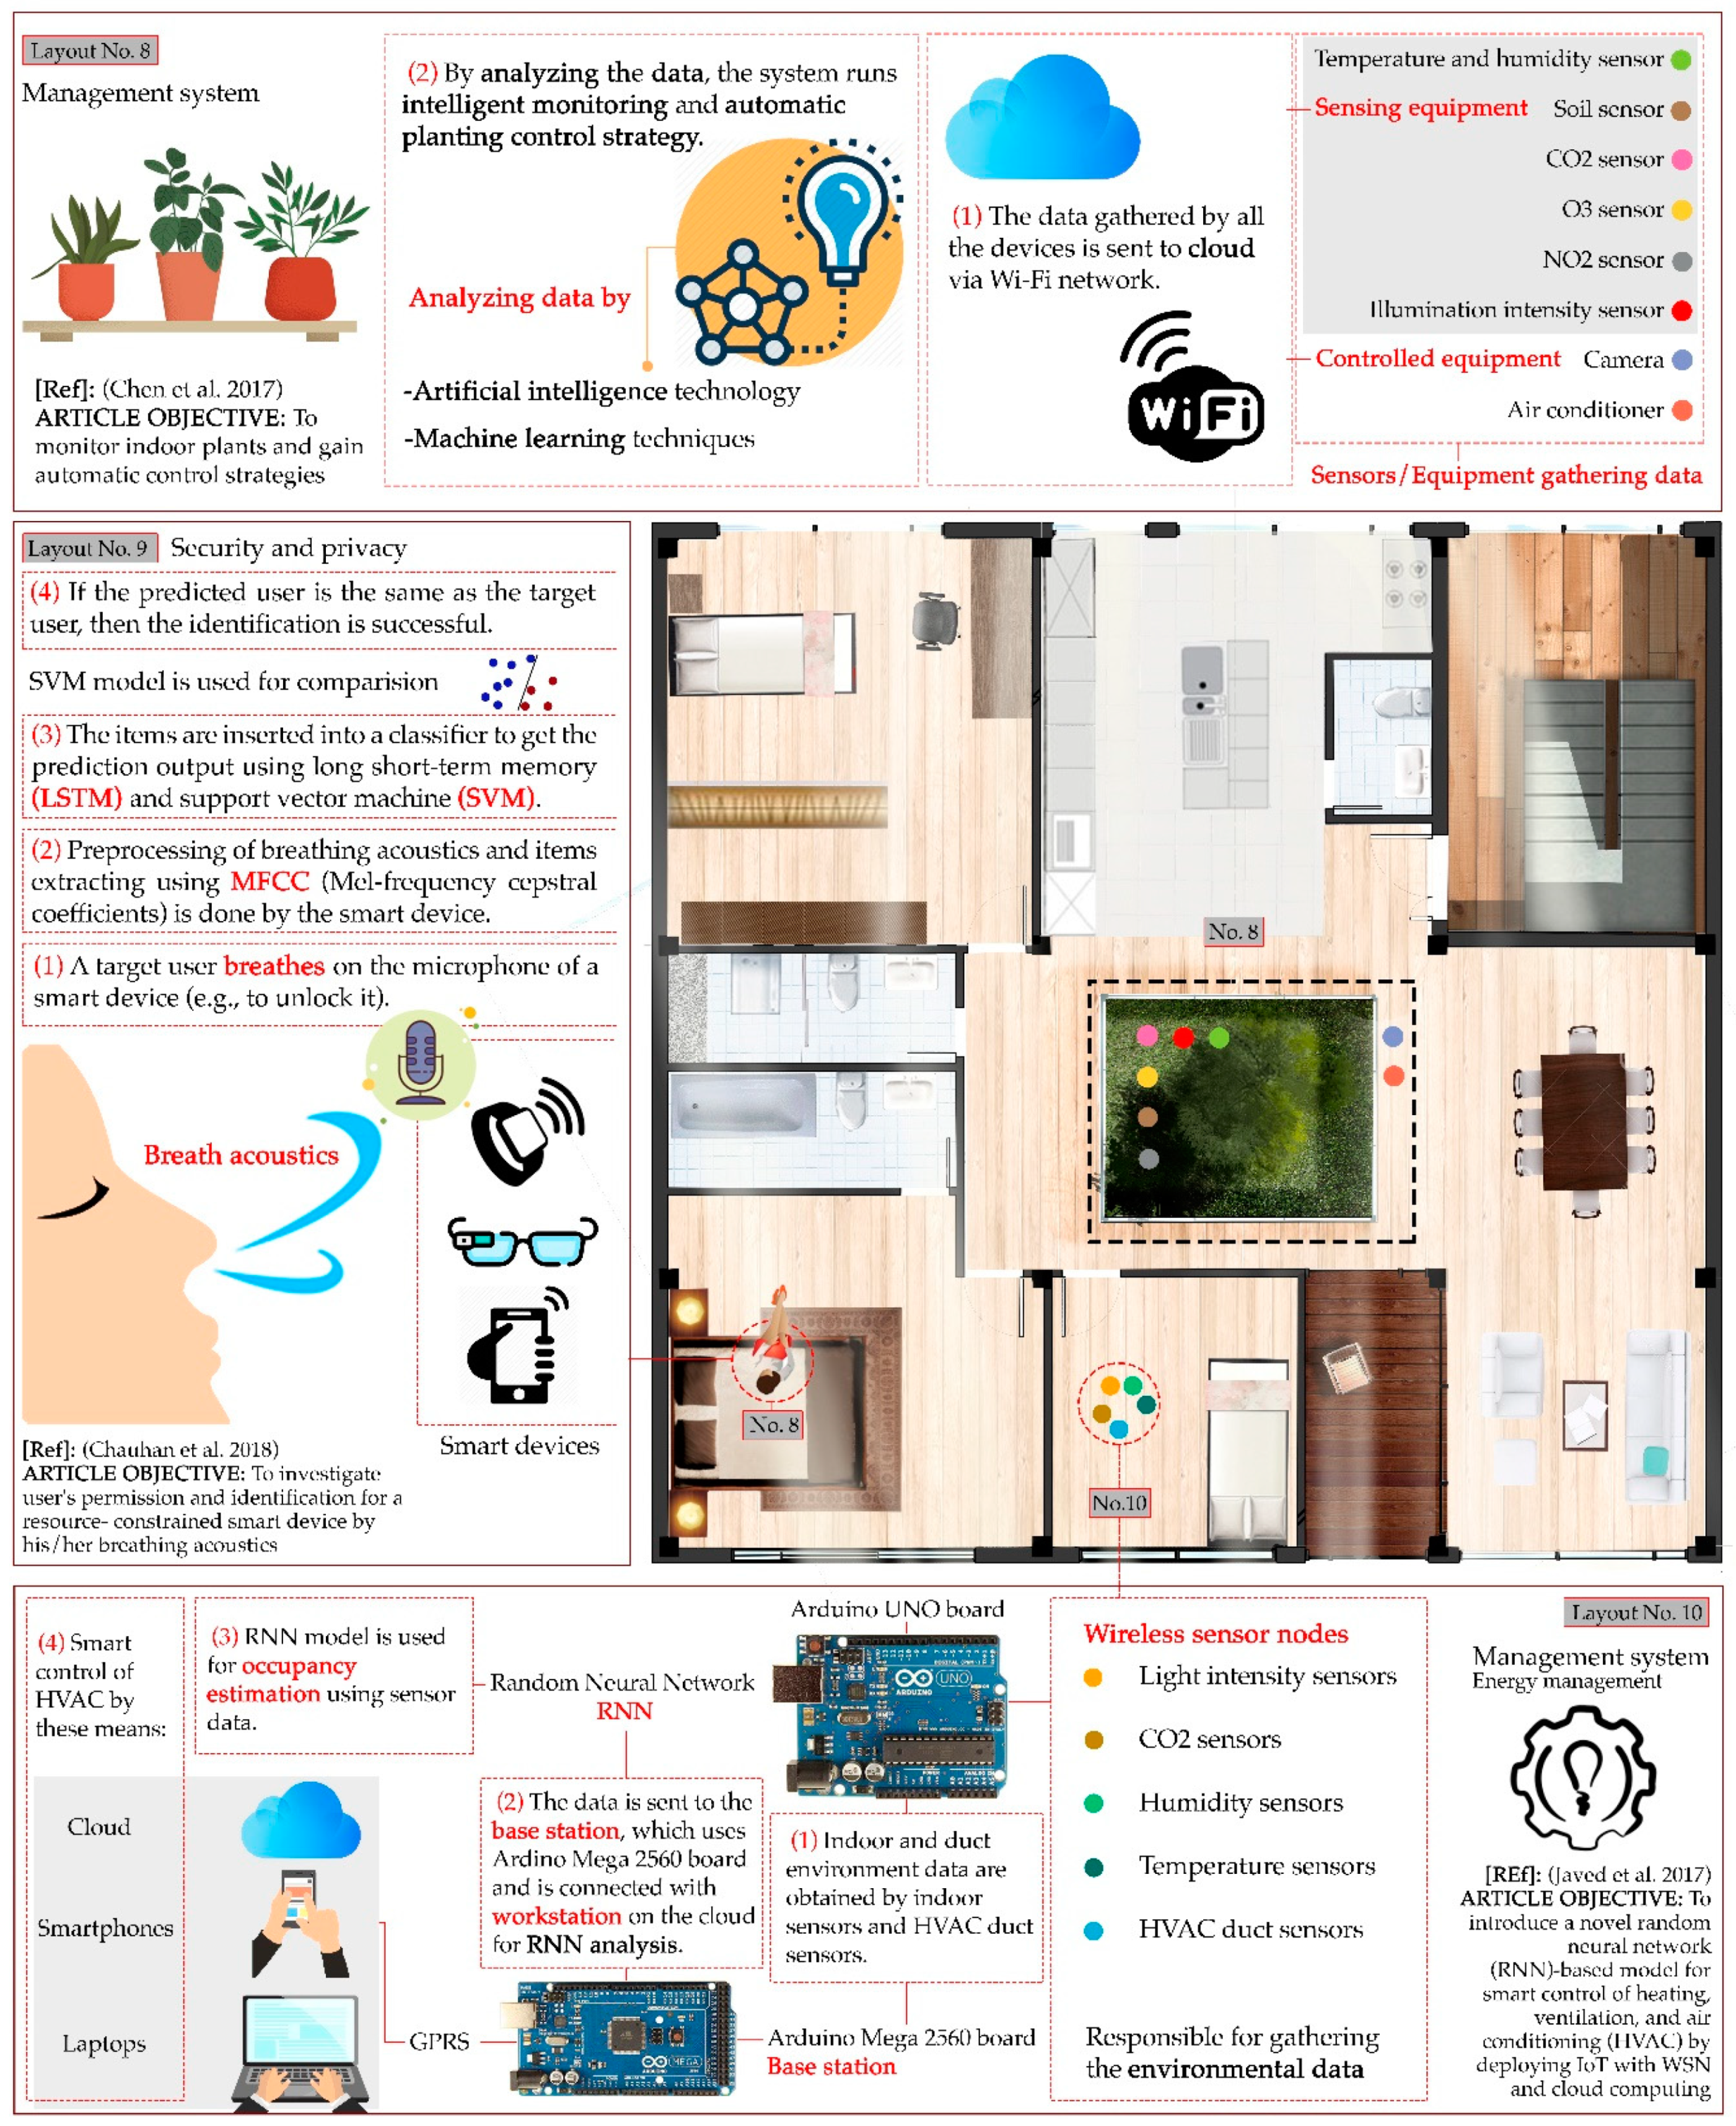
- Chen, M.; Yang, J.; Zhu, X.; Wang, X.; Liu, M.; Song, J. Smart home 2.0: Innovative smart home system powered by botanical IoT and emotion detection. Mob. Netw. Appl. 2017, 22, 1159–1169. [Google Scholar] [CrossRef]
- Chauhan, J.; Seneviratne, S.; Hu, Y.; Misra, A.; Seneviratne, A.; Lee, Y. Breathing-Based Authentication on Resource-Constrained IoT Devices using Recurrent Neural Networks. Computer 2018, 51, 60–67. [Google Scholar] [CrossRef]
- Saralegui, U.; Antón, M.A.; Ordieres-Mere, J. Taking advantage of an existing indoor climate monitorization for measuring occupancy. WSEAS Trans. Environ. Dev. 2017, 13, 327–334. [Google Scholar]
- Kaldeli, E.; Warriach, E.U.; Lazovik, A.; Aiello, M. Coordinating the web of services for a smart home. ACM Trans. Web (TWEB) 2013, 7, 10. [Google Scholar] [CrossRef]
- Yuan, Q. Chen, I.M. Localization and velocity tracking of human via 3 IMU sensors. Sens. Actuators A Phys. 2014, 212, 25–33. [Google Scholar] [CrossRef]
- Pinheiro, A.J.; Bezerra, J.d.M.; Burgardt, C.A.; Campelo, D.R. Identifying IoT devices and events based on packet length from encrypted traffic. Comput. Commun. 2019, 144, 8–17. [Google Scholar] [CrossRef]
- Thome, J.; Li, A.; Sivaraman, V.; Bridge, C. Mobile crowdsourcing older people’s opinions to enhance liveability in regional city centres. In Proceedings of the 2014 IEEE Ninth International Conference on Intelligent Sensors, Sensor Networks and Information Processing (ISSNIP), Singapore, 21–24 April 2014; pp. 1–7. [Google Scholar]
- Shirowzhan, S.; Tan, W.; Sepasgozar, S.M. Digital Twin and CyberGIS for Improving Connectivity and Measuring the Impact of Infrastructure Construction Planning in Smart Cities. ISPRS Int. J. Geo-Inf. 2020, 9, 240. [Google Scholar] [CrossRef]
- Sepasgozar, S.M.; Forsythe, P.; Shirowzhan, S. Evaluation of terrestrial and mobile scanner technologies for part-built information modeling. J. Constr. Eng. Manag. 2018, 144, 04018110. [Google Scholar] [CrossRef]
- Sepasgozar, S.M.; Lim, S.; Shirowzhan, S. Implementation of Rapid As-built Building Information Modeling Using Mobile LiDAR. In Proceedings of the Construction Research Congress, Construction in a Global Network, Atlanta, Georgia, 19–21 May 2014; ASCE: Altanta, Georgia, 2014; pp. 209–218. [Google Scholar]
- Shirowzhan, S.; Lim, S.; Trinder, J. Enhanced autocorrelation-based algorithms for filtering airborne lidar data over urban areas. J. Surv. Eng. 2016, 142, 04015008. [Google Scholar] [CrossRef]
- Shirowzhan, S.; Trinder, J. Building classification from lidar data for spatio-temporal assessment of 3D urban developments. Procedia Eng. 2017, 180, 1453–1461. [Google Scholar] [CrossRef]
- Shirowzhan, S.; Sepasgozar, S.M.; Li, H.; Trinder, J.; Tang, P. Comparative analysis of machine learning and point-based algorithms for detecting 3D changes in buildings over time using bi-temporal lidar data. Autom. Constr. 2019, 105, 102841. [Google Scholar] [CrossRef]
- Shank, D.B.; Graves, C.; Gott, A.; Gamez, P.; Rodriguez, S. Feeling our way to machine minds: People’s emotions when perceiving mind in artificial intelligence. Comput. Hum. Behav. 2019, 98, 256–266. [Google Scholar] [CrossRef]
- Sepasgozar, S.M.E.; Loosemore, M. The role of customers and vendors in modern construction equipment technology diffusion. Eng. Constr. Archit. Manag. 2017, 24, 1203–1221. [Google Scholar] [CrossRef]
- Sepasgozar, S.M.; Davis, S.R.; Loosemore, M. Dissemination Practices of Construction Sites’ Technology Vendors in Technology Exhibitions. J. Manag. Eng. 2018, 34, 04018038. [Google Scholar] [CrossRef]
- Rogers, E.M. Diffusion of Innovations; Simon and Schuster: New York, NY, USA, 2010. [Google Scholar]
- Sepasgozar, S.M.; Loosemore, M. Modelling the Construction On-Site Technology Adoption Process. In Proceedings of the 2016 Modular and Offsite Construction [MOC] Summit, Edmonton, AB, Canada, 29 September 2016. [Google Scholar]
- Sepasgozar, S.; Shirowzhan, S.; Wang, C.C. A Scanner Technology Acceptance Model for Construction Projects. Procedia Eng. 2017, 1237–1246. [Google Scholar] [CrossRef]
- Sepasgozar, S.M.; Davis, S. Digital Construction Technology and Job-site Equipment Demonstration: Modelling Relationship Strategies for Technology Adoption. Buildings 2019, 9, 158. [Google Scholar] [CrossRef]
- Sepasgozar, S.M.; Davis, S.R.; Li, H.; Luo, X. Modeling the Implementation Process for New Construction Technologies: Thematic Analysis Based on Australian and US Practices. J. Manag. Eng. 2018, 34, 05018005. [Google Scholar] [CrossRef]


| Keyword and Relevant Acronym | Definition |
|---|---|
| Artificial Intelligence (AI) | A potential solution to cognitive problems that are regularly related to human intelligence, such as learning, solving problems, and recognizing patterns [8]. |
| Artificial Neural Network (ANN) | This refers to algorithms that mimic biological neural networks. These kinds of systems mostly include a large number of connected computational units/nodes and act by means of learning from the input data with the aim of optimizing the result [9]. |
| Big Data (BD) | Dealing with a large amount of data, which is complex and dependent on different sources; characterized by volume, velocity, variety, and veracity [10]. |
| Dashboard or Display Device (DD) | A graphical user interface, providing key performance indicators of particular objectives or business processes. Used for energy consumption and healthcare [11]. |
| Deep Learning (DL) | A way of allowing computational models, including processing layers, to learn data representations with different levels of abstraction [12]. |
| Intelligent | A general ability of the mind, which relates to reasoning, planning, resolving problems, thinking, comprehending difficult ideas, learning quickly, and learning based on experience [13]. Intelligence is considered as a composition of functions and abilities that are needed for surviving and improvement in a special culture [14]. |
| Internet of Things (IoT) | Connected sensors together by means of the cloud, which enables them to communicate with each other in a wireless manner [15]. A network of objects from sensors to smartphones or tablets [7]. |
| Machine Learning (ML) | A number of patterns are learned from data given to the machine targeted to make sense of previous unfamiliar data, and to process a big deal of data for the tasks like recognizing images, speech, patterns, or optimizing strategies [16]. |
| Neural Network (NN) | A network of simple interconnecting elements like nodes or units that is based on animal neurons. The network processing ability is gathered in the interunit connection strengths and weights and is made by the learning process [17]. |
| Real-Time Monitoring (RTM) | This term is referred to a combination of sensors (i.e., data gathering systems) that are connected to the Internet and gives the ability to monitoring and transferring data in a short period of time to be analyzed or actioned [18]. |
| Smart | The use of autonomy, context awareness, and connectivity make a device or object smart, e.g., features of a smart chair includes: (1) It has a sensor(s) to be aware of the context, where it is located; (2) It has the ability to process the gathered data and take relevant actions by means of autonomous computing; and (3) It transfers the gathered data via network because it is connected to somewhere else [7]. |
| Smart Home (SH) | (1) The utilization of systems, such as lighting, heating, air conditioning, television, entertainment, audio, visual, security, and camera, are connected to and can communicate with each other [19]. (2) Home common devices with the possibility to control the features of the home; interior spaces; monitor occupants’ activities and behavior; and control and manage energy-based systems like lighting or heating unit. Not only turning devices off or on, but it can also control the interior environment and monitor the activities within the occupied house [20]. (3) A group of intelligent appliances at home, which can become aware of occupants’ requirements and needs, and providing with high-quality life experience with intuitive interfaces for users without using complicated technologies [21]. (4) Systems to give the users the ability to control a number of electronic devices by means of entering a command remotely. For example, using a smartphone to control home devices and manage energy (i.e., lighting) remotely when traveling [22]. |
| Smart Home Energy Management System (SHEMS) | Optimizing the energy system refers to “energy management” [23]. It tends to decrease the total electricity bill, but also tries to meet the needs of users at the same time. Such systems are responsible for modifying and adjusting the control setting of each load or device at home based on real-time price changes, a desirable level of comfort, and the environmental temperature [24]. |
| Issue | Selected Cases and Reported Advantages of Using Smart Systems |
|---|---|
| Energy consumption | 9.5% reduction in electricity consumption [28]; a reduction of 30% in the amount of heat energy and greenhouse gas emissions [29]; 38% reduction by means of using both voltage control and shifting in appliances [27]; a decrease from 10,750 kWh to 7167 kWh [26]; 10% energy consumption reduction in buildings [30] |
| Smart home market | In 2017, the annual growth rate of the smart home was 14.5%, and its market is predicted to see a rise to USD 53.45 billion by 2022 [31] |
| Smart home appliances | This market was predicted to experience growth from USD 40 million to 26 billion by 2019. So, it would have increased dramatically by 650 times more than that of 2012 [32] |
| Entertainment and communication | A survey conducted in August 2014 showed that people believe a smart home enhances the convenience (83% agreed), security (71% agreed), and communication/entertainment (60% agreed) [33]. |
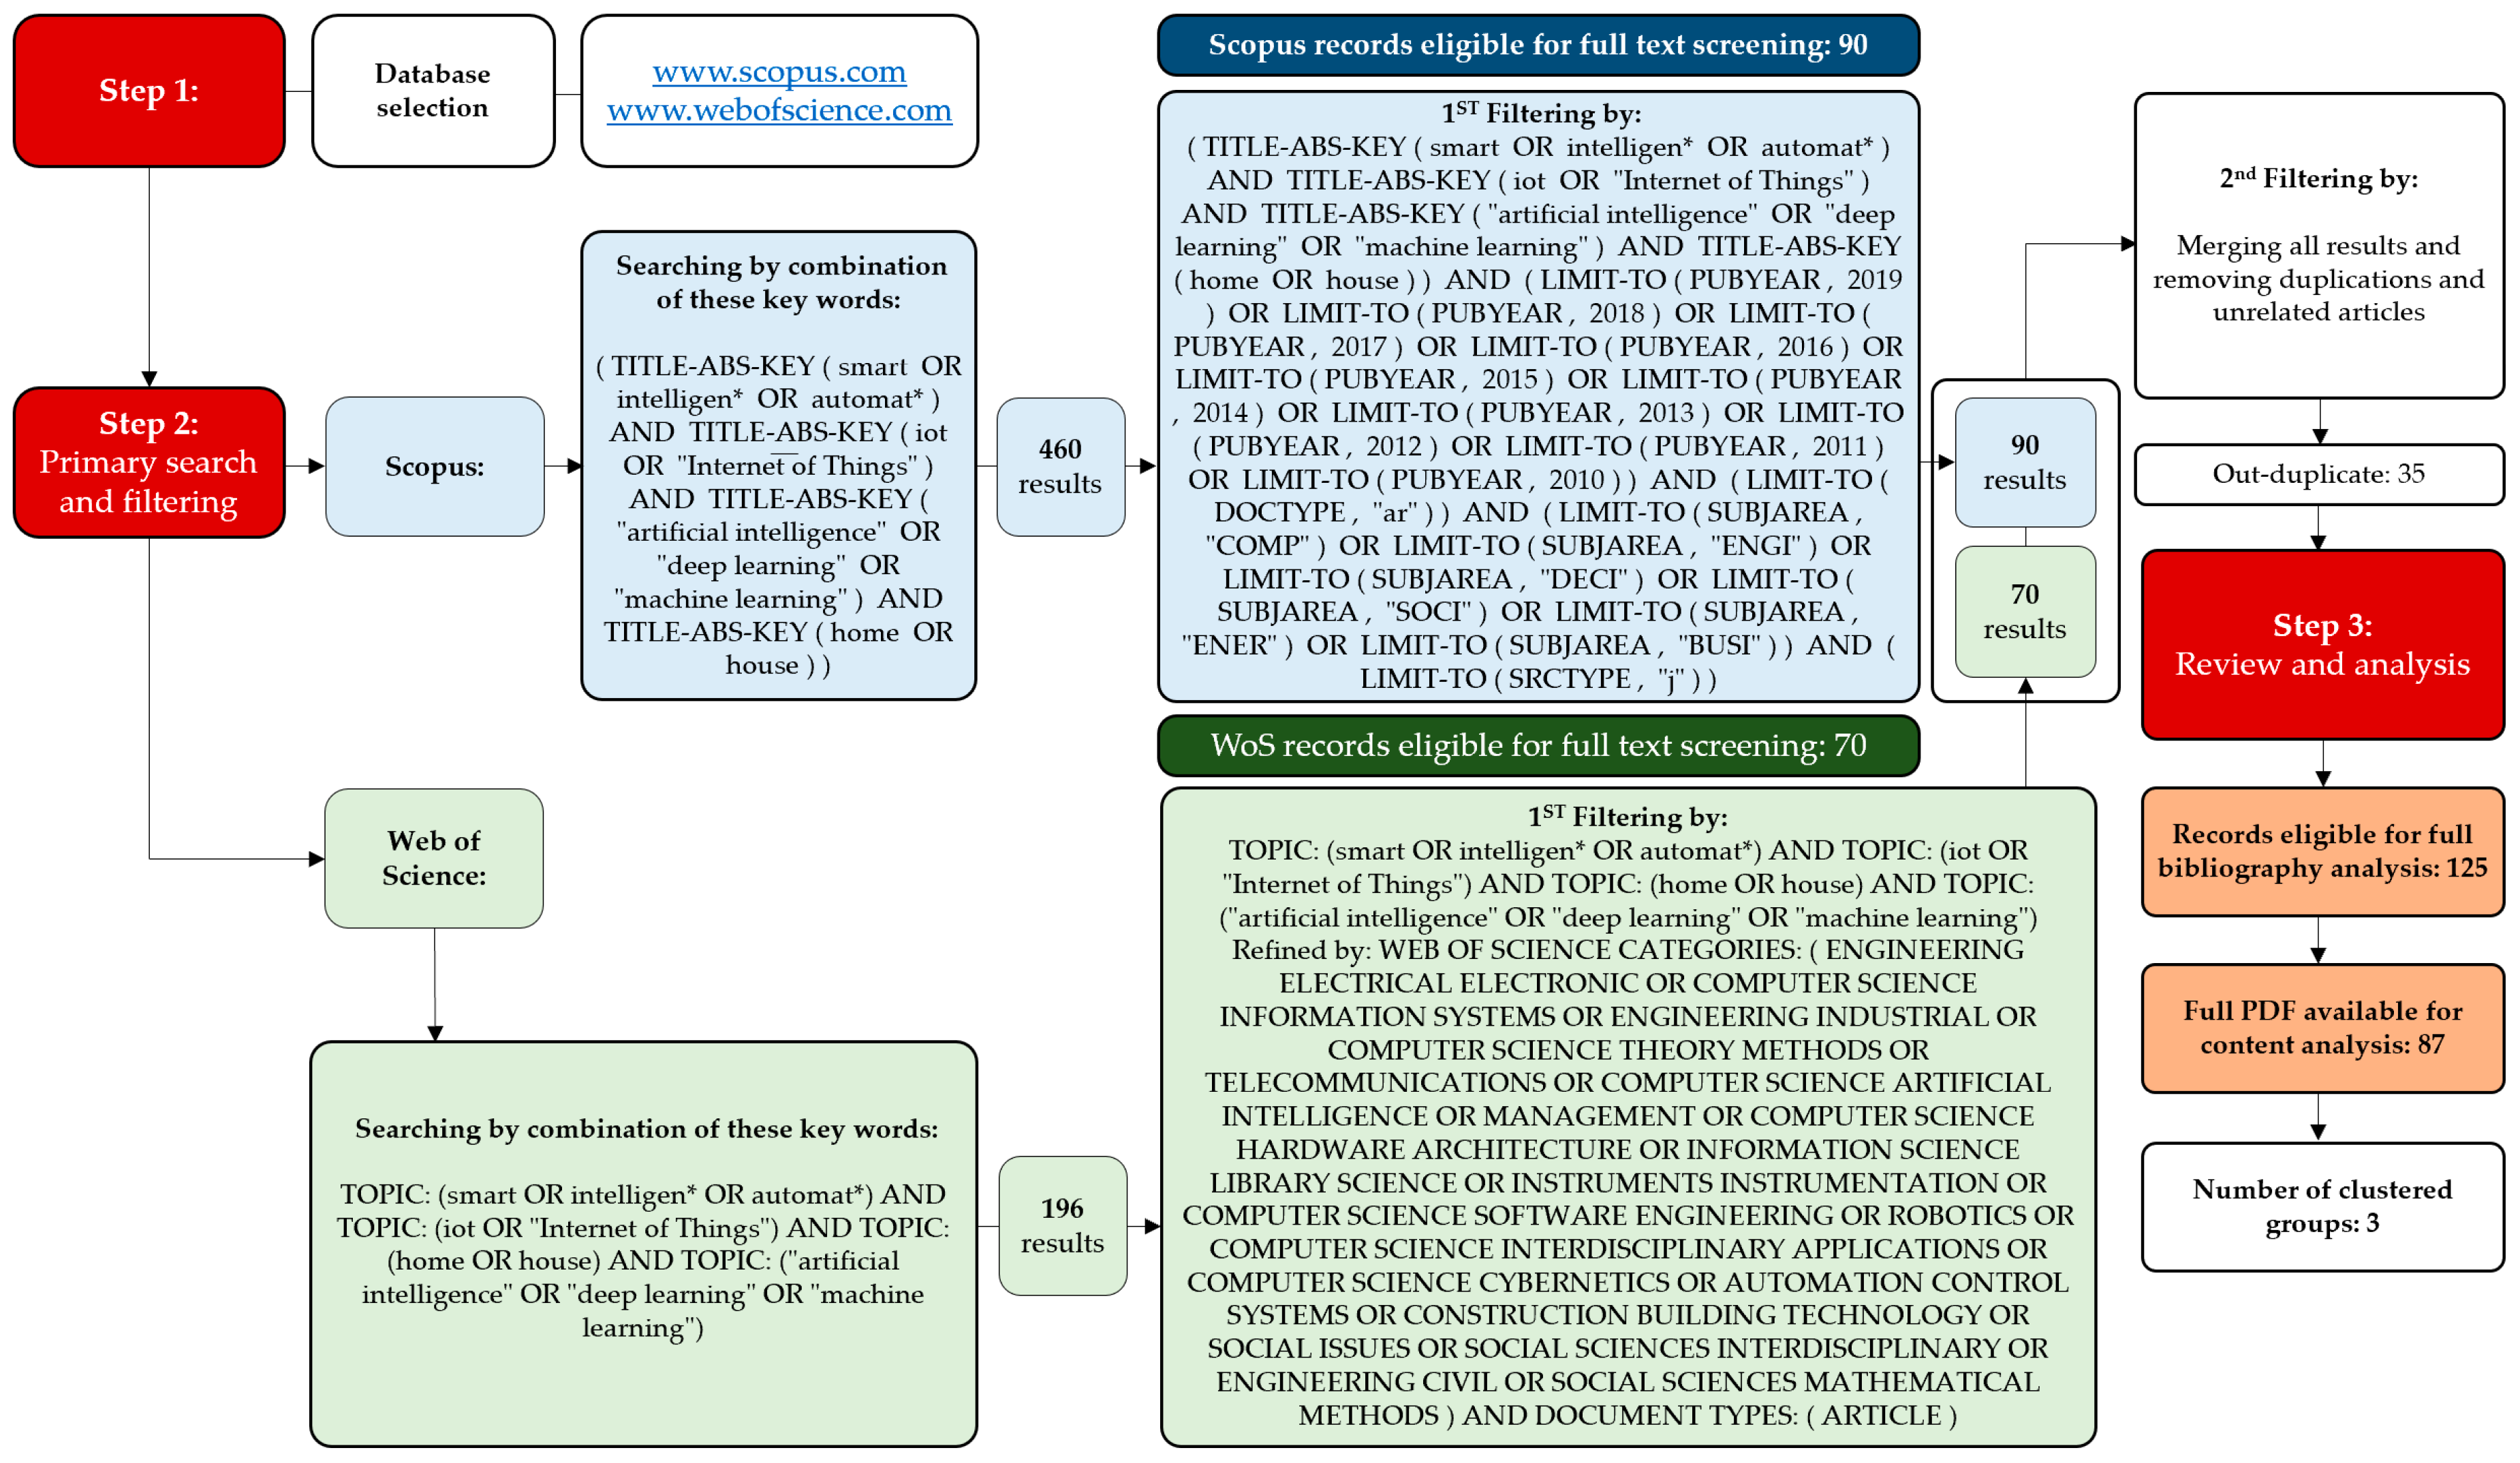
| Source | Search Phrase | 1990–2019 | Filters Applied and Limited 2010–2019 * |
|---|---|---|---|
| Scopus | TITLE-ABS-KEY(((smart OR intelligen * OR automat *) AND (iot OR “Internet of Things”) AND (“artificial intelligence” OR “deep learning” OR “machine learning”) AND (home OR house))) | 460 | 90 |
| Web of Science | TOPIC: (((smart OR intelligen * OR automat *) AND (iot OR “Internet of Things”) AND (“artificial intelligence” OR “deep learning” OR “machine learning”) AND (home OR house))) | 196 | 70 |
| After merging all results and removing duplications | 125 | ||
| Topic and Objective | Technology and Feature | Outcome and Future Suggestion |
|---|---|---|
| Micro grid-level energy management approach based on wind speed and solar irradiance to predict the energy generated by distributed energy resources (DERs). Green energies, which are generated from the wind and the sun are two dominant resources focused on [40]. | The multi-headed convolutional neural network (MH-CNN) model is used. Compared persistence and smart persistence models as baselines. The study is done based on the data gathered from San Francisco, New York, and Las Vegas. | The prediction error in wind speed prediction falls by 44.94% in root mean square error (RSME), 46.12% mean absolute error, and 2.25% in symmetric mean absolute percentage error (sMAPE). The errors in the solar irradiance prediction are also decreased by 7.68% in RSME, 54.29% in mean bias error (MBE), and 0.14% in sMAPE. Another upside of the usage of DERs is a drop in the electricity bills by 38%. |
| PLUG-N-HARVEST architecture is used for controlling near-zero adaptable/dynamic building envelopes (ADBE) with a safe connection between cloud systems and building infrastructure [41]. | The architecture part is based on Z-wave technology and is called PLUG-N-HARVEST. An energy management system (EMS) used, including the intelligent management and control system (IMCS) and optimal energy management system (OEMS). | The ‘energy consumption’ and ‘comfort conditions’ are upgraded by the use of cloud intelligent management, and this result is based on the prototype implemented in Spain. Have suggested evaluating the whole performance of EMS with other infrastructures, such as ADBE, renewable energy sources, and energy storage. |
| A smart home EMS: ADP is used to improve an energy management system (EMS) in order to decrease the electricity bills and minimize the uncertainty of the power, which is exchanging between the grid and the user [42]. | A network of wireless sensors, electrical appliances, a cloud-based data collector, AI, and a programming algorithm that is dynamic is the component of this system. The wireless sensors use message queue telemetry transport (MQTT), which is a lightweight messaging protocol. | System evaluation: a test bench, including four smart homes, which take advantage of the proposed EMS system. The test results showed that the uncertainty of the power exchanged between the grid and the user falls to 2.88% and also showed a fall of 3.23% in the electricity bills. Further, the system should be tested in real smart homes, and other functions, such as the health state of the battery in the EMS formulation, should be improved. |
| Smart management consumption and integrating smart devices, which consume their own produced energy [43]. | The system includes IoT nodes, local smart-grid Internet, and the cloud service. | The system is installed in a house, and its effectiveness is evaluated and showed that it is easy to design, install, and operate, and cost-efficient. |
| HVAC smart random neural network controller that integrates WSN with cloud computing that includes introducing a novel random neural network (RNN)-based model for smart control of heating, ventilation, and air conditioning (HVAC) by deploying IoT with WSN and cloud computing [44]. | The controller includes wireless sensor nodes for monitoring humidity, temperature, CO2 with Arduino UNO boards/ 2-kB RAM/ 32 kB program memory; an HVAC control panel; GPRS; cloud; smartphone and laptop; web portal interface; random neural network (RNN); hybrid particle swarm optimization and sequential quadratic programming (PSO-SQP training algorithm). | (1) The accuracy of occupancy is 92.48%, with an error of 3.81% for estimating +/−1 person. (2) PSO-SQP training algorithm gives 76.76% less MSE compared to the GD training algorithm. (3) The power consumption of the intelligent controller in case 3—embedding the intelligence in the base station and sensor nodes—is 4.4% lower than Case 1 and 19.23% lower than Case 2. (4) Case 3 performs better than other cases in terms of control decision delay. The control decision delay of case 3 is 7 ms. |
| Smart home energy management [45] to reduce the energy cost by utilizing renewable energy sources (RES) with respect to the user’s operation preferences. A system is proposed, namely, quality of experience (QoE)-aware smart home energy management (SHEM) system. | QoE-aware cost-saving appliance for scheduling (Q-CSAS) algorithm to control loads based on each user’s profile. Micro wind turbines and smart grid for RES power supply solar panels are proposed. | In profile creation of the user’s process, the larger shift in start times results in the greater annoyance scale. The cost-saving amount of QoE-aware SHEM without RES is 22% and 33% with RES. The highest cost difference compared between QoE-aware and QoE-unaware is conducted for HVAC and electric oven. In the QoE-unaware cost, saving ranges from 33% without RES to 46% with RES. |
| An efficient data model for energy prediction using a wireless sensor network (WSN) to decrease energy consumption in order to be cost-effective in homes and increase precise energy prediction [46]. | A multilayer perceptron (MLP) algorithm for energy prediction is used with the CARET algorithm for splitting data in the dataset; the BORUTA package dataset; a multi-layer feed-forward neural network for modeling energy consumption; Adam optimizer algorithm with a beginning rate of 0.005 and batch size of 500. | Findings of the experiment showed that: The second best MLP is tested in the best scenario (weather and temporal data), and the results are 63% R2, 60.03% RMSE, 27.45% MAE, and 26.85% MAPE. Adding temporal data has enhanced the outputs up to 1% in each experiment. The temporal information has increased the performance of each system, while the light feature has decreased the functioning. Weather data is sufficient for energy consumption predictions. More experimentations are required for validation of the system. |
| A framework for energy management to propose a distributed optimization algorithm for scheduling the energy consumption of multiple smart homes with distributed and centralized energy resources [45]. | Compared the distributed home energy management system (DHEMs) optimization algorithm with a centralized home energy management system (CHEMs). | The cost of electricity in DHEMS is less than that of CHEMS, but with a larger cost of discomfort. DHEMs decreases the computational time, ease of use, and avoids the failures due to cyber-attacks. The proposed distributed algorithm should be tested in a large-scale realistic network with low voltage. |
| An appliance control System for improving load shedding and energy consumption [47]. | Includes supervisory and secondary controllers, including fuse with a wireless transceiver using the Zigbee protocol. Smart plugs, the brute-force search algorithm, conservation voltage reduction, and connection platform. | With applying restrictions along with a 10% voltage reduction, the total power consumption is less than the case without any aforementioned conditions and more than the case with only considered restrictions, although the user satisfaction is less in the last case. |
| Topic and Objective | Technology and Feature | Outcome and Future Suggestion |
|---|---|---|
| A deep-learning for monitoring nutrition called smart log in the IoT [48]. | An optical character recognition (OCR) for obtaining nutrition data; Belief network (BN) or Bayesian for food classification is used. | The accuracy of the smart-log is 98.6%. Have suggested tracking user activities for precise automated diet prediction, integrating smart-log with a physiological observing mechanism. |
| A home-based human-robot interaction (HRI) system object-tracking mechanism for non-GPS environments using an improved deep neural network object tracking system for applications in home robotics [49]. | The system consists of the assistive robot: Kobuki Turtlebot 2, modified with ASUS Xtion Pro Live RGB-D camera, powered with a microcontroller, and BOSCH BND055 IMU installed camera. Amazon web services. Alexa custom skill software. Deep convolutional neural networks (CNN). | A resulting plot of a chair detected, while the camera frame moves closer to the chair, shows that raw confidence level of a special object that is tracked by the multi-object detector is noisy; while the filtered data shows a general boosting trend of confidence, providing a true positive detection of the object. Suggested integrating all the decoupled systems to make a comprehensive robotic assistant. |
| A multi-agent system for gamification between householders and also between families managing smart homes [50]. | Includes environmental sensors, such as motion sensors and gas sensors; backpropagation for numerical values, or RMSProp for graphical data; graphics processor and numerical value processor to make the analysis process faster. | The system is evaluated in two groups of experiments, including three families. The gamification results showed that the participants had lots of fun, but in some cases, its effect of enthusiasm for getting more score had some negative results. For example, the agents turned the lights on during the sleeping time at night. |
| Two-tier anomaly detection based on traffic profiling of the home automation system [42]; To find anomalies by using the network operator in the security of a home area network | A two-tier intrusion detection system, which takes advantage of a machine learning method to look for strange anomalies at the data center. The main algorithm used is a data classification algorithm, namely, a naïve Bayesian classifier (NBC). | The findings of the simulation indicate that local anomalies can be useful in terms of signs of potential attacks for identification of the strange act of the endpoints. |
| Topic and Objective | Technology and Feature | Outcome and Future Suggestion |
|---|---|---|
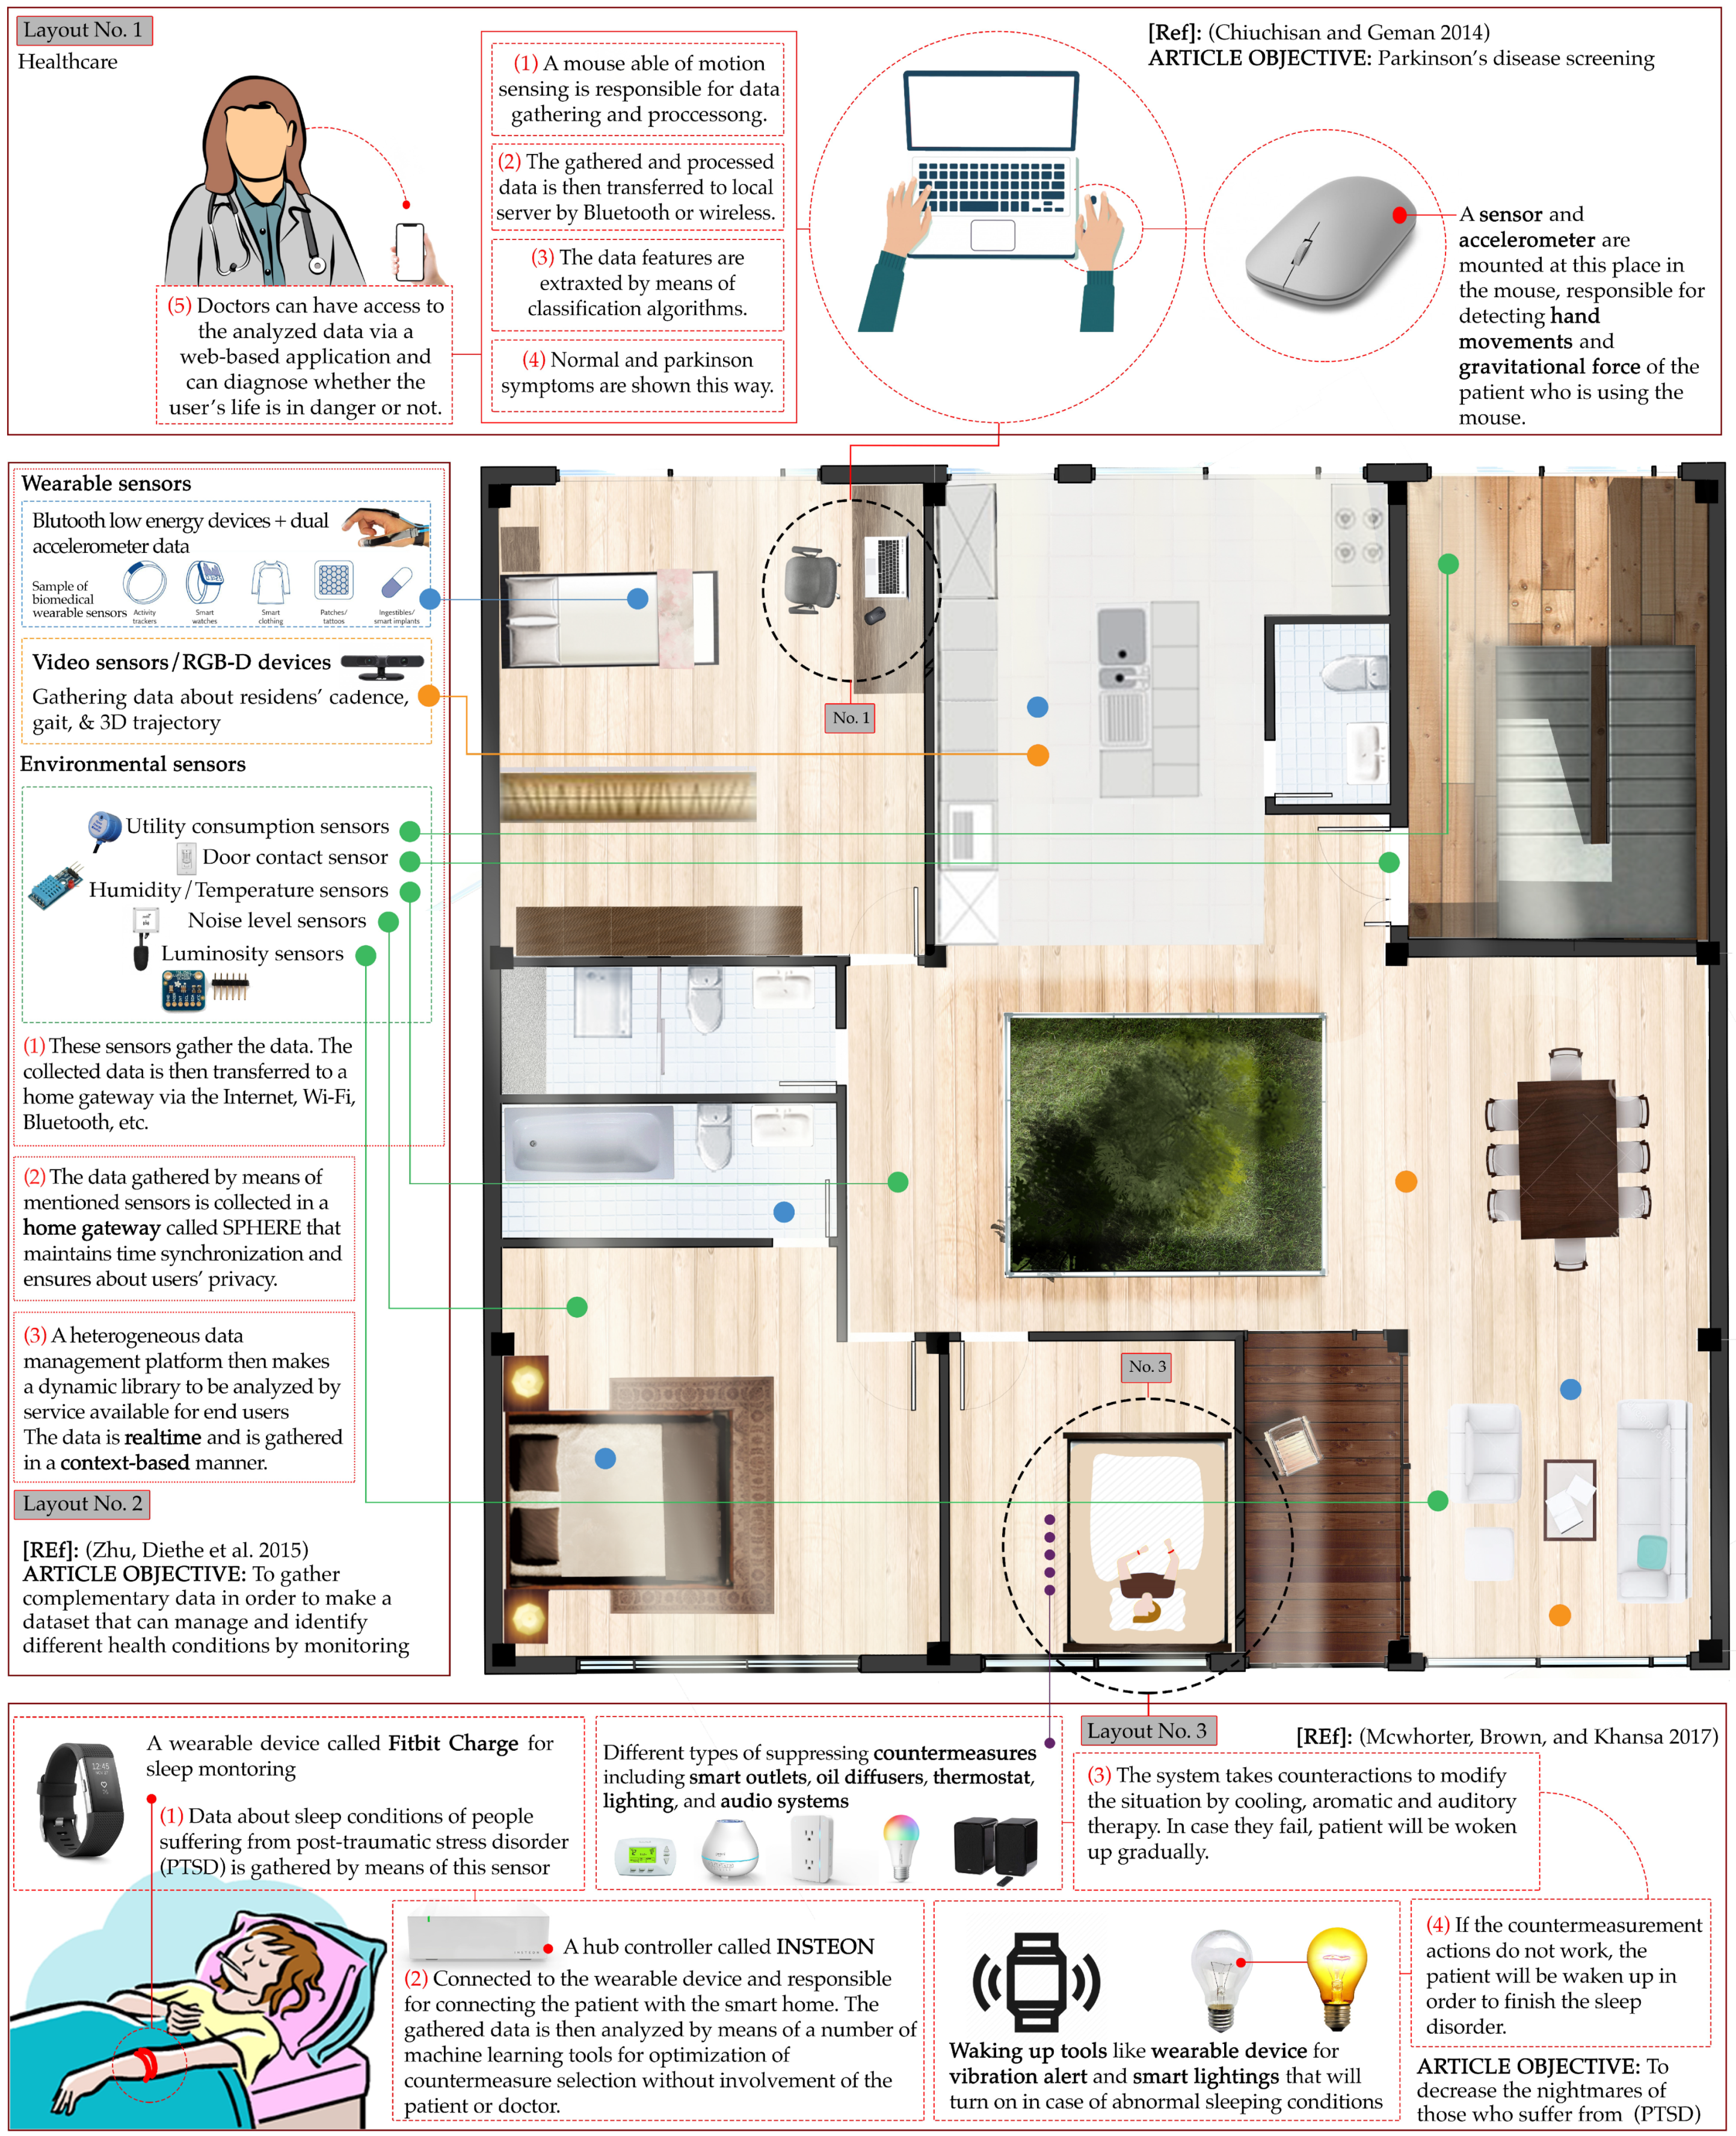
| A wearable health monitoring system to decrease the nightmares of those who suffer from post-traumatic stress disorder (PTSD) by monitoring sleep conditions [51]. | A wearable device for monitoring; a hub controller called INSTEON; different types of countermeasures suppressing; wearable devices for vibration alert and lighting smart outlets; machine learning tools for the optimization of countermeasure selection. | The system does not interfere in the normal life of the user. It increases the quality of sleep and life of patients with PTSD. The system can be integrated into patients’ personal IoT. Future suggestions: Bluetooth can make insecurity in the system and should be considered in future studies. The spread of private user data is an issue that should be addressed in future studies. |
| An intelligent hybrid remote patient-monitoring model with a cloud-based framework for knowledge discovery using hybrid architecture in case of internet disconnections [52]. | A model for patients under supervision at home (IHCAM-PUSH) contains ambient, medical monitoring, remote monitoring cloud (RMC), local database (LDB), medical service provider cloud (MSPC). | The system relies on MapReduce programming and data mining assignments, such as association rules. The results showed minimal fault in real-time dig data acquisition and analysis, patient monitoring, and emergency cases (blood pressure) detection. The operation of the system for other diseases is suggested to be examined further. |
| Develop a laboratory voice user interface (VUI) to integrate laboratory devices into an IoT environment in order to control them and read out their specific data [53]. | The VUI is a platform to control lab devices and read out specific device data; photometer; VA-enabled device; cloud services (voice model and server, skill host, device shadow); local services (server); natural language processing (NLP) algorithms. | Analysis of the speech examples showed that the standard setting of this system proves a high mean accuracy (95% ± 3.62) of voice identification. This solution makes a hands-free device control and will be an assistant to physically impaired or low vision users. Future suggestions: Security solutions that reflect common privacy rules are suggested to be worked on more. |
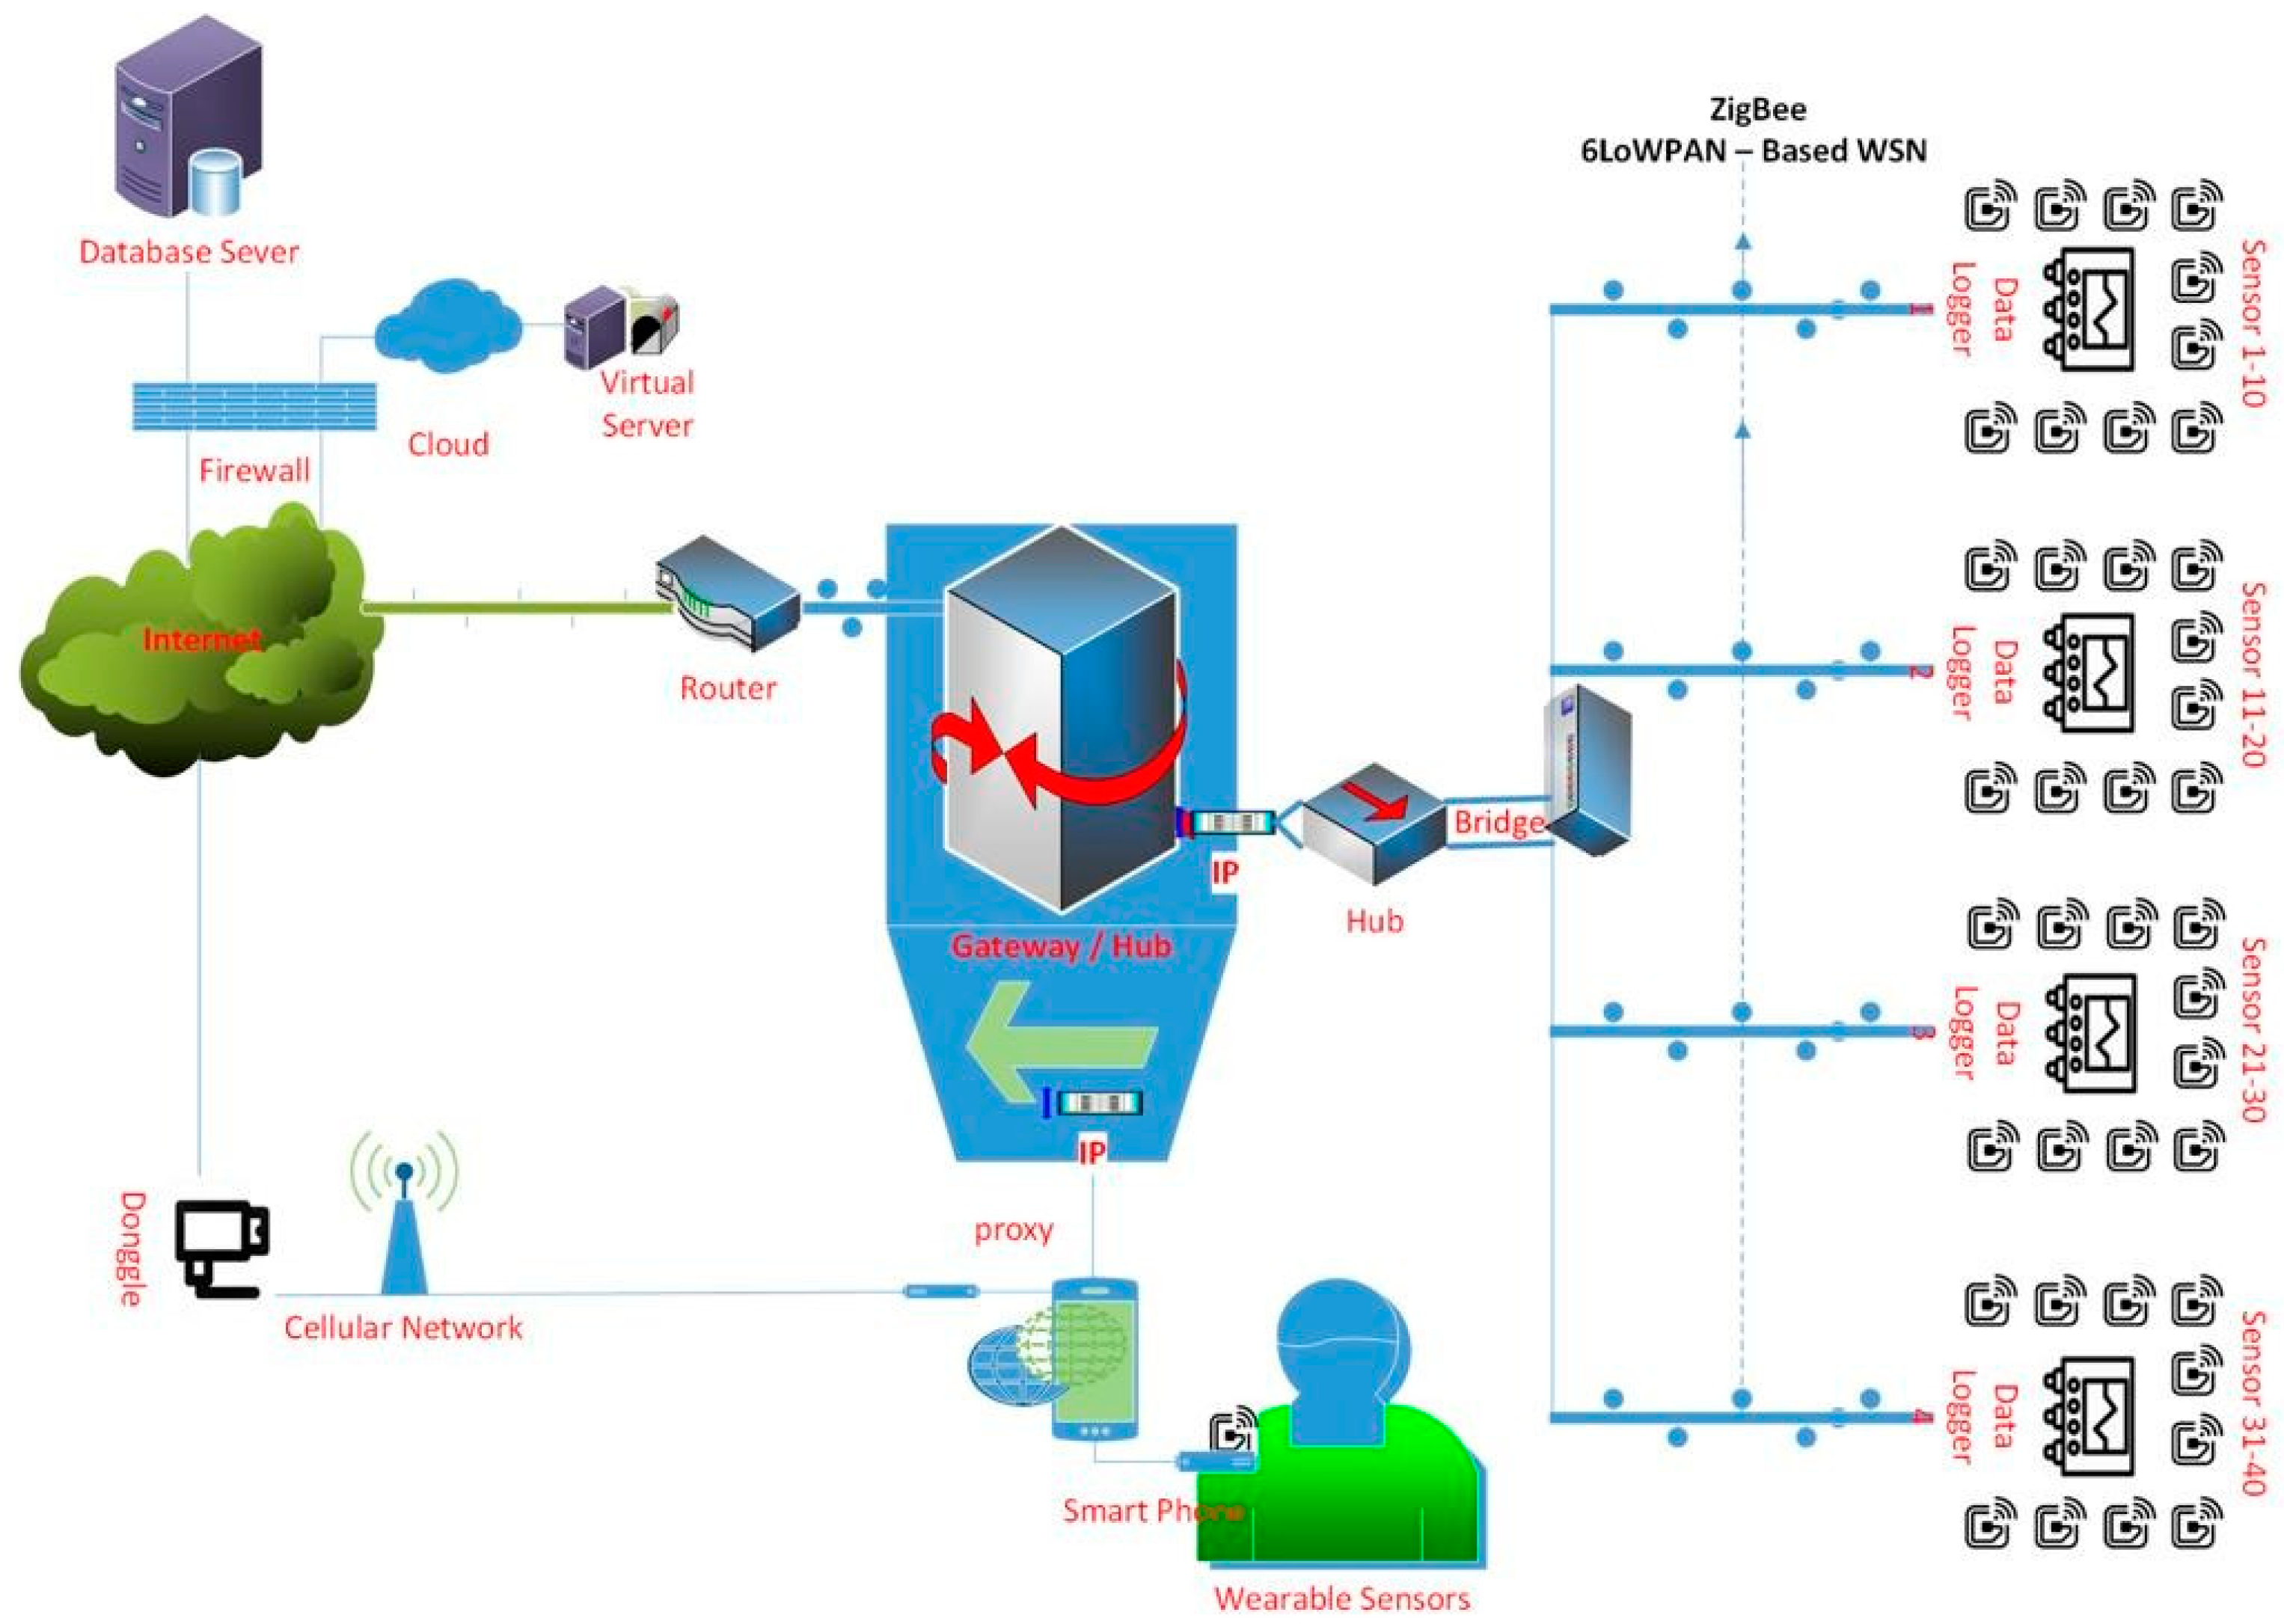
| Bridging e-Health and the IoT; sensor platform for healthcare in a residential environment (SPHERE) to identify different health conditions [54]. | Environmental sensors, a Zigbee or 6LoWPAN-based wireless sensor networks, video, and Bluetooth sensors connected to a cellular network, home gateway, data hub. | SPHERE platform tends to address the problem of designing an analytics-driven data gathering system that contains available, efficient, and reliable dataset, whenever the data is needed. |
| An approach to decision support and home monitoring system for patients with neurological disorders for monitoring people suffering from Parkinson’s disease in their homes [55]. | A system for screening that includes artificial neural network (ANN) classification algorithms; perceptron and a radial basis functions; network and the adaptive neuro-fuzzy classifier; MySQL in terms of database management. | The system evaluates by testing 10 patients and 10 normal people. Based on the evaluations, the proposed system is an aid for diagnosing Parkinson’s disease, so it helps the doctors to detect the people who are suffering from this disorder. A monitoring system that works based on the web. Future suggestions: It is suggested to extend the system to other neurological diseases. |
| The IoT for dementia care with a fall detector or GPS tracker to stop risk increases at the earliest times of need [56]. Passive environmental, wearable sensors, and obtaining real-time data. | The advanced message queuing protocol (AMQP) for communicating with the TIHM backend system. Health Level-7 (HL7) for clinical and managing data, which transfers among software applications, and the communication between healthcare systems is made with HL7. | The establishment of the data model in order to conform FHIR to TIHM is a necessity. A real-time systematic interpretation with abstraction and pattern recognition methods. An algorithm of rule-based reasoning for vital measuring to provide a clinical flag is developed. Integration of patients’, caregivers’, and clinicians’ experiences and industrial partner’s experts are integrated, which is the main key parameter. |
| Integrated management of energy using diverse data, such as security, healthcare, and energy consumption, collected from different sensors and house appliances for management, security, and visualization purposes [57]. | Includes home area network (HAN); ZigBee protocol; pulse and muscle sensor, temperature sensor, fall detection sensor working with an accelerometer, and energy-related devices; EMS to reckon control schemes based on measured data collected from sensors and smart meters carried out by the smart plugs. | Fall detection by using a three-axis accelerometer ADXL330 board and detect the quick variation of accelerometer and sending an alert to the application layer. Tracking the users’ motion profile and comparing different levels of physical activities with healthcare providers’ recommendations simultaneously. Limitations: the interchanging process of different data formats (health and energy) and concentrating them and applying deeper analysis for security and privacy services. Suggested to use big data and fog computing methods for data analysis. |
© 2020 by the authors. Licensee MDPI, Basel, Switzerland. This article is an open access article distributed under the terms and conditions of the Creative Commons Attribution (CC BY) license (http://creativecommons.org/licenses/by/4.0/).
Share and Cite
Sepasgozar, S.; Karimi, R.; Farahzadi, L.; Moezzi, F.; Shirowzhan, S.; M. Ebrahimzadeh, S.; Hui, F.; Aye, L. A Systematic Content Review of Artificial Intelligence and the Internet of Things Applications in Smart Home. Appl. Sci. 2020, 10, 3074. https://doi.org/10.3390/app10093074
Sepasgozar S, Karimi R, Farahzadi L, Moezzi F, Shirowzhan S, M. Ebrahimzadeh S, Hui F, Aye L. A Systematic Content Review of Artificial Intelligence and the Internet of Things Applications in Smart Home. Applied Sciences. 2020; 10(9):3074. https://doi.org/10.3390/app10093074
Chicago/Turabian StyleSepasgozar, Samad, Reyhaneh Karimi, Leila Farahzadi, Farimah Moezzi, Sara Shirowzhan, Sanee M. Ebrahimzadeh, Felix Hui, and Lu Aye. 2020. "A Systematic Content Review of Artificial Intelligence and the Internet of Things Applications in Smart Home" Applied Sciences 10, no. 9: 3074. https://doi.org/10.3390/app10093074
APA StyleSepasgozar, S., Karimi, R., Farahzadi, L., Moezzi, F., Shirowzhan, S., M. Ebrahimzadeh, S., Hui, F., & Aye, L. (2020). A Systematic Content Review of Artificial Intelligence and the Internet of Things Applications in Smart Home. Applied Sciences, 10(9), 3074. https://doi.org/10.3390/app10093074