Abstract
Detailed atmospheric monitoring data are notoriously difficult to obtain for some geographic regions, while they are of paramount importance in scientific research, forecasting, emergency response, policy making, etc. We describe a continuously updated dataset, METER.AC, consisting of raw measurements of atmospheric pressure, temperature, relative humidity, particulate matter, and background radiation in about 100 locations in Bulgaria, as well as some derived values such as sea-level atmospheric pressure, dew/frost point, and hourly trends. The measurements are performed by low-power maintenance-free nodes with common hardware and software, which are specifically designed and optimized for this purpose. The time resolution of the measurements is 5 min. The short-term aim is to deploy at least one node per 100 km2, while uniformly covering altitudes between 0 and 3000 m asl with a special emphasis on remote mountainous areas. A full history of all raw measurements (non-aggregated in time and space) is publicly available, starting from September 2018. We describe the basic technical characteristics of our in-house developed equipment, data organization, and communication protocols as well as present some use case examples. The METER.AC network relies on the paradigm of the Internet of Things (IoT), by collecting data from various gauges. A guiding principle in this work is the provision of findable, accessible, interoperable, and reusable (FAIR) data. The dataset is in the public domain, and it provides resources and tools enabling citizen science development in the context of sustainable development.
Dataset:https://meter.ac/
Dataset License: Creative Commons CC0
Keywords:
open network; atmosphere; monitoring; citizen science; Internet of Things; big data; FAIR data 1. Summary
The vast growth of internet coverage and popularity in recent decades, together with the development of new affordable off-the-shelf electronics, single-board computers, and sensors has made it possible for various communities, citizens, and volunteers [1,2,3,4] to engage with measurements and observations—the areas of knowledge that traditionally belong to professional science. New opportunities for more in-depth comparison between multiple monitored places at a higher spatial and temporal resolution have become economically viable.
Another aspect of involving citizens in science activities is facilitating community services for the public good through collaboration with the relevant authorities, as well as including more people in decision-making processes [5,6] aiming at sustainable development. The measuring community is not just growing but also increasing its potential. Monitoring is being improved by automation and becoming able to solve new challenges [4,7]. The science accelerated by citizens is covering more and more aspects of our lives, such as sensing the remote environment, estimating the quality of air and pollution [4,8,9,10,11,12,13,14], environmental health [6], personal exposure to harmless environment [15,16], and social studies [17]. Citizen science is not limited to a particular area or by its scale-of-study. The development of citizen science based on the paradigms of open data, big data, Internet of Things (IoT), and artificial intelligence is one of the key ingredients for the agendas of sustainable development. Citizens could evolve from data-consumers to data-providers and contribute to new approaches for education and scientific research, in particular involving younger generations in a more appealing and organic way, adequate to modern society and the challenges of the day.
Our previous atmospheric chemistry studies (studying the atmosphere from 0 to 35 km asl, Terziyski et al. [18]) were performed with devices developed in-house, some of which were reused later in the METER.AC network. In these activities, we also encouraged school students, teachers, and ordinary citizens to participate in stratospheric balloon launching, etc. The latter gave us some first-hand experience with citizen science approaches and inspired us to deploy a vast network of devices with significant help from volunteers (citizens with a non-academic background) engaged in the process. Furthermore, our group was motivated to prove the concept of an open monitoring network in the context of citizen science and the IoT [19]. The stratospheric balloons’ measurement and communication equipment was used as a prototype for developing the METER.AC network equipment described below.
Detailed atmospheric monitoring data are notoriously difficult to obtain for some geographic regions, while they are of paramount importance in scientific research, forecasting, emergency response, policy making, etc. We have recognized such a data gap for the region of Bulgaria, which lacks open and accessible data with high spatiotemporal resolution. In this paper, we describe a continuously updated dataset, METER.AC, consisting of raw measurements of atmospheric pressure, temperature, relative humidity, particulate matter, and background radiation in about 100 locations in Bulgaria, as well as some derived values such as sea-level atmospheric pressure, dew/frost point, and hourly trends. The measurements are performed by low-power maintenance-free nodes with common hardware and software, which are specifically designed and optimized for this purpose. Most of the devices are configured, deployed, hosted, and operated by volunteers (ordinary citizens). Some of the volunteers are also involved in the design and assembly of particular types of devices, contribute in the software development, participate in data analysis efforts, provide help with site maintenance, communicate with the METER.AC team on various topics of interest, etc.
2. Data Description
The METER.AC monitoring network consists of maintenance-free microcontroller-based internet-enabled gauges with an expandable range of sensors for measuring various parameters of the environment. In the following subsections, we provide a brief description of the raw measurements being performed, as well as on the derived values, associated metadata, and available data representations.
2.1. Raw Measurements
The raw measurements include a range of values coming out directly from the sensors which are evenly placed in nearly 100 ground stations, mainly in Bulgaria. These values estimate the physical environment, such as ambient temperature in degree Celsius (°C), atmospheric pressure in hPa or mbar, relative humidity in percentage points, particulate matter for both 2.5 and 10 µm in µg/m3, and background beta/gamma radiation in counts per minute (CPM). Additionally, we operate several devices that monitor wind direction and velocity (m/s), rainfall (mm), solar radiation (W/m2), and carbon dioxide concentration in ppm. In some of the ground stations, we collect sky snapshots every 30 s and store the raw files in a publicly available online image archive. Depending on the communication media in use (e.g., Wi-Fi, wired Ethernet, LoRa, etc.) we provide supplementary technical data, such as frequency shift, signal strength, latency, delay, etc., stored as additional metadata.
2.2. Derived Values
The most current measured values are given together with their trend over the past 3 h. Some additional values are calculated, such as dew/frost point temperature and sea level pressure, in order to enable a more consistent comparison between different locations, as well as with third-party measurements (devices which are outside our network, e.g., other citizen networks, monitoring devices deployed and maintained by public authorities, private commercial initiatives). Great care is given to precisely calculate ground stations’ altitude, based on GPS data, public digital elevation models, as well as data from national topographic maps with a scale of 1:5000. We also evaluate ground stations’ reliability in percentage of time online for the last 30 days.
2.3. Metadata
METER.AC metadata are intended to guarantee independent repeatability of all processes within the network. Metadata are described in the context of collecting or processing units, each characterized by a particular set of parameters. The metadata encompass several types of parameters describing the protocols for performing all activities concerning data collection, communication, storage, and data processing. Important subsets of the METER.AC metadata are the sensor specifications (as given by the manufactures), the schematics of the in-house-made apparatus, and the duty cycle of each measuring device. The list of sensors described in Section 3.1 is a good example of metadata characterizing the devices currently in use. Duty cycle specification guarantees that the devices are not treated just as black boxes and gives more openness to the performance characteristics of the METER.AC network. The node duty cycle information describes the exact steps taken to apply the measurement protocols to the corresponding device. For example, the sequence of the node duty cycle includes: (1) high voltage preparation, (2) blow through node box, (3) power ON for the Wi-Fi module, (4) power ON for the Particulate Matter (PM) sensor, (5) blow through node box, (6) measuring temperature, (7) measuring pressure, etc. Communication protocol metadata fully characterize the data transfer processes through the various media components of the METER.AC network. The node communication packet (see Section 3.2.1) is a combination of data and metadata. The specifications of the third party devices (devices which were not developed in-house) such as meteostations and cameras are also included into the metadata as well as the data loggers and communication protocols used by these devices. METER.AC metadata also include information about the device installation setup and measuring site conditions (e.g., GPS location, altitude, elevation above the ground, photo) as well as specifications of the algorithms applied to calculated values (e.g., dew/frost point, sea level pressure, daily averages, parameter trends). Detailed description of the METER.AC metadata is available at the following address: https://meter.ac/gs/metadata/. The frequency of the measurements being sent to the collecting servers may vary from 10 to 1 min. Each measurement record is augmented with additional metadata such as ground station ID, GPS coordinates, altitude, and sensor type. Each station is assigned to a person, who hosts the equipment. Contact data (e.g., phone, email) are also stored but are kept private and used for maintenance purposes.
2.4. Data Format and How to Reach It
The METER.AC site (https://meter.ac/) provides access to the data from each network node both as daily averages and raw measurements in CSV format. The complete history of the raw data of each node is provided in CSV format (example shown below in Table 1).

Table 1.
Typical CSV with raw data for a node. One row each 5 min.
3. Methods
3.1. Sensors
The METER.AC network consists of standardized low power maintenance-free gauges with identical sensors which have been carefully characterized in lab before deployment. In principle maintenance-free devices do not require regular maintenance (e.g., sensor recalibration, software updates) to ensure measurement quality and data collection and submission, except in cases of troubleshooting power and network connectivity outages. Microcontrollers collect the sensor data and submit them via the appropriate media channels to other components of the devices for further processing. A complete list of the sensors currently in use, together with their operating range, accuracy, resolution, and reporting frequency, is given in Table 2.
Table 2.
The basic characteristics of the sensors used in METER.AC devices.
3.2. Devices
The METER.AC network currently consists of several types of devices which are designed and built in-house. In this section, they are briefly presented together with the data protocol used for communication purposes.
3.2.1. Nodes
In the context of the METER.AC network, a node is a device that performs measurements and sends reports to a collecting server. Currently, about 100 nodes are deployed (Figure 1a) and operating in Bulgaria. A few nodes have been installed in Greece and two in Germany (Figure 1b).

Figure 1.
Network outlook: (a) Each device consists of an input (1) and output (2) valve, cable fitting (3) and assembly part (4); (b) current coverage map of Bulgaria and Greece.
The data are transmitted from the nodes to a server using our own protocol in plain text format described in the Table 3 below.
Table 3.
Format specifications of the standard node communication packet.
When the collecting server receives a new report, it appends some more fields, such as the current Unix timestamp, the IP address of the sending node or gate, and the firmware version passed via the HTTP_USER_AGENT, for example, User-Agent: meter/m250419a.
3.2.2. Data Loggers
Another specific component of the METER.AC network infrastructure are the so-called data loggers—devices that are designed to collect data from various professional meteosources such as rain gauges, anemometers, pyranometers, meteostations, etc. (Figure 2).
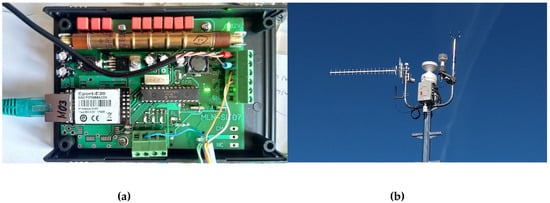
Figure 2.
Data logger (a) for the meteostation (b) at the village of Sarnegor, Bulgaria.
In addition to its main function, each data logger is also equipped with a Geiger–Müller tube SBM-20 for monitoring the beta/gamma background radiation. The data protocol consists of two parts—raw data, sent by the data logger, and a suffix appended at the time the corresponding data packet is received in the server infrastructure. Several data loggers are deployed currently for collecting data from a variety of different equipment deployments in Bulgaria. The data loggers provide hardware- and software-level compatibility with existing third-party equipment.
3.2.3. Radon Concentration Gauges
A number of prototypes of more specialized devices are under development, testing, and evaluation in the METER.AC network. Radon is a chemical element which is a product of uranium radioactive decay. It accumulates often in the lower levels of buildings and is considered to be the second most important factor (after tobacco smoking) that causes lung cancer. We have designed a special gauge that monitors radon concentration, using the RD200M sensor shown in Figure 3.

Figure 3.
Indoor radon concentration gauge box. On the left hand side is an RD200M sensor. The electronics and additional sensors are placed in the perforated box (right side).
The device is measuring values such as radon concentration (RD200M), carbon dioxide (S-300-3V), beta and gamma background radiation (SBM-20), and gamma (only) background radiation in another SBM-20 shielded by a thick layer of lead.
3.2.4. Beta/Gamma Background Monitoring
We have also developed a device for gamma background radiation monitoring with a higher temporal resolution (two seconds). It has been deployed at the Musala peak (2925.4 m asl) and is in continuous operation for more than six months (see Figure 4).
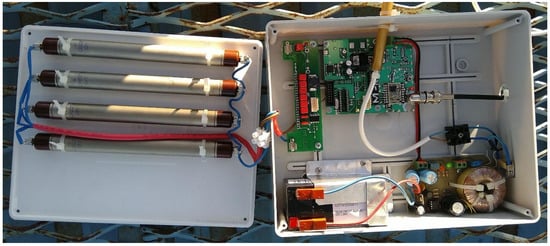
Figure 4.
A high temporal resolution gamma background monitoring device with 4 SI22-G tubes.
The device consists of four SI22-G Geiger–Müller tubes (Figure 4, left side), a battery for uninterruptible power supply, and electronics, which stores the counts from the four tubes every 2 s and transmits the data every minute via LoRa through a gate to METER.AC’s server infrastructure.
3.3. Cameras
Another, currently rather small-scale, subnetwork of METER.AC collects snapshots of the sky from several cameras. The snapshots are submitted via FTP (File Transfer Protocol) to the server infrastructure. The cameras tend to be hosted at places with interesting panoramas where higher bandwidth network connections are available. Snapshots are uploaded every 30 s and stored in folders organized by years, months, days, and hours. In addition, time-lapse videos for the last 24 h are being generated and published continuously.
3.4. Network Infrastructure
METER.AC is a continuously growing heterogenic multilayer network infrastructure. The short-term aim is to deploy at least one node per 100 km2, while uniformly covering altitudes between 0 and 3000 m asl with a special emphasis on remote mountainous areas. The data workflow is presented in Figure 5.

Figure 5.
METER.AC data workflow based on a multilayer infrastructure scheme.
The data workflow starts from the sensor (hardware) layer that operates in the physical environment (left side), followed by a media layer for internet communication. Three different types of media are in use currently: LoRa, Wi-Fi, and wired Ethernet connectivity. LoRa (“Long Range”) is used in the context of a low-power wide-area (LPWA) network based on wireless telecommunication designed to allow long-range communications at a low bit rate among low-power things (connected objects), such as sensors operated on a battery. The data are then delivered to our server infrastructure and communicated to the end users via either downloadable open data or various visualizations and summaries on our public site (Figure 6, Figure 7 and Figure 8). A growing number of third party applications and tools rely on METER.AC data to provide alternative views and diverse ways to reuse them (examples are given in Section 4).
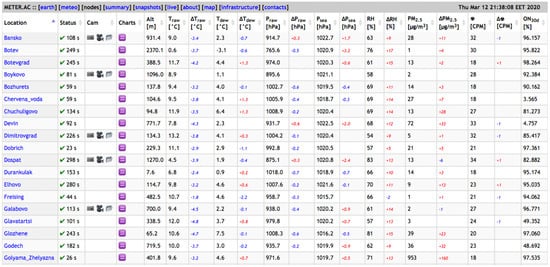
Figure 6.
Screenshot of the METER.AC site, taken in March 2020.
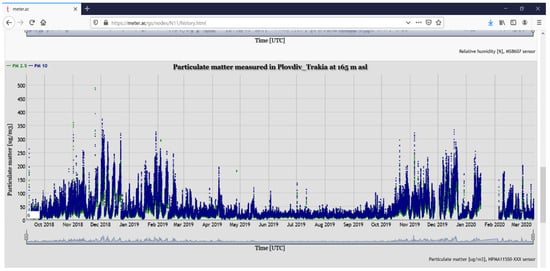
Figure 7.
Fine particulate matter concentration history for the area of Plovdiv, Bulgaria.
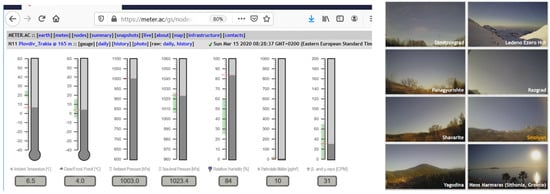
Figure 8.
METER.AC screenshots with gauges for current parameter values for a particular node (left) and sky snapshot summary (right).
Handling high time resolution data is quite demanding and represents a considerable challenge. Nevertheless, our data infrastructure is designed with scalability in mind and should be able to cope with the expected workload. In fact, for some of the monitored parameters and locations, even higher time resolutions would be desirable in order to capture more information on the dynamics of their changes, in particular in the context of fast and short-lived processes. Full resolution raw data are never discarded in our infrastructure. However, in addition to raw data, we also provide access to several layers of processed/aggregated data, e.g., averages and trends. METER.AC is a continuously growing initiative. An important long-term goal is to build a denser network of homogenous sensors for studying new environmental phenomena (e.g., non-observed sufficiently so far due to the data gaps and sparse spatiotemporal resolution) as well as for developing more accurate and comprehensive models for already known phenomena and environment processes. The presented open network is still in its infancy but rapidly growing, and thus, the distribution/density bias is being reduced progressively through the deployment of new sensors at suitable locations. Our aim is to deploy at least one node per ~100 km2. A denser network would also provide better resiliency in case of various outages. The present paper focuses on the raw data being collected. We will consider adding further layers of processed data for filling the gaps once all other means for collecting raw measurements are exhausted.
4. User Notes and METER.AC Usage Examples
The collected data are accessible via the METER.AC website (https://meter.ac/) which, together with the links to the raw data, is used as a simple API for data access at present. The main page of the site provides an extended summary of all measured values, their derivatives, and trends for all nodes (Figure 6). All features are presented via sortable data tables [27].
Furthermore, the site provides a Graphical User Interface (GUI-implemented with the dygraphs JavaScript library [28]) with the basic charts for all measured parameters for each node. The data can be visualized on a daily basis (with a resolution of one data point per 5 min) or summarized for an extended period of time as shown in Figure 7.
A full history of all raw measurements (non-aggregated in time and space) is available, starting from September 2018.
The METER.AC site also provides various alternative visualizations of the data, such as summaries of the camera snapshots (Figure 8—right), gauges with the current parameter values (Figure 8—left), access to the daily average values or download of *.CSV files with complete raw data in full resolution (see Table 1). The sky snapshots are available as JPG files (1920 × 1080, 24 Bit depth) in the corresponding archive of a given node (e.g. https://meter.ac/gs/nodes/N48/snapshots/). A detailed demonstration with screenshots illustrating the usage of METER.AC web site can be found in menu [about], section “Web site navigation demo”.
One of the key advantages of our network is the Creative Commons CC0 license, i.e., all the raw data, including the full history, are in the public domain. In addition to the gathered data themselves, we hope to promote and enable third-party applications based on them. We briefly describe a couple of examples of applications reusing METER.AC data.
Stringmeteo [29] is the largest volunteer network in Bulgaria that collects any kind of meteorology-orientated data. The Stringmeteo network encompasses multiple off-the-shelf devices. This network also redistributes METER.AC data.
Another site which relies on METER.AC data is nebe.to [30] (in Bulgarian “the sky”). Camera snapshots are augmented with layers of measurement data and are displayed on an interactive map as shown in Figure 9.

Figure 9.
Several map layers of nebe.to present METER.AC data.
We encourage all interested people, organizations, networks, and volunteers to reuse METER.AC data in order to present them in the most convenient way to their audiences.
A guiding principle in this work is the provision of findable, accessible, interoperable, and reusable (FAIR) data [31]. METER.AC’s data model includes simple metadata (see Section 2.3) and measurement data which are easily findable and accessible through our website. In a period of two months, the METER.AC website has been visited more than 8 million times by more than 170 thousand unique visitors. Figure 10 provides a glimpse at the dynamics of accumulated number of hits and unique visitors.
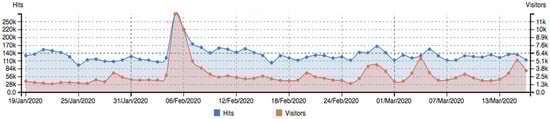
Figure 10.
METER.AC access statistics for a period of two months.
Data interoperability is ensured by the use of widely supported representation formats (i.e., HTML, TXT, and CSV) which can be easily integrated with other data and used with various applications and workflows for data storage, processing, and analysis. The measured endpoints are clearly defined and annotated in the domain of atmospheric chemistry and environment measurements. The reusability of the METER.AC dataset is encouraged through the adopted Creative Commons C00 license.
5. Conclusions
METER.AC is a continuously growing network of low-power maintenance-free IoT devices producing open data for basic experimental parameters characterizing air quality. The data are with very high temporal resolution and quite good geographical coverage of the area of Bulgaria. The network development is a joint effort of multiple volunteers and academic and research parties, being a good example of development of citizen science. The availability of FAIR data with high spatiotemporal resolution enables more in-depth monitoring, analysis, modeling, and forecasting of a range of environmental parameters in Bulgaria and its neighboring states (Romania, Serbia, North Macedonia, Greece, and Turkey). It also provides a useful playground for creating, testing, and applying new machine-learning-based approaches, leveraging big data in climate science, meteorology, atmospheric physics, and chemistry.
Our future development plans include extension of the network with more nodes, cameras, and new types of devices across Bulgaria as well as inclusion of additional sensors and new experimental types of data; after proof of concept, we could consider extension of the network to other European countries (even now, there are a few testing nodes outside Bulgaria); development of a sophisticated API for data access and filtering; and improvement of data FAIR-ness.
We hope that METER.AC will enable the development and provision of new tools and resources by academia, public institutions, and the industry, in particular to support sophisticated scientific models and efficient application of artificial intelligence methods on big data for Sustainable Development Goals.
Author Contributions
Conceptualization, A.T., S.T., V.J., and N.K.; methodology, A.T., S.T., and V.J.; hardware and assembler software, S.T.; JavaScript and databases, N.J., V.J., and A.T.; validation, formal analysis, and investigation, V.J and A.T.; writing—original draft preparation, A.T., V.J., and N.K.; writing—review and editing, A.T., V.J., N.J., and N.K.; project administration, A.T.; funding acquisition, A.T. and V.J. All authors have read and agreed to the published version of the manuscript.
Funding
This research was initially funded by multiple private donations; additionally, it is funded by the Plovdiv University Scientific Fund (project FP19-HF-001).
Acknowledgments
We thank all people that gave private donations for the cause of METER.AC and all supporting the initiative by hosting METER.AC nodes at their property sites. We thank many research and academia colleagues for encouraging our ideas through multiple discussions, helpful advice or testing of our hardware and software prototypes. We give special thanks to the Basic Environmental Observatory (BEO Musala) at the Institute for Nuclear Research and Nuclear Energy at the Bulgarian Academy of Science (BAS) [32], National Institute of Geophysics, Geodesy and Geography (BAS) [33], Institute of Astronomy and National Astronomical Observatory (BAS) [34], and MJ Investment Group Ltd.
Conflicts of Interest
The authors declare no conflict of interest. The funders had no role in the design of the study; in the collection, analyses, or interpretation of data; in the writing of the manuscript, or in the decision to publish the results.
References
- Tulloch, A.I.T.; Possingham, H.P.; Joseph, L.N.; Szabó, J.; Martin, T.G. Realising the full potential of citizen science monitoring programs. Boil. Conserv. 2013, 165, 128–138. [Google Scholar] [CrossRef]
- Conrad, C.C.; Hilchey, K.G. A review of citizen science and community-based environmental monitoring: Issues and opportunities. Environ. Monit. Assess. 2011, 176, 273–291. [Google Scholar] [CrossRef] [PubMed]
- Roy, H.E.; Pocock, M.J.O.; Preston, C.D.; Roy, D.B.; Savage, J.; Tweddle, J.C.; Robinson, L.D. Understanding Citizen Science and Environmental Monitoring: Final Report on Behalf of UK Environmental Observation Framework; NERC/Centre for Ecology & Hydrology: Wallingford, UK, 2012; p. 173. [Google Scholar]
- Snyder, E.G.; Watkins, T.H.; Solomon, P.A.; Thoma, E.D.; Williams, R.W.; Hagler, G.S.W.; Shelow, D.; Hindin, D.A.; Kilaru, V.J.; Preuss, P.W. The Changing Paradigm of Air Pollution Monitoring. Environ. Sci. Technol. 2013, 47, 11369–11377. [Google Scholar] [CrossRef] [PubMed]
- Kaufman, A.; Williams, R.; Barzyk, T.; Greenberg, M.; O’Shea, M.; Sheridan, P.; Hoang, A.; Ash, C.; Teitz, A.; Mustafa, M.; et al. A Citizen Science and Government Collaboration: Developing Tools to Facilitate Community Air Monitoring. Environ. Justice 2017, 10, 51–61. [Google Scholar] [CrossRef] [PubMed]
- English, P.B.; Richardson, M.J.; Garzón-Galvis, C. From Crowdsourcing to Extreme Citizen Science: Participatory Research for Environmental Health. Annu. Rev. Public Health 2018, 39, 335–350. [Google Scholar] [CrossRef] [PubMed]
- Jalbert, K.; Kinchy, A.J. Sense and Influence: Environmental Monitoring Tools and the Power of Citizen Science. J. Environ. Policy Plan. 2015, 18, 379–397. [Google Scholar] [CrossRef]
- Ripoll, A.; Viana, M.; Padrosa, M.; Querol, X.; Minutolo, A.; Hou, K.M.; Barcelo-Ordinas, J.M.; Garcia-Vidal, J. Testing the performance of sensors for ozone pollution monitoring in a citizen science approach. Sci. Total. Environ. 2019, 651, 1166–1179. [Google Scholar] [CrossRef] [PubMed]
- McKinley, D.C.; Miller-Rushing, A.J.; Ballard, H.L.; Bonney, R.; Brown, H.; Cook-Patton, S.C.; Evans, D.M.; French, R.A.; Parrish, J.K.; Phillips, T.B.; et al. Citizen science can improve conservation science, natural resource management, and environmental protection. Boil. Conserv. 2017, 208, 15–28. [Google Scholar] [CrossRef]
- Camprodon, G.; González, Ó.; Barberán, V.; Pérez, M.; Smári, V.; Ángel de Heras, M.; Bizzotto, A. Smart Citizen Kit and Station: An open environmental monitoring system for citizen participation and scientific experimentation. HardwareX 2019, 6, e00070. [Google Scholar] [CrossRef]
- Wesseling, J.; de Ruiter, H.; Blokhuis, C.; Drukker, D.; Weijers, E.; Volten, H.; Vonk, J.; Gast, L.; Voogt, M.; Zandveld, P.; et al. Development and Implementation of a Platform for Public Information on Air Quality, Sensor Measurements, and Citizen Science. Atmosphere 2019, 10, 445. [Google Scholar] [CrossRef]
- Ford, B.; Pierce, J.R.; Wendt, E.; Long, M.; Jathar, S.; Mehaffy, J.; Tryner, J.; Quinn, C.; van Zyl, L.; L’Orange, C.; et al. A low-cost monitor for measurement of fine particulate matter and aerosol optical depth–Part 2: Citizen-science pilot campaign in northern Colorado. Atmos. Meas. Tech. 2019, 12, 6385–6399. [Google Scholar] [CrossRef]
- Constant, N. Role of Citizen Science in Air Quality Monitoring. Urban Pollution: Science and Management; Wiley: Hoboken, NJ, USA, 2018; pp. 303–312. [Google Scholar]
- Gabrys, J.; Pritchard, H.; Barratt, B. Just good enough data: Figuring data citizenships through air pollution sensing and data stories. Big Data Soc. 2016, 3. [Google Scholar] [CrossRef]
- Arano, K.A.G.; Sun, S.; Ordieres-Mere, J.; Gong, A.B. The Use of the Internet of Things for Estimating Personal Pollution Exposure. Int. J. Environ. Res. Public Health 2019, 16, 3130. [Google Scholar] [CrossRef] [PubMed]
- Jovašević-Stojanović, M.; Bartonova, A.; Topalović, D.; Lazović, I.; Pokrić, B.; Ristovski, Z. On the use of small and cheaper sensors and devices for indicative citizen-based monitoring of respirable particulate matter. Environ. Pollut. 2015, 206, 696–704. [Google Scholar] [CrossRef] [PubMed]
- Prasad, S. Internet of Things and Its Application in the Field of Social Sciences: Prospects and Challenges from a South Asian Context. Int. J. Appl. Sci. Manag. 2017, 3, 329–343. [Google Scholar]
- Terziyski, A.; Tenev, S.; Jeliazkov, V.; Kochev, N.; Dimitrov, G.; Jeliazkova, N.; Iliev, L.; Angelov, C.; Kalapov, I.; Arsov, T. Balloon-borne measurements in the upper troposphere and lower stratosphere above Bulgaria (N41-43° E24-26°). Bulg. Chem. Commun. 2019, 51, 153–157. [Google Scholar]
- Dimitrov, G.; Tenev, S.; Kostova, I.; Paskaleva, V.; Pukalov, O.; Tsoneva, S.; Kaynarova, L.; Patronov, G.; Delchev, V.; Penchev, P.; et al. Open Environmental Monitoring Network-Proof of Concept. 2019. Available online: https://atanas.uni-plovdiv.net/store/p-2019-ACM2.pdf (accessed on 7 April 2020).
- TE Connectivity, PHT Combination Sensor MS8607. Available online: htps://www.te.com/usa-en/product-CAT-BLPS0018.html (accessed on 18 March 2020).
- Honeywell, HPMA115S0. Available online: https://sensing.honeywell.com/honeywell-sensing-particulate-hpm-series-datasheet-32322550 (accessed on 18 March 2020).
- Available online: https://www.gstube.com/data/2398/ (accessed on 12 March 2020).
- Radon FTLab, RD200M. Available online: http://radonftlab.com/radon-sensor-product/radon-sensor/rd200m (accessed on 18 March 2020).
- Gill, MetPak RG. Available online: http://www.gillinstruments.com/products/anemometer/metpak-rg-weather-station.html (accessed on 18 March 2020).
- Gill, Windsonic. Available online: http://gillinstruments.com/products/anemometer/windsonic.htm (accessed on 18 March 2020).
- Hukseflux, LP02-TR. Available online: https://www.hukseflux.com/uploads/product-documents/LP02-TR_v1302.pdf (accessed on 18 March 2020).
- DataTables. Available online: https://datatables.net (accessed on 18 March 2020).
- Dygraphs. Available online: http://dygraphs.com (accessed on 18 March 2020).
- Stringmeteo. Available online: https://www.stringmeteo.com (accessed on 18 March 2020).
- Nebeto. Available online: https://www.nebe.to (accessed on 18 March 2020).
- FAIR Principles. Available online: https://www.go-fair.org/fair-principles (accessed on 18 March 2020).
- Basic Environmental Observatory Musala. Available online: http://beo-db.inrne.bas.bg/moussala/index.php (accessed on 18 March 2020).
- National Institute of Geophysics, Geodesy and Geography. Available online: http://www.niggg.bas.bg/en (accessed on 18 March 2020).
- Rozhen National Astronomical Observatory Bulgaria. Available online: http://www.nao-rozhen.org/index_en.html (accessed on 18 March 2020).
© 2020 by the authors. Licensee MDPI, Basel, Switzerland. This article is an open access article distributed under the terms and conditions of the Creative Commons Attribution (CC BY) license (http://creativecommons.org/licenses/by/4.0/).