Article

Effects of Sustainable Brand Equity and Marketing Innovation on Market Performance in Hospitality Industry: Mediating Effects of Sustainable Competitive Advantage

1
Department of Management Sciences, National College of Business Administration and Economics, Lahore 54660, Pakistan
2
School of Accountancy, Shandong University of Finance and Economics, Jinan 250014, China
3
School of Business and Economics, Thompson Rivers University, Kamloops, BC V2C 0C8, Canada
4
Hailey College of Commerce, University of the Punjab, Lahore 54590, Pakistan
*
Authors to whom correspondence should be addressed.
Sustainability 2020, 12(7), 2939; https://doi.org/10.3390/su12072939
Submission received: 28 February 2020 / Revised: 1 April 2020 / Accepted: 1 April 2020 / Published: 7 April 2020
(This article belongs to the Special Issue Behavior and Marketing for Sustainability)

Abstract

:
This study examines the effects of sustainable marketing assets, such as brand equity and marketing innovation, on market performance in the presence of sustainable competitive advantage as a mediator in the hospitality industry. Data were collected from hotel/restaurant customers (N = 360) on a Likert scale from 1= strongly disagree to 5 = strongly agree and analysis was conducted using the structural equation modeling (SEM) technique. The objective of this study is to understand the relationship among brand equity, marketing innovation, sustainable competitive advantage, and market performance in the hotel/restaurant industry. The results show that sustainable marketing assets have positive and significant effects on market performance. This study also demonstrates that sustainable competitive advantage fully mediates the relationship between brand equity and market performance while partially mediating the relationship between marketing innovation and market performance. The findings of this research can contribute to formulating effective marketing strategies for attracting customers, emphasizing sustainable issues in the hospitality sector, such as hotels/restaurants. This research adds practical value to the literature on brand equity, marketing innovation, sustainable competitive advantage, and market performance in the service industry.

1. Introduction

Globalization, economic growth, and technological development have transformed the hospitality industry in many markets. Increasing awareness of sustainability in every sphere of life has important implications on consumer behavior within hospitality services. Sustainability and its triple bottom line become an important issue in all spheres of businesses in both developing and developed markets. “Triple bottom line” explains the method of corporate reporting integrating economic, environmental, and social dimensions considered as the pillars of sustainability. With the continuously rising awareness of sustainability worldwide, many organizations are trying to build up innovative ways to improve their sustainability performance in the marketplace [1,2]. Companies are feeling the pressure exerted from stakeholders, such as customers, employees, the media, public, NGOs, government agencies, and investors, to implement sustainability practices in their businesses [3]. The rate of adopting and practicing sustainability in businesses in different parts of the world does vary greatly [4]. The available literature on sustainability noticeably acknowledges that sustainability is well studied in developed countries compared to developing countries [5,6,7]. As the literature on sustainability increases, the issue of generalizability remains, as the findings cannot be replicated across markets and geographies. After years of political turmoil, Pakistan is enjoying formidable peace and stability and the market of more than 220 million people is growing fast. With ancient and diverse culture and history, Pakistani markets for the hospitality industry present increasing business opportunities. However, little is known on how sustainable marketing assets attract consumers in this vast market. The purpose of this study is to fill this gap in literature by testing sustainable marketing approaches in the Pakistani hospitality market. By sustainable marketing assets, we mean brand equity and marketing innovations that can ensure continuous business success, creating a sustainable business opportunity.
According to resource advantage theory (RAT), when a firm orchestrates and manages its resources in a dynamic way, the consumption of its products or services provides superior market performance [8,9]. Resource advantage theory takes on a resource-based view (RBV) of organization by paying attention to marketing resources in terms of their capacity to gain a sustainable competitive advantage (SCA). Marketing assets that influence the stakeholders in any trade, and company, generally organize these assets to attain a sustainable competitive advantage in the marketplace [10,11]. Assets can be tangible or intangible and have significant implications [10,12]. Direct or indirect contributions of marketing resources also vary in contributing to the competitive advantage [10,13] presented the idea of the resource-based view for the description of the importance of resources used by firms to gain a sustainable competitive advantage [14,15]. According to [16], the resource-based view explains how organizations achieve a sustainable competitive advantage. Resource heterogeneity and resource immobility are the main suppositions of the resource-based view [16,17,18]. The main important source for a sustainable competitive advantage is intangible assets, such as brand equity and marketing innovation that improve the market performance of a company [19,20,21,22,23]. The resource-based view (RBV) basically clarifies and forecasts the relationships between the particular assets of a company and how those resources are organized in a meaningful way to create superior performances that are valuable, rare, inimitable, and well organized (VRIO) and create a sustainable competitive advantage [24,25]. To reveal the relationship between sustainable marketing assets, sustainable competitive advantage, and market performance, we will present a literature review, hypothesis development, and conceptual framework in Section 2, research methodology in Section 3, research findings in Section 4, and a discussion of the findings in Section 5, and then we will add our concluding remarks and limitations and future research avenues at the end. The measurements of sustainable marketing assets, SCA, and market performance have been provided in Appendix A (survey questionnaire).

2. Literature Review

In the discussions of 21st century on the sustainability, role of the dimensions of development and managerial framework are considered as central [26] in creating top-level sustainable organizations [27]. A sustainable competitive advantage (SCA) and performance can be achieved through the reconfiguration of resources according to the environment and their processes of organization [28,29]. In 1980, the “International Union for Conservation of Nature and Natural Resources” formally established sustainability as a construct to solve issues related to finance, environment, and society and defined it as “the integration of conservation and development to ensure that modifications to the planet do indeed secure the survival and well-being of all people” [30]. Sustainability attained additional importance when the “United Nations World Commission on Environment and Development” released its report “Our Common Future” [30]. In this report it was suggested that a new approach to the competing demands of environment protection and economic development is required, referring to sustainable development. According to [31] sustainability has evolved as a critical component of sustainable business practice by adding social and economic responsibility.

2.1. Sustainability

Sustainability is an idea to produce products (goods and services) in such a way that does not use resources that cannot be replaced and does not harm the environment. Sustainability is the ability to sustain at a specific level for an interval of time. Sustainability symbolizes the progress of society and advancement in the direction of a prosperous and more stable world, which can save the natural environment and cultural attainments for the next generations [32]. According to [32,33], sustainability is an essential component of a company’s strategy, which provides for the need of the long-term success of the future of people and the planet. A survey conducted by McKinsey proposes that companies are rapidly integrating sustainability preferences into their businesses. Firms are pursuing social and environmental sustainability in ways that are far from the reputation of organizations. Environmental sustainability is termed as the consumption rate of natural resources and this should either be below the rate at which the natural resources are renewed or a substitute should be used, producing less emission and avoiding activities that are degrading the ecosystem [33,34], social sustainability is defined as actively supporting the conservation and creation of skills as well as the capabilities of future generations, supporting health facilities, and promoting the equal and democratic actions that permit for a good standard of life both inside and outside of an organization’s context. “Sustainability is a company’s capacity to prosper in a hypercompetitive and changing global business environment. Companies that anticipate and manage current and future economic, environmental, and social opportunities and risks by focusing on quality, innovation, and productivity will emerge as leaders that are more likely to create a competitive advantage and long-term stakeholder value [35].

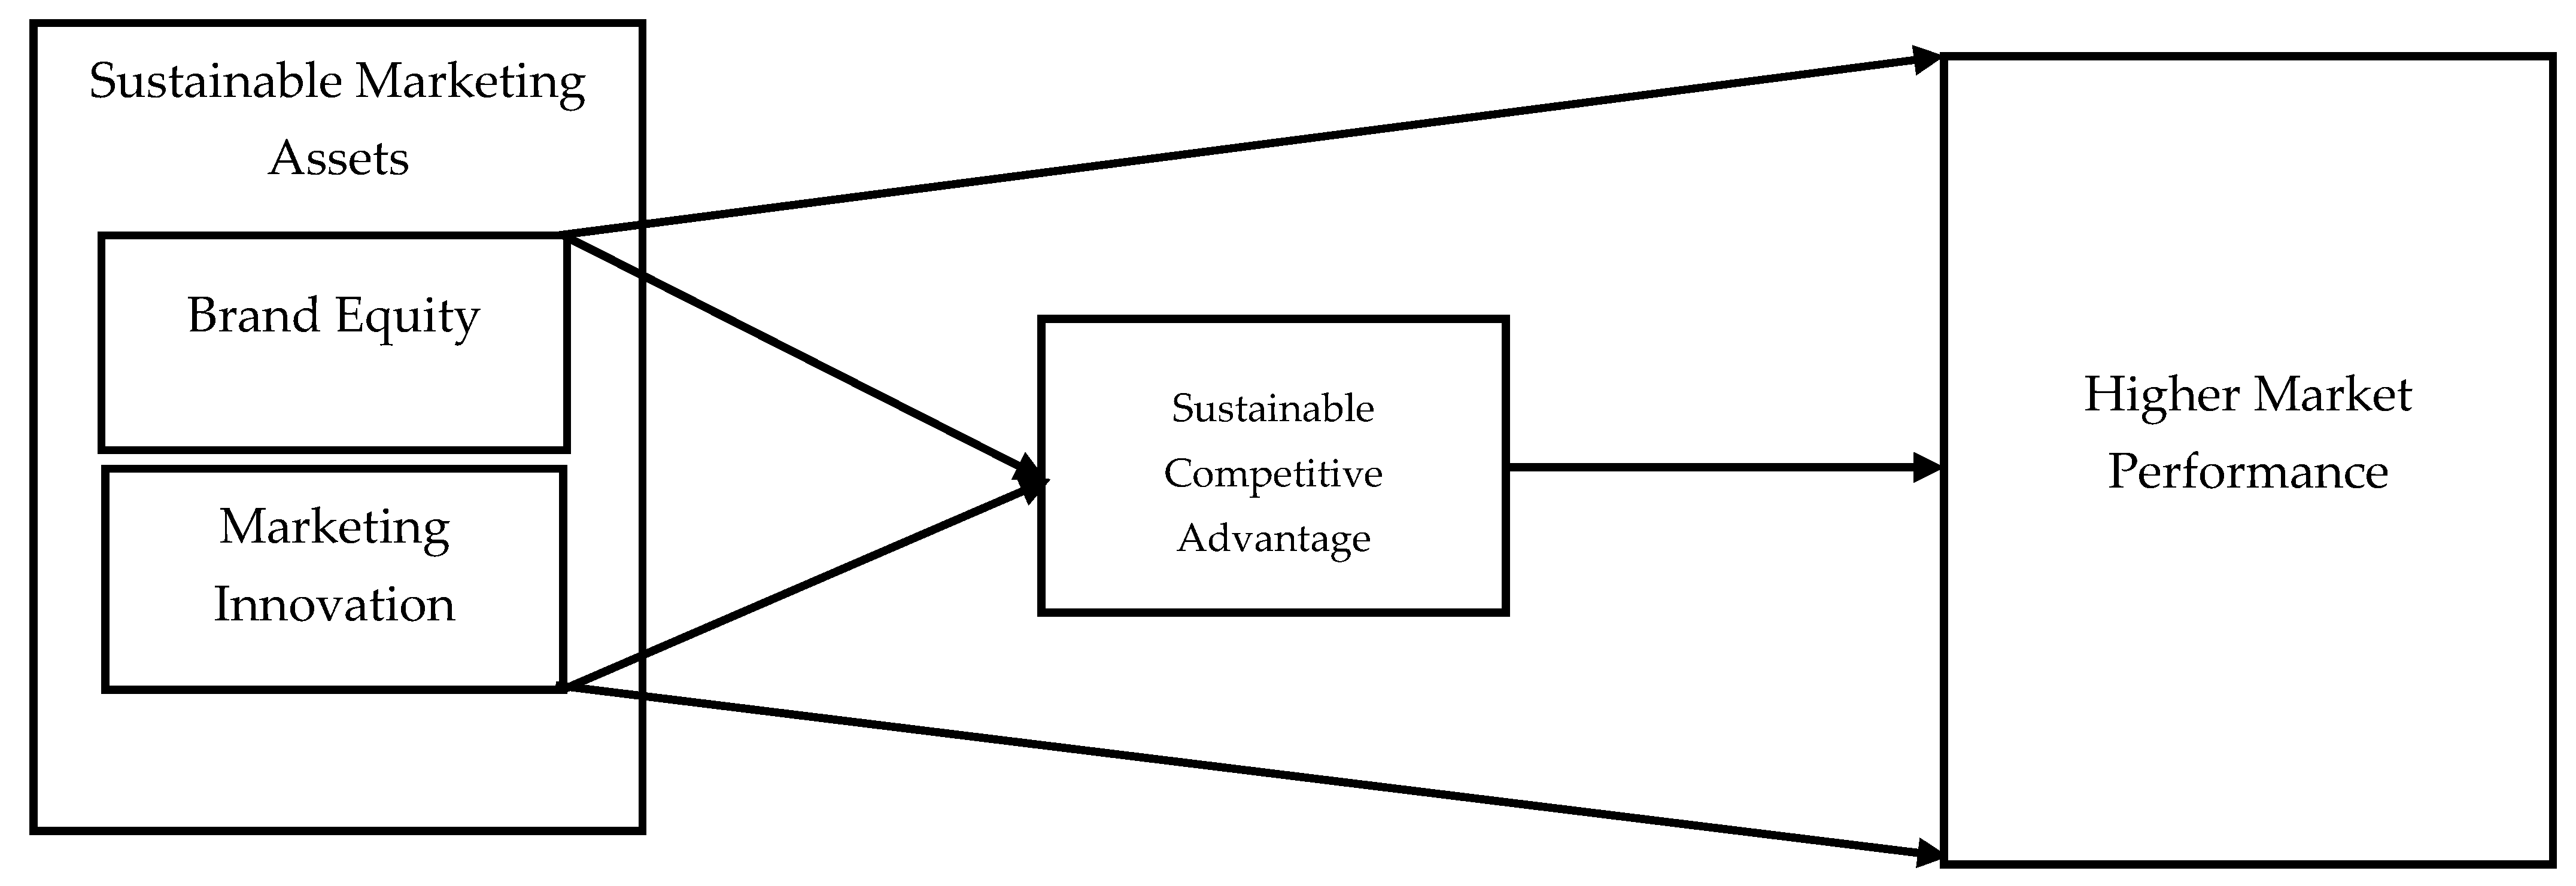
2.2. Hypotheses and Theoretical Model Development

The service industry has observed growing expansion and growth throughout the last decades. Hence, competition in the service industry has become increasingly severe. As a result, dynamic service providers have come across more tactical methods for fulfilling and maintaining customers’ satisfaction. Many marketing managers and scholars view sustainability-based marketing assets i.e., brand equity and market innovation as indispensable elements of any tactic considered to achieve a sustainable competitive advantage.

2.2.1. Brand Equity and Sustainable Competitive Advantage

Brand equity is the subjective evaluation of a brand by its customers. Brand equity is the result of past investments in the marketing mix that add value to a product or service [36,37]. Brand equity gives particular value to a product by its name [38]. A successful strategy for building strong brand equity creates a wide range of marketing advantages [39,40].
There are various conceptualizations of brand equity in the marketing literature [41,42]. Brand equity is “the marketing effects or outcomes that accrue to a product with its brand name compared with those that would accrue if the same product did not have the brand name” [43]. According to [44], brand equity is defined as “a set of assets and liabilities linked to a brand that add to or subtract from the value of a product or service to a company and/or its customers”. [45] describes brand equity as "a set of assets (and liabilities) linked to a brand’s name and a symbol that adds to (or subtracts from) the value provided by a product or service to a firm or that firm’s customers". According to [46], well-established brand equity may be the foundation of competitive advantage. On the basis of the above literature it can be hypothesized that:
Hypothesis 1 (H1).
Brand equity influences the sustainable competitive advantage.

2.2.2. Marketing Innovation and Sustainable Competitive Advantage

A marketing innovation is the execution of an innovative marketing technique (marketing ideas and strategies) that is considerably different from the prior marketing process implemented by a business and that has not previously been implemented by the business. The aim of marketing innovation is to give value to the customers and to improve competitive advantage.
Marketing innovation can also be described as “the execution of a new marketing method relating significant changes in product design or packaging, product placement, product promotion, or pricing” [47]. Innovation is usually found to be mostly important to service companies because it is difficult for them to protect their products through copyrights and patents [48]. Service companies can be innovated by generating novel services or devising existing ones and generating distribution channels other than the existing ones [49]. According to [50], marketing innovation increases the sustainable competitive advantage of a firm. They concluded that sustained competitive advantage is positively affected by developing marketing innovation. Innovation is the capability of a firm to effectively differentiate it from its rivals’ organizations and attain a sustainable competitive advantage [51,52,53] argue that “marketing innovation had the strong potential to lead quickly to sustainable competitive advantage”. On the basis of the above discussion it can be hypothesized that:
Hypothesis 2 (H2).
Marketing innovation influences the sustainable competitive advantage.

2.2.3. Brand Equity and Market Performance

The constructs of customer-based brand equity are significantly associated with the market performance of a brand [54,55], in their study, pointed out that there is a relationship between brand equity and market performance. According to the research findings of [56], corporate brand equity positively affects a firm’s performance. Therefore, it can be hypothesized that:
Hypothesis 3 (H3).
Brand equity influences the market performance.

2.2.4. Marketing Innovation and Market Performance

The practice of a novel marketing process that considers major changes in the design, delivery, promotion, or pricing of products (goods or services) is called marketing innovation [57].
According to [58], the main objectives of marketing innovation are an improvement in the position of the business in the market, better meeting the needs of consumers, opening new markets, and increasing sales. Innovation functions as a major factor in production, competitiveness, a business’s continued existence, growth, and the creation of employment by an organization [59]. The performance of the firm can be enhanced positively by integrating complementary resources [60]. It has been empirically proved that innovation has a positive effect on the performance of a firm [61]. Mixed findings are frequently presented by empirical studies that investigate the innovation–performance relationship [62]. The results of all studies that have been conducted to test the association between marketing innovation and the performance of a firm have proved a positive relationship [50,63]. Therefore, on the basis of the above literature review it can be hypothesized that:
Hypothesis 4 (H4).
Marketing innovation influences the market performance.

2.2.5. Sustainable Competitive Advantage and Market Performance

The capability of a firm to do business by smartly using its resources in a meaningful way, which maximizes its value creation and cannot be replicated by rivals, is known as competitive advantage [64,65] states that when the corporation is capable of creating more financial value than a competitor’s corporation then the corporation is said to have a competitive edge over its competitor. To attain market performance, firms must create a sustainable competitive advantage [66,67,68]. According to the [69] study, competitive advantage and market performance are significantly associated. There are many studies in the strategic management, international business, and marketing literatures that presume a direct positive association between competitive advantage and market performance [70]. On the basis of this it can be hypothesized that:
Hypothesis 5 (H5).
The sustainable competitive advantage influences market performance.

2.2.6. Sustainable Competitive Advantage as a Mediator between Sustainable Marketing Assets and Market Performance

Brand equity along with marketing innovations can create the long-term appeal of a product or service to prospective consumers. There are studies in which the effects of brand equity [46] and marketing innovation [50] have been studied in relation to sustainable competitive advantage. It is also found in the literature that sustainable competitive advantage has an influence on market performance [70]. In the light of the above discussion, the following hypothesis can be grounded:
Hypothesis 6 (H6).
Sustainable competitive advantage mediates the relationship between marketing assets (a: brand equity, b: marketing innovation) and market performance. (See Figure 1)

3. Research Methodology

In the present study, positivist philosophy was adopted because the nature of the study being conducted was to study the relationship of sustainability-based marketing assets, sustainable competitive advantage, and market performance. The reason for selecting this strategy was that it matched with existing marketing studies in the literature of same kind [71].
A deductive research approach was incorporated in this study, which is related to positivist philosophy. It helps to formulate the hypotheses on the basis of the theory under consideration in the study, and furthermore it allows a specific research design to be made to verify it [72].The deductive research approach selected for the current research threat further led to the selecting of a suitable research strategy to evaluate the selected theory [73].The survey research strategy is used in a study of a quantitative nature [74]. It is commonly linked with the deductive research approach [75]. The survey research strategy is generally used in management and business studies and for explanatory research. As the current study is quantitative, deductive, and explanatory in nature, survey research strategy was suitable. Survey research design is defined as “a systematic set of methods used to gather information to generate knowledge and to help make decisions” [76]. The current research applied the survey research strategy to explore the proposed research questions.
The survey research design allows the researcher to collect data for independent variables, mediating variables, moderating variables, and dependent variables. It tries to explain the beliefs, ideas, opinions, attitudes, behaviors, and viewpoints through primary data collecting from a defined sample of a population [77,78,79]. According to [79], the survey research design is helpful in collecting large amounts of data and in generalizing findings of a study. The current study used the survey research design through a self-administered questionnaire conducted within the Pakistani market to validate the proposed theoretical framework.
According to [80], explanatory research explains cause and effect relationships and how the factors are inter-related in a proposed theoretical model. Explanatory survey research design was suitable in the current research because the cause and effect relations were established among the variables in it. Depending on the nature of the present study, the author applied explanatory survey design. In relation to the hypotheses developed, explanatory survey research design that focuses on the four following variables was used: (1) brand equity, (2) marketing innovation, (3) sustainable competitive advantage, and (4) market performance.
A survey research design was applied for this research and adopted the form of self-administered questionnaires. The questionnaires were distributed face-to-face to the consumers of hotels/restaurants in Pakistan. [81] indicated that questionnaires that informants fill out guarantee of a higher response rate and such an approach is efficient and effective for scholars in terms of time, cost, and effort. Before the official launching of the questionnaire, there was a phase of pilot testing to clarify and comprehend the questionnaires. We ensured confidentiality of the data to our informants. All the respondents participated in the survey voluntarily. After an announcement of anonymity, a paper-based questionnaire was distributed and participants were requested to fill out it and hand it over to the researcher on the spot to ensure unbiased analyses. The length of the study survey was comprised of five months in 2018. Authors ensured that all the questionnaires were fully filled, with missing data observed during the collection phase, and therefore the number of invalid responses or partially filled questionnaires could be reduced. No monetary or any other forms of reward were offered to respondents. A total of 360 paper-based questionnaires were distributed.
As far as the sampling strategy was concerned, to collect data in the current study a multi-stage sampling strategy and convenience sampling that belongs to the family of non-probability sampling was applied. Non-probability sampling strategy that is convenience sampling is commonly adopted in marketing research. Of course, there is an advantage to convenience sampling in that it permits researchers to collect a large sample in a quick and easy way [82]. The use of convenience sampling strategy for hotels/restaurants’ customers was suitable for the current study to confirm the relationships among the study variables [83]. Convenience sampling is used frequently in many fields by researchers due to situational and financial constraints [84]. Various rules for opting fora sample size for studies are recommended in the literature and usually these rules are the function of researchers’ experience, an unspecified set of beliefs, or are announced from annunciated expert, and it is stated that for factor analysis a sample size between 150 and200 is considered as sufficient [85,86] endorses the recommendations of [85] and suggests that some statistical techniques must be followed while determining the sample size adequacy and takes a sample size of 460 in total—the sum of two equal sample sizes of 230 from two groups of study belonging to different regions. [86,87] recommend a range of item-response ratio from 1:4 to 1:10 for an ideal sample size and further explain that this ratio is appropriate for confirmatory factor analysis. They claim that this ratio fulfills the criteria of the minimum sample size. [88] also recommends guidance, related to an ideal sample size in which a 1:10 item to response ratio can be applied.
[89] explains that a large sample size does not guarantee the achievement of accuracy, and according to the point of view of [87], that precision decreases if a small sample size is used in SEM analysis. Another recommendation in the literature given by [90] is that sample size of 200 or higher is helpful for a model having a complex path nature. [91] give valuable suggestions regarding sample-size adequacy that evaluate on the estimations that 50 responses for a study are considered “very poor”, 100 responses are considered “poor”, 200 responses are considered “fair”, 300 responses are considered as “good”, 500 responses are considered “very good”, and 1000 or more responses are considered “excellent”. However, generally the ratio of 1:10 (i.e., 10 “cases” against 1 “indicator”) is taken by the methodologist [90]. An item-to-response ratio of 1:10 is suggested by [92]. By considered all the above discussed guiding principles, the author decided on a 1:10 ratio of item-to-response. Herein, in the study all constructs were adapted and a total of 18 Likert-scaled items were used, and thus the sample size was 180 (18 * 10 = 180). [70] suggested that a sample size greater than thirty (> 30) and less than five hundred (< 500) is assumed to be suitable for much research.

4. Results and Interpretation

4.1. Analysis and Procedure

After data screening and cleaning, preliminary analysis was performed because it led toward suitability of the data set to analyze for more statistical techniques and to apply these tests using SPSS version 20. Further, the structural equation modeling (SEM) technique was applied that permitted the researcher to test the inter-dependency among variables and explore the nature of relationships. The benefit of SEM is that it evaluates the inter-dependence in a single point. If in research the numbers of independent, dependent, mediating, and moderating variables are more than one, then SEM is an appropriate technique for examining the hypotheses. The overall fitness of model can be evaluated by using the SEM technique. Visually, path diagrams are used to represent the relationship between the variables. Rectangles are used to represent the observed variables and circle or elliptical shapes are used to represent the unobserved variables. There are two steps that are recommended for testing in SEM. The measurement model is tested in first step and the testing of structural model is the second [93], whereas in the view of [94], to measure the convergent validity and discriminant validity, confirmatory factor analysis (CFA) is necessary with a maximum likelihood estimation process. The data analysis software AMOS version 23 was used to apply statistical technique structural equation modeling. The basic assumptions of structural equation modeling e.g., data screening, normality of data, linearity of data, multi-co linearity, etc. were checked in the pre-testing stage.

4.2. Preliminary Analysis

Biographical information of the respondents was represented by studying their age, gender, and marital status through data collected from the respondents. Data showed that 63.3% (n = 226) of the respondents were male, while 36.7% (n = 131) of the respondents were female. Concerning the age group of the respondents in this study, about 10.6%(n = 38) of the respondents were in the age group of 20 years or less, 34.2% (n = 122) of the respondents belonged to the second class (21–30 years), 34.5% (n = 123) of the respondents belonged to the third class(31–40 years), 12.6% (n = 45) of the respondents belonged to the fourth class (41–50 years), 8.1% (n = 29) of the respondents belonged to the fifth class (51–60 years). Out of 357 respondents who used hotels/restaurants services in Pakistan, 267 (74.8%) of the respondents were unmarried, while 90 (25.2%) were married. Cronbach’s alpha was used to check the reliability of the measuring instrument, which had an overall value of0.891. To inspect the discriminant validity, a CFA was employed to compare two models, each of which contained only two constructs and their relevant items. This is a generally accepted method introduced by the Zait‒Bertea criterion [95]. The results of the CFA to compare the two models showed that items of each construct discriminated from the items of the other constructs under investigation. The Pearson correlation coefficient was used to show the relationships between the variables. All the correlation values of the independent variables “brand equity, marketing innovation”, mediating variable “sustainable competitive advantage”, and dependent variable “market performance” were significant at the 0.01 level (two tailed) (r = 0.204 **, 0.395 **, 0.407 **; p < 0.01), respectively. For the adequacy of the sample size, Kaiser-Meyer-Olkin and Bartlett’s test were run on the sample size of the data collected with a statistical value of 0.866 (p < 0.001). It revealed that the sample size was adequate, and the results of the preliminary analysis were satisfactory, therefore allowing the researcher to proceed to performing further analyses. The Table 1 shows the Cronbach’s alpha values of the measurement scale which satisfy the acceptability norms [more than 0.70].

4.3. Measurement Model

The following Table 2 presents the standardized regression weights for constructs.
All the required values of fit indexes were within the recommended range (see Table 3). The value of χ2/d.f.in the current study measurement model was 2.127. This was in the recommended range of < 3. The value of goodness of fit index (GFI) should be higher than 0.90, and closer to 1 is more acceptable, and in this case its value was 0.924, which was within the range of the recommended value. The value of adjusted goodness fit of index (AGFI) should be greater than 0.80, and closer to 1 is more acceptable, and in this case its value was 0.8895, which was in given range of the recommended value. The recommended value of root mean square error of approximation (RMSEA) is less than 0.08, or even less than this is considered a fit (in some cases up to 0.10 is also acceptable). For the present study the results showed the value of this parameter was 0.067. As far as the value of root mean square residual (RMR) is concerned, its range is from 0-1, and less is consider good. In this model its value was 0.039, which was a good fit. The value of normed fit index (NFI) is acceptable if it is greater than 0.90, and closer to 1 is considered excellent, and in this case its value was 0.881, which was near to a good fit. Likewise, the recommended value of comparative fit index (CFI) is greater than 0.80 and in this model its value was 0.932, which was acceptable. A PCLOSE acceptable value is greater than 0.05 and here it was 0.135, which was a fit for the model. Hence, all the resultant values were significant and above the acceptable range, and the model was a good fit.
The following Table 4 presents the Standard regression weights for the SEM.

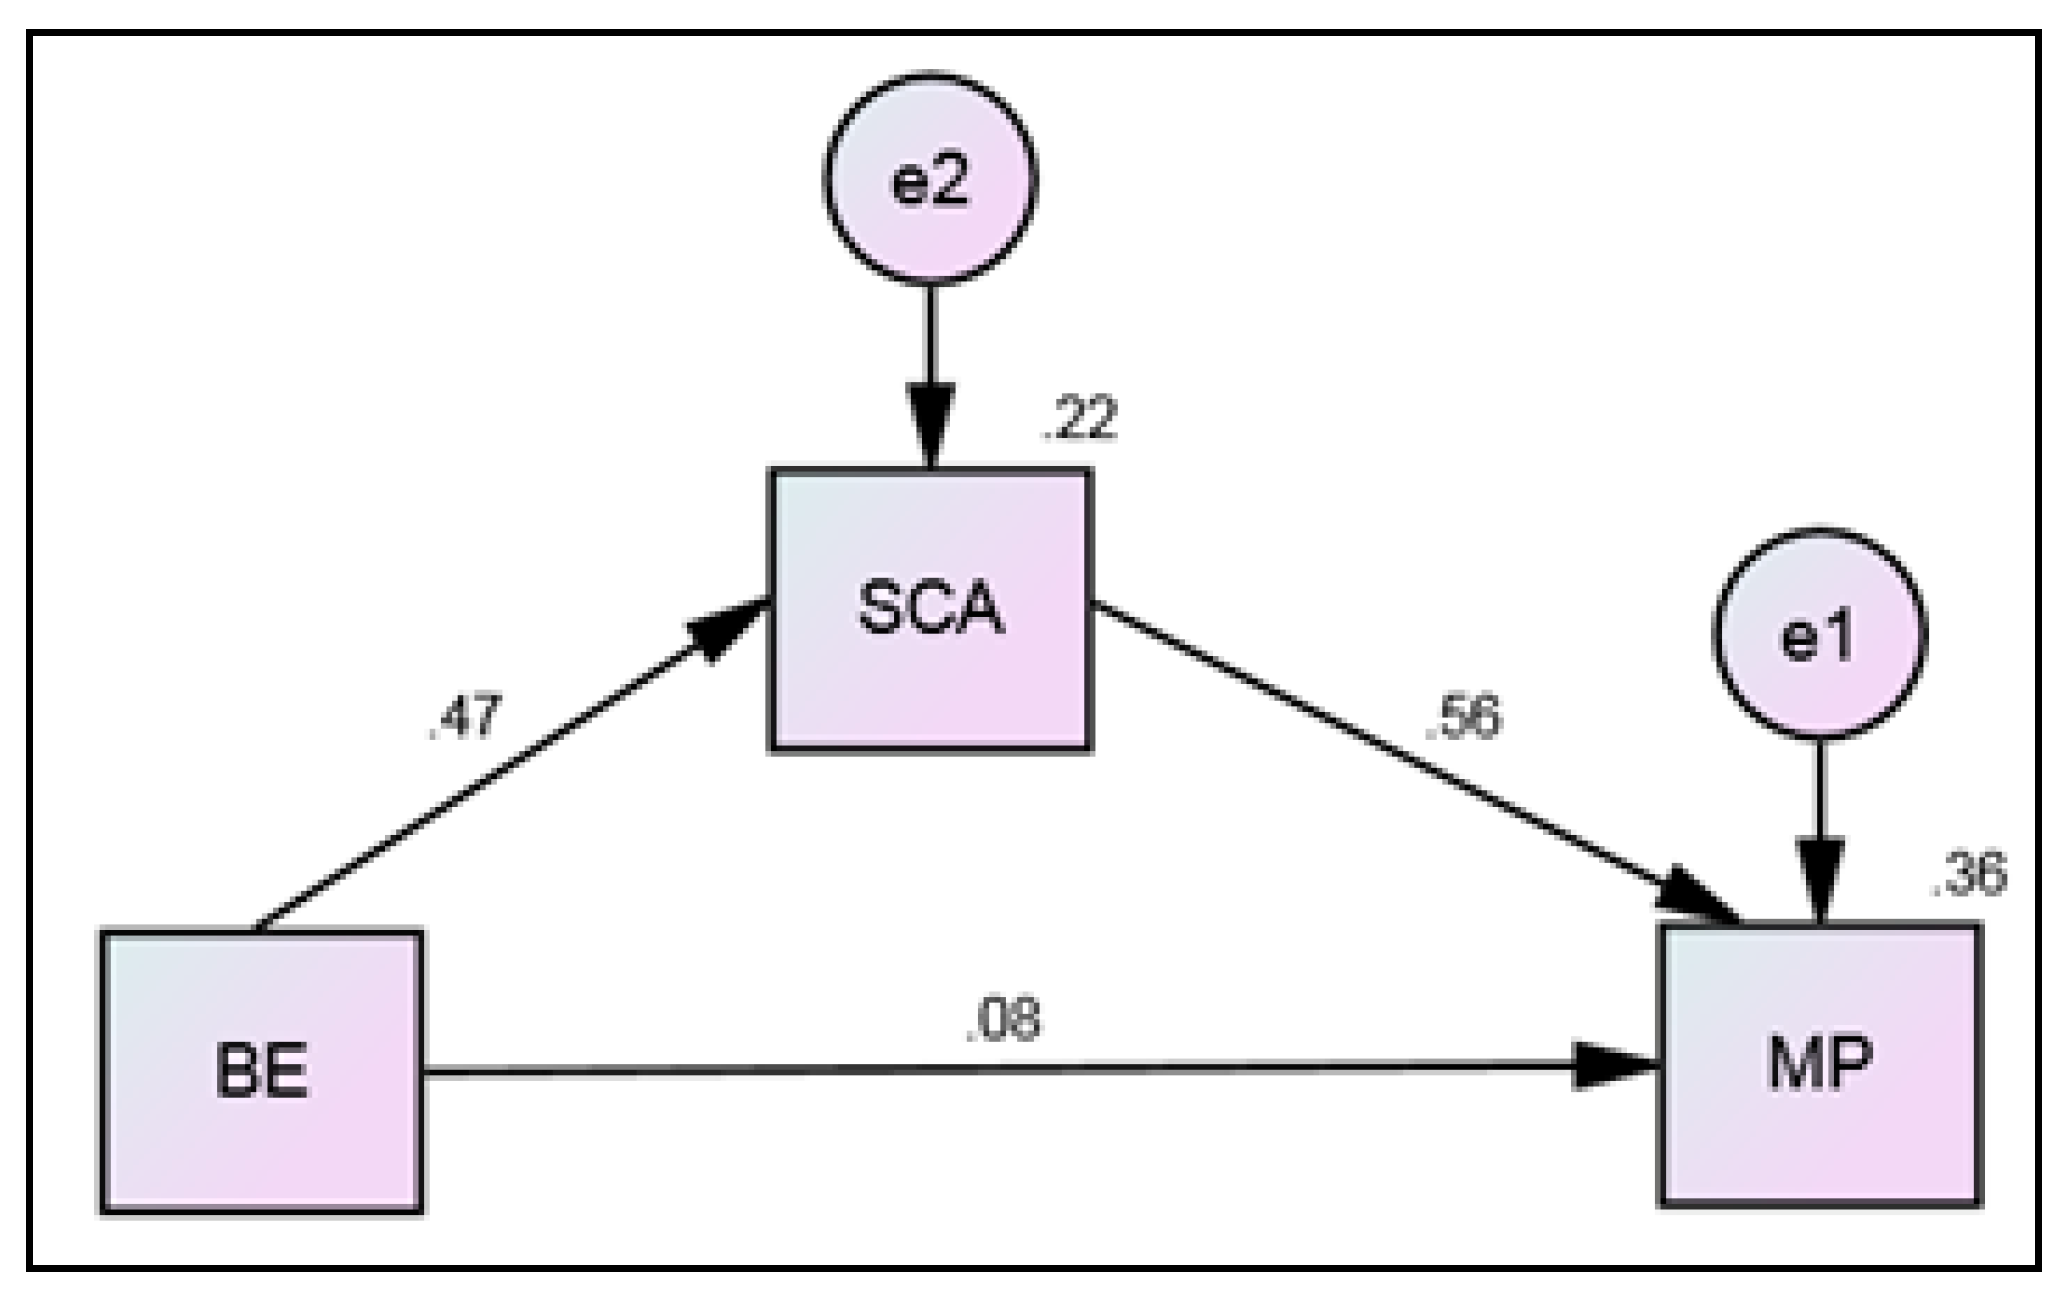
4.4. Mediation Analysis

The following Table 5 presents the Interference for mediation.
In mediation 1 as shown in Figure 2, brand equity (BE) was an independent variable, sustainable competitive advantage (SCA) was a mediating variable, and market performance (MP) was a dependent variable. The value of direct beta between independent and dependent variables was recorded in the absence of a mediator of β = 0.341, and its level of significance was calculated through a p-value of p = 0.000. After this, direct effect was calculated in the presence of mediator and its beta value was recorded as β = 0.078 with level of significance as p = 0.132. Following the same trend, the indirect effect was also analyzed and its beta and p-value were β = 0.263 and p = 0.001. It is clear from the analysis that the direct effect of BE on MP was significant in the absence of a mediator and was insignificant in the presence of a mediator. The indirect effect was also significant in the presence of a mediator. Therefore, SCA fully mediated the relationship between BE and MP.
In mediation 2 as shown in Figure 3, marketing innovation (MI) was an independent variable, sustainable competitive advantage (SCA) was a mediating variable, and market performance (PM) was a dependent variable. The value of direct beta between independent and dependent variables was recorded in the absence of a mediator of β = 0.636, and its level of significance was calculated through a p-value of p = 0.000. After this, direct effect was calculated in the presence of a mediator and its beta value was recorded as β = 0.430 with level of significance as p = 0.001. It is clear from the analysis that the direct effect of MI on MP was significant in the absence of a mediator and was insignificant in the presence of a mediator. The indirect effect was also significant in the presence of a mediator. Therefore, SCA partially mediated the relationship between MI and MP.

5. Discussion on Findings

The postulated hypothesis (H1) indicates the relationship between brand equity and market performance. The value of correlation coefficient was (r = 0.204, p < 0.01), which explains a strong positive relationship between brand equity and market performance. The researchers used structural equation modeling (SEM) to prove the adequacy of the proposed model to demonstrate and confirm the significance of relationships among independent and dependent variables. Structural equation modeling was used to calculate the standardized regression weights and indicate a positive significant relationship between brand equity and market performance, which is reflected through the statistical value of (β = 0.341, p < 0.001). The results of the study showed that brand equity has a positive significant influence on market performance. This result of the study agrees with past studies (e.g., [96]. This study verifies the positive influence of brand equity on market performance. The result of the current study is aligned with the findings of previous studies. Conclusively, the findings of the current study have revealed that customers in Pakistan consider brand equity positively. Based on these findings, managers should pay attention to brand equity to improve the performance of their products in the marketplace.
The postulated hypothesis (H2) indicates the relationship between marketing innovation and market performance. The value of correlation coefficient was (r = 0.395, p < 0.01), which explains a strong positive relationship between marketing innovation and market performance. The researchers used structural equation modeling (SEM) to prove the adequacy of the proposed model to demonstrate and confirm the significance of relationships among independent and dependent variables. Structural equation modeling was used to calculate the standardized regression weights and indicate a positive significant relationship between marketing innovation and market performance, which is reflected through the statistical value of (β = 0.636, p < 0.001). The results of the study showed that marketing innovation has a positive significant influence on market performance. Our findings are compatible with the study done by [50,63]. These studies predict the positive influence of marketing innovation on market performance. Conclusively, the findings of the current study have revealed that customers in Pakistan consider marketing innovation positively. Based on these findings, managers should pay attention to marketing innovation to improve the performance of their products in the marketplace.
The postulated hypothesis (H3) shows the relationship between brand equity and sustainable competitive advantage. The value of correlation coefficient was (r = 0.331, p < 0.01), which explains a strong positive relationship between brand equity and sustainable competitive advantage. Our tests with the help of structural equation modeling (SEM) prove the adequacy of the proposed model to demonstrate and confirm the significance of relationships among independent and dependent variables. Structural equation modeling was used to calculate the standardized regression weights and indicate a positive significant relationship between brand equity and sustainable competitive advantage, which is reflected through the statistical value of (β = 0.470, p < 0.001). The results of the study showed that brand equity has a positive significant influence on sustainable competitive advantage. This result of the study agrees with past studies [39,46,97,98,99]. These studies verify the positive influence of brand equity on sustainable competitive advantage. The result of the current study is aligning with the initial findings of previous studies. Conclusively, the findings of the current study have revealed that customers in Pakistan consider brand equity positively. Based on this finding, managers should pay attention to building brand equity to attain a sustainable competitive advantage in the marketplace.
The postulated hypothesis (H4) indicates the relationship between marketing innovation and sustainable competitive advantage. The value of correlation coefficient was (r = 0.446, p < 0.01), which explains a strong positive relationship between marketing innovation and sustainable competitive advantage. The researchers used structural equation modeling (SEM) to prove the adequacy of the proposed model to demonstrate and confirm the significance of relationships among independent and dependent variables. Structural equation modeling was used to calculate the standardized regression weights and indicate a positive significant relationship between marketing innovation and sustainable competitive advantage, which is reflected through the statistical value of (β = 0.670, p < 0.001). The results of the study showed that marketing innovation has a positive significant influence on sustainable competitive advantage. This result of the study agrees with past studies [50,51,52]. These studies verify the positive influence of marketing innovation on sustainable competitive advantage. The result of the current study is aligning with the findings of previous studies. Conclusively, the finding of the current study has revealed that customers in Pakistan consider marketing innovation positively. Based on these findings, managers should pay attention to marketing innovation to attain a sustainable competitive advantage in the marketplace.
The postulated hypothesis (H5) indicates the relationship between sustainable competitive advantage and market performance. The value of correlation coefficient was (r = 0.407, p < 0.01), which explains a strong positive relationship between sustainable competitive advantage and market performance. The researchers used structural equation modeling (SEM) to prove the adequacy of the proposed model to demonstrate and confirm the significance of relationships among independent and dependent variables. Structural equation modeling was used to calculate the standardized regression weights and indicate a positive significant relationship between sustainable competitive advantage and market performance, which is reflected through the statistical value of (β = 0.595, p < 0.001). The results of the study showed that sustainable competitive advantage has a positive significant influence on market performance. This result of the study agrees with past studies (e.g., [67,69,70]. These studies verify the positive influence of sustainable competitive advantage on market performance. The result of the current study is aligning with the findings of previous studies. Conclusively, the findings of the current study have revealed that customers in Pakistan consider sustainable competitive advantage positively. Based on these findings, managers should pay attention to developing a sustainable competitive advantage to improve performance in the marketplace.
Direct beta without mediation (βa), direct beta with mediation (βb), and indirect beta (βc) was calculated for hypothesis H6. The calculated values of three betas of these two sub-hypotheses with significance level were βa = 0.341, p = 0.000; βb = 0.078, p = 0.132; and βc = 0.263, p = 0.001 and (βa = 0.636, p = 0.000; βb = 0.430, p = 0.001; and βc = 0.206, p = 0.001, respectively. The results of H6a show there was full mediation. The results of H12b show there was partial mediation. Sustainable competitive advantage partially mediates the association between predictor variables of marketing innovation and outcome variable of market performance, while fully mediating between brand equity and market performance. These results, in view of the mediating effect, are not maintained by the literature, although it is pointed out that the establishment of a sustainable competitive advantage in a firm assists superior performance. It must be noted that there is a sustainable competitive advantage that is evident from the intangible sustainability-based marketing assets of either brand equity or even improved marketing innovation which can only be recognized in an organization in the presence of good management. In this way, the mediating effect of competitive advantage is displayed from the point of view of the literature. These results associate well with the theory of competitive advantage, which postulates that the existence of assets that are hard to imitate are associated with the competitive position of an organization [100]. Similarly, [101] pointed out that intangible assets more probably create the sustainable competitive advantage of an organization that transform into superior market performance than tangible assets.

6. Conclusions

In the context of customers in Pakistan, by thinking about the significance of sustainable marketing assets, the present research answers the question why customers in Pakistan use hospitality services and what are the encouraging factors that provide confidence to customers to acknowledge these services. The present research built up a theoretical model, to achieve the study objectives that merged the predictable factors: brand equity and marketing innovation are intangible marketing assets that were chosen on the basis of a resource-based view (RBV). All the study constructs, which are selected from the previous work of researchers who have recognized that these factors are prominent to finding out about market performance through sustainable competitive advantage, are discussed. The findings of the study illustrated that all three factors have a positive significant impact on market performance in the Pakistani hospitality market. Therefore, all the proposed hypotheses, H1, H2, H3, H4, H5, and H6, are supported.
The test of the conceptual model has contributed to knowledge generation and enhanced our understanding on how sustainable marketing assets influence both SCA and market performance in the hospitality industry in an emerging country market such as Pakistan. Several significant contributions of the current study to the hospitality industry for the adoption of sustainable marketing assets are as follows:
Firstly, the findings play a significant role in increasing the market performance of the various services that hotels/restaurants offer to potential customers. In regard to sustainable marketing assets, the current study has recommended a resource-based view for creating a sustainable competitive advantage and the impact of this on the market performance of an organization. Our results show that brand equity, marketing innovation, and sustainable competitive advantage have a significantly positive effect on market performance. The current study has contributed to the hospitality industry the findings that brand equity and marketing innovation have important roles in creating a sustainable competitive advantage, and consequently, influence market performance.
Secondly, the impact of intangible sustainable marketing assets, such as brand equity and marketing innovation, on market performance through sustainable competitive advantage is empirically tested in the context of an emerging market like Pakistan. This contributes to the existing body of knowledge on marketing strategy in emerging markets. The empirical results of the study have proved that marketing innovation is positively significant but has a partial effect on market performance mediated by sustainable competitive advantage. On the other hand, brand equity has a positive and significant effect on market performance. Hence, the hypothesis related to marketing innovation is partially supported and the hypothesis related to brand equity is fully supported. Conclusively, the study’s insights have contributed to the knowledge creation that the effects of brand equity and marketing innovation on Pakistani customers, and consequently on market performance, differ from each other.
Managerial implications of the study are manifold. This study can help business practitioners of hotels/restaurants to develop their understanding of the effects of brand equity and marketing innovation and develop their marketing strategy in order to effectively target the market segment in an emerging market like Pakistan. The study explains the strength of the relationships of brand equity, marketing innovations, and sustainable competitive advantages with market performance. By improving their knowledge on the effects of these driving forces, they can formulate effective marketing strategies to increase market performance by using sustainable intangible marketing assets in the field of the hospitality industry. Globalization, social media, free media, and openness to the world might have contributed to the awareness of consumers on sustainable marketing assets and attracted them to products and services offered by organizations, which adhere to those principles.
Despite the utmost efforts on this study, there are several limitations and opportunities for future research:
i.
As the data was collected from customers who live in urban areas and not from rural areas, there is an issue in generalizing the findings of the current study to all customers of the whole of Pakistan. Future research may be conducted by collecting the data from both urban as well as rural areas to generalize the results of the research.
ii.
The research took a few selected sustainable marketing assets only. Future research can consider sustainable marketing assets such as goodwill, corporate reputation, and several others. For example, corporate reputation can have a positive effect on the market performance of attracting customers, and marketers need to take care of the corporate reputation while developing marketing strategies.
iii.
The sample of the current research was taken from the hospitality industry; therefore, the results of the study cannot be generalized in other sectors (industries) due to the embedded contexts, life cycles, and levels of competition in each industry (Nguyen and Papadopoulos, 2011), which might affect the investment of firms in sustainable marketing practices. In future, research should be conducted in other industries to generalize the results of the current study.
iv.
In the current research, only the customers of hotels/restaurants were considered, while other stakeholders, such as hotels/restaurant clients and suppliers, have been overlooked. Future research should be conducted by considering other stakeholders to understand the sustainability issues in a more comprehensive way and by implementing them properly in hotels/restaurants industry.
v.
Future research can also address the social, cultural, and economic difference among customers and the effects of sustainable marketing assets on them.

Author Contributions

Conceptualization, I.H., R.Q.D., and S.A.S.; methodology, I.H., S.M., M.M., R.Q.D.; software, I.H.; validation, I.H., R.Q.D., M.M. and S.M.; formal analysis, I.H., R.Q.D., S.A.S.; investigation, I.H., S.M; resources, I.H., S.M., M.M.; data curation, I.H.; writing—original draft preparation, I.H., R.Q.D.; writing—review and editing, S.M., M.M., R.Q.D.; visualization, I.H., S.A.S.; supervision, R.Q.D., S.A.S.; project administration, I.H.; funding acquisition, I.H., S.M., M.M. All authors have read and agreed to the published version of the manuscript.

Funding

1. Humanities and social scientific research planning fund project by Chinese Ministry of education: 19YJAZH063; 2. General Project of Provincial scientific fund of Shandong, China: ZR2019MG040; 3. General Project of Chinese National social scientific fund: 19BJL095; 4. Administrative Science Association of Canada (ASAC) past president’s bi-annual award 2018.

Conflicts of Interest

The authors declare no conflict of interest.

Appendix A. Study Questionnaire

Dear respondent
Thank you for sparing some of your precious time to fill in this questionnaire. It is being distributed to you purely for academic purpose and all the responses will be confidential. Your unbiased choices will be highly appreciated and make this research valuable.
Table A1. Personal Profile.
Please indicate the appropriate choice by selection in parentheses
1. Gender
(a) Male  ( )  ; (b) Female  ( )
2. Age
(i) 20 or less  ( )  ; (ii) 21–30  ( )  ; (iii) 31–40  ( )  ; (iv) 41– 50  ( )  ; (v) 51–60  ( )  ; (vii) 60 or above  ( )
3. Marital Status
(a) Married  ( ); (b) Single  ( )
Table A2. Brand equity.
Please indicate how much you agree or disagree with the following statements about your organization.Strongly
Disagree
DisagreeNeitherAgreeStrongly
Agree
4It makes sense to buy XYZ instead of any other brand, even if they are the same.
5Even if another brand has same features as XYZ, I would prefer to buy XYZ.
6If there is another brand as good as XYZ, I prefer to buy XYZ.
7If another brand is not different from XYZ in any way, it seems smarter to purchase XYZ.
Table A3. Marketing innovation.
Please indicate how much you agree or disagree with the following statements about your organization.Strongly
Disagree
DisagreeNeitherAgreeStrongly
Agree
8Product related strategies are innovative in a radical way.
9Pricing strategies are innovative in a radical way.
10Promotion (advertising, sales promotion, sales force, etc.) strategies are innovative in a radical way.
11Distribution (channel, logistics, and supply chain) related strategies are innovative in a radical way.
Table A4. Sustainable competitive advantage.
Please indicate how much you agree or disagree with the following statements about your organizationStrongly DisagreeDisagreeNeitherAgreeStrongly Agree
12The company is more capable of R&D than the competitors.
13The company has better managerial capability than the competitors.
14The quality of the products or services that the company offers is better than that of the competitors’ products or services.
15The company’s profitability is better than the competitors.
16The corporate image of the company is better than that of the competitors
17The competitors are difficult to take the place of the company’s competitive advantage.
Table A5. Market performance.
Please indicate how much you agree or disagree with the following statements about your organizationStrongly DisagreeDisagreeNeutralAgreeStrongly Agree
18I am satisfied with my hotel/restaurant.
19Quality of core service is up to your expectations.
20I recommend the hotel/restaurant to friends and associates.
21I encourage friends and associates to visit this hotel/restaurant

References

  1. Dauvergne, P.; Lister, J. Eco-business. A Big-Brand Takeover of Sustainability/Peter Dauvergne and Jane Lister; The MIT Press: Cambridge, MA, USA; London, UK, 2013. [Google Scholar]
  2. Elkington, J. Cannibals with Forks: The Triple Bottom Line of 21st Century Business; New Society: Gabriola Island, BC, Canada, 1997. [Google Scholar]
  3. Sajjad, A.; Eweje, G. Corporate social responsibility in Pakistan: Current trends and future directions. In Corporate Social Responsibility and Sustainability: Emerging trends in Developing Economies; Emerald Group Publishing Limited: Bingley, UK, 2014; pp. 163–187. [Google Scholar]
  4. Eweje, G. Introduction: Trends in corporate social responsibility and sustainability in emerging economies. In Corporate Social Responsibility and Sustainability: Emerging Trends in Developing Economies; Emerald Group Publishing Limited: Bingley, UK, 2014; pp. 3–17. [Google Scholar]
  5. Anisul Huq, F.; Stevenson, M.; Zorzini, M. Social sustainability in developing country suppliers: An exploratory study in the ready-made garments industry of Bangladesh. Int. J. Oper. Prod. Manag. 2014, 34, 610–638. [Google Scholar] [CrossRef]
  6. Jamali, D.; Karam, C. CSR in developed versus developing countries: A comparative glimpse. In Research Handbook on Corporate Social Responsibility in Context; Edward Elgar Publishing: Cheltenham, UK, 2016. [Google Scholar]
  7. Mohiuddin, M.; Mamun, A.A.; Fazal, S.A.; Masud, M.M. Environmental Knowledge, Awareness and Business School Students’ Intention to Purchase Green Vehicles in Emerging Countries. Sustainability 2018, 10, 1543. [Google Scholar] [CrossRef] [Green Version]
  8. Hunt, S.D. Resource-Advantage Theory: An Evolutionary Theory of Competitive Firm Behavior? J. Econ. Issues 1997, 1, 59–77. [Google Scholar] [CrossRef]
  9. Hunt, S.D. Developing successful theories in marketing: Insights from resource-advantage theory. Acad. Mark. Sci. Rev. 2011, 1, 72–84. [Google Scholar] [CrossRef]
  10. Hooley, G.; Greenley, G.; Cadogan, J.; Fahy, J. The performance impact of marketing resources. J. Bus. Res. 2005, 58, 18–27. [Google Scholar] [CrossRef]
  11. Na, Y.K.; Kang, S.; Jeong, H.Y. The effect of market orientation on performance of sharing economy business: Focusing on marketing innovation and sustainable competitive advantage. Sustainability 2019, 11, 729. [Google Scholar] [CrossRef] [Green Version]
  12. Srivastava, R.K.; Shervani, T.A.; Fahey, L. Market-based assets and shareholder value: A framework for analysis. J. Mark. 1998, 62, 2–18. [Google Scholar] [CrossRef] [Green Version]
  13. Penrose, E.T. The Theory of Growth of The Firm; Blackwell: Oxford, UK, 2008. [Google Scholar]
  14. Nath, P.; Nachiappan, S.; Ramanathan, R. The impact of marketing capability, operations capability and diversification strategy on performance: A resource-based view. Ind. Mark. Manag. 2010, 39, 317–329. [Google Scholar] [CrossRef]
  15. Barney, J. Gaining and Sustaining Competitive Advantage; Prentice Hall Person: Upper Saddle River, NJ, USA, 2007. [Google Scholar]
  16. Talaja, A. Testing VRIN framework: Resource value and rareness as sources of competitive advantage and above average performance. Management 2012, 7, 51–64. [Google Scholar]
  17. Peteraf, M.A.; Bergen, M.E. Scanning dynamic competitive landscapes: A market-based and resource-based framework. Strateg. Manag. J. 2010, 24, 1027–1041. [Google Scholar] [CrossRef]
  18. Teece, D.J. Explicating dynamic capabilities: The nature and microfoundations of (sustainable) enterprise performance. Strateg. Manag. J. 2007, 28, 1319–1350. [Google Scholar] [CrossRef] [Green Version]
  19. Shane, H.; Klock, M. The relation between patent citations and Tobin’s Q in the semiconductor industry. Rev. Quant. Financ. Account. 1997, 9, 131–146. [Google Scholar] [CrossRef]
  20. Low, J.W.; Lee, B.K. Effects of internal resources on airline competitiveness. J. Air Transp. Manag. 2014, 36, 23–32. [Google Scholar] [CrossRef]
  21. Ciftci, M.; Zhou, N. Capitalizing RandD expenses versus disclosing intangible information. Rev. Quant. Financ. Account. 2016, 46, 661–689. [Google Scholar] [CrossRef]
  22. Makrominas, M. Recognized intangibles and the present value of growth options. Rev. Quant. Financ. Account. 2017, 48, 311–329. [Google Scholar] [CrossRef]
  23. Davcik, N.S.; Sharma, P.; Grigoriou, N. Exploring the role of brand equity and RandD as drivers of product innovation and market performance: An abstract. In Marketing at the Confluence between Entertainment and Analytics; Springer: Cham, Switzerland, 2017; p. 13. [Google Scholar]
  24. Barney, J.B.; Arikan, A.M. The resource-based view: Origins and implications. In The Blackwell Handbook of Strategic Management; Hitt, M.A., Freeman, R.E., Harrison, J.S., Eds.; Blackwell Publishers: Oxford, UK, 2001. [Google Scholar]
  25. Kor, Y.; Mesko, A. “Dynamic managerial capabilities: Configuration and orchestration of top executives’ capabilities and the firm’s dominant logic”. Strateg. Manag. J. 2013, 34, 233–244. [Google Scholar] [CrossRef]
  26. Dubey, R.; Gunasekaran, A.; Papadopoulos, T.; Childe, S.J.; Shibin, K.T.; Wamba, S.F. Sustainable supply chain management: Framework and further research directions. J. Clean. Prod. 2017, 142, 1119–1130. [Google Scholar] [CrossRef] [Green Version]
  27. Papadopoulos, T.; Gunasekaran, A.; Dubey, R.; Fosso Wamba, S.; Childe, S.J. World Class Sustainable Supply Chain Management: Critical review and further research directions. Int. J. Logist. Manag. 2017. [Google Scholar] [CrossRef]
  28. Eisenhardt, K.M.; Martin, J.A. Dynamic capabilities: What are they? Strateg. Manag. J. 2000, 21, 10–11. [Google Scholar] [CrossRef]
  29. Teece, D.J.; Pisano, G.; Shuen, A. Dynamic capabilities and strategic management. Strateg. Manag. J. 1997, 18, 509–533. [Google Scholar] [CrossRef]
  30. WCED, S.W.S. World Commission on Environment and Development. In Our Common Future; World Commission on Environment and Development: Oslo, Norway, 1987. [Google Scholar]
  31. Galea, C. (Ed.) Introduction. Teaching Business Sustainability: From Theory to Practice; Green Leaf Publishing: Sheffield, UK, 2004; Volume 1, pp. 9–17. [Google Scholar]
  32. Dyllick, T.; Hockerts, K. Beyond the business case for corporate sustainability. Bus. Strategy Environ. 2002, 11, 130–141. [Google Scholar] [CrossRef]
  33. Hay, B.L.; Stavins, R.N.; Vietor, R.H. Environmental Protection and the Social Responsibility of Firms: Perspectives from Law, Economics, and Business; Resources for the Future: Washington, DC, USA, 2005. [Google Scholar]
  34. Kleindorfer, P.R.; Singhal, K.; Wassenhove, L.N. Sustainable operations management. Prod. Oper. Manag. 2005, 14, 482–492. [Google Scholar] [CrossRef]
  35. McKenzie, C.R. Hypothesis testing and evaluation. In Blackwell Handbook of Judgment and Decision Making; Wiley-Blackwell: Hoboken, NJ, USA, 2004; pp. 200–219. Available online: https://www.researchgate.net/publication/239443778_Blackwell_Handbook_of_Judgment_and_Decision_Making (accessed on 1 April 2020).
  36. RobecoSAM, A.G. Dow Jones Sustainability World Index Guide; Sandp Dow Jones Indices: Zurich, Switzerland, 2013. [Google Scholar]
  37. Keller, K.L. Conceptualizing, measuring, and managing customer-based brand equity. J. Mark. 1993, 57, 1–22. [Google Scholar] [CrossRef]
  38. Rust, R.T.; Danaher, P.J.; Varki, S. Using service quality data for competitive marketing decisions. Int. J. Serv. Ind. Manag. 2000, 11, 438–469. [Google Scholar] [CrossRef]
  39. Fathabadi, H.; Nejad, M.R.O.; Alizadeh, H. An investigation of the factors affecting tourism destination brand equity. Asian J. Soc. Sci. Humanit. 2017, 6, 101–113. [Google Scholar]
  40. Leone, R.P.; Rao, V.R.; Keller, K.L.; Luo, A.M.; McAlister, L.; Srivastava, R. Linking brand equity to customer equity. J. Serv. Res. 2006, 9, 125–138. [Google Scholar] [CrossRef] [Green Version]
  41. Wang, H.M.D.; Sengupta, S. Stakeholder relationships, brand equity, firm performance: A resource-based perspective. J. Bus. Res. 2016, 69, 5561–5568. [Google Scholar] [CrossRef]
  42. Veloutsou, C.; Christodoulides, G.; de Chernatony, L. A taxonomy of measures for consumer-based brand equity: Drawing on the views of managers in Europe. J. Prod. Brand Manag. 2013, 22, 238–248. [Google Scholar] [CrossRef]
  43. Davcik, N.S.; Vinhas da Silva, R.; Hair, J.F. Towards a unified theory of brand equity: Conceptualizations, taxonomy and avenues for future research. J. Prod. Brand Manag. 2015, 24, 3–17. [Google Scholar] [CrossRef] [Green Version]
  44. Ailawadi, K.L.; Lehmann, D.R.; Neslin, S.A. Revenue premium as an outcome measure of brand equity. J. Mark. 2003, 67, 1–17. [Google Scholar] [CrossRef]
  45. Aaker, D.A.; Biel, A.L. Brand Equity and Advertising: Advertising’s Role in Building Strong Brands; Psychology Press: New York, NY, USA, 2013. [Google Scholar]
  46. Marshall, G.W.; Johnston, M.W. Marketing Management, 2nd ed.; McGraw-Hill Education: New York, NY, USA, 2015. [Google Scholar]
  47. OECD; Eurostat. Oslo Manual: Guidelines for Collecting and Interpreting Innovation Data; OECD: Paris, France, 2005; Available online: https://www.oecd-ilibrary.org/docserver/9789264013100-en.pdf?expires=1586229262&id=id&accname=guest&checksum=4E90B7ADB5EA189BB4A044ADC160FFB0 (accessed on 1 April 2020).
  48. Agarwal, S.; Erramilli, M.K.; Dev, C.S. Market orientation and performance in service firms: Role of innovation. J. Serv. Mark. 2003, 17, 68–82. [Google Scholar] [CrossRef]
  49. Slater, S.F.; Narver, J.C. Market orientation and the learning organization. J. Mark. 1995, 59, 63–74. [Google Scholar] [CrossRef]
  50. Camisón, C.; Villar-López, A. Non-technical innovation: Organizational memory and learning capabilities as antecedent factors with effects on sustained competitive advantage. Ind. Mark. Manag. 2011, 40, 1294–1304. [Google Scholar] [CrossRef]
  51. Porter, M.E. Competitive Advantage: Creating and Sustaining Superior Performance; FreePress: New York, NY, USA, 1985. [Google Scholar]
  52. Javanmard, H.; Hasani, H. The Impact of Market Orientation Indices, Marketing Innovation, and Competitive Advantages on the Business Performance in Distributer Enterprises. Int. J. Ind. Distrib. Bus. 2017, 8, 23–31. [Google Scholar] [CrossRef]
  53. Tolba, A.H.; Hassan, S.S. Linking customer-based brand equity with brand market performance: A managerial approach. J. Prod. Brand Manag. 2009, 18, 356–366. [Google Scholar] [CrossRef]
  54. Shamma, H.M.; Hassan, S.S. Customer and non-customer perspectives for examining corporate reputation. J. Prod. Brand Manag. 2009, 18, 326–337. [Google Scholar] [CrossRef]
  55. Wang, D.H.M.; Chen, P.H.; Yu, T.H.K.; Hsiao, C.Y. The effects of corporate social responsibility on brand equity and firm performance. J. Bus. Res. 2015, 68, 2232–2236. [Google Scholar] [CrossRef]
  56. Maine, E.; Lubik, S.; Garnsey, E. Process-based vs. product-based innovation: Value creation by nanotech ventures. Technovation 2012, 32, 179–192. [Google Scholar] [CrossRef]
  57. Geldes, C.; Felzensztein, C. Marketing innovations in the agribusiness sector. Acad. Rev. Latinoam. De Adm. 2013, 26, 108–138. [Google Scholar] [CrossRef]
  58. Buesa, M.; Heijs, J.; Baumert, T. The determinants of regional innovation in Europe: A combined factorial and regression knowledge production function approach. Res. Policy 2010, 39, 722–735. [Google Scholar] [CrossRef]
  59. Christmann, P. Effects of “best practices” of environmental management on cost advantage: The role of complementary assets. Acad. Manag. J. 2000, 43, 663–680. [Google Scholar]
  60. Acar, A.Z.; Acar, P. The effects of organizational culture and innovativeness on business performance in healthcare industry. Procedia Soc. Behav. Sci. 2012, 58, 683–692. [Google Scholar] [CrossRef] [Green Version]
  61. Rosenbusch, N.; Brinckmann, J.; Bausch, A. Is innovation always beneficial? A meta-analysis of the relationship between innovation and performance in SMEs. J. Bus. Ventur. 2011, 26, 441–457. [Google Scholar] [CrossRef] [Green Version]
  62. Naidoo, V. Firm survival through a crisis: The influence of market orientation, marketing innovation and business strategy. Ind. Mark. Manag. 2010, 39, 1311–1320. [Google Scholar] [CrossRef]
  63. Kotler, P.; Keller, K.L. Dirección de Marketing; Pearson Educación: London, UK, 2013. [Google Scholar]
  64. Barney, J.; Hesterly, W. Strategic Management and Competitive Advantage: Concepts and Cases, 4th ed.; Pearson: Upper Saddle River, NJ, USA, 2012. [Google Scholar]
  65. Aaker, D. Aaker on Branding: 20 Principles that Drive Success; Morgan James Publishing: New York, NY, USA, 2014. [Google Scholar]
  66. Aksoy, H. How do innovation culture, marketing innovation and product innovation affect the market performance of small and medium-sized enterprises (SMEs). Technol. Soc. 2017, 51, 133–141. [Google Scholar] [CrossRef]
  67. Narver, J.C.; Slater, S.F. The effect of a market orientation on business profitability. J. Mark. 1990, 54, 20–35. [Google Scholar] [CrossRef]
  68. Gupta, S.; Malhotra, N.K.; Czinkota, M.; Foroudi, P. Marketing innovation: A consequence of competitiveness. J. Bus. Res. 2016, 69, 5671–5681. [Google Scholar] [CrossRef] [Green Version]
  69. Majeed, S. The Impact of Competitive Advantage on Organizational Performance. Eur. J. Bus. Manag. 2011, 3, 4. [Google Scholar]
  70. Kaleka, A.; Morgan, N.A. Which Competitive Advantage(s)? Competitive Advantage–Market Performance Relationships in International Markets. J. Int. Mark. 2017, 25, 25–49. [Google Scholar] [CrossRef]
  71. Boateng, K.A.; Owusu, O.O. Mobile number portability: On the switching trends among subscribers within the telecommunication industry in a Ghanaian city. Commun. Iima 2013, 13, 6. [Google Scholar]
  72. Silverman, D. Doing Qualitative Research: A Practical Handbook; SAGE Publications Limited: London, UK, 2013. [Google Scholar]
  73. Sekaran, U.; Bougie, R. Research Methods for Business: A Skill Building Approach; John Wiley and Sons: Hague, The Netherlands, 2016. [Google Scholar]
  74. Saunders, M.; Lewis, P.; Thornhill, A. Research Methods for Business Students; Financial Times/Prentice Hall: Harlow, UK, 2009. [Google Scholar]
  75. Lavrakas, P.J. Encyclopedia of Survey Research Methods; Sage Publications: Thousand Oaks, CA, USA, 2008. [Google Scholar]
  76. Ko, E.; Kim, E.Y.; Lee, E.K. Modeling consumer adoption of mobile shopping for fashion products in Korea. Psychol. Mark. 2009, 26, 669–687. [Google Scholar] [CrossRef]
  77. Bryman, A.; Bell, E. Business Research Methods; Bell & Bain Ltd.: Glasgow, UK, 2015. [Google Scholar]
  78. Zarmpou, T.; Saprikis, V.; Markos, A.; Vlachopoulou, M. Modeling users’ acceptance of mobile services. Electron. Commer. Res. 2012, 12, 225–248. [Google Scholar] [CrossRef]
  79. Saunders, M.; Lewis, P.; Thornhill, A. Research Methods for Business Students. 1996; Pitman: London, UK, 2012. [Google Scholar]
  80. Tharenou, P.; Donohue, R.; Cooper, B. Management Research Methods; Cambridge University Press: Melbourne, Australia, 2007. [Google Scholar]
  81. Akbayrak, B. A comparıson of two data collectıng methods: Interview and questıonnaıres. Hacet. Üniversitesi Eğitim Fakültesi Derg. 2000, 18, 1–10. [Google Scholar]
  82. Yang, K.C. Exploring factors affecting the adoption of mobile commerce in Singapore. Telemat. Inform. 2005, 22, 257–277. [Google Scholar] [CrossRef]
  83. Regan, N.; Carlson, J.; Rosenberger, P.J., III. Factors affecting group-oriented travel intention to major events. J. Travel Tour. Mark. 2012, 29, 185–204. [Google Scholar] [CrossRef]
  84. Randall, D.M.; Gibson, A.M. Methodology in business ethics research: A review and critical assessment. J. Bus. Ethics 1990, 9, 457–471. [Google Scholar] [CrossRef]
  85. Guadagnoli, E.; Velicer, W.F. Relation to sample size to the stability of component patterns. Psychol. Bull. 1988, 103, 265–275. [Google Scholar] [CrossRef]
  86. Hair, J.F., Jr.; Black, W.C.; Babin, B.J.; Anderson, R.E.; Tatham, R.L. SEM: An introduction. In Multivariate Data Analysis: A Global Perspective, 7th ed.; Prentice Hall: Upper Saddle River, NJ, USA, 2010; pp. 629–686. [Google Scholar]
  87. Field, A. Discovering Statistics Using SPSS, 2nd ed.; Sage Publications: London, UK, 2009. [Google Scholar]
  88. Hinkin, T.R. A review of scale development practices in the study of organizations. J. Manag. 1995, 21, 967–988. [Google Scholar] [CrossRef]
  89. Bryman, A. Research Methods in the Study of Leadership; Bell & Bain Ltd.: Glasgow, UK, 2011. [Google Scholar]
  90. Kline, R.B. Principles and Practice of Structural Equation Modeling, 4th ed.; Guilford publications: New York, NY, USA, 2015. [Google Scholar]
  91. Comrey, A.; Lee, H. A First Course in Factor Analysis; Lawrence Eribaum Associates: Hillsdale, NJ, USA, 1992. [Google Scholar]
  92. Tanaka, J.S. “How big is big enough?”: Sample size and goodness of fit in structural equation models with latent variables. Child Dev. 1987, 58, 134–146. [Google Scholar] [CrossRef]
  93. Anderson, J.C.; Gerbing, D.W. Some methods for respecifying measurement models to obtain unidimensional construct measurement. J. Mark. Res. 1982, 19, 453–460. [Google Scholar] [CrossRef]
  94. Kline, R. Principles and Practice of Structural Equation Modeling: A Very Readable Introduction to the Subject, with Good Coverage of Assumptions and SEM’s Relation to Underlying Regression, Factor, and other Techniques; Guilford Press: New York, NY, USA, 1998. [Google Scholar]
  95. Zait, A.; Bertea, P.E. Financial literacy–Conceptual definition and proposed approach for a measurement instrument. J. Account. Manag. 2015, 4, 37–42. [Google Scholar]
  96. Williams, P.; Naumann, E. Customer satisfaction and business performance: A firm-level analysis. J. Serv. Mark. 2011, 25, 20–32. [Google Scholar] [CrossRef]
  97. Aaker, D.A. Managing Brand Equity; The Free Press: New York, NY, USA, 1991. [Google Scholar]
  98. Keller, K.L. Strategic Brand Management: Building, Measuring, and Managing Brand Equity, 2nd ed.; Prentice Hall: Upper Saddle River, NJ, USA, 2003. [Google Scholar]
  99. Ambler, T. Marketing and the Bottom Line: The Marketing Metrics to Pump up Cash Flow; Pearson Education: Upper Saddle River, NJ, USA, 2003. [Google Scholar]
  100. Barney, J.B. Is the resource-based ‘view’ a useful perspective for strategic management research? Yes. Acad. Manag. Rev. 2001, 26, 41–56. [Google Scholar]
  101. Hitt, M.A.; Harrison, J.S. (Eds.) The Blackwell Handbook of Strategic Management; Blackwell Publishers: Oxford, UK, 2001. [Google Scholar]
Figure 1. Conceptual framework: sustainable brand equity and marketing innovation and market performance.
Sustainability 12 02939 g001
Figure 2. Path diagram for mediation 1.
Sustainability 12 02939 g002
Figure 3. Path diagram for mediation 2.
Sustainability 12 02939 g003
Table 1. Cronbach’s alpha extracted values of the measurement scale.
Brand Equity40.762
Marketing Innovation40.788
Sustainable Competitive Advantage60.756
Market Performance40.789
Table 2. Standardized regression weights for constructs.
VariablesEstimatesp-Value
BE_9BE0.5850.000
BE_10BE0.6980.000
BE_11BE0.7070.000
BE_12BE0.6780.000
MI_13MI0.7250.000
MI_14MI0.7290.000
MI_15MI0.6950.000
MI_16MI0.7190.000
SCA_21SCA0.4090.000
SCA_22SCA0.5730.000
SCA_23SCA0.6760.000
SCA_24SCA0.6620.000
SCA_25SCA0.6520.000
SCA_26SCA0.6670.000
MP_33MP0.5730.000
MP_34MP0.6550.000
MP_35MP0.8120.000
MP_36MP0.7500.000
Note: BE= brand equity, MI = marketing innovation, SCA = sustainable competitive advantage, MP = market performance.
Table 3. Model fit summary for the measurement model.
Fit IndicesRecommended ValuesResults
χ2/df< 32.127
GFI (goodness of fit index)> 0.90.924
AGFI (adjusted goodness fit ofindex)> 0.800.895
RMSEA (root mean square error of approximation)< 0.080.067
RMR (root mean square residual)< 0.080.039
NFI (normed fit index)> 0.900.881
CFI (comparative fit index)> 0.800.932
PCLOSE >0.05 0.278> 0.050.132
Table 4. Standard regression weights for the structural equation model.
Path of Variables EstimateS.E.C.R.p-Value
SCABE0.4700.05010.0570.000
SCAMI–6650–04016–8980–000
MPBE0.3410.0446.8340.000
MPMI0–6360–03415–5360–000
MPSCA0–5590–04011–6230–000
Table 5. Inferences for mediation.
HypothesisDirect Beta w/o MedDirect Beta w/MedIndirect BetaMediation Type Observed
1 BE–SCA -MPβa = 0.341, p = 0.000βb = 0.078, p = 0.132βc = 0.263, p = 0.001Full mediation
2 MI–SCA - MPβa = 0.636, p = 0.000βb = 0.430, p = 0.001βc = 0.206, p = 0.001partial mediation

