Article

Lifespan Prediction Technique for Digital Twin-Based Noise Barrier Tunnels

1
Department of Convergence Engineering for Future City, Sungkyunkwan University, Suwon 16419, Korea
2
Department of Architecture, Sungkyunkwan University, Suwon 16419, Korea
*
Author to whom correspondence should be addressed.
Sustainability 2020, 12(7), 2940; https://doi.org/10.3390/su12072940
Submission received: 22 February 2020 / Revised: 2 April 2020 / Accepted: 3 April 2020 / Published: 7 April 2020

Abstract

:
Noise barrier tunnels (NBTs) comprise prefabricated components that are easily replaceable, reusable, and have the capacity to improve performance when applied to components as their replacements. Reusing NBTs is more price competitive and environmentally friendly than producing new components. However, determining the remaining life of components before they need to be dismantled, using existing NBTs and their maintenance methods, is a considerable challenge. Therefore, this study used a prototype of the digital twin of an NBT to predict the condition and life of tunnel components using numerical behavior analyses. The prototype of the digital twin used in this study could be used to analyze behaviors using a gyro sensor, thereby enabling life analyses. Girders are structural components that have shorter life expectancies than components close to the ground. Component analysis results indicated that our proposed method confirmed changes in the life of girders and column components. Moreover, a negligible change in the life of the purlin component was confirmed. Life cycles management using digital twins can help reduce NBT installation costs, facilitate resource recycling, and make the installation process eco-friendly as they can aid in identifying components that require replacements in the initial designing stage and establish a procurement plan.

1. Introduction

1.1. Backgrounds and Goals

A noise barrier tunnel (NBT) is a typical road facility that consists of an assembly involving various prefabricated components. In general, NBTs are installed on major roads, highways, and railways near residential areas to improve the noise barrier performance of residential areas against noise sources [1]. In recent years, owing to increasing population concentration in cities, governments have focused on continuously developing cities. However, noise from main roads across these cities affects the site, and residents of the site need appropriate measures to prevent such noise [2]. This need has led to the rapid increase in the construction of NBTs in the last 20 years and in their implementation in urban areas. Further, there has been a significant improvement in the noise barrier performance and structural stability of NBTs, and further improvements are increasingly desired.
To cope with these needs of the market, there has been an increase in the research and development of NBTs that are extended from traditional NBTs functionally [3,4,5]. Studies are being conducted to utilize NBTs as product platforms actively. A product platform refers to products and related products that share standard functionality, common components, and subsystems [6]. Components comprising an NBT can be used as product platforms because they are modular subcomponents that can be obtained via prefabrication production systems. An NBT based on the product platform can improve the performance of existing NBTs continuously through replacement and addition of components constituting an NBT. Further, NBTs can improve sustainability by replacing components that are damaged or near the end of the lifespan. Therefore, NBTs need to be analyzed in real time during the operational stage, and for this analysis, the state of the component unit is assumed to be identified. Thus, performance and condition analyses techniques are required in the operation stage of NBTs.
The use of a digital twin is an approach used to identify the current state of an NBT [7]. A digital twin is a representation of a real object in a digital and virtual space [8]. This digital version of the object can be used during the operational phase of an NBT to analyze the status of the components in real time. Because such digital twins are a digital version of the NBTs, they are always interoperable [9]. Therefore, the digital twin of an NBT can be used for recording and analyzing the state history of the NBT, from a past point in time to the present point in time. Further, the state history of the NBT can be used to analyze the performance of the NBT in real time and predict its performance in the future.
In this study, the use of digital twins during the operational stage of NBTs was assumed to increase sustainability. This is because the use of digital twins can assist in making decisions regarding the lifespan, thereby enhancing sustainability. In general, digital twins are used at the operational stage. Hence, state information obtained through these digital twins can be used for component reuse to increase sustainability. Therefore, the results of this study verify that the use of digital twins for the condition analyses of NBTs can help determine the status of components, measure lifespans, and clarify methods to increase sustainability.

1.2. Scope and Methodology

This study proposes and verifies a digital twin-based operation method that can analyze the condition of components and predict their lifespans to increase the sustainability of NBTs. Therefore, it is necessary to first implement a digital twin of the NBT. The implementation is based on the concept of digital twins, parametric, and generative design technology. The NBT digital twins produce raw data related to physical phenomena (e.g., vibration, stress, and displacement) during the operation phase and convert it into information for state analysis. Status analysis information (i.e., history information) is accumulated over time and can be used to predict the life of the component. The history information used in the state analysis can help improve the sustainability of the NBT. Therefore, the NBT digital twin can help analyze the state of the NBT and predict its lifetime.
The lifespan of a soundproof tunnel mentioned in this study indicates the structural lifespan of a soundproof tunnel based on physical movement, and it does not refer to the acoustic life of a soundproof tunnel. Further, for safety and legal reasons, the NBT digital twin experiments use scale models and not actual soundproof tunnels. Information about the physical phenomena and materials is applied to the scale model in proportion. Factors, such as temperature, affecting the lifespan of soundproof tunnels are limited to physical movements, and this study does not consider the change in structural stiffness caused by temperature because it is difficult to analyze and convert digital temperature data. The state analysis method analyzes sensor information caused by physical phenomena using the structural analysis tool, and the life prediction method is based on the numerical analysis performed using the proposed model.
The remainder of this paper is organized as follows. Section 2 presents the concepts and definitions associated with the reuse of digital twins and components. Section 3 discusses the implementation of the digital twin, the state analysis method employing digital twins, and the life analysis method based on the state analysis. Section 4 outlines the implementation of digital twins for the lifespan analysis, and the experiment conducted reflecting real data of the digital twin. At the end of the section, the impact of digital twins on sustainability is also discussed based on the experimental results. Finally, Section 5 summarizes the conclusions of this study.

2. Concept of Digital Twin and Component Reuse

2.1. Digital Twin

Grieves proposed the first digital twin concept in 2002 as an ideal conceptual model for product life cycle management (PLM) [7]. In his study, the conceptual model was a model comprising two systems—a physical system and a virtual system—including all information regarding the physical system [7]. In 2010, Piascik et al. [10] used NASA’s three components: A physical product, digital or virtual product, and connection of two products, defined as a concept. Lee et al. [11] defined it as a combined model that simulates a real machine and its state. However, Bacchiega [9] defined it as a digital copy of the physical system, and Tao et al. [12] used physical, virtual, and interaction data to define all components of the product lifecycle as a realistic model. Before 2016, digital twins were defined as including both physical and virtual data as well as the connections between them [7]. Since 2017, the concept of the digital twin has converged and been subdivided into the concept of integrated data that exists digitally. After Grieves and Vickers redefined digital twins in 2002 [7] and 2010 [10], respectively, they were redefined as a set of virtual information constructs that perfectly describe real physical manufacturing products in 2016. Therefore, the digital twin used in this study is based on the definitions of Kahlen et al. [13]. In other words, according to a previous study [10], a digital twin is a digital version of a physical twin and refers to the total sum of information generated from the interworking of digital physics rather than being a simple digital representation (Figure 1).
A digital twin can be used as a model for maintaining and managing actual objects through the virtual environment at the operation stage of the construction field [14]. Therefore, it is possible to observe materialized objects and analyze their status through a digital environment in addition to maintaining and manipulating them. Further, it is possible to optimize the operation by securing data such as detailed movement of structural components and user behavior information. The optimization operation executed through the learning process and prediction can further derive the optimal model of a building design and improve performance through processes such as remodeling and reconstruction. Recently, in addition to buildings, digital twins have been used as operational models in process-oriented industries such as smart factories and power plants.

2.2. Concept of Component Reuse

The reuse of steel structural components can be classified into three categories: Remanufacturing, refurbishing, and recycling. Remanufacturing is performed after dismantling a component. Refurbishing refers to reusing a part through simple maintenance, without reworking and production, after dismantling a part, and recycling refers to reusing the part, albeit as a different metal part. Therefore, the cost and environmental load incurred depends on the recycling method of structural steel components [15]. Reuse, besides the concept of refurbishing, refers to refurbishing because NBTs need to analyze information in order to determine the lifespan of the components of NBT.
Table 1 presents examples of reuse for metal parts similar to NBTs. The majority of these cases are designed considering reuse. Even though reuse occurs, an analysis of the reusability of each component and the performance at the time of the dismantling is not conducted. This is because (i) a service life of 100 years or more is guaranteed owing to the characteristics of the steel structure and refurbishing is generally employed when reusing steel structures less than 100 years old, (ii) it is assumed that there is no objective information for analyzing the state in the absence unit such that every abnormality can be confirmed visually. Therefore, in the absence of a visible abnormality, refurbishing is employed. Contrarily, when an abnormality is observed, destruction or recycling is employed.

3. Life Analysis of Digital-Twin-Based NBT Components

3.1. Implementation of the Digital Twin

To implement the digital twin of an NBT, the digital version of the actual object based on information on its physical attributes needs to be implemented. The configuration of a digital twin comprises a digital model and an actual object, and it refers to the aggregation of information generated by interworking with the digital model. Therefore, to implement the digital twin of an NBT, physical and digital models must be interlocked. The digital model of the NBT is a shape-generation script and comprises NBT shape-generation, component shape-generation, and component mapping and layout modules. The physical model of the NBT is a digital model created using a 3D printer. To link the behavior of the physical model with the digital model, the motion of actual components is transmitted to the digital model through a sensor. The completed digital twin generates raw data according to the behavior of the physical model, and this date can be processed into quantitative life data in the life prediction model.
To analyze the life of a component through a physical model of the NBT and the digital version of the twin, it is necessary to simulate the life cycle of the actual NBT. However, it is impossible to analyze the life cycle of an NBT economically in real time. However, in the case of limitations to the experiment for measuring the state and life of the components, the NBT reduction model can be used to verify the scenario. Hence, this study assumes the NBT physical model as a reduction model. The physics model referred to in this paper, thus, pertains to a reduced model of an NBT. The NBT reduction model is structurally identical to the actual NBT and can be used for behavioral analyses because the behavior of components is similar. However, errors in the structural stiffness and material properties resulting from scale differences should be reflected.
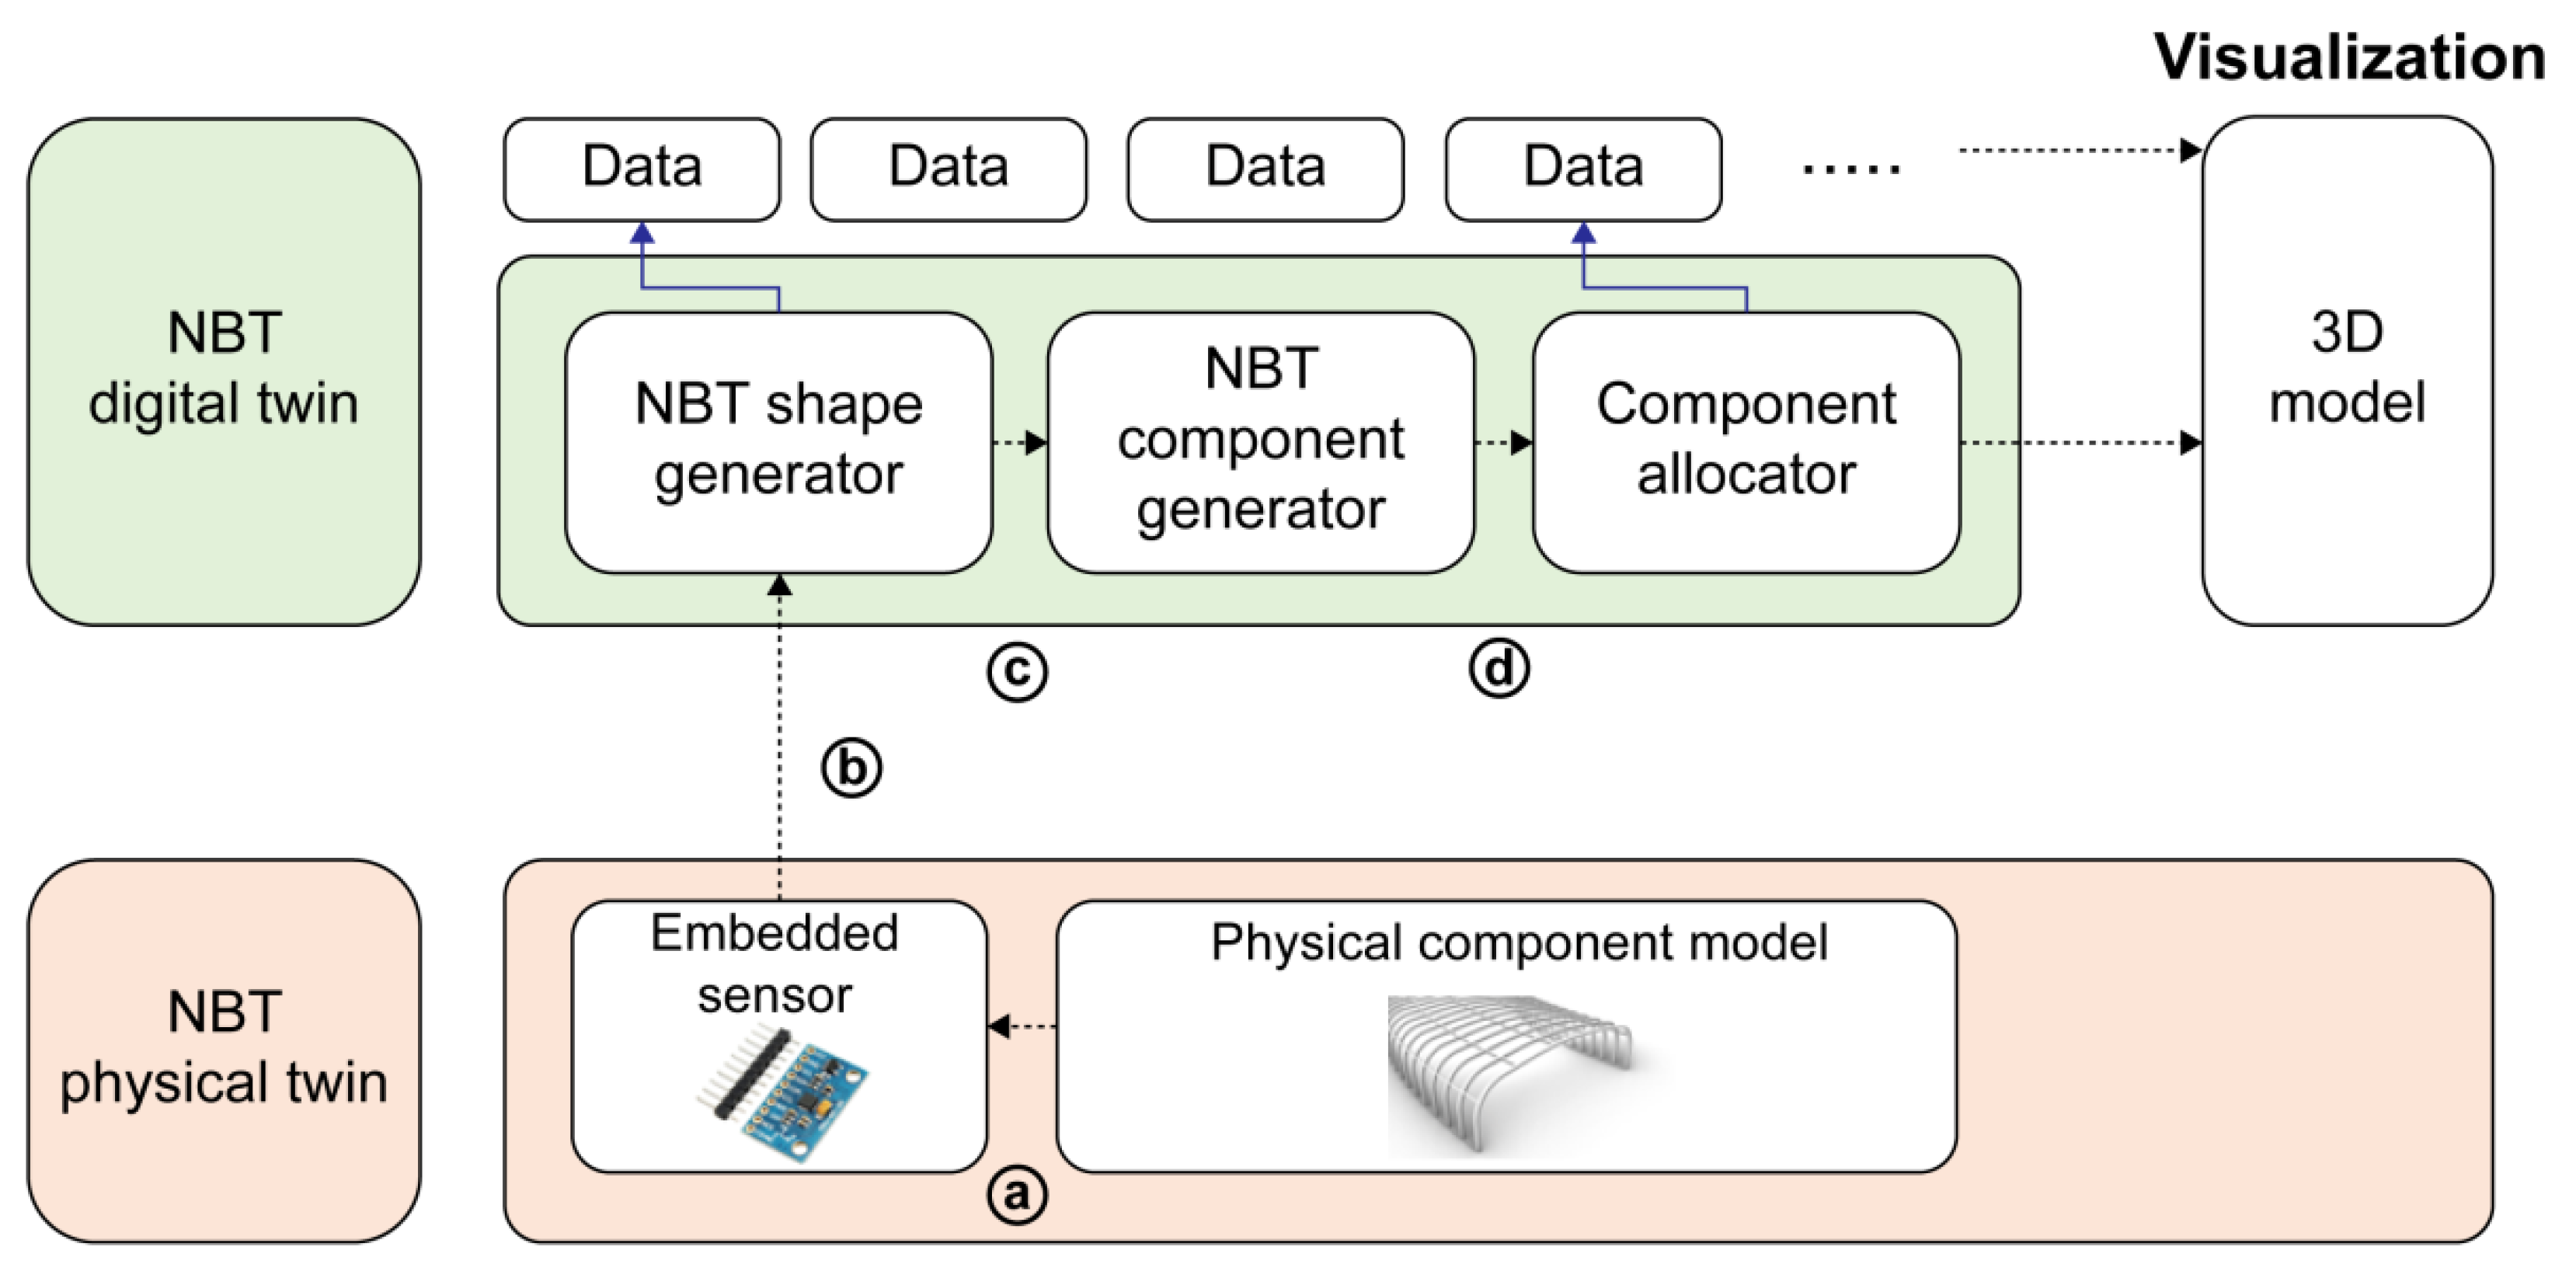
As shown in Figure 2, the information generated in the NBT is converted into digital information through the sensor. In process ⓐ, the sensor accepts information generated by the physical twin. It is a process of converting physical phenomena into digital information. In step ⓑ, the information generated in step ⓐ is transmitted to the digital twin. Through the above process, the physical phenomenon can be expressed in the digital world, and it acts as a digital twin.

3.2. Status Analysis Method for NBT

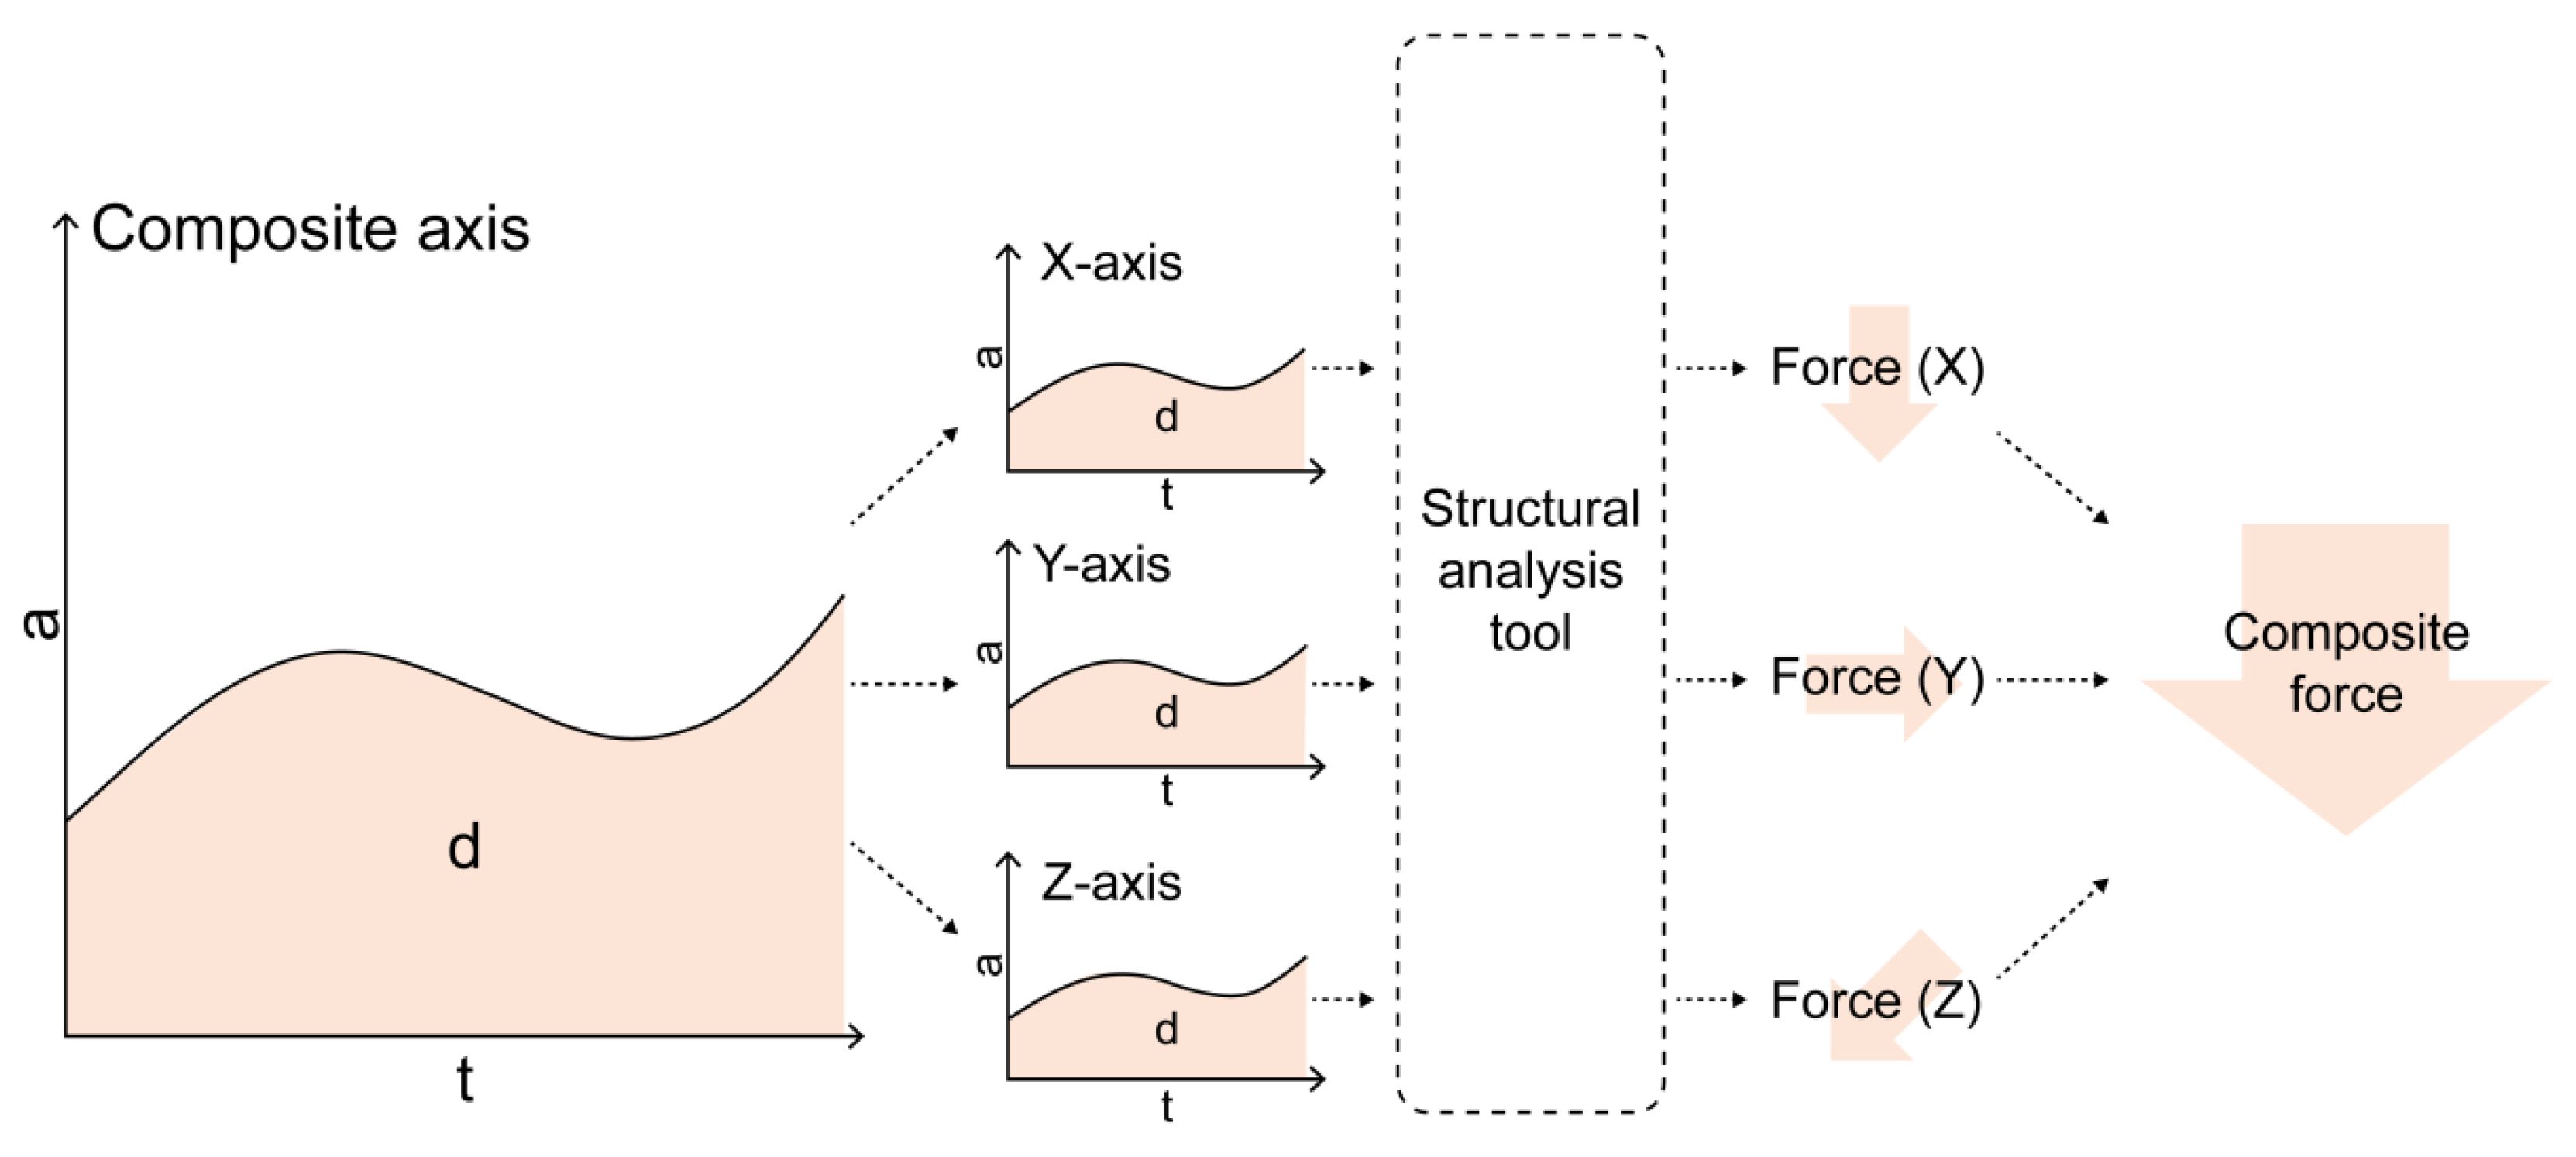
The information reflected in the digital twin is usually in the form of raw information. As shown in Figure 3, step ⓑ includes the raw information of the physical phenomenon that occurred in step ⓐ. Processing raw data is necessary to analyze the conditions based on physical phenomena. The type of state that can be analyzed depends on the type of source information and how it is processed. For example, when the gyro sensor is installed in the physical model of the NBT, physical movement of the NBT can be confirmed. To analyze only the state of the temperature inside the component, it is necessary to install a sensor that can obtain raw data on temperature and subsequently convert the raw information from the sensor into state information that suits the purpose. As this study aims to analyze the condition for life prediction based on a digital twin, a method for deriving indicators related to life prediction is required.
As shown in Figure 3, displacement (d) can be measured using the relationship between acceleration (a) and time (t) generated from the gyro sensor. Among the components of the NBT, those that play the role of a girder are composed of various joints. It is assumed that the physical behavior of the rigid joint component is the same, and thus, the component on which the gyro sensor is installed and the rigid joint are assumed to be the same component. As the girder experiences the largest displacement at the center point as compared to both ends of the girder, a gyro sensor is installed at the corresponding point, and d of the NBT component is measured. After inputting information on the material of the component and the cross-section of the component through the structural analysis tool, it is possible to derive the force (F) and the direction (V) that generate d. Through F and V applied to the component, it is possible to analyze the shape change (Ds) of the entire component.

3.3. Lifespan Analysis Method for NBT

Like the FEM or statistical methods, the life prediction method can obtain sophisticated data. However, to obtain real-time life information through the digital twin and life analysis model, we employed a relatively simple numerical model proposed by Jo [16]. In the numerical analysis model of crude illness [16], when the same load is applied regularly over the fatigue limit, the number of loads N until the time of fatigue cracking of the component can be obtained. Jo’s formula for predicting this lifespan [16] is shown in Formula (1) (Stress–strain curve in this paper), which is derived from Formula (2) (Stabilized cyclic stress–strain curve) [17] and Formula (3) (Modified cyclic stress–strain curve) [18].
  P m o d = ( σ a + k 1 × σ m ) × ( σ a E + ( σ a K ) 1 n ) × E
σ a = Amplitude of stress
E = Modulus of elasticity
σ m = Middle value of σ a
K = Cyclic hardening coefficient
If σ m 0 ,   k 1 = 1
n = Cyclic hardening exponent
If σ m < 0 ,   k 1 = 0
ε a = ε a , e l + ε a , p l = σ a E + ( σ a K ) 1 n
ε a , e l = Elastic strain amplitude
ε a , p l = Plastic strain amplitude
ε a = Amplitued of all strai
P m o d = ( σ k + k 1 × σ m ) × ε a × E
In the fatigue limit curve, when stress exceeds the fatigue limit, the life of the stress can be predicted by analyzing the amplitude of the stress over time. Therefore, for predicting the life span of the NBT, it is necessary to obtain the amplitude of the stress acting on this NBT. Further, the maximum, minimum, and median values of stress, in addition to the amplitude, can be obtained from the behavior of the steel structure. The numerical model can be used to derive the fatigue strength curve and fatigue limit based on the amplitude of stress. The lifetime can be predicted by substituting F in Formula (1).

3.4. Digital-Twin-Based NBT Component Life Analysis Technique

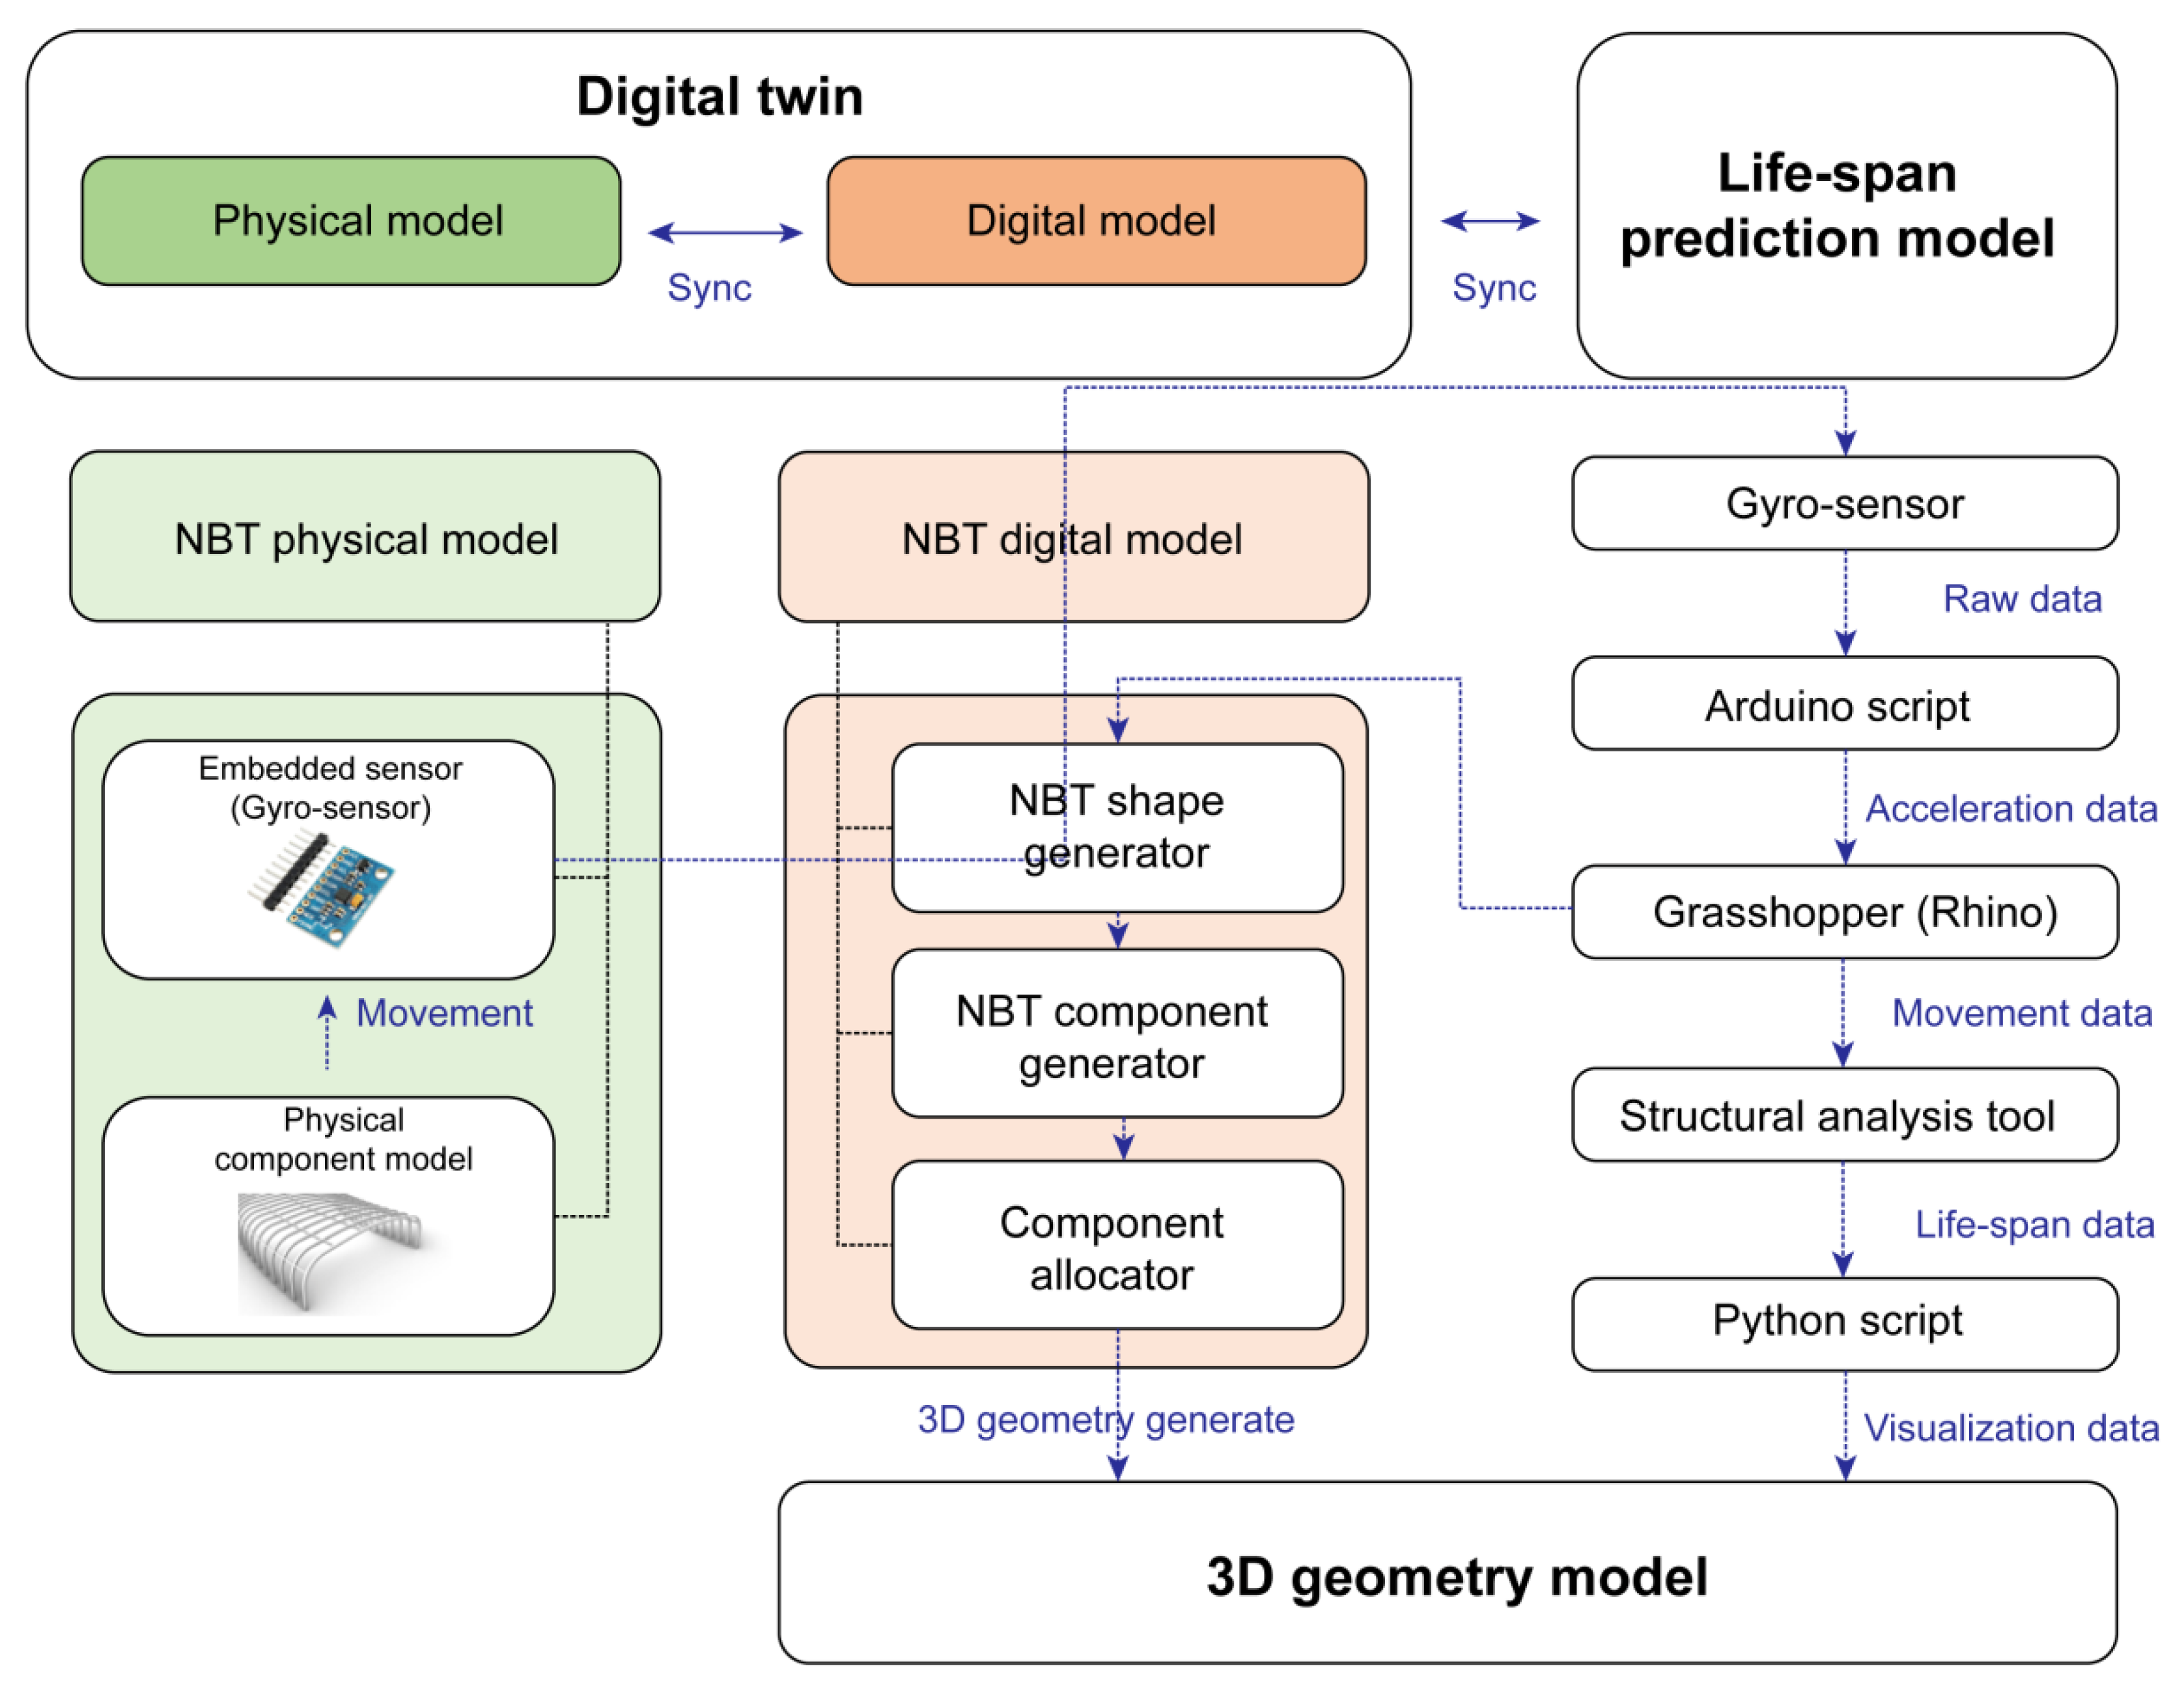
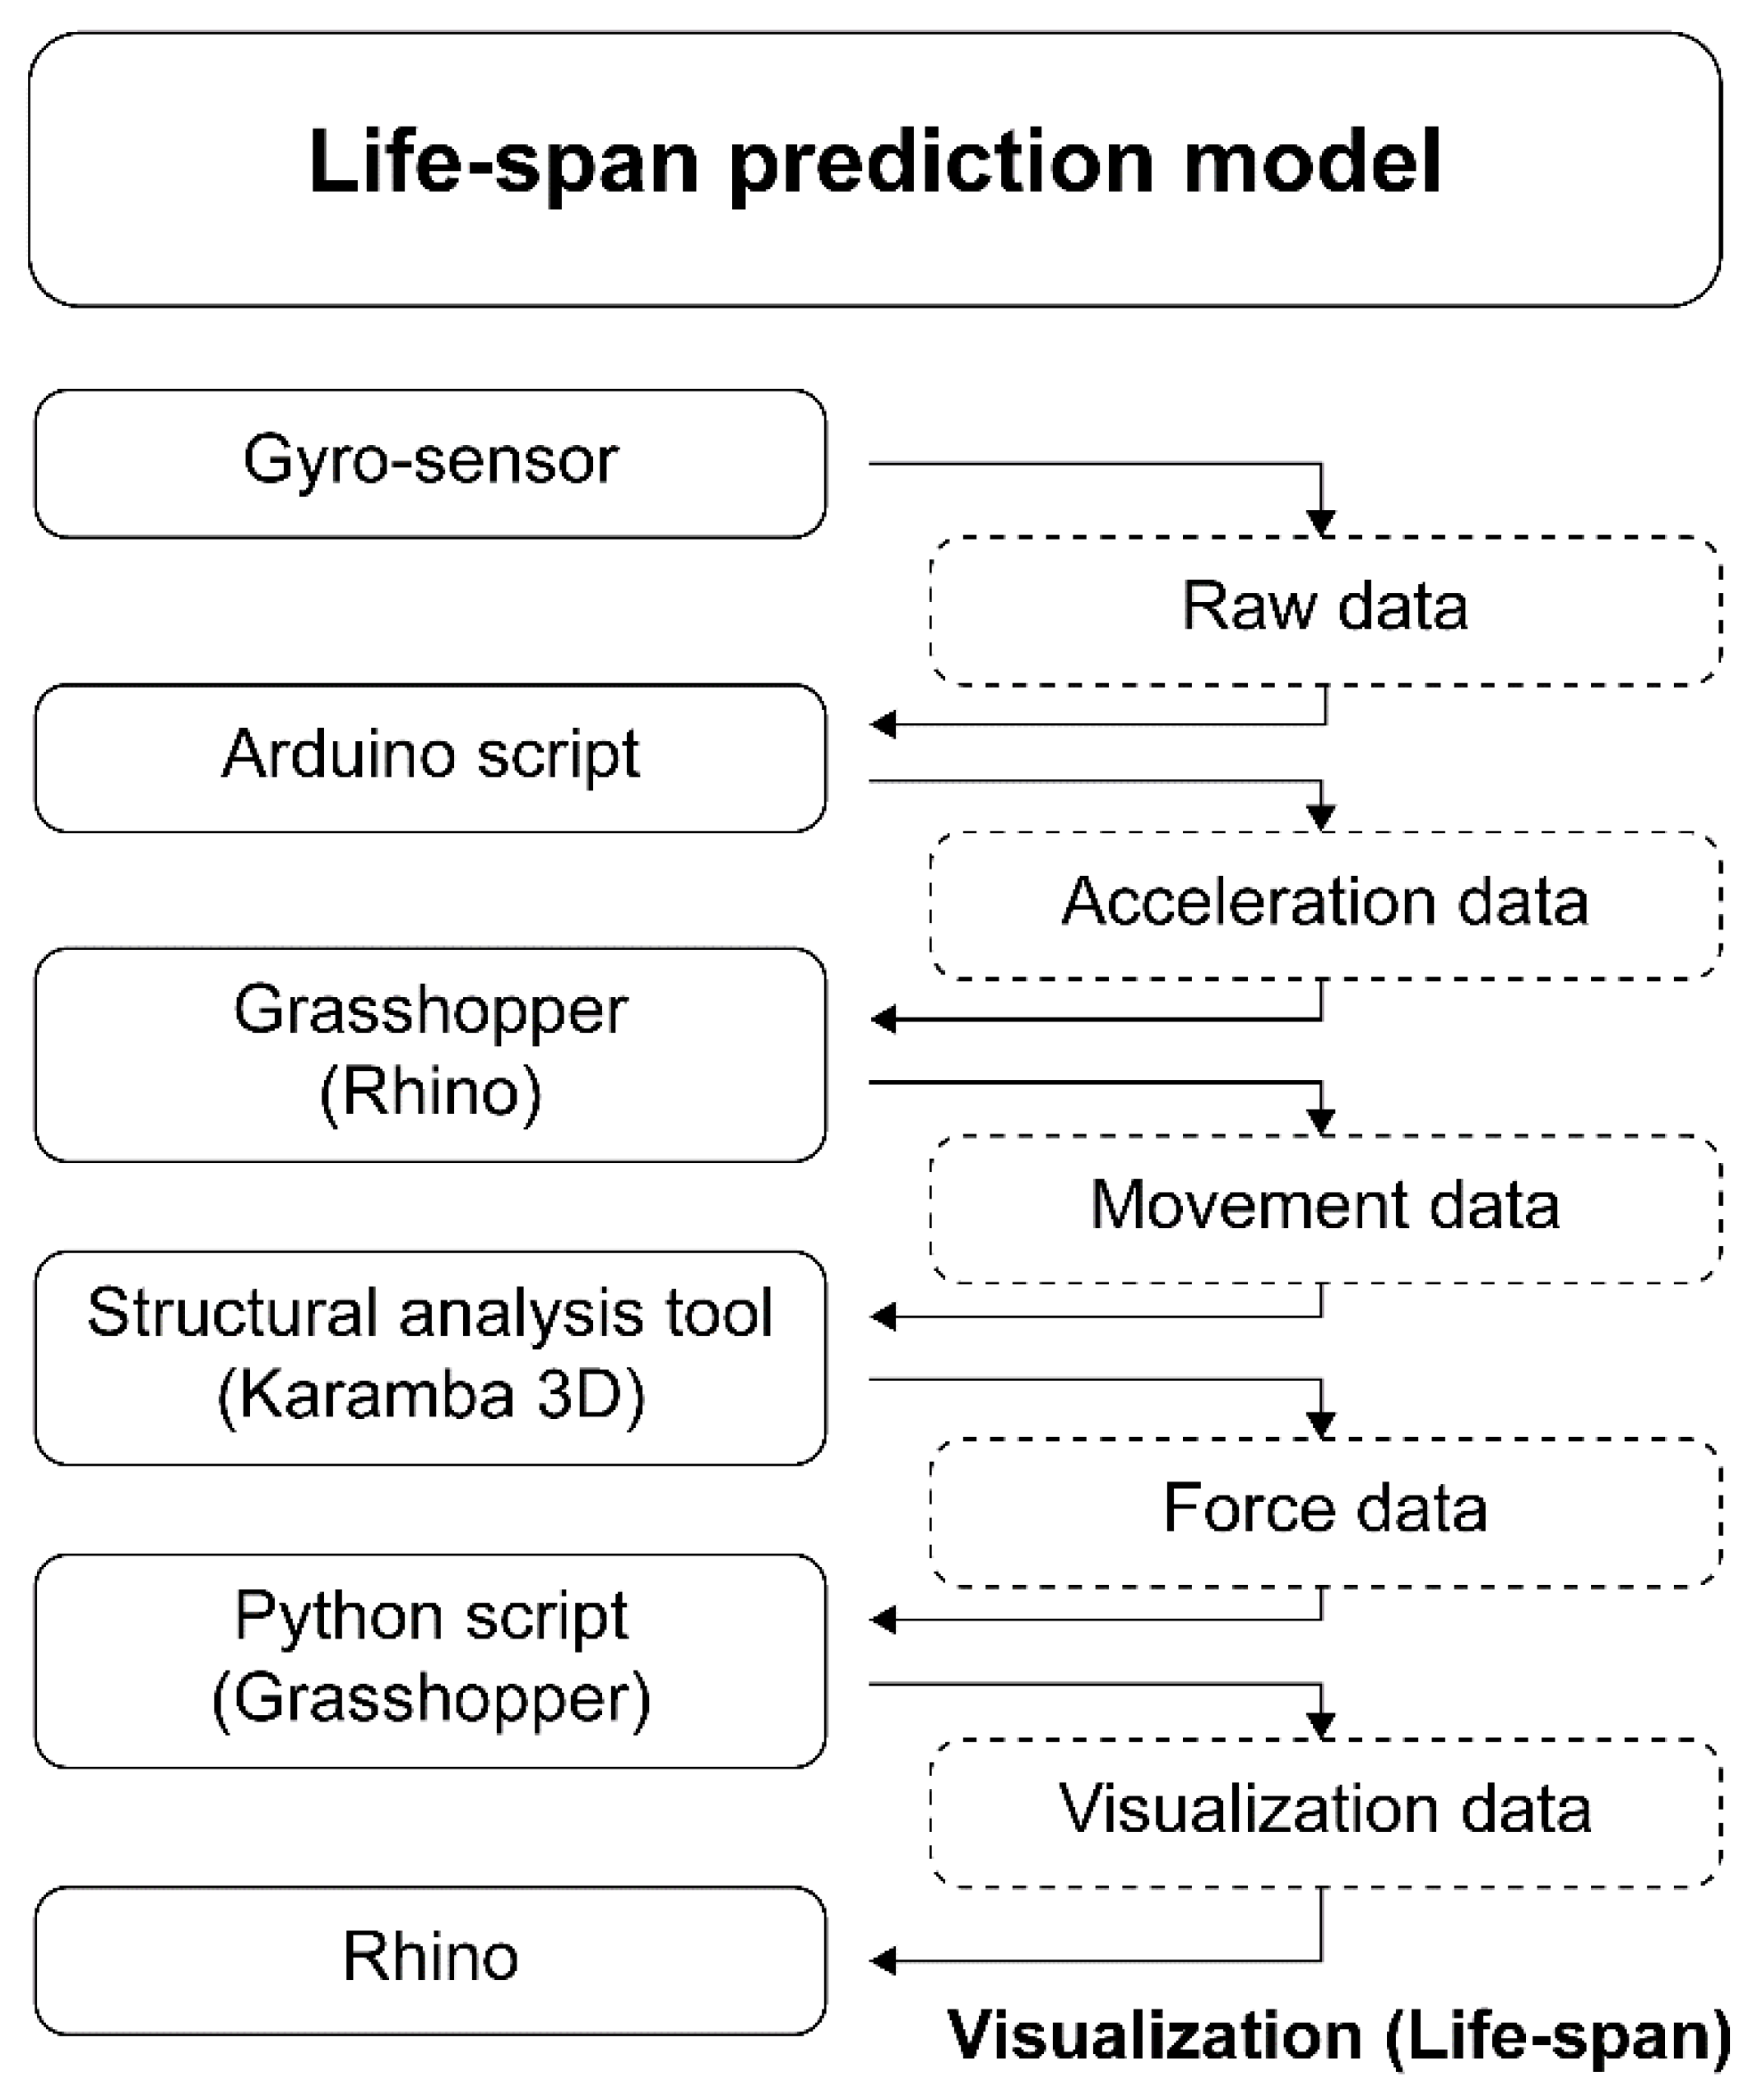
The digital-twin-based NBT component life prediction technique consists of a digital twin model and a life measurement model. The digital twin model can be divided into a physical model, which includes a gyro sensor and a digital model, which is a collection of shape-generation algorithms. The gyro sensor can be applied to physical components to analyze the changes in their behavior, and it can be reflected in the digital model to analyze the behavioral change in real time. The digital model based on the shape-generation algorithm can change the shape using the parameters, and therefore, it is possible to immediately reflect the displacement of the physical model in the digital model by applying the behavioral change generated by the gyro sensor as a parameter.
The life measurement model estimates the displacement based on the acceleration data generated by the gyro sensor (movement data). The load applied to the component can be obtained by inputting the displacement of the structure in the structural analysis tool. When this process is recorded in real time, the amplitude of the stress received by the NBT component can be analyzed. The amplitude of the stress can be used to derive the maximum, minimum, and median values of the stress, which can be analyzed using lifetime data through a numerical model (lifespan data). Lifespan data, which can be expressed as a quantitative figure, is visualized so that it can be applied to the process of reusing NBT components. The life expectancy of the NBT assumes that the estimated stress repetition number N is the estimated life when the physical model is subjected to stress exceeding the fatigue limit (prediction model) (Figure 4).

4. NBT Digital Twin Prototype Implementation

4.1. Generation of the NBT Digital Model

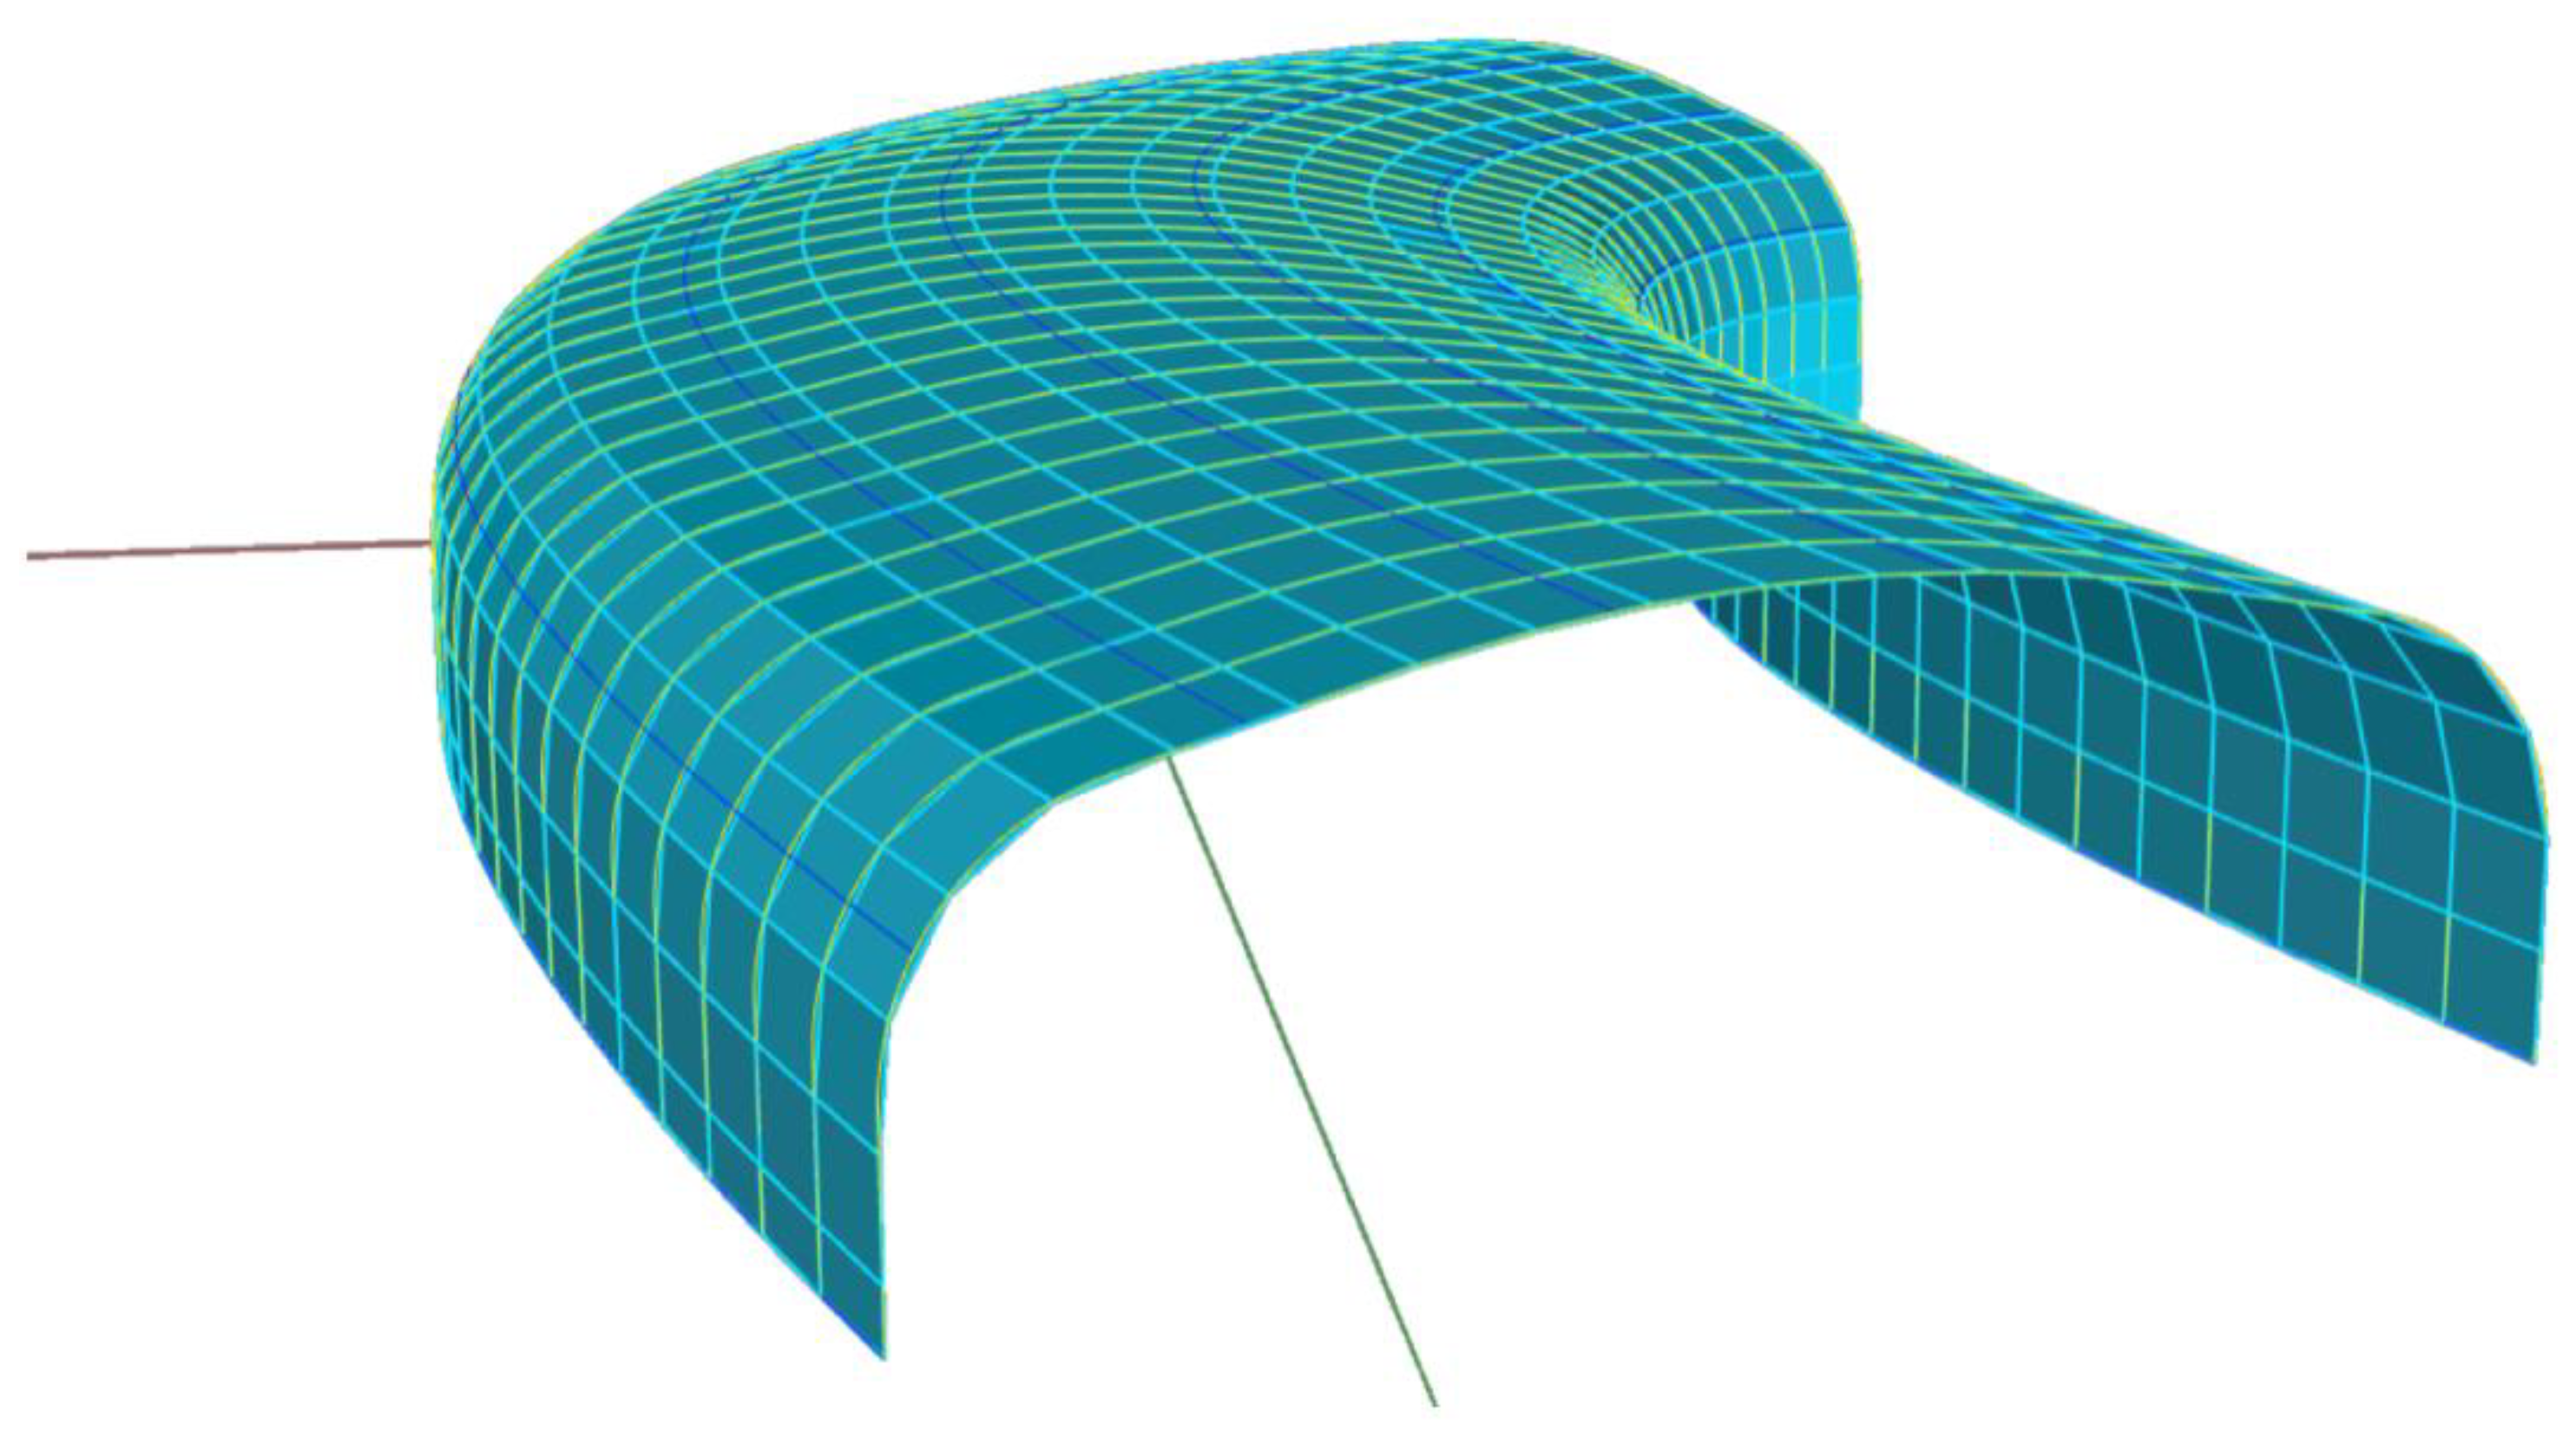
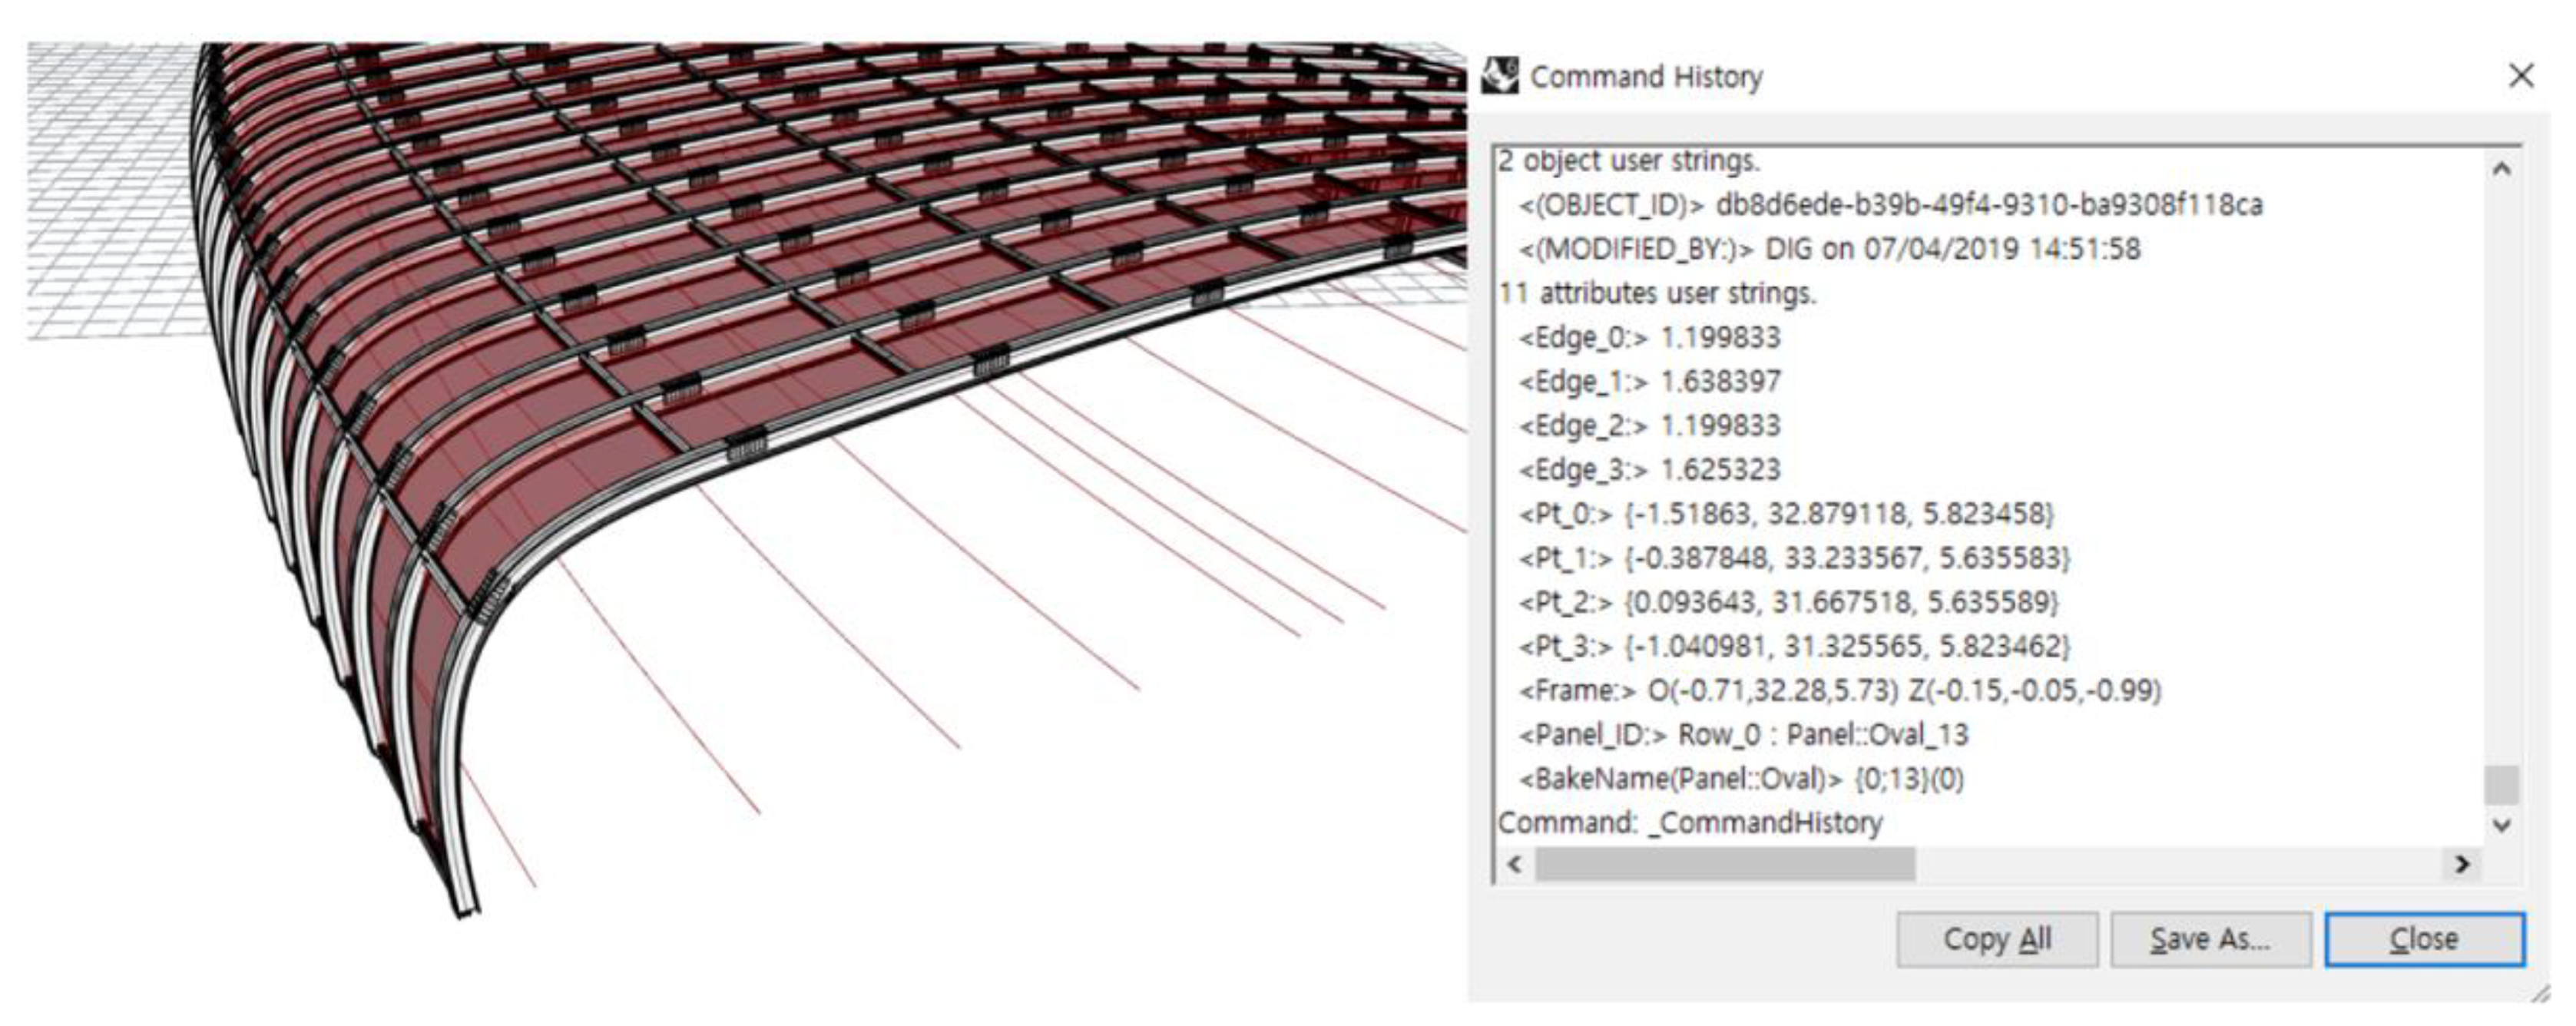
The NBT digital model is the form generation script of the NBT and comprises the NBT shape generation, component shape generation, and component mapping, and layout modules. Moreover, the NBT digital component generated via the shape generation script includes the building information model (BIM)-based component information. The included component information is necessary for representing component behavior and shape. It contains shape information such as the reference point of the component, position of each reference point, direction of the component plane, and curvature of the component. For the parametric model of the NBT used in this study, the oval roof was used to express component shapes and behaviors using a few component types, as shown in Figure 5. Because all of the morphological types have a similar structural assembly in terms of NBT, most of the types perform virtually the same structural movement. Furthermore, the most critical factor for the structural movement is the difference in the size of the NBT, not the shape. Thus, if the NBT has the same size because among the four types of NBT shapes, the oval type is the shape most commonly used, the oval type is used here and is assumed to represent all the structural characteristics of another type [19].
The digital model generation proceeds with form generation, component generation, and component mapping. First, form generation expresses the shape of the elliptical NBT with points and lines. The NBT resources are analyzed based on actual construction drawings of an NBT. The NBT is then scaled based on the following parameters: Lane width, number of lanes, and width of the center separator. The minimum height of the NBT is set based on the vehicle boundary line, which is determined according to the road conditions and type of vehicle.
In the experiment, the vehicle boundary line was set at 3.5 m. The reference points of the NBT were placed at a maximum interval of 1.2 m along both sides of the road. As the size of a typical panel is 1.2 × 0.6 m, a constraint is applied such that the panel does not exceed the maximum panel width. Points and lines were generated by applying different properties for each component, as discussed in 2.1, and subsequently, they were indicated using different colors, as shown in Figure 5. The reference points and lines for replacing each component were generated based on the shape-generation step. In the form-generation step, each component was expressed using lines and points. The property values for each component are listed in Table 2.
In the component-generation step, the shape information of NBT components is the input, and each piece of property information is derived from the shape model and combined with the profile of the target component. In the case of the runner and rafter beams, the profile is extruded along the path based on the start and end points of the components. Here, the data of the frame and normal vector are utilized to prevent component distortion. Each component includes different properties. However, for materials of the structural parts, the start-point, end point, length, size, and shape of the component, the vector direction of the component surface, component name, and unique number are expressed. The unique numbers are divided into rows and columns that contain the relative position of the component. The absolute position of a component is identified based on the start point, end point, and component surface vector. Figure 6 depicts the NBT digital model.

4.2. Generation of NBT Physical Model and Sensor Integration

To implement the digital twin, an NBT physical model was generated using a 3D printer based on the NBT digital model. An MPU-6050 gyro sensor—a six-axis sensor—was used to measure the angular velocity and axial acceleration. The sensor was installed on the components serving as the NBT girder and purlin. Notably, the rafter beam, which acts as a girder, exhibits identical movements because the connection between each component comprises a rigid bond. Therefore, only one sensor is installed on the rigidly jointed rafter beam assembly.
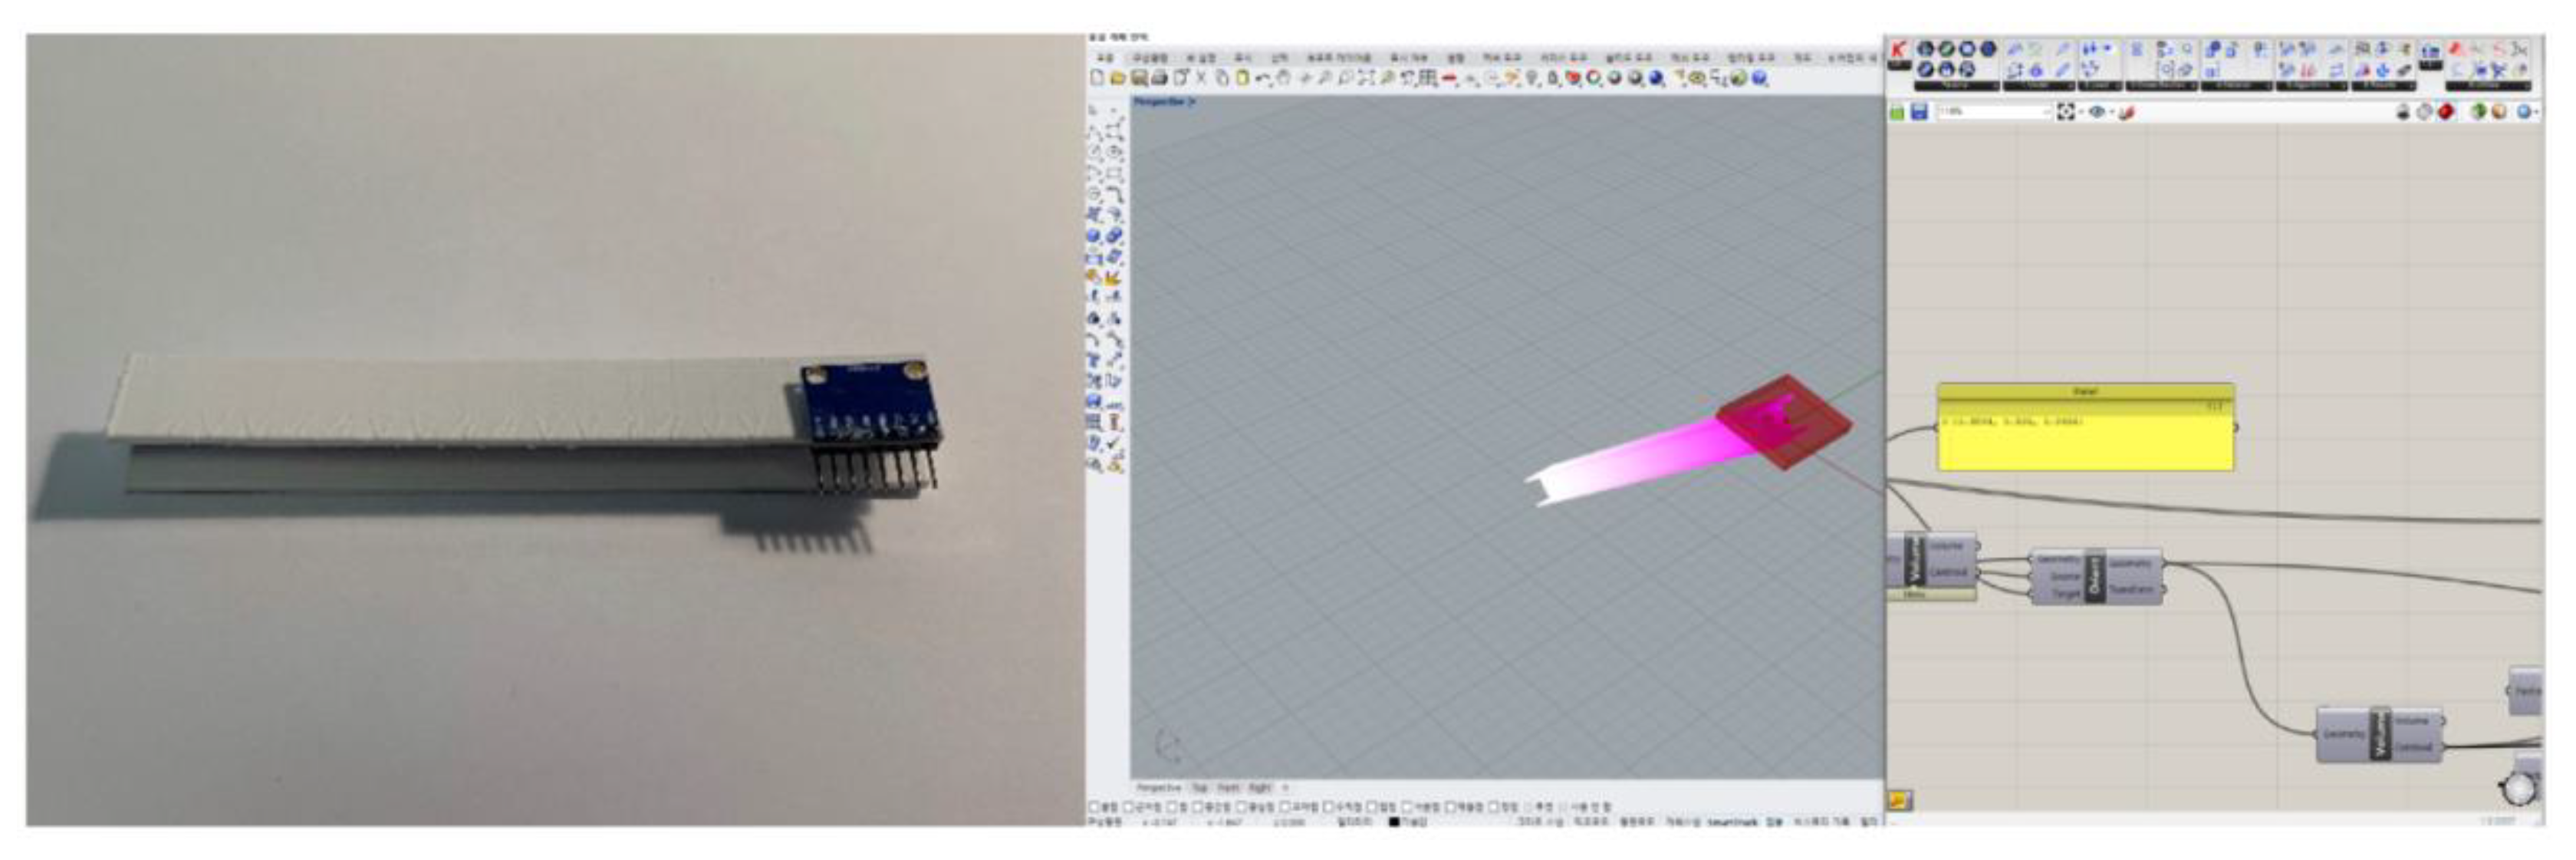
As shown in Figure 7, six types of information (angular velocity along the X, Y, and Z directions and axial acceleration along the X, Y, and Z directions) are represented by numbers, through Arduino—an open-source prototyping tool. As the MPU-6050 sensor analyzed 16-bit data for each angular velocity and axial acceleration, data were analyzed in steps from −16,384 to 16,384. These numbers can be converted into angular velocity and axial acceleration. The angular velocity and axial acceleration data derived from the Arduino script were processed in Grasshopper (Rhino Ceros). In Grasshopper, the direction and speed of the rotation of NBT components can be derived by measuring the angular velocity, and the displacement of the component can be measured through the axial acceleration data. As the bending moment can be measured using the displacement and rotation direction, the magnitude of the stress applied to the physical model can be derived through the digital model. This is derived by inputting the direction and displacement of the stress using a structural analysis tool (Karamba3D). The displacement caused by stress is displayed on the Rhino screen in real time. Through this, the stress acting on the physical model can be linked with the digital model, as observed in Figure 8.

4.3. Life Prediction of NBT Components

For predicting the life of steel structure components, the formula used in the numerical model was derived by referring to the models proposed by Jo [16] and Santecchia et al. [20]. To measure the life of the component, information on characteristics, such as elastic modulus, fatigue coefficient, and stress amplitude, which can express the physical behavior, is required. Jo [16] suggested using a modified S–N curve because component life can vary based on the stress amplitude. In the modified S–N curve, the maximum, minimum, and median values of the amplitude can be derived and substituted in Formula (1).
The life of NBT structural components was measured to determine the elastic behavior of the steel structure components, resulting stress, and stress amplitude. The elastic behavior of the components was assumed to end at the point at which the displacement was 0.001 mm. As vibrations of 10 Hz or more could result in stress exceeding the fatigue limit, which is difficult to observe in real time, the signal was analyzed every 0.1 s. The physical and digital models exchanged data once every 0.1 s, which allowed measuring the vibrations up to 10 Hz. Real-time information could be obtained by implementing the digital twin in life prediction and damage analyses, and the results may vary according to the numerical model used. This study used the formula proposed by Jo [16] for calculating the fatigue limit, using a modified S–N curve, which can be derived considering the changes in the behavior of the component.
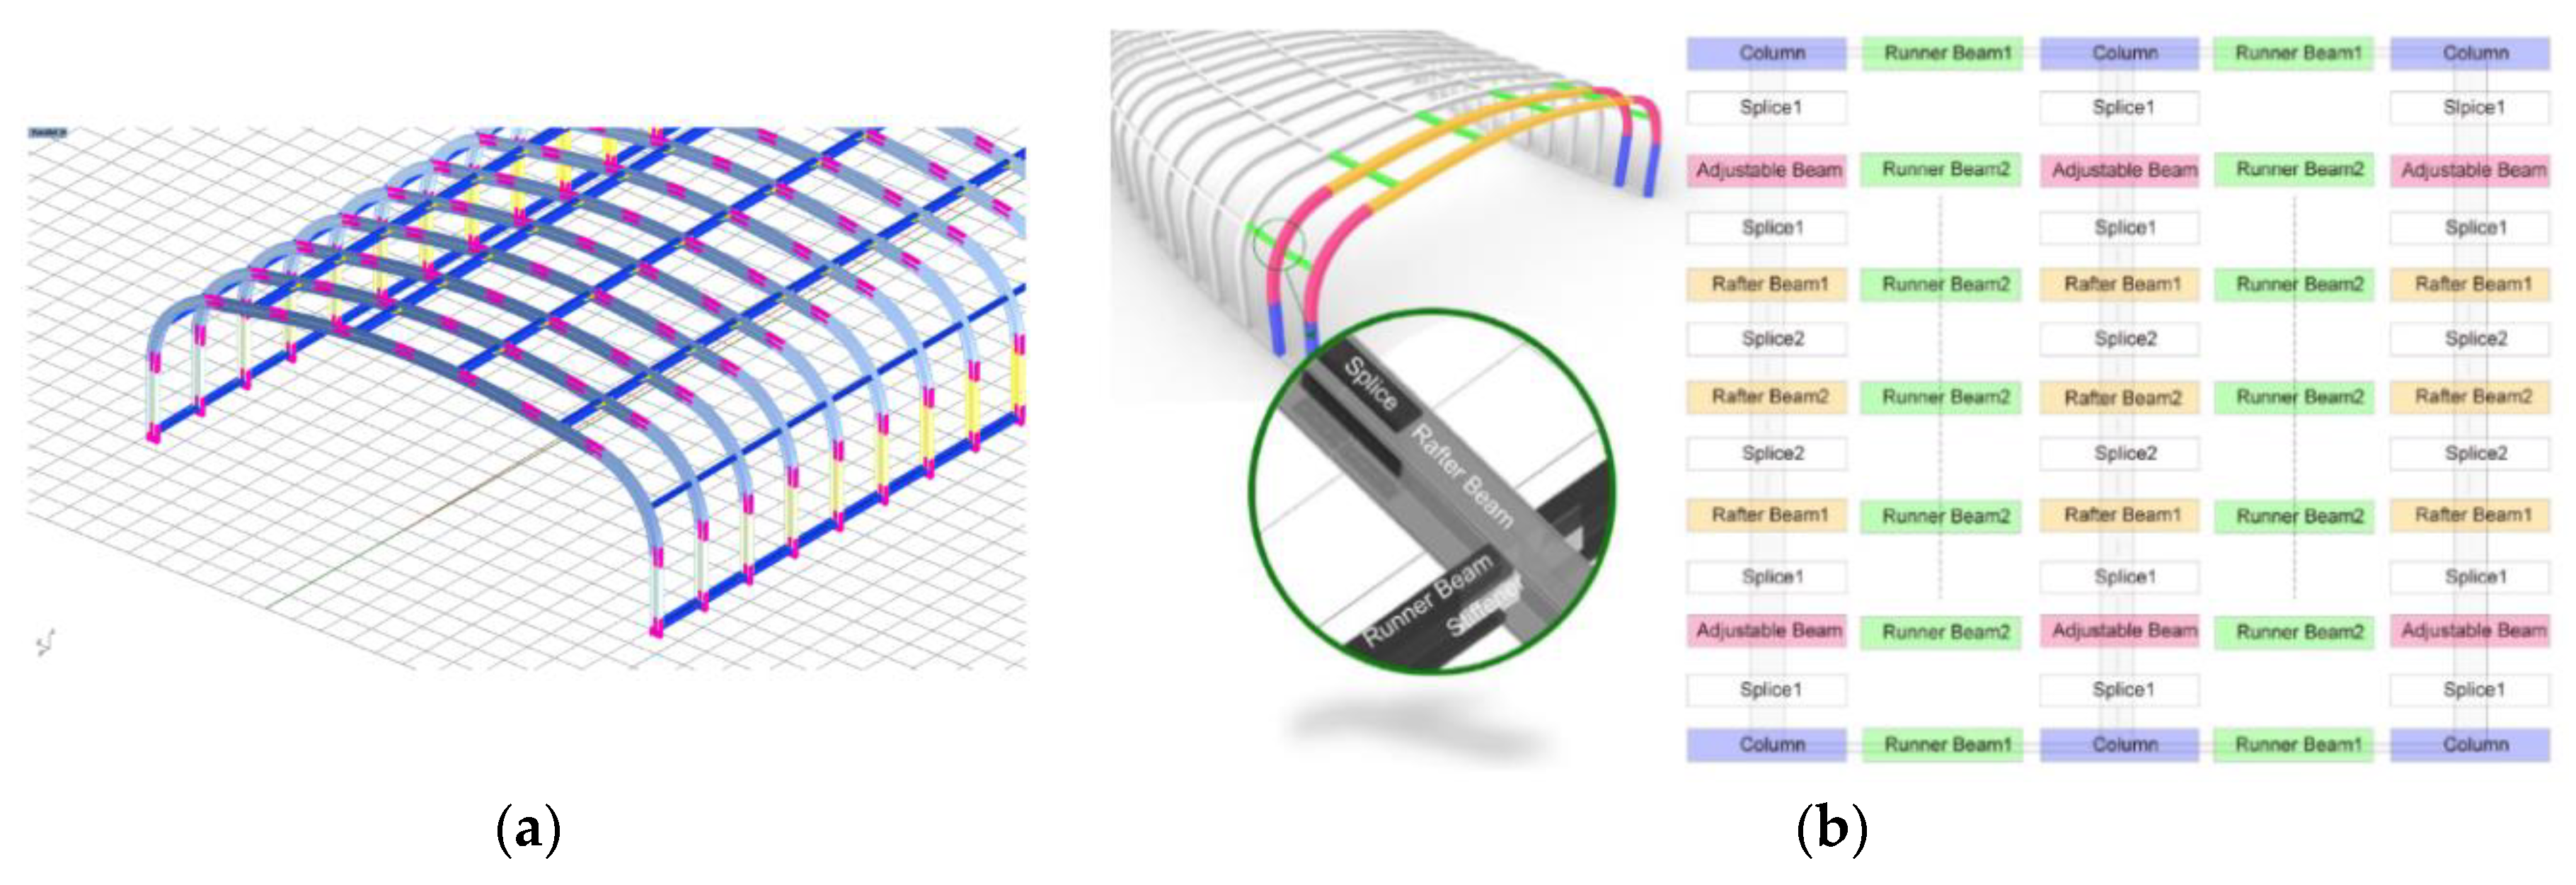
Figure 9 shows the visualization of the remaining lifespan of the girder in the physical model when repeated stress is applied to the physical model. In the girder, components are connected to the rigid joints through splices. Even though all connected components exhibited identical behaviors, the displacement increased as the distance between the component and the connection point increased. Therefore, in the case of elastic behavior, the greater the distance between the component and the connection point, the higher is the stress. This results in the reduction of the lifespan of the component.
In this study, the displacement of the component was assumed to be proportional to the stress received by the component, and thus, the life of the component is inversely proportional to the stress experienced by the component. Therefore, for girder components, the remaining life is exhausted faster as they move further away from the connection point. In the NBT with an oval roof, because the columns, variable beams, and runner beams are connected to the rafter beam through joints, the girder component is assumed to be similar to the column or variable beam components.
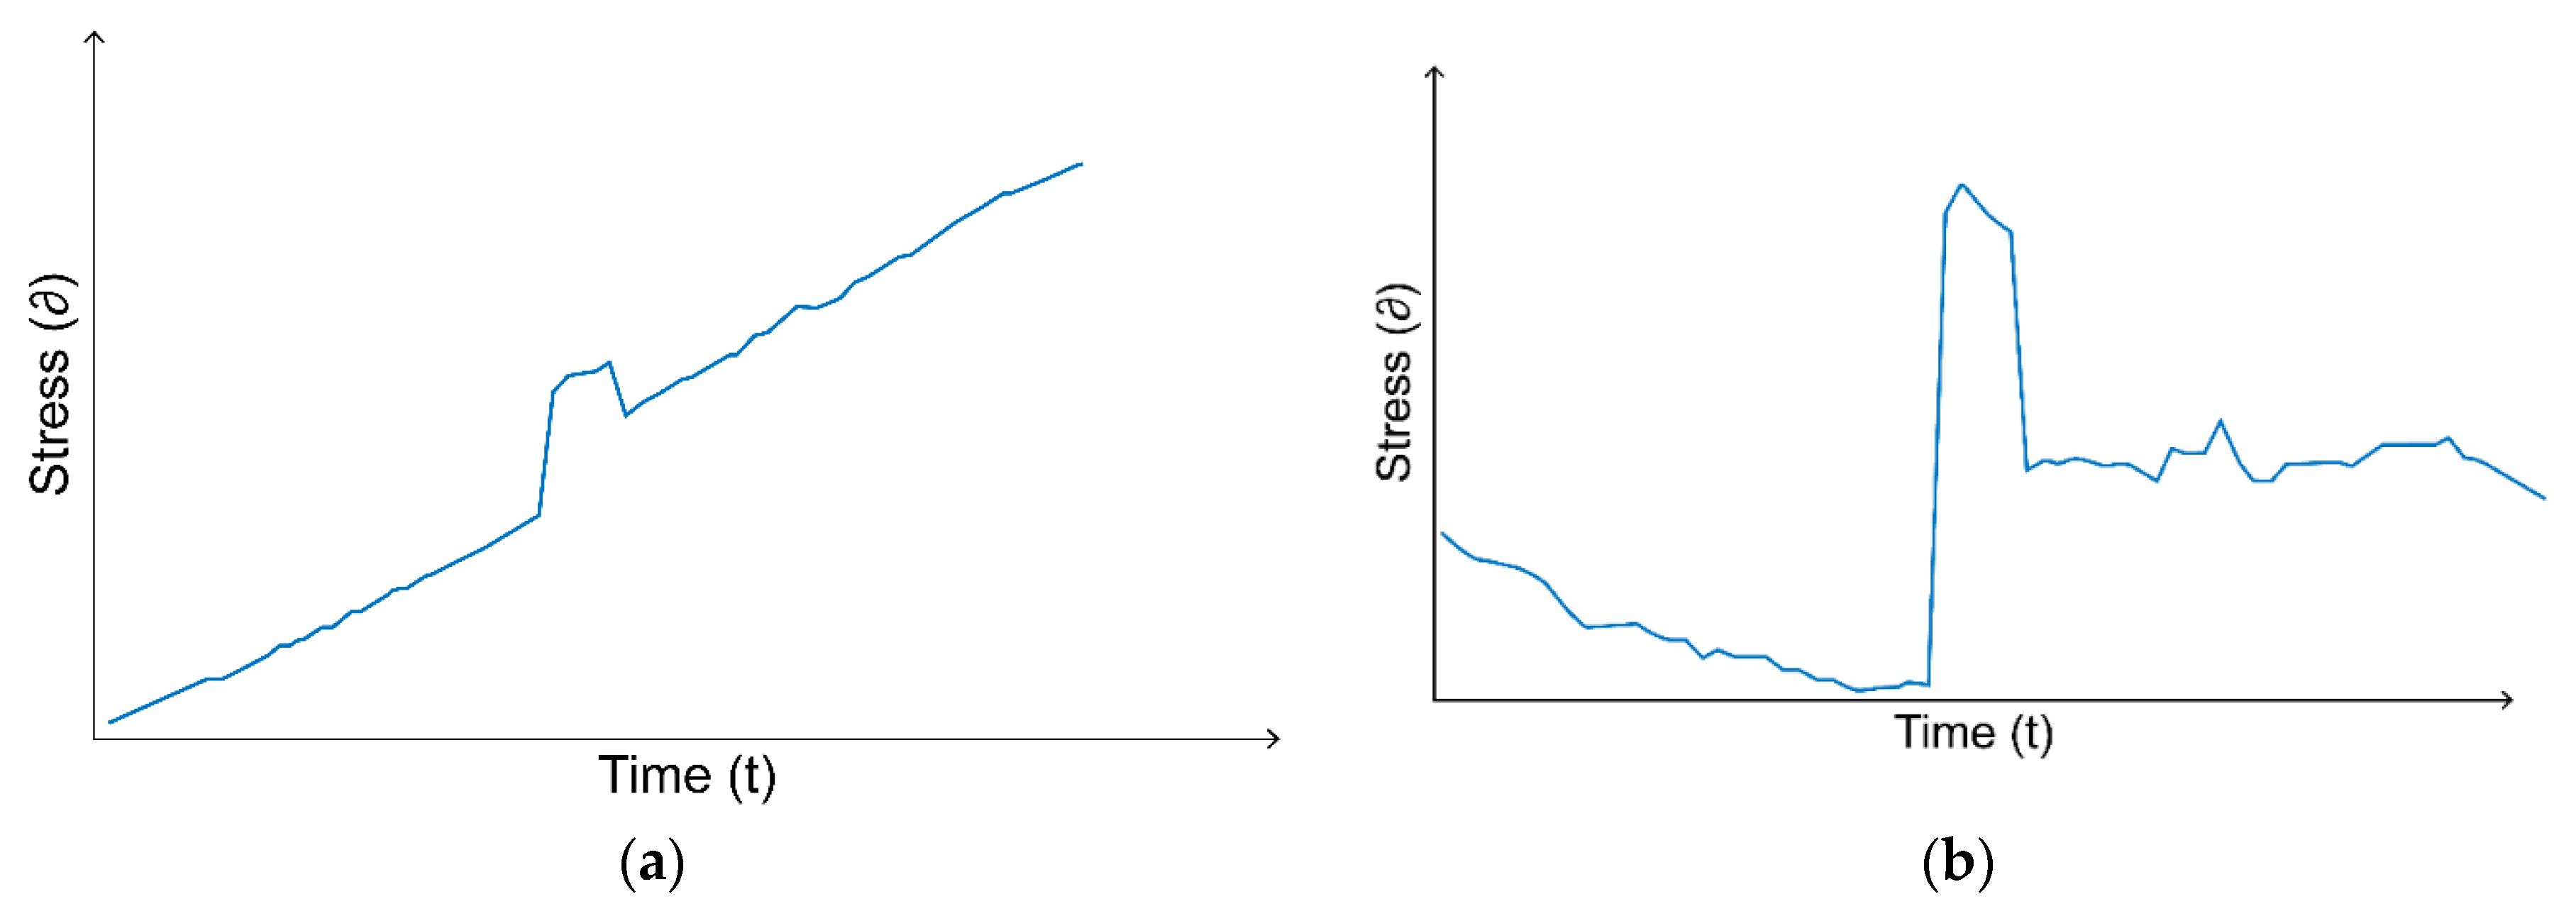
Figure 10a presents the data recorded by the sensor installed on the girder component of the physical model when a random load is applied. The chart indicates a constant increase in the impact force even when a single impact occurs, and this is attributed to the accumulation of errors when the displacement is measured considering the acceleration of the gyro sensor (i.e., drift phenomenon). Figure 10b shows the analysis results for the drift phenomenon observed using the complementary filter. Moreover, the maximum, minimum, and median values of the stress are derived. The stress immediately before the impact is not zero because of the difference in the displacement caused by gravity acting on the physical model. The error increases as the sensor weight or sensor component weight increases. Figure 10 depicts the behavior of the physical model based on movements along the x, y, and z axes. The data were analyzed and tabulated during 10 rounds of impacts. As the accumulated error in each round could not be eliminated completely, there was an increase in the error in the stress analysis step. Therefore, to reduce the error and analyze stress accurately, a filter was applied for reducing the noise generated in the sensor.

4.4. Life Analysis of NBT Components

NBTs are affected structurally because of the transit traffic during the operational stage of the facility. In general, NBTs are connected structurally, and therefore, they are affected directly by the impact generated on the road surface. Moreover, the displacement generated has a structural impact on the NBT. Thus, as the transit traffic increases, the operational period and structural load increase. However, digital twins are not applied in the case of NBTs under operation, owing to budgetary restrictions. Thus, it is difficult to determine the state of NBTs and their components in real time. Understanding the current state of NBTs, thus, depends on the visual sense of the NBT manager.
The application of digital twins to NBT has the following advantages:
(1)
This enables real-time condition analysis and life prediction of NBTs and their components, thus, making it possible to grasp the requirements and timing for replacing components. This schedule can, thus, be reflected in the production and procurement processes of the replacement component.
(2)
Health analysis and life expectancy can increase the sustainability of the NBT facility.
(3)
The characteristics of NBT utilizing prefabricated components can be managed using digital twins, from the design of components to the production, procurement, and assembly of components in the field. This includes the possibility of employing its characteristics as a digital chain.
(4)
As previously stated, it is currently costly to apply digital twins to NBTs under operation. However, using the proposed methodology, digital twins can be applied without a significant increase in the cost.
Therefore, on applying a digital twin during the planning stage of NBTs, it is possible to analyze the state in an objective manner as compared to the conventional method. Moreover, digital twins can predict resource procurement, production, and replacement times, which increases sustainability in terms of NBT maintenance. For example, when two additional NBTs are using the same component, the common component can be inter replaced, thereby increasing sustainability.

5. Conclusions

This study derived variations in the stress acting on a component based on the digital twin to determine the lifespan of the component. Further, the possibility of analyzing the life and damage caused to component using a digital twin was verified, thereby, proving that a digital twin can be used in the component reuse scenario via visualization.
Compared to Power Fingerprinting Inc.’s engine life estimation method that analyzes the lifespan of a component based on the function and numerical model, the digital-twin-based life and failure analyses can determine accidental failures and predict the remaining life under normal circumstances. Thus, digital twins can communicate with real objects and provide real-time diagnostics. In addition, they are more accurate than numerical models and regular checks. In particular, the fatigue life of steel structures can be observed after the occurrence of cracks. To analyze the steps facilitating the occurrence of fatigue cracks, it is advantageous to employ the digital twin technique to draw predictions that can analyze the displacement of the components continuously. However, it is impossible to predict the life for reuse unless the behavioral data of the component is obtained from the initial stage of installation. The digital twin should, therefore, be applied from the design stage of the NBT.
Although a numerical analysis model was used to analyze the life of steel structures, a generalized numerical analysis model is not suitable to analyze the complicated form of an NBT. This study attempted to confirm that sustainability can be improved through the application of digital twins. However, owing to the use of the numerical model, the precision of the measurements is limited. The digital twin was implemented to analyze only the lifespan caused by the behavior of NBTs, and lifespan analysis considering other factors was not possible. In the future, for behavior analysis, there is a need for these life prediction methods to include the corrosion caused by humidity and the effect of structural temperature on structural performance.
This study provides a basis for research aimed at combining the concept of next-generation NBTs and digital twins. This research can act as a simple analysis method that can be employed in fields that require continuous analyses and management, such as structural health monitoring. However, there were a few limitations associated with the study. While the study focused on determining if digital twins could improve sustainability, the degree of improvement was not elucidated. In addition, the influence of temperature and other factors on the lifespan of NBTs was not considered in this study. Therefore, future studies should attempt to deduce the degree of improvement in sustainability as well as to perform lifespan analyses that account for multiple influencing factors. Moreover, they should also focus on evaluating lifespan and other performances while employing digital twins.

Author Contributions

Conceptualization; validation; formal analysis; investigation; resources; data curation; writing—original draft preparation; writing—review and editing; and visualization: J.K. and S.-A.K.; methodology, J.K.; and supervision, S.-A.K. All authors have read and agree to the published version of the manuscript.

Funding

This research was funded by the Infrastructure and transportation technology promotion research program funded by Ministry of Land, Infrastructure and Transport of Korean government (Grant No. 20CTAP-C151928-02).

Conflicts of Interest

The authors declare no conflict of interest. The funder had no role in the design of the study; in the collection, analyses, or interpretation of data; in the writing of the manuscript, or in the decision to publish the results

References

  1. Son, J. Case Study on the Planning Procedure of Traffic—Sound Facilities and Alternative Decision Making; Bukyeong University: Busan, Korean, 2009. [Google Scholar]
  2. Chae, S.C. A Study on Smoke Control Measures and Evacuation Services of Highway Soundproofing Tunnel; Korea Expressway Corporation, Facilities Department: Seongnam, Korean, 2017; p. 133. [Google Scholar]
  3. Lee, J.J. Research on Design of Soundproof Tunnel Lighting in consider of Daylight Penetration; Kangwon University: Chunchun, Korean, 2017. [Google Scholar]
  4. Ahn, H. Research on design guideline of sound proof tunnel—Focused on the development area near Busan Geoje station. Kor. Soc. Art Des. 2017, 20, 271–288. [Google Scholar]
  5. You, J.Y.; Paek, S.Y.; Kim, D.K.; You, K.P. The wind flow characteristics measuring simulations of NBTs on expressways. App. Mech. Mater. 2018, 878, 70–75. [Google Scholar] [CrossRef]
  6. Robertson, D.; Ulrich, K. Platform product development. Sloan Manag. Rev. 1998, 39, 19–31. [Google Scholar]
  7. Grieves, M.W. Virtually intelligent product systems: Digital and physical twins. Complex Syst. Eng. Theory Pract. 2018, 7, 175. [Google Scholar]
  8. Tao, F.; Sui, F.; Liu, A.; Qi, Q.; Zhang, M.; Song, B.; Guo, Z.; Lu, S.C.Y.; Nee, A.Y.C. Digital twin-driven product design framework. Int. J. Prod. Res. 2019, 57, 3935–3953. [Google Scholar] [CrossRef] [Green Version]
  9. Bacchiega, G. Creating an Embedded Digital Twin: Monitor, Understand and Predict Device Health Failure; IRS: Washington, DC, USA, 2017. [Google Scholar]
  10. Piascik, B.; Vickers, J.; Lowry, D.; Scotti, S.; Stewart, J.; Calomino, A. Technology Area 12: Materials, Structures, Mechanical Systems, and Manufacturing Road Map. NASA Off. Chief Technol. 2012. Available online: https://www.nasa.gov/sites/default/files/501625main_TA12-ID_rev6_NRC-wTASR.pdf (accessed on 6 April 2020).
  11. Lee, J.; Bagheri, B.; Kao, H.A. A cyber-physical systems architecture for industry 4.0-based manufacturing systems. Manuf. Lett. 2015, 3, 18–23. [Google Scholar] [CrossRef]
  12. Tao, F.; Zhang, H.; Liu, A.; Nee, A.Y.C. Digital twin in industry: State-of-the-art. IEEE Trans. Ind. Inform. 2018, 15, 2405–2415. [Google Scholar] [CrossRef]
  13. Kahlen, F.; Flumerfelt, S.; Alves, A. Transdisciplinary Perspectives on Complex Systems; Springer International Publishing: New York, NY, USA, 2017. [Google Scholar]
  14. Negri, E.; Fumagalli, L.; Macchi, M. A review of the roles of digital twin in cps-based production systems. Procedia Manuf. 2017, 11, 939–948. [Google Scholar] [CrossRef]
  15. Anthony, C.; Cheung, W.M. Cost evaluation in design for end-of-life of automotive components. J. Remanuf. 2017, 7, 97–111. [Google Scholar] [CrossRef] [Green Version]
  16. Jo, J. Numerical method of fatigue life prediction for each fatigue phase of steel structures. Kor. J. Steel Struct. 1995, 7, 231–239. [Google Scholar]
  17. Rammberg, W.; Osgood, W.R. Description of Stress-Strain Curves by three Parameters; Technical Note National Advisory Committee for Aeronautics: Washington, DC, USA, 1942. [Google Scholar]
  18. Seeger, T.; Bergmann, J. On the Influence of Cyclic-Stress-Strain-Curves, Damage Parameters and Various Evaluation Concepts on the Life Prediction by Local Approach. In Proceedings of the 2nd European Colloquium on Fracture, VDI-Fortschrittsberrichte, Darmstadt, Germany, 9–11 October 1978. [Google Scholar]
  19. Kim, J.; Kim, S.-A. Prototyping-based design process integrated with digital-twin: A fundamental study. KBIM Mag. 2019, 12, 51–61. [Google Scholar]
  20. Santecchia, E.; Hamouda, A.M.S.; Musharavati, F.; Zalnezhad, E.; Cabibbo, M.; El Mehtedi, M.; Spigarelli, S. A review on fatigue life prediction methods for metals. Adv. Mater. Sci. Eng. 2016, 2016. [Google Scholar] [CrossRef] [Green Version]
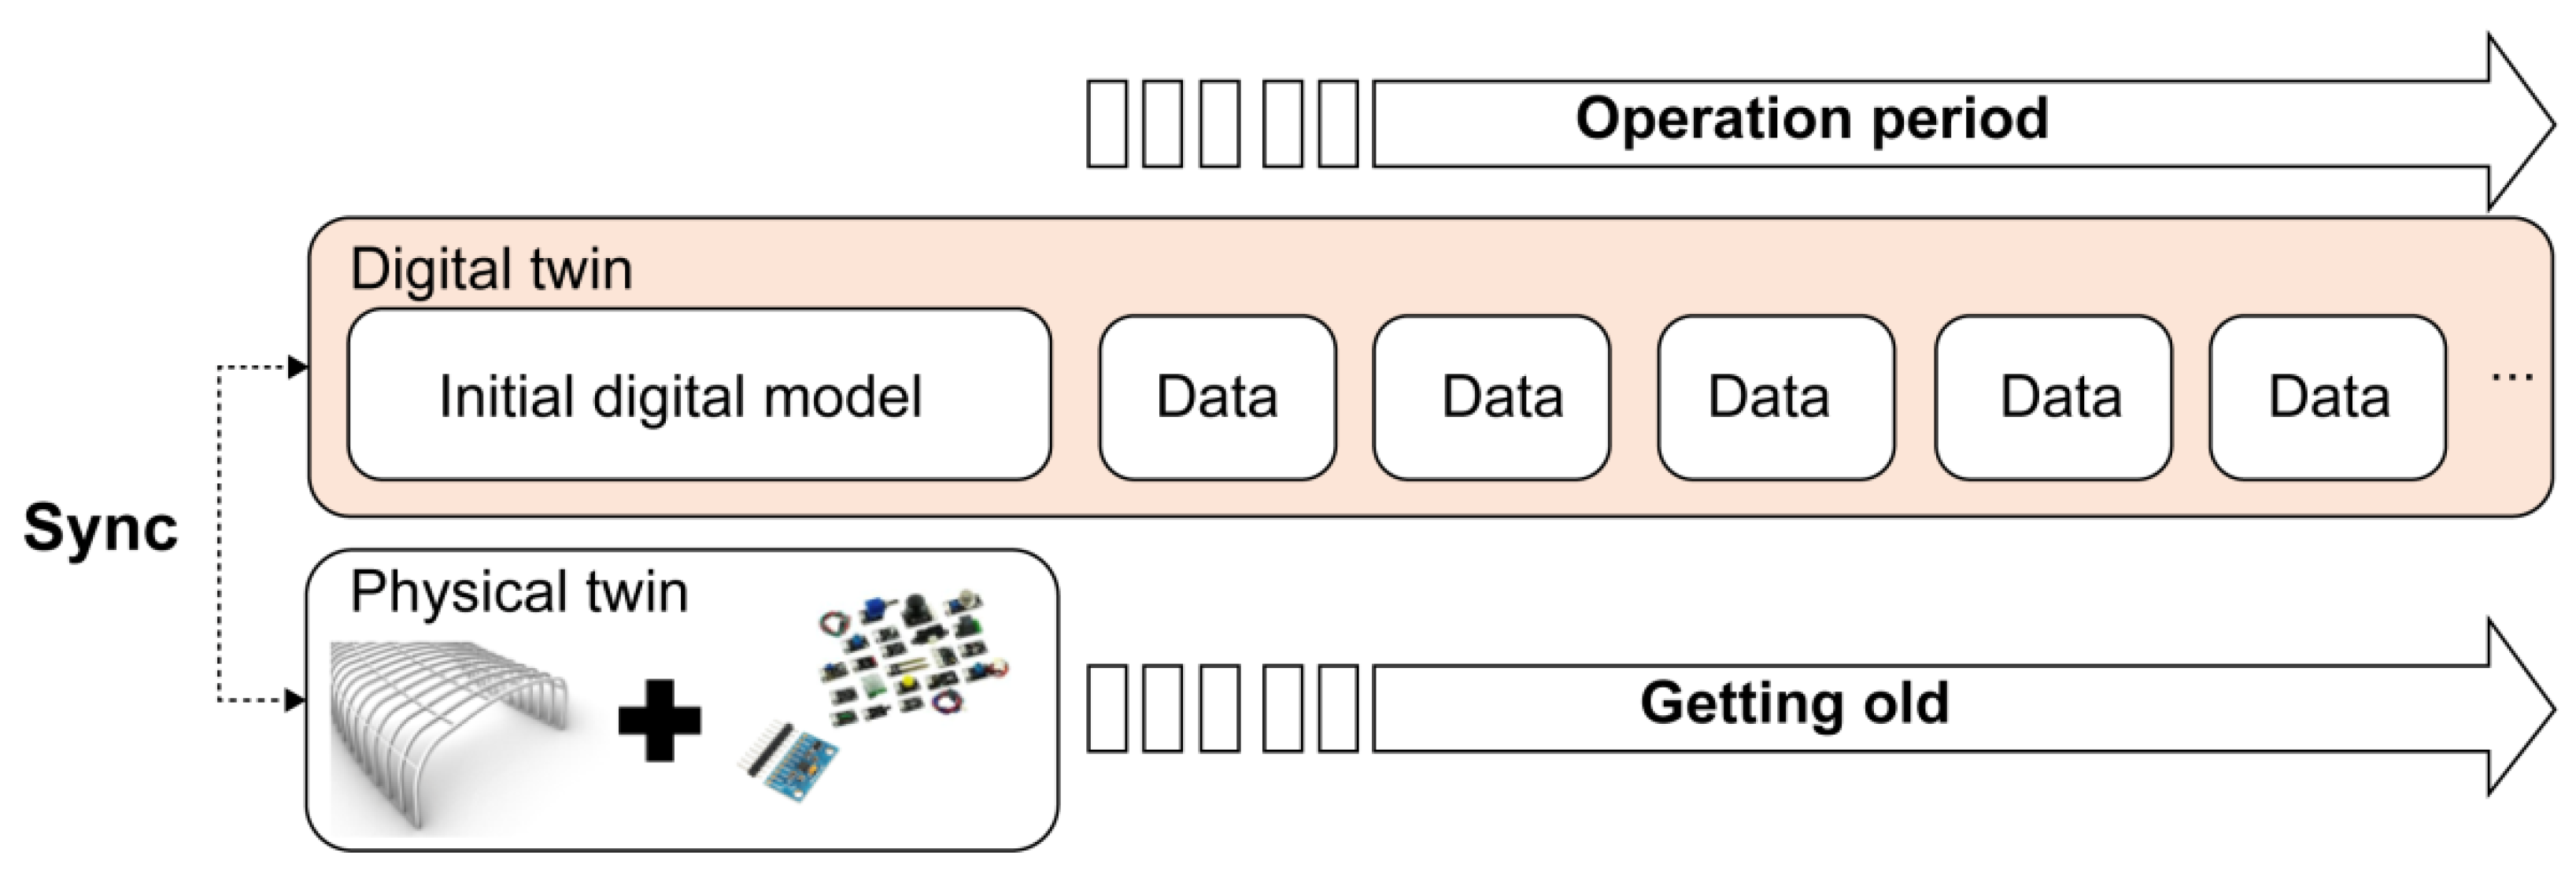
Figure 1. Concept and definition of a digital twin.
Sustainability 12 02940 g001
Figure 2. Implementation methodology of the noise barrier tunnels (NBT) digital twin.
Sustainability 12 02940 g002
Figure 3. Correlation between acceleration, time, displacement, vector, and force.
Sustainability 12 02940 g003
Figure 4. Methodology of digital-twin-based lifespan estimation.
Sustainability 12 02940 g004
Figure 5. Oval NBT shape generator.
Sustainability 12 02940 g005
Figure 6. NBT digital model.
Sustainability 12 02940 g006
Figure 7. Synchronization process for the prediction model.
Sustainability 12 02940 g007
Figure 8. Stress analysis between physical and digital components.
Sustainability 12 02940 g008
Figure 9. Lifespan prediction and visualization of girder and purlin. (a) Illustration of NBT component (b).
Sustainability 12 02940 g009
Figure 10. Force data (a) before using filter and (b) after using filter.
Sustainability 12 02940 g010
Table 1. Case study for considering the life span of a recycling component.
Project NameLocationEstimated Material UsesEstimated Life Span
SERGO relocation (2015)Cambridge1X 2
BedZed London (2002)LondonX
London 2012 StadiumLondonX
Rio 2016 StadiumRioX
Carr wood ParkLeedsX
King science AcademyBradfordX
Leeds UniversityLeedsX
1 "O" indicates that the reuse or life span of a material has been considered. 2 “X” indicates that the reuse or life span of a material has not been considered.
Table 2. Properties of each component object.
LengthRadiusBenchmark PointObject IDFrameNormal VectorPathProfile
Rafter beam
Splice
Stiffener
Runner beam