Association between Adherence to the Mediterranean Diet and Physical Fitness with Body Composition Parameters in 1717 European Adolescents: The AdolesHealth Study

 ,
,  , ,
, ,  and
and 
Abstract
:1. Introduction
2. Materials and Methods
2.1. Study and Sample Design
2.2. Instruments
2.3. Methodology
2.4. Statistical Analysis
3. Results
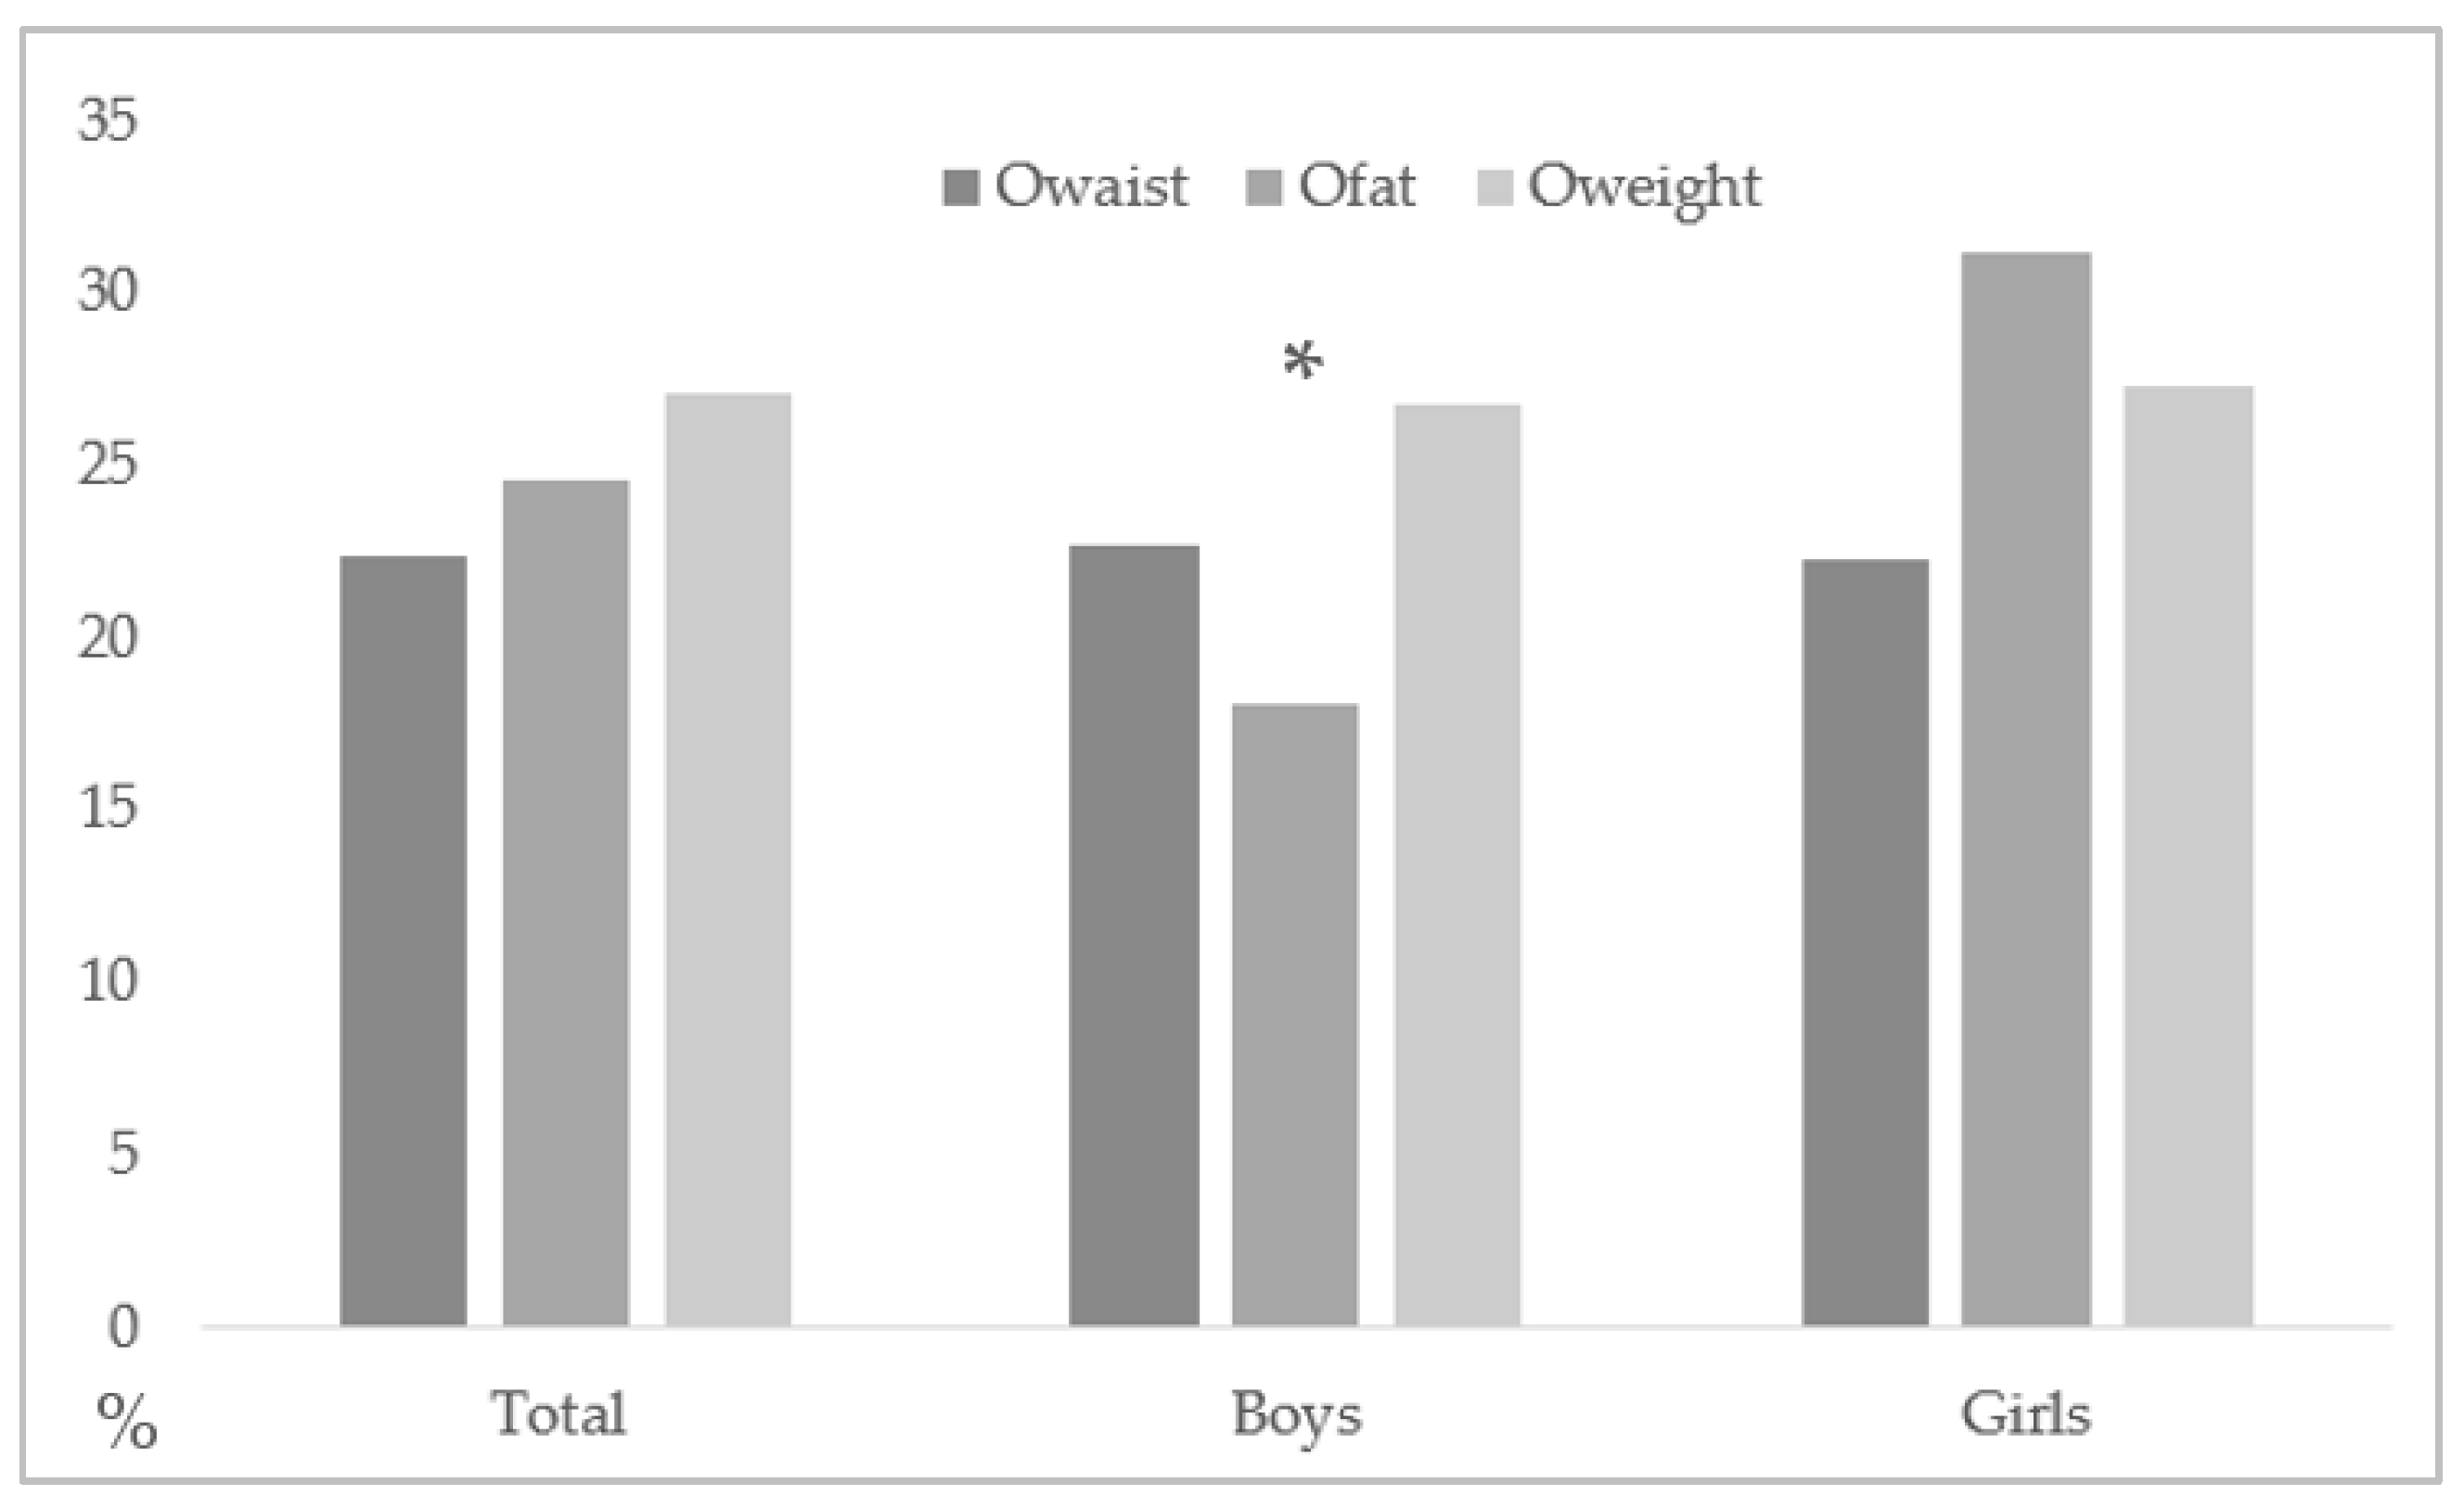
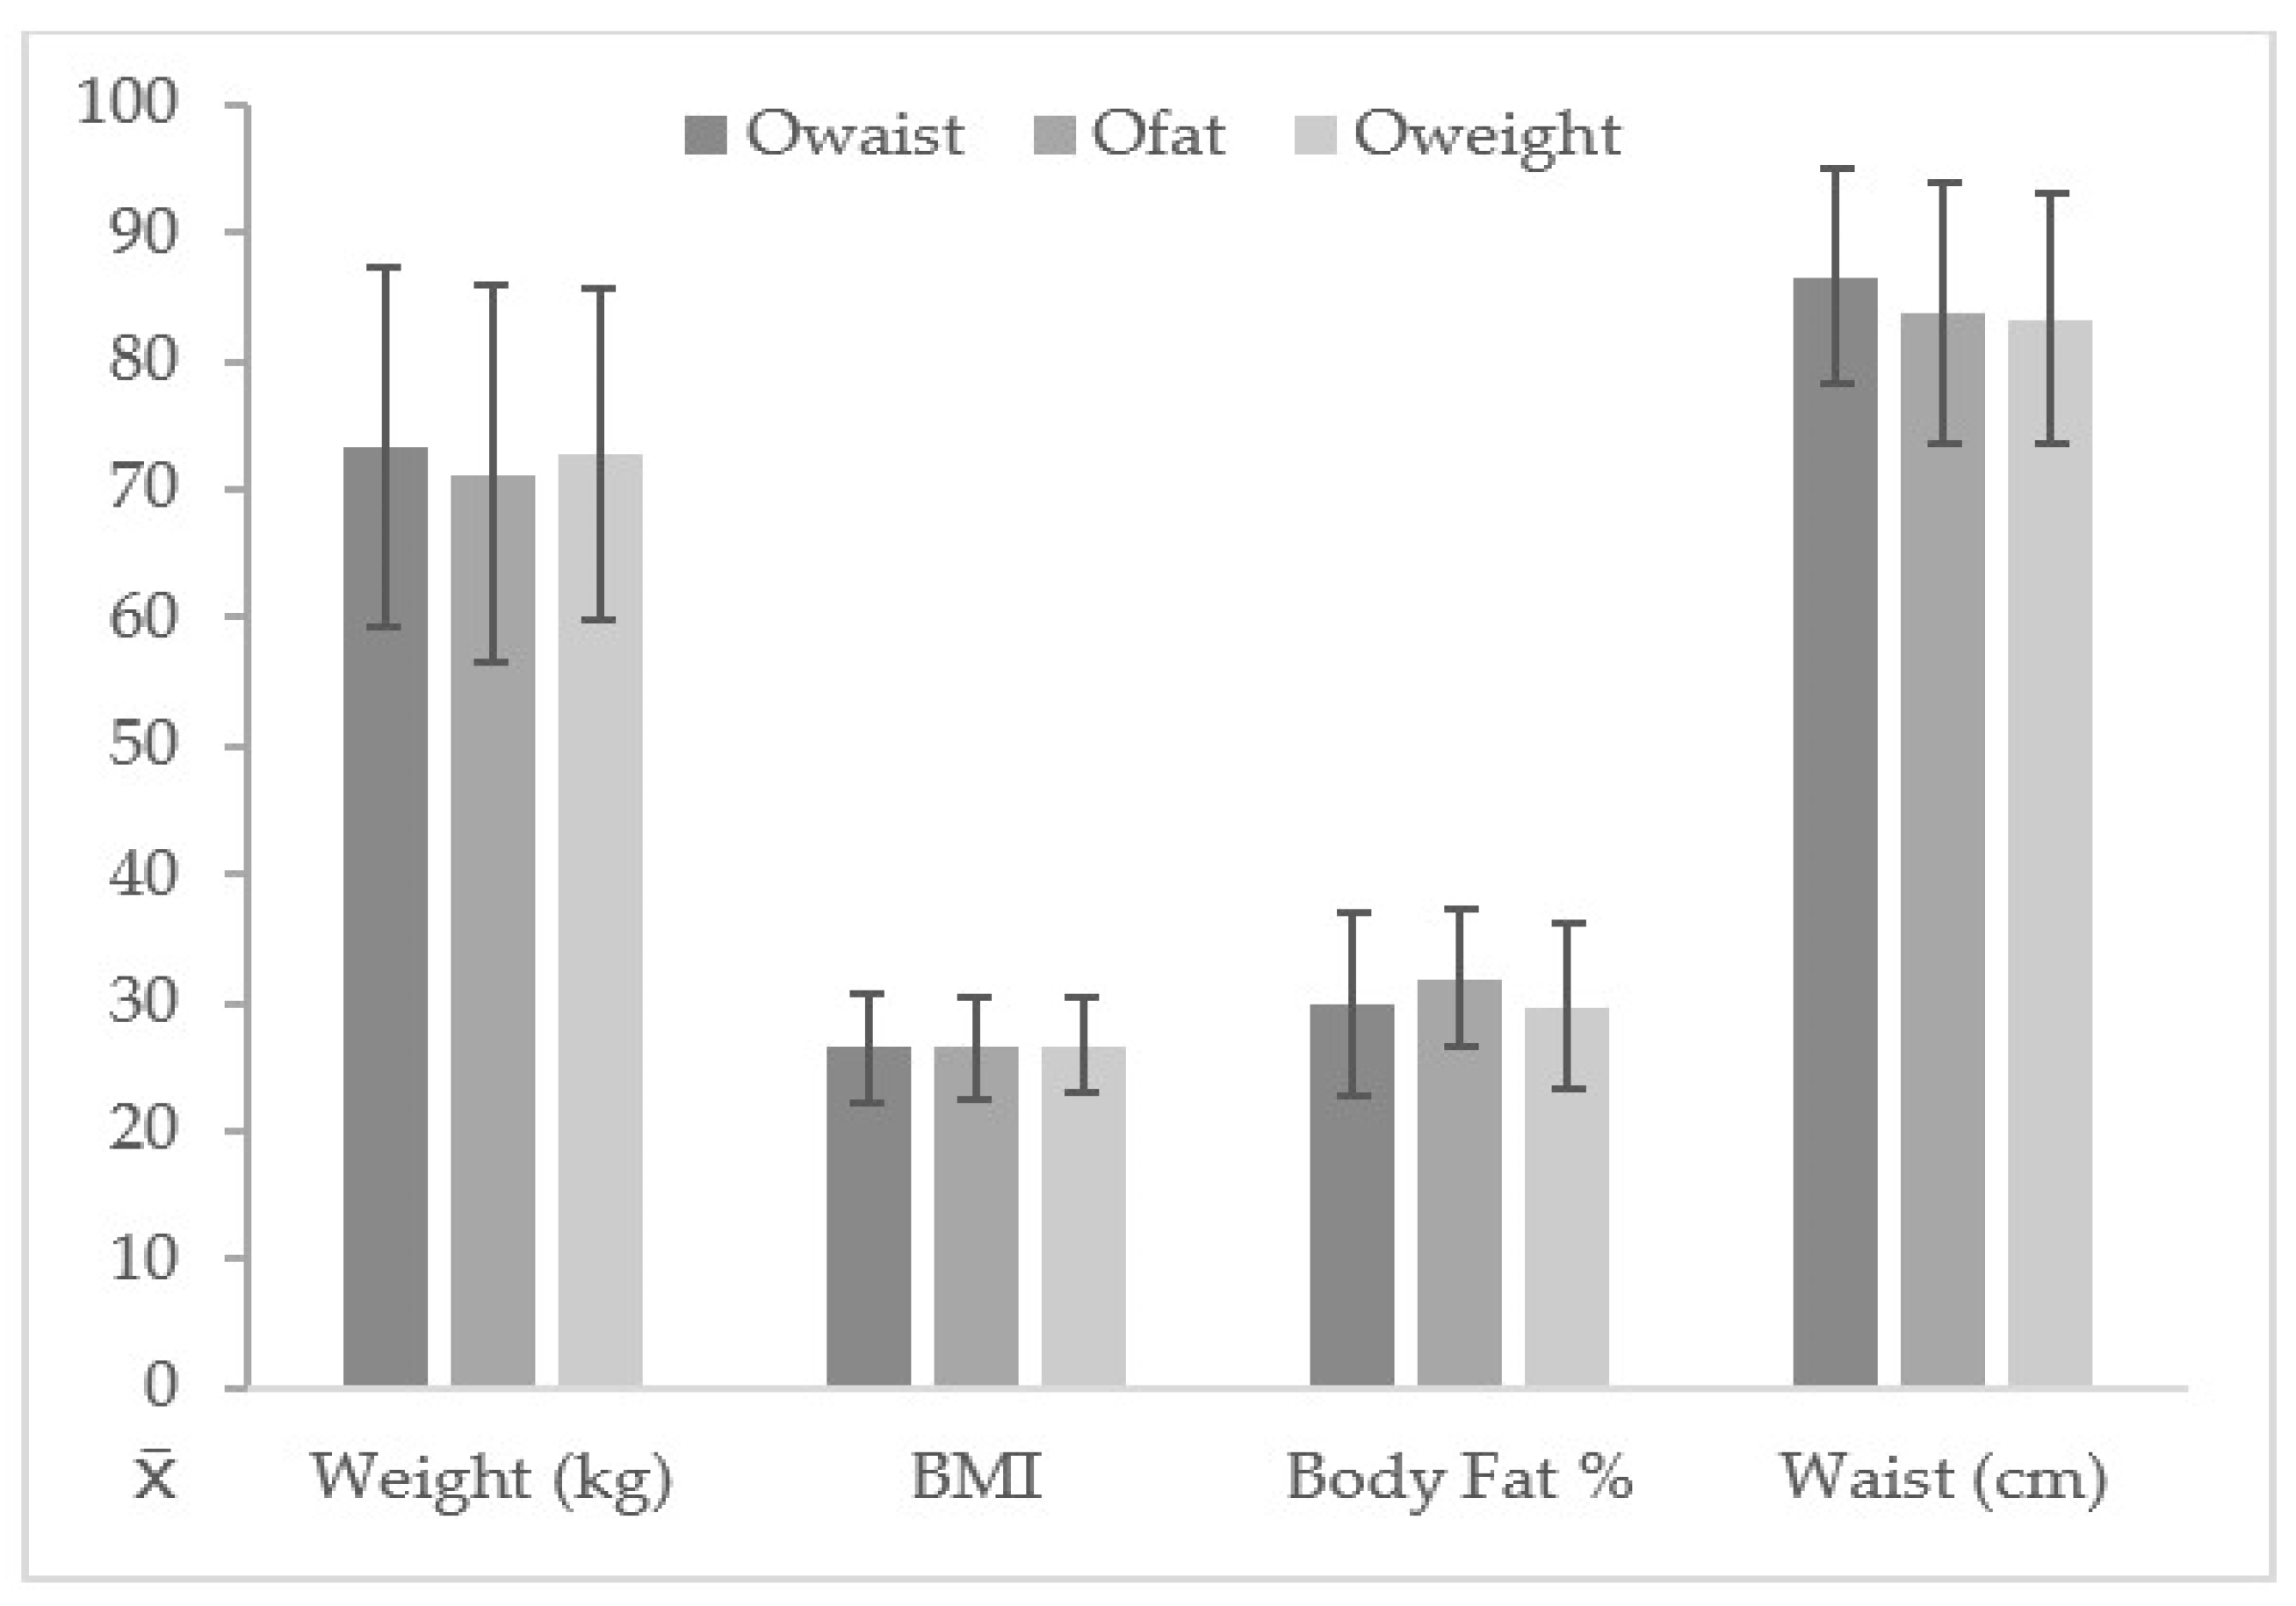
3.1. Descriptive Data in Subject Subjects with and without Owaist, Ofat, and Oweight
3.2. KIDMED Index and Responses in Boys with and without Owaist, Ofat, and Oweight
3.3. KIDMED Responses in Girls with and without Owaist, Ofat and Oweight
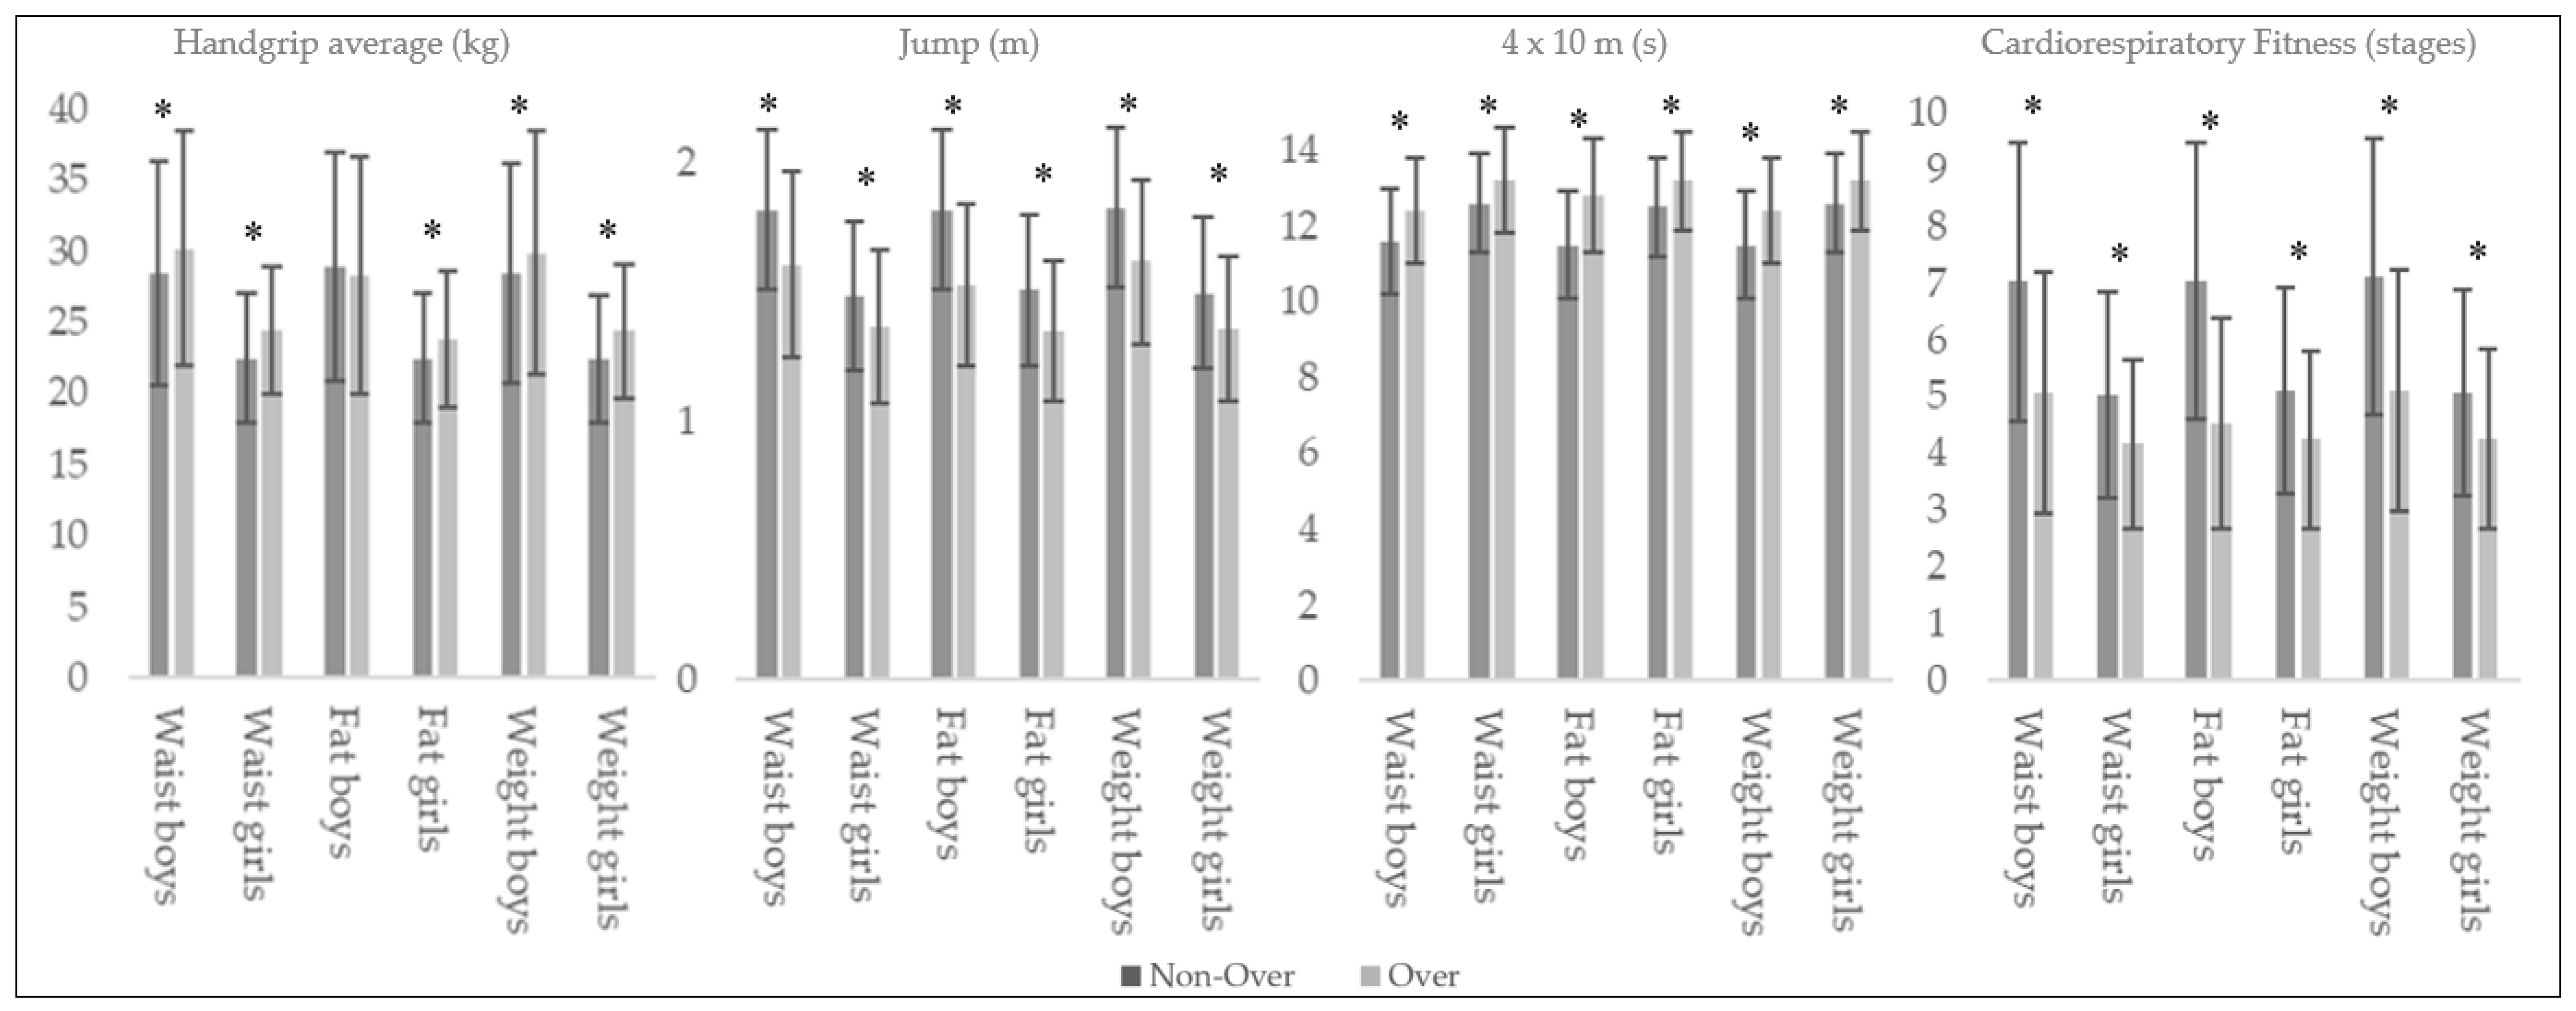
3.4. Fitness Performance in Boys and Girls with and without Owaist, Ofat and Oweight
4. Discussion
4.1. Descriptive Data in Subjects with and without Owaist, Ofat, and Oweight
4.2. KIDMED Index and Responses in Boys and Girl with and without Owaist, Ofat, and Oweight
4.3. Fitness Performance in Boys and Girls with and without Owaist, Ofat, and Oweight
5. Conclusions
Author Contributions
Funding
Acknowledgments
Conflicts of Interest
References
- Ng, M.; Fleming, T.; Robinson, M.; Thomson, B.; Graetz, N.; Margono, C.; Mullany, E.C.; Biryukov, S.; Abbafati, C.; Abera, S.F.; et al. Global, regional, and national prevalence of overweight and obesity in children and adults during 1980–2013: A systematic analysis for the Global Burden of Disease Study 2013. Lancet 2014, 384, 766–781. [Google Scholar] [CrossRef] [Green Version]
- De Onis, M.; Blossner, M.; Borghi, E. Global prevalence and trends of overweight and obesity among preschool children. Am. J. Clin. Nutr. 2010, 92, 1257–1264. [Google Scholar] [CrossRef] [PubMed] [Green Version]
- NCD Risk Factor Collaboration (NCD-RisC). Worldwide trends in body-mass index, underweight, overweight, and obesity from 1975 to 2016: A pooled analysis of 2416 population-based measurement studies in 128·9 million children, adolescents, and adults. Lancet 2017, 390, 2627–2642. [Google Scholar] [CrossRef] [Green Version]
- Suárez-Carmona, W.; Sánchez-Oliver, A.J. Índice de masa corporal: Ventajas y desventajas de su uso en la obesidad. Relación con la fuerza y la actividad física. Nutr. Clín. Med. 2018, 12, 128–139. [Google Scholar] [CrossRef]
- Piché, M.-E.; Poirier, P.; Lemieux, I.; Després, J.-P. Overview of Epidemiology and Contribution of Obesity and Body Fat Distribution to Cardiovascular Disease: An Update. Prog. Cardiovasc. Dis. 2018. [Google Scholar] [CrossRef] [PubMed]
- Laws, R.; Campbell, K.J.; van der Pligt, P.; Russell, G.; Ball, K.; Lynch, J.; Crawford, D.; Taylor, R.; Askew, D.; Denney-Wilson, E. The impact of interventions to prevent obesity or improve obesity related behaviours in children (0–5 years) from socioeconomically disadvantaged and/or indigenous families: A systematic review. BMC Public Health 2014, 14, 779. [Google Scholar] [CrossRef] [Green Version]
- Evaristo, S.; Moreira, C.; Lopes, L.; Oliveira, A.; Abreu, S.; Agostinis-Sobrinho, C.; Oliveira-Santos, J.; Póvoas, S.; Santos, R.; Mota, J. Muscular fitness and cardiorespiratory fitness are associated with health-related quality of life: Results from labmed physical activity study. J. Exerc. Sci. Fit. 2019, 17, 55–61. [Google Scholar] [CrossRef]
- Ambrosini, G.L. Childhood dietary patterns and later obesity: A review of the evidence. Proc. Nutr. Soc. 2014, 73, 137–146. [Google Scholar] [CrossRef]
- Andersen, L.B.; Sardinha, L.B.; Froberg, K.; Riddoch, C.J.; Page, A.S.; Anderssen, S.A. Fitness, fatness and clustering of cardiovascular risk factors in children from Denmark, Estonia and Portugal: The European Youth Heart Study. Int. J. Pediatr. Obes. 2008, 3, 58–66. [Google Scholar] [CrossRef]
- Gaesser, G.A.; Tucker, W.J.; Jarrett, C.L.; Angadi, S.S. Fitness versus Fatness: Which Influences Health and Mortality Risk the Most? Curr. Sports Med. Rep. 2015, 14, 327–332. [Google Scholar] [CrossRef]
- Lavie, C.J.; McAuley, P.A.; Church, T.S.; Milani, R.V.; Blair, S.N. Obesity and cardiovascular diseases: Implications regarding fitness, fatness, and severity in the obesity paradox. J. Am. Coll. Cardiol. 2014, 63, 1345–1354. [Google Scholar] [CrossRef] [PubMed] [Green Version]
- Olshansky, S.J.; Passaro, D.J.; Hershow, R.C.; Layden, J.; Carnes, B.A.; Brody, J.; Hayflick, L.; Butler, R.N.; Allison, D.B.; Ludwig, D.S. A Potential Decline in Life Expectancy in the United States in the 21st Century. N. Engl. J. Med. 2005, 352, 1138–1145. [Google Scholar] [CrossRef] [PubMed] [Green Version]
- Lang, J.J.; Tremblay, M.S.; Léger, L.; Olds, T.; Tomkinson, G.R. International variability in 20 m shuttle run performance in children and youth: Who are the fittest from a 50-country comparison? A systematic literature review with pooling of aggregate results. Br. J. Sports Med. 2018, 52, 276. [Google Scholar] [CrossRef]
- Arnaoutis, G.; Georgoulis, M.; Psarra, G.; Milkonidou, A.; Panagiotakos, D.B.; Kyriakou, D.; Bellou, E.; Tambalis, K.D.; Sidossis, L.S. Association of Anthropometric and Lifestyle Parameters with Fitness Levels in Greek Schoolchildren: Results from the EYZHN Program. Front. Nutr. 2018, 5, 10. [Google Scholar] [CrossRef] [PubMed] [Green Version]
- Flynn, M.A.T.; McNeil, D.A.; Maloff, B.; Mutasingwa, D.; Wu, M.; Ford, C.; Tough, S.C. Reducing obesity and related chronic disease risk in children and youth: A synthesis of evidence with “best practice” recommendations. Obes. Rev. 2006, 7, 7–66. [Google Scholar] [CrossRef] [PubMed]
- Sofi, F.; Cesari, F.; Abbate, R.; Gensini, G.F.; Casini, A.; Transmission, P.P. Adherence to Mediterranean diet and health status: Meta-analysis. BMJ 2014, 337, 333–340. [Google Scholar] [CrossRef] [Green Version]
- Serra-Majem, L.; Román-Viñas, B.; Sanchez-Villegas, A.; Guasch-Ferré, M.; Corella, D.; La Vecchia, C. Benefits of the Mediterranean diet: Epidemiological and molecular aspects. Mol. Asp. Med. 2019, 67, 1–55. [Google Scholar] [CrossRef]
- García Cabrera, S.; Herrera Fernández, N.; Rodríguez Hernández, C.; Nissensohn, M.; Román-Viñas, B.; Serra-Majem, L. Prevalence of Low Adherence To the Mediterranean Diet in Children and Young; a Systematic Review. Nutr. Hosp. 2015, 32, 2390–2399. [Google Scholar] [CrossRef]
- Tosti, V.; Bertozzi, B.; Fontana, L. Health Benefits of the Mediterranean Diet: Metabolic and Molecular Mechanisms. J. Gerontol. Ser. A 2018, 73, 318–326. [Google Scholar] [CrossRef] [Green Version]
- Sperber, A.D. Translation and validation of study instruments for cross-cultural research. Gastroenterology 2004, 126, S124–S128. [Google Scholar] [CrossRef]
- Wilson, P.M.; Rodgers, W.M.; Fraser, S.N. Examining the psychometric properties of the behavioral regulation in exercise questionnaire. Meas. Phys. Educ. Exerc. Sci. 2002, 6, 1–21. [Google Scholar] [CrossRef] [Green Version]
- Ruiz, J.R.; Castro-Piñero, J.; España-Romero, V.; Artero, E.G.; Ortega, F.B.; Cuenca, M.A.M.; Enez-Pavón, D.J.; Chillón, P.; Girela-Rejón, M.J.; Mora, J.; et al. Field-based fitness assessment in young people: The ALPHA health-related fitness test battery for children and adolescents. Br. J. Sports Med. 2011, 45, 518–524. [Google Scholar] [CrossRef] [PubMed]
- Galan-Lopez, P.; Ries, F.; Gisladottir, T.; Domínguez, R.; Sánchez-Oliver, A.J. Healthy Lifestyle: Relationship between Mediterranean Diet, Body Composition and Physical Fitness in 13 to 16-Years Old Icelandic Students. Int. J. Environ. Res. Public Health 2018, 15, 2632. [Google Scholar] [CrossRef] [PubMed] [Green Version]
- Galan-Lopez, P.; Sánchez-Oliver, A.J.; Ries, F.; González-Jurado, J.A. Mediterranean Diet, Physical Fitness and Body Composition in Sevillian Adolescents: A Healthy Lifestyle. Nutrients 2019, 11, 2009. [Google Scholar] [CrossRef] [PubMed] [Green Version]
- Moreno, L.A.; Mesana, M.I.; González-Gross, M.; Gil, C.M.; Fleta, J.; Wärnberg, J.; Ruiz, J.R.; Sarría, A.; Marcos, A.; Bueno, M.; et al. Anthropometric body fat composition reference values in Spanish adolescents. The AVENA Study. Eur. J. Clin. Nutr. 2006, 60, 191–196. [Google Scholar] [CrossRef] [Green Version]
- Moreno, L.A.; Mesana, M.I.; González-Gross, M.; Gil, C.M.; Ortega, F.B.; Fleta, J.; Wärnberg, J.; León, J.F.; Marcos, A.; Bueno, M.; et al. Body fat distribution reference standards in Spanish adolescents: The AVENA Study. Int. J. Obes. 2007, 31, 1798–1805. [Google Scholar] [CrossRef] [Green Version]
- Gómez-Martínez, S.; Martínez-Gómez, D.; Perez de Heredia, F.; Romeo, J.; Cuenca-Garcia, M.; Martín-Matillas, M.; Castillo, M.; Rey-López, J.-P.; Vicente-Rodriguez, G.; Moreno, L.; et al. Eating habits and total and abdominal fat in Spanish adolescents: Influence of physical activity. The AVENA study. J. Adolesc. Health 2012, 50, 403–409. [Google Scholar] [CrossRef]
- Jiménez-Pavón, D.; Ortega, F.B.; Ruiz, J.R.; Chillón, P.; Castillo, R.; Artero, E.G.; Martinez-Gómez, D.; Vicente-Rodriguez, G.; Rey-López, J.P.; Gracia, L.A.; et al. Influence of socioeconomic factors on fitness and fatness in Spanish adolescents: The AVENA study. Int. J. Pediatr. Obes. 2010, 5, 467–473. [Google Scholar] [CrossRef]
- Artero, E.G.; España-Romero, V.; Ortega, F.B.; Jiménez-Pavón, D.; Ruiz, J.R.; Vicente-Rodríguez, G.; Bueno, M.; Marcos, A.; Gómez-Martínez, S.; Urzanqui, A.; et al. Health-related fitness in adolescents: Underweight, and not only overweight, as an influencing factor. The AVENA study. Scand. J. Med. Sci. Sports 2009, 20, 418–427. [Google Scholar] [CrossRef]
- Vicente-Rodríguez, G.; Rey-López, J.P.; Martín-Matillas, M.; Moreno, L.A.; Wärnberg, J.; Redondo, C.; Tercedor, P.; Delgado, M.; Marcos, A.; Castillo, M.; et al. AVENA Study Group Television watching, videogames, and excess of body fat in Spanish adolescents: The AVENA study. Nutrition 2008, 24, 654–662. [Google Scholar] [CrossRef]
- Jiménez-Pavón, D.; Castillo, M.J.; Moreno, L.A.; Kafatos, A.; Manios, Y.; Kondaki, K.; Béghin, L.; Zaccaria, M.; de Henauw, S.; Widhalm, K.; et al. Helena Study Group Fitness and fatness are independently associated with markers of insulin resistance in European adolescents; the HELENA study. Int. J. Pediatr. Obes. 2011, 6, 253–260. [Google Scholar] [CrossRef] [PubMed] [Green Version]
- Labayen, I.; Ruiz, J.R.; Ortega, F.B.; Huybrechts, I.; Rodríguez, G.; Jiménez-Pavón, D.; Roccaldo, R.; Nova, E.; Widhalm, K.; Kafatos, A.; et al. High fat diets are associated with higher abdominal adiposity regardless of physical activity in adolescents; the HELENA study. Clin. Nutr. 2014, 33, 859–866. [Google Scholar] [CrossRef] [PubMed]
- Martinez-Gomez, D.; Moreno, L.A.; Romeo, J.; Rey-López, P.; Castillo, R.; Cabero, M.J.; Vicente-Rodriguez, G.; Gutiérrez, A.; Veiga, O.L. Combined influence of lifestyle risk factors on body fat in Spanish adolescents--the Avena study. Obes. Facts 2011, 4, 105–111. [Google Scholar] [CrossRef] [PubMed] [Green Version]
- Galan-Lopez, P.; Domínguez, R.; Pihu, M.; Gísladóttir, T.; Sánchez-Oliver, A.J.; Ries, F. Evaluation of Physical Fitness, Body Composition, and Adherence to Mediterranean Diet in Adolescents from Estonia: The AdolesHealth Study. Int. J. Environ. Res. Public Health 2019, 16, 4479. [Google Scholar] [CrossRef] [PubMed] [Green Version]
- Grosso, G.; Marventano, S.; Buscemi, S.; Scuderi, A.; Matalone, M.; Platania, A.; Giorgianni, G.; Rametta, S.; Nolfo, F.; Galvano, F.; et al. Factors Associated with Adherence to the Mediterranean Diet among Adolescents Living in Sicily, Southern Italy. Nutrients 2013, 5, 4908–4923. [Google Scholar] [CrossRef] [PubMed] [Green Version]
- Pearson, N.; Haycraft, E.; Johnston, J.P.; Atkin, A.J. Sedentary behaviour across the primary-secondary school transition: A systematic review. Prev. Med. 2017, 94, 40–47. [Google Scholar] [CrossRef] [Green Version]
- Moreno, L.A.; Kersting, M.; de Henauw, S.; González-Gross, M.; Sichert-Hellert, W.; Matthys, C.; Mesana, M.I.; Ross, N. How to measure dietary intake and food habits in adolescence: The European perspective. Int. J. Obes. 2005, 29 (suppl. 2), S66–S77. [Google Scholar] [CrossRef] [Green Version]
- Archero, F.; Ricotti, R.; Solito, A.; Carrera, D.; Civello, F.; Di Bella, R.; Bellone, S.; Prodam, F. Adherence to the Mediterranean Diet among School Children and Adolescents Living in Northern Italy and Unhealthy Food Behaviors Associated to Overweight. Nutrients 2018, 10, 1322. [Google Scholar] [CrossRef] [Green Version]
- Grosso, G.; Galvano, F. Mediterranean diet adherence in children and adolescents in southern European countries. NFS J. 2016, 3, 13–19. [Google Scholar] [CrossRef] [Green Version]
- Mariscal-Arcas, M.; Romaguera, D.; Rivas, A.; Feriche, B.; Pons, A.; Tur, J.A.; Olea-Serrano, F. Diet quality of young people in southern Spain evaluated by a Mediterranean adaptation of the Diet Quality Index-International (DQI-I). Br. J. Nutr. 2007, 98, 1267–1273. [Google Scholar] [CrossRef]
- Mariscal-Arcas, M.; Rivas, A.; Velasco, J.; Ortega, M.; Caballero, A.M.; Olea-Serrano, F. Evaluation of the Mediterranean Diet Quality Index (KIDMED) in children and adolescents in Southern Spain. Public Health Nutr. 2009, 12, 1408–1412. [Google Scholar] [CrossRef] [PubMed] [Green Version]
- Grosso, G.; Mistretta, A.; Marventano, S.; Purrello, A.; Vitaglione, P.; Calabrese, G.; Drago, F.; Galvano, F. Beneficial effects of the Mediterranean diet on metabolic syndrome. Curr. Pharm. Des. 2014, 20, 5039–5044. [Google Scholar] [CrossRef] [PubMed]
- López-Alarcón, M.; Perichart-Perera, O.; Flores-Huerta, S.; Inda-Icaza, P.; Rodríguez-Cruz, M.; Armenta-Álvarez, A.; Bram-Falcón, M.T.; Mayorga-Ochoa, M. Excessive Refined Carbohydrates and Scarce Micronutrients Intakes Increase Inflammatory Mediators and Insulin Resistance in Prepubertal and Pubertal Obese Children Independently of Obesity. Mediat. Inflamm. 2014, 2014, 1–7. [Google Scholar] [CrossRef] [PubMed]
- Bradley, P. Refined carbohydrates, phenotypic plasticity and the obesity epidemic. Med. Hypotheses 2019, 131. [Google Scholar] [CrossRef]
- Giacco, R.; Della Pepa, G.; Luongo, D.; Riccardi, G. Whole grain intake in relation to body weight: From epidemiological evidence to clinical trials. Nutr. Metab. Cardiovasc. Dis. 2011, 21, 901–908. [Google Scholar] [CrossRef]
- O’Neil, C.E.; Zanovec, M.; Cho, S.S.; Nicklas, T.A. Whole grain and fiber consumption are associated with lower body weight measures in US adults: National Health and Nutrition Examination Survey 1999–2004. Nutr. Res. 2010, 30, 815–822. [Google Scholar] [CrossRef]
- Sette, S.; D’Addezio, L.; Piccinelli, R.; Hopkins, S.; Le Donne, C.; Ferrari, M.; Mistura, L.; Turrini, A. Intakes of whole grain in an Italian sample of children, adolescents and adults. Eur. J. Nutr. 2017, 56, 521–533. [Google Scholar] [CrossRef] [Green Version]
- Kamar, M.; Evans, C.; Hugh-Jones, S. Factors influencing adolescent whole grain intake: A theory-based qualitative study. Appetite 2016, 101, 125–133. [Google Scholar] [CrossRef] [Green Version]
- Larson, N.I.; Neumark-Sztainer, D.; Story, M.; Burgess-Champoux, T. Whole-Grain Intake Correlates among Adolescents and Young Adults: Findings from Project EAT. J. Am. Diet. Assoc. 2010, 110, 230–237. [Google Scholar] [CrossRef]
- Hur, I.Y.; Reicks, M. Relationship between Whole-Grain Intake, Chronic Disease Risk Indicators, and Weight Status among Adolescents in the National Health and Nutrition Examination Survey, 1999–2004. J. Acad. Nutr. Diet. 2012, 112, 46–55. [Google Scholar] [CrossRef]
- Zhao, W.; Tang, H.; Yang, X.; Luo, X.; Wang, X.; Shao, C.; He, J. Fish Consumption and Stroke Risk: A Meta-Analysis of Prospective Cohort Studies. J. Stroke Cerebrovasc. Dis. 2019, 28, 604–611. [Google Scholar] [CrossRef] [PubMed]
- Xun, P.; Qin, B.; Song, Y.; Nakamura, Y.; Kurth, T.; Yaemsiri, S.; Djousse, L.; He, K. Fish consumption and risk of stroke and its subtypes: Accumulative evidence from a meta-analysis of prospective cohort studies. Eur. J. Clin. Nutr. 2012, 66, 1199–1207. [Google Scholar] [CrossRef] [PubMed] [Green Version]
- Lu, L.; Xun, P.; Wan, Y.; He, K.; Cai, W. Long-term association between dairy consumption and risk of childhood obesity: A systematic review and meta-analysis of prospective cohort studies. Eur. J. Clin. Nutr. 2016, 70, 414–423. [Google Scholar] [CrossRef] [PubMed]
- Kang, K.; Sotunde, O.F.; Weiler, H.A. Effects of Milk and Milk-Product Consumption on Growth among Children and Adolescents Aged 6–18 Years: A Meta-Analysis of Randomized Controlled Trials. Adv. Nutr. 2019, 10, 250–261. [Google Scholar] [CrossRef]
- Wrotniak, B.H.; Georger, L.; Hill, D.L.; Zemel, B.S.; Stettler, N. Association of dairy intake with weight change in adolescents undergoing obesity treatment. J. Public Health 2019, 41, 338–345. [Google Scholar] [CrossRef]
- Zheng, M.; Rangan, A.; Olsen, N.J.; Andersen, L.B.; Wedderkopp, N.; Kristensen, P.; Grøntved, A.; Ried-Larsen, M.; Lempert, S.M.; Allman-Farinelli, M.; et al. Substituting sugar-sweetened beverages with water or milk is inversely associated with body fatness development from childhood to adolescence. Nutrition 2015, 31, 38–44. [Google Scholar] [CrossRef]
- Estruch, R.; Ros, E.; Salas-Salvadó, J.; Covas, M.-I.; Corella, D.; Arós, F.; Gómez-Gracia, E.; Ruiz-Gutiérrez, V.; Fiol, M.; Lapetra, J.; et al. Primary Prevention of Cardiovascular Disease with a Mediterranean Diet Supplemented with Extra-Virgin Olive Oil or Nuts. N. Engl. J. Med. 2018, 378, e34. [Google Scholar] [CrossRef]
- Eslami, O.; Shidfar, F.; Dehnad, A. Inverse association of long-term nut consumption with weight gain and risk of overweight/obesity: A systematic review. Nutr. Res. 2019, 68, 1–8. [Google Scholar] [CrossRef]
- Hebden, L.; O’Leary, F.; Rangan, A.; Singgih Lie, E.; Hirani, V.; Allman-Farinelli, M. Fruit consumption and adiposity status in adults: A systematic review of current evidence. Crit. Rev. Food Sci. Nutr. 2017, 57, 2526–2540. [Google Scholar] [CrossRef]
- Fardet, A.; Richonnet, C.; Mazur, A. Association between consumption of fruit or processed fruit and chronic diseases and their risk factors: A systematic review of meta-analyses. Nutr. Rev. 2019, 77, 376–387. [Google Scholar] [CrossRef]
- Guyenet, S.J. Impact of Whole, Fresh Fruit Consumption on Energy Intake and Adiposity: A Systematic Review. Front. Nutr. 2019, 6, 66. [Google Scholar] [CrossRef] [PubMed] [Green Version]
- Schwingshackl, L.; Hoffmann, G.; Kalle-Uhlmann, T.; Arregui, M.; Buijsse, B.; Boeing, H. Fruit and Vegetable Consumption and Changes in Anthropometric Variables in Adult Populations: A Systematic Review and Meta-Analysis of Prospective Cohort Studies. PLoS ONE 2015, 10, e0140846. [Google Scholar] [CrossRef] [PubMed]
- Maillot, M.; Vieux, F.; Rehm, C.D.; Rose, C.M.; Drewnowski, A. Consumption Patterns of Milk and 100% Juice in Relation to Diet Quality and Body Weight Among United States Children: Analyses of NHANES 2011-16 Data. Front. Nutr. 2019, 6, 117. [Google Scholar] [CrossRef] [PubMed] [Green Version]
- Neri, D.; Martinez-Steele, E.; Monteiro, C.A.; Levy, R.B. Consumption of ultra-processed foods and its association with added sugar content in the diets of US children, NHANES 2009–2014. Pediatr. Obes. 2019, e12563. [Google Scholar] [CrossRef] [PubMed]
- Vandevijvere, S.; Jaacks, L.M.; Monteiro, C.A.; Moubarac, J.-C.; Girling-Butcher, M.; Lee, A.C.; Pan, A.; Bentham, J.; Swinburn, B. Global trends in ultraprocessed food and drink product sales and their association with adult body mass index trajectories. Obes. Rev. 2019. [Google Scholar] [CrossRef]
- Mistry, S.K.; Puthussery, S. Risk factors of overweight and obesity in childhood and adolescence in South Asian countries: A systematic review of the evidence. Public Health 2015, 129, 200–209. [Google Scholar] [CrossRef]
- Ludwig, D.S.; Peterson, K.E.; Gortmaker, S.L. Relation between consumption of sugar-sweetened drinks and childhood obesity: A prospective, observational analysis. Lancet 2001, 357, 505–508. [Google Scholar] [CrossRef]
- Tambalis, K.D.; Panagiotakos, D.B.; Psarra, G.; Sidossis, L.S. Association of cardiorespiratory fitness levels with dietary habits and lifestyle factors in schoolchildren. Appl. Physiol. Nutr. Metab. 2019, 44, 539–545. [Google Scholar] [CrossRef]
- Lassi, Z.S.; Moin, A.; Das, J.K.; Salam, R.A.; Bhutta, Z.A. Systematic review on evidence-based adolescent nutrition interventions. Ann. N. Y. Acad. Sci. 2017, 1393, 34–50. [Google Scholar] [CrossRef] [Green Version]
- Moreno, L.A.; Gottrand, F.; Huybrechts, I.; Ruiz, J.R.; González-Gross, M.; DeHenauw, S.; HELENA Study Group. Nutrition and lifestyle in european adolescents: The HELENA (Healthy Lifestyle in Europe by Nutrition in Adolescence) study. Adv. Nutr. 2014, 5, 615S–623S. [Google Scholar] [CrossRef] [Green Version]
- Hallström, L.; Labayen, I.; Ruiz, J.R.; Patterson, E.; Vereecken, C.A.; Breidenassel, C.; Gottrand, F.; Huybrechts, I.; Manios, Y.; Mistura, L.; et al. HELENA Study Group Breakfast consumption and CVD risk factors in European adolescents: The HELENA (Healthy Lifestyle in Europe by Nutrition in Adolescence) Study. Public Health Nutr. 2013, 16, 1296–1305. [Google Scholar] [CrossRef] [PubMed] [Green Version]
- Blondin, S.A.; Anzman-Frasca, S.; Djang, H.C.; Economos, C.D. Breakfast consumption and adiposity among children and adolescents: An updated review of the literature. Pediatr. Obes. 2016, 11, 333–348. [Google Scholar] [CrossRef] [PubMed]
- Szajewska, H.; Ruszczynski, M. Systematic review demonstrating that breakfast consumption influences body weight outcomes in children and adolescents in Europe. Crit. Rev. Food Sci. Nutr. 2010, 50, 113–119. [Google Scholar] [CrossRef] [PubMed]
- Ells, L.J.; Rees, K.; Brown, T.; Mead, E.; Al-Khudairy, L.; Azevedo, L.; McGeechan, G.J.; Baur, L.; Loveman, E.; Clements, H.; et al. Interventions for treating children and adolescents with overweight and obesity: An overview of Cochrane reviews. Int. J. Obes. 2018, 42, 1823–1833. [Google Scholar] [CrossRef] [Green Version]
- Ortega, F.B.; Ruiz, J.R.; Castillo, M.J.; Sjöström, M. Physical fitness in childhood and adolescence: A powerful marker of health. Int. J. Obes. 2008, 32, 1–11. [Google Scholar] [CrossRef] [Green Version]
- Ruiz, J.R.; Castro-Piñero, J.; Artero, E.G.; Ortega, F.B.; Sjöström, M.; Suni, J.; Castillo, M.J. Predictive validity of health-related fitness in youth: A systematic review. Br. J. Sports Med. 2009, 43, 909–923. [Google Scholar] [CrossRef]
- Haffner, S.M. Abdominal adiposity and cardiometabolic risk: Do we have all the answers? Am. J. Med. 2007, 120. [Google Scholar] [CrossRef]
- Williams, P.T. Physical fitness and activity as separate heart disease risk factors: A meta-analysis. Med. Sci. Sports Exerc. 2001, 33, 754–761. [Google Scholar] [CrossRef]
- Gontarev, S.; Kalac, R.; Zivkovic, V.; Velickovska, L.A.; Telai, B. The association between high blood pressure, physical fitness and fatness in adolescents. Nutr. Hosp. 2017, 34, 35. [Google Scholar] [CrossRef]
- Tishukaj, F.; Shalaj, I.; Gjaka, M.; Ademi, B.; Ahmetxhekaj, R.; Bachl, N.; Tschan, H.; Wessner, B. Physical fitness and anthropometric characteristics among adolescents living in urban or rural areas of Kosovo. BMC Public Health 2017, 17, 711. [Google Scholar] [CrossRef]
- Lang, J.J.; Larouche, R.; Tremblay, M.S. The association between physical fitness and health in a nationally representative sample of Canadian children and youth aged 6 to 17 years. Health Promot. Chronic Dis. Prev. Can. Res. Policy Pract. 2019, 39, 104–111. [Google Scholar] [CrossRef] [PubMed]
- Joensuu, L.; Syväoja, H.; Kallio, J.; Kulmala, J.; Kujala, U.M.; Tammelin, T.H. Objectively measured physical activity, body composition and physical fitness: Cross-sectional associations in 9- to 15-year-old children. Eur. J. Sport Sci. 2018. [Google Scholar] [CrossRef] [PubMed] [Green Version]
- Garcia-Pastor, T.; Salinero, J.J.; Sanz-Frias, D.; Pertusa, G.; Del Coso, J. Body fat percentage is more associated with low physical fitness than with sedentarism and diet in male and female adolescents. Physiol. Behav. 2016, 165, 166–172. [Google Scholar] [CrossRef] [PubMed]
- Fernández, I.; Canet, O.; Giné-Garriga, M. Assessment of physical activity levels, fitness and perceived barriers to physical activity practice in adolescents: Cross-sectional study. Eur. J. Pediatr. 2017, 176, 57–65. [Google Scholar] [CrossRef] [PubMed]
- Gulías-González, R.; Martínez-Vizcaíno, V.; García-Prieto, J.C.; Díez-Fernández, A.; Olivas-Bravo, Á.; Sánchez-López, M. Excess of weight, but not underweight, is associated with poor physical fitness in children and adolescents from Castilla-La Mancha, Spain. Eur. J. Pediatr. 2014, 173, 727–735. [Google Scholar] [CrossRef] [PubMed]
- Marcovecchio, M.L.; Chiarelli, F. Obesity and growth during childhood and puberty. World Rev. Nutr. Diet. 2013, 106, 135–141. [Google Scholar] [CrossRef] [PubMed]
- Deforche, B.I.; De Bourdeaudhuij, I.M.; Tanghe, A.P. Attitude toward physical activity in normal-weight, overweight and obese adolescents. J. Adolesc. Health 2006, 38, 560–568. [Google Scholar] [CrossRef]
- Sattler, K.M.; Deane, F.P.; Tapsell, L.; Kelly, P.J. Gender differences in the relationship of weight-based stigmatisation with motivation to exercise and physical activity in overweight individuals. Health Psychol. Open 2018, 5. [Google Scholar] [CrossRef] [Green Version]

| Q1. Takes a fruit or fruit juice daily (+) | Q9. Has cereal or grains product for breakfast (+) |
| Q2. Has a second serving of fruit daily (+) | Q10. Regular nut consumption (≥2–3/week) (+) |
| Q3. Has fresh or cooked vegetables daily (+) | Q11. Uses of olive oil at home (+) |
| Q4. Has fresh or cooked vegetables more than 1/day (+) | Q12. Skips breakfast (−) |
| Q5. Regular fish consumption (at least 2–3/week) (+) | Q13. Has dairy product for breakfast (+) |
| Q6. Goes >1/week fast food restaurant (−) | Q14. Pastries/Commercially baked goods for breakfast (−) |
| Q7. Likes Pulses and eats more than 1/week (+) | Q15. Two yoghurts and/or 40 g cheese daily (+) |
| Q8. Consumes rice or pasta almost daily (≥5/week) (+) | Q16. Takes sweets and candy several times every day (−) |
| Variable | Gender | Waist | Percentage of Body Fat | BMI | |||||||||
|---|---|---|---|---|---|---|---|---|---|---|---|---|---|
| N-Owaist | Owaist | p-Value | ES | N-Ofat | Ofat | p-Value | ES | N-Oweight | Oweight | p-Value | ES | ||
| Age (years) | Boys | 14.98 ± 1.12 | 14.85 ± 1.18 | 0.142 | 0.11 | 14.98 ± 1.12 | 14.81 ± 1.18 | 0.82 | 0.15 | 14.99 ± 1.12 | 14.84 ± 1.17 | 0.070 | 0.13 |
| Girls | 14.93 ± 1.12 | 14.96 ± 1.10 | 0.783 | 0.03 | 14.93 ± 1.14 | 14.96 ± 1.06 | 0.713 | 0.03 | 14.86 ± 1.11 | 15.03 ± 1.10 | 0.072 | 0.15 | |
| Height (m) | Boys | 1.67 ± 0.11 | 1.70 ± 0.11 | 0.002 * | 0.27 | 1.68 ± 0.11 | 1.66 ± 0.11 | 0.052 | 0.18 | 1.68 ± 0.11 | 1.68 ± 0.10 | 0.288 | 0.00 |
| Girls | 1.60 ± 0.08 | 1.63 ± 0.07 | <0.001 * | 0.39 | 1.61 ± 0.08 | 1.60 ± 0.07 | 0.453 | 0.13 | 1.60 ± 0.08 | 1.61 ± 0.07 | 0.282 | 0.13 | |
| Weight (kg) | Boys | 56.13 ± 10.88 | 77.30 ± 15.70 | <0.001 * | 1.75 | 57.57 ± 12.09 | 76.12 ± 17.48 | <0.001 * | 1.4 | 55.25 ± 10.37 | 76.43 ± 14.87 | <0.001 * | 1.81 |
| Girls | 52.02 ± 8.30 | 69.36 ± 12.10 | <0.001 * | 1.87 | 51.11 ± 8.02 | 66.32 ± 11.87 | <0.001 * | 1.62 | 50.95 ± 7.43 | 68.94 ± 11.06 | <0.001 * | 2.1 | |
| Body mass index (kg/m2) | Boys | 19.92 ± 2.55 | 26.64 ± 4.11 | <0.001 * | 2.26 | 20.16 ± 2.26 | 27.23 ± 4.16 | <0.001 * | 2.62 | 19.51 ± 2.09 | 26.74 ± 3.50 | <0.001 * | 2.84 |
| Girls | 20.24 ± 2.57 | 26.32 ± 4.58 | <0.001 * | 1.95 | 19.69 ± 2.19 | 25.76 ± 4.01 | <0.001 * | 2.11 | 19.72 ± 2.00 | 26.56 ± 3.82 | <0.001 * | 2.61 | |
| Body fat (%) | Boys | 14.22 ± 5.18 | 25.82 ± 8.25 | <0.001 * | 1.93 | 13.97 ± 4.43 | 29.87 ± 5.82 | <0.001 * | 3.38 | 13.64 ± 4.64 | 25.62 ± 7.69 | <0.001 * | 2.13 |
| Girls | 24.22 ± 5.03 | 33.82 ± 5.95 | <0.001 * | 1.83 | 22.96 ± 3.94 | 33.81 ± 4.88 | <0.001 * | 2.55 | 23.55 ± 4.49 | 33.79 ± 5.39 | <0.001 * | 2.16 | |
| Waist (cm) | Boys | 70.80 ± 5.73 | 90.01 ± 8.76 | <0.001 * | 2.94 | 72.07 ± 7.17 | 89.11 ± 11.09 | <0.001 * | 2.13 | 70.72 ± 6.02 | 87.28 ± 10.06 | <0.001 * | 2.26 |
| Girls | 66.40 ± 4.70 | 83.09 ± 8.01 | <0.001 * | 2.98 | 66.35 ± 5.50 | 78.36 ± 9.42 | <0.001 * | 1.73 | 66.63 ± 5.69 | 79.36 ± 9.33 | <0.001 * | 1.85 | |
| KIDMED Question | R | Waist | Percentage of Body Fat | BMI | |||||||||
|---|---|---|---|---|---|---|---|---|---|---|---|---|---|
| N-Owaist (n = 696) | Owaist (n = 204) | p-Value | OR | N-Ofat (n = 737) | Ofat (n = 163) | p-Value | OR | N-Oweight (n = 659) | Oweight (n = 241) | p-Value | OR | ||
| Q1(+) | Yes | 70.5% | 64.2% | 0.101 | 1.25 (0.97–1.60) | 69.9% | 65.6% | 0.303 | 1.17 (0.88–1.57) | 70.7% | 64.7% | 0.088 | 1.22 (0.98–1.52) |
| Q2(+) | Yes | 50.7% | 42.2% | 0.032 * | 1.31 (1.02–1.67) | 49.84% | 44.2% | 0.196 | 1.20 (0.91–1.59) | 50.5% | 44.0% | 0.084 | 1.21 (0.98–1.51) |
| Q3(+) | Yes | 50.4% | 57.4% | 0.094 | 0.81 (0.631–1.03) | 52.4% | 50.3% | 0.665 | 1.07 (0.81–1.41) | 50.7% | 55.6% | 0.201 | 0.87 (0.70–1.08) |
| Q4(+) | Yes | 28.2% | 34.8% | 0.081 | 0.79 (0.62–1.02) | 29.3% | 31.3% | 0.636 | 0.93 (0.69–1.25) | 28.1% | 34.0% | 0.084 | 0.82 (0.65–1.03) |
| Q5(+) | Yes | 60.6% | 52.0% | 0.029 * | 1.31 (1.03–1.67) | 58.6% | 58.9% | 1.00 | 0.99 (0.75–1.31) | 59.5% | 56.4% | 0.445 | 1.10 (0.88–1.36) |
| Q6(−) | Yes | 32.6% | 27.9% | 0.231 | 0.84 (0.64–1.10) | 32.7% | 26.4% | 0.136 | 0.77 (0.57–1.07) | 33.5% | 26.1% | 0.035 * | 0.77 (0.60–0.99) |
| Q7(+) | Yes | 48.7% | 50.5% | 0.691 | 0.95 (0.74–1.21) | 47.9% | 54.6% | 0.141 | 0.80 (0.61–1.06) | 47.2% | 54.4% | 0.060 | 0.81 (0.65–1.00) |
| Q8(+) | Yes | 37.6% | 29.4% | 0.031 * | 1.34 (1.02–1.75) | 37.4% | 28.2% | 0.030 * | 1.42 (1.04–1.94) | 37.8% | 30.3% | 0.041 * | 1.28 (1.01–1.63) |
| Q9(+) | Yes | 80.2% | 78.9% | 0.692 | 1.06 (0.79–1.42) | 80.7% | 76.1% | 0.195 | 1.25 (0.91–1.72) | 79.8% | 80.1% | 1.00 | 0.99 (0.75–1.30) |
| Q10(+) | Yes | 40.2% | 38.7% | 0.745 | 1.05 (0.82–1.35) | 41.1% | 34.4% | 0.113 | 1.27 (0.95–1.70) | 42.3% | 33.2% | 0.014 * | 1.34 (1.06–1.69) |
| Q11(+) | Yes | 80.6% | 79.4% | 0.690 | 1.06 (0.79–1.43) | 79.8% | 82.8% | 0.446 | 0.85 (0.58–1.23) | 80.6% | 79.7% | 0.777 | 1.04 (0.80–1.36) |
| Q12(−) | Yes | 27.3% | 38.7% | 0.002 * | 1.48 (1.16–1.89) | 27.4% | 41.1% | 0.001 * | 1.64 (1.24–2.16) | 26.7% | 38.6% | 0.001 * | 1.47 (1.19–1.83) |
| Q13(+) | Yes | 80.3% | 75.0% | 0.117 | 1.26 (0.96–1.66) | 79.4% | 77.9% | 0.671 | 1.07 (0.77–1.50) | 79.7% | 77.6% | 0.517 | 1.09 (0.85–1.41) |
| Q14(−) | Yes | 34.6% | 27.0% | 0.040 * | 0.75 (0.57–0.99) | 34.7% | 24.5% | 0.013 * | 0.66 (0.48–0.92) | 35.1% | 27.0% | 0.025 * | 0.75 (0.59–0.97) |
| Q15(+) | Yes | 46.7% | 43.1% | 0.381 | 1.12 (0.88–1.43) | 46.1% | 44.8% | 0.795 | 1.05 (0.79–1.38) | 45.5% | 46.9% | 0.763 | 0.96 (0.77–1.19) |
| Q16(−) | Yes | 23.7% | 19.1% | 0.184 | 0.81 (0.59–1.10) | 24.7% | 13.5% | 0.002 * | 0.53 (0.35–0.81) | 24.3% | 18.3% | 0.059 | 0.76 (0.57–1.02) |
| KIDMED Question | R | Waist | Percentage of Body Fat | BMI | |||||||||
|---|---|---|---|---|---|---|---|---|---|---|---|---|---|
| N-Owaist (n = 636) | Owaist (n = 181) | p-Value | OR | N-Ofat (n = 562) | Ofat (n = 255) | p-Value | OR | N-Oweight (n = 594) | Oweight (n = 223) | p-Value | OR | ||
| Q1(+) | Yes | 69.2% | 75.1% | 0.139 | 0.79 (0.59–1.07) | 69.2% | 73.3% | 0.247 | 0.87 (0.69–1.10) | 70.0% | 71.7% | 0.667 | 0.94 (0.73–1.21) |
| Q2(+) | Yes | 44.3% | 56.9% | 0.003 * | 0.68 (0.52–0.88) | 43.8% | 54.5% | 0.005 * | 0.74 (0.61–0.91) | 44.8% | 53.4% | 0.034 * | 0.78 (0.62–0.98) |
| Q3(+) | Yes | 60.4% | 59.1% | 0.797 | 1.04 (0.80–1.35) | 58.9% | 62.7% | 0.317 | 0.89 (0.72–1.11) | 59.4% | 61.9% | 0.575 | 0.93 (0.74–1.17) |
| Q4(+) | Yes | 33.8% | 35.9% | 0.596 | 0.93 (0.71–1.22) | 33.3% | 36.5% | 0.382 | 0.91 (0.74–1.12) | 33.2% | 37.2% | 0.283 | 0.88 (0.70–1.11) |
| Q5(+) | Yes | 59.4% | 59.7% | 1.00 | 0.99 (0.76–1.29) | 57.8% | 63.1% | 0.166 | 0.86 (0.69–1.06) | 58.9% | 61.0% | 0.631 | 0.94 (0.75–1.18) |
| Q6(−) | Yes | 31.0% | 20.4% | 0.005 * | 0.64 (0.46–0.89) | 31.0% | 23.5% | 0.030 * | 0.77 (0.60–0.98) | 29.8% | 25.6% | 0.259 | 0.86 (0.66–1.10) |
| Q7(+) | Yes | 50.6% | 48.6% | 0.674 | 1.07 (0.82–1.38) | 49.5% | 51.8% | 0.547 | 0.94 (0.77–1.15) | 49.5% | 52.0% | 0.531 | 0.93 (0.74–1.16) |
| Q8(+) | Yes | 36.6% | 26.0% | 0.008 * | 1.49 (1.10–2.01) | 35.8% | 31.0% | 0.203 | 1.16 (0.93–1.45) | 36.0% | 29.6% | 0.098 | 1.24 (0.97–1.59) |
| Q9(+) | Yes | 73.6% | 66.9% | 0.091 | 1.28 (0.98–1.68) | 73.8% | 68.2% | 0.110 | 1.20 (0.97–1.49) | 73.9% | 67.3% | 0.066 | 1.26 (1.00–1.59) |
| Q10(+) | Yes | 33.8% | 32.0% | 0.721 | 1.06 (0.81–1.40) | 32.4% | 35.7% | 0.379 | 0.90 (0.73–1.11) | 33.8% | 32.3% | 0.739 | 1.05 (0.83–1.34) |
| Q11(+) | Yes | 83.2% | 84.5% | 0.734 | 0.93 (0.65–1.32) | 82.4% | 85.9% | 0.224 | 0.83 (0.62–1.12) | 83.0% | 84.8% | 0.598 | 0.91 (0.66–1.25) |
| Q12(−) | Yes | 36.8% | 40.9% | 0.339 | 1.14 (0.88–1.48) | 35.6% | 108% | 0.073 | 1.21 (0.99–1.49) | 36.0% | 42.2% | 0.124 | 1.20 (0.96–1.51) |
| Q13(+) | Yes | 75.5% | 66.9% | 0.022 * | 1.38 (1.06–1.80) | 75.3% | 69.8% | 0.104 | 1.20 (0.97–1.50) | 75.8% | 67.7% | 0.026 * | 1.33 (1.05–1.68) |
| Q14(−) | Yes | 31.4% | 23.8% | 0.053 | 0.74 (0.54–1.00) | 31.5% | 25.9% | 0.117 | 0.83 (0.65–1.05) | 31.0% | 26.5% | 0.229 | 0.85 (0.66–1.10) |
| Q15(+) | Yes | 37.4% | 33.7% | 0.383 | 1.14 (0.86–1.49) | 37.4% | 34.9% | 0.531 | 1.08 (0.87–1.33) | 37.9% | 33.2% | 0.222 | 1.16 (0.92–1.48) |
| Q16(−) | Yes | 27.4% | 14.9% | 0.001 * | 0.54 (0.37–0.78) | 27.4% | 18.4% | 0.006 * | 0.69 (0.53–0.91) | 27.1% | 17.9% | 0.006 * | 0.67 (0.50–0.91) |
| A-F Variable | Gender | Waist | Percentage of Body Fat | BMI | |||||||||
|---|---|---|---|---|---|---|---|---|---|---|---|---|---|
| N-Owaist | Owaist | p-Value | ES | N-Ofat | Ofat | p-Value | ES | N-Oweight | Oweight | p-Value | ES | ||
| Handgrip average (kg) | Boys | 28.4 ± 7.9 | 30.2 ± 8.3 | 0.005 * | 0.23 | 28.9 ± 8.0 | 28.3 ± 8.3 | 0.359 | 0.07 | 28.4 ± 7.7 | 29.9 ± 8.6 | 0.014 * | 0.19 |
| Girls | 22.5 ± 4.6 | 24.4 ± 4.5 | <0.001 * | 0.42 | 22.5 ± 4.5 | 23.8 ± 4.8 | <0.001 * | 0.07 | 22.4 ± 4.5 | 24.4 ± 4.7 | <0.001 * | 0.44 | |
| Jump (m) | Boys | 1.82 ± 0.31 | 1.61 ± 0.36 | <0.001 * | 0.65 | 1.82 ± 0.31 | 1.53 ± 0.31 | <0.001 * | 0.94 | 1.83 ± 0.31 | 1.62 ± 0.32 | <0.001 * | 0.67 |
| Girls | 1.49 ± 0.29 | 1.37 ± 0.30 | <0.001 * | 0.41 | 1.51 ± 0.29 | 1.35 ± 0.27 | <0.001 * | 0.56 | 1.50 ± 0.29 | 1.36 ± 0.28 | <0.001 * | 0.49 | |
| 4 × 10 m (s) | Boys | 11.6 ± 1.4 | 12.4 ± 1.4 | <0.001 * | 0.57 | 11.5 ± 1.4 | 12.8 ± 1.5 | <0.001 * | 0.92 | 11.5 ± 1.4 | 12.4 ± 1.4 | <0.001 * | 0.64 |
| Girls | 12.6 ± 1.3 | 13.2 ± 1.4 | <0.001 * | 0.45 | 12.5 ± 1.3 | 13.2 ± 1.3 | 0.030 * | 0.54 | 12.6 ± 1.3 | 13.2 ± 1.3 | <0.001 * | 0.46 | |
| Cardiorespiratory Fitness (stages) | Boys | 7.03 ± 2.45 | 5.06 ± 2.11 | <0.001 * | 0.83 | 7.04 ± 2.42 | 4.54 ± 1.85 | <0.001 * | 1.08 | 7.12 ± 2.43 | 5.11 ± 2.13 | <0.001 * | 0.85 |
| Girls | 5.03 ± 1.81 | 4.17 ± 1.48 | <0.001 * | 0.49 | 5.11 ± 1.81 | 4.25 ± 1.56 | <0.001 * | 0.50 | 5.06 ± 1.80 | 4.24 ± 1.58 | <0.001 * | 0.47 | |
© 2019 by the authors. Licensee MDPI, Basel, Switzerland. This article is an open access article distributed under the terms and conditions of the Creative Commons Attribution (CC BY) license (http://creativecommons.org/licenses/by/4.0/).
Share and Cite
Galan-Lopez, P.; Sanchez-Oliver, A.J.; Pihu, M.; Gísladóttír, T.; Domínguez, R.; Ries, F. Association between Adherence to the Mediterranean Diet and Physical Fitness with Body Composition Parameters in 1717 European Adolescents: The AdolesHealth Study. Nutrients 2020, 12, 77. https://doi.org/10.3390/nu12010077
Galan-Lopez P, Sanchez-Oliver AJ, Pihu M, Gísladóttír T, Domínguez R, Ries F. Association between Adherence to the Mediterranean Diet and Physical Fitness with Body Composition Parameters in 1717 European Adolescents: The AdolesHealth Study. Nutrients. 2020; 12(1):77. https://doi.org/10.3390/nu12010077
Chicago/Turabian StyleGalan-Lopez, Pablo, Antonio J. Sanchez-Oliver, Maret Pihu, Thórdís Gísladóttír, Raúl Domínguez, and Francis Ries. 2020. "Association between Adherence to the Mediterranean Diet and Physical Fitness with Body Composition Parameters in 1717 European Adolescents: The AdolesHealth Study" Nutrients 12, no. 1: 77. https://doi.org/10.3390/nu12010077
APA StyleGalan-Lopez, P., Sanchez-Oliver, A. J., Pihu, M., Gísladóttír, T., Domínguez, R., & Ries, F. (2020). Association between Adherence to the Mediterranean Diet and Physical Fitness with Body Composition Parameters in 1717 European Adolescents: The AdolesHealth Study. Nutrients, 12(1), 77. https://doi.org/10.3390/nu12010077