Life Cycle Assessment of Three Safe Drinking-Water Options in India: Boiled Water, Bottled Water, and Water Purified with a Domestic Reverse-Osmosis Device

 , ,
, ,
Abstract
1. Introduction
2. Materials and Methods
2.1. Goal and Scope Definition
- Tap water purified and desalinated using an in-home RO device connected to electricity.
- Store-bought purified and desalinated water provided in a 1 L polyethylene terephthalate (PET) bottle.
- Water boiled in a lidded steel pan (5 L) for 1 min to make it safe for consumption [8].
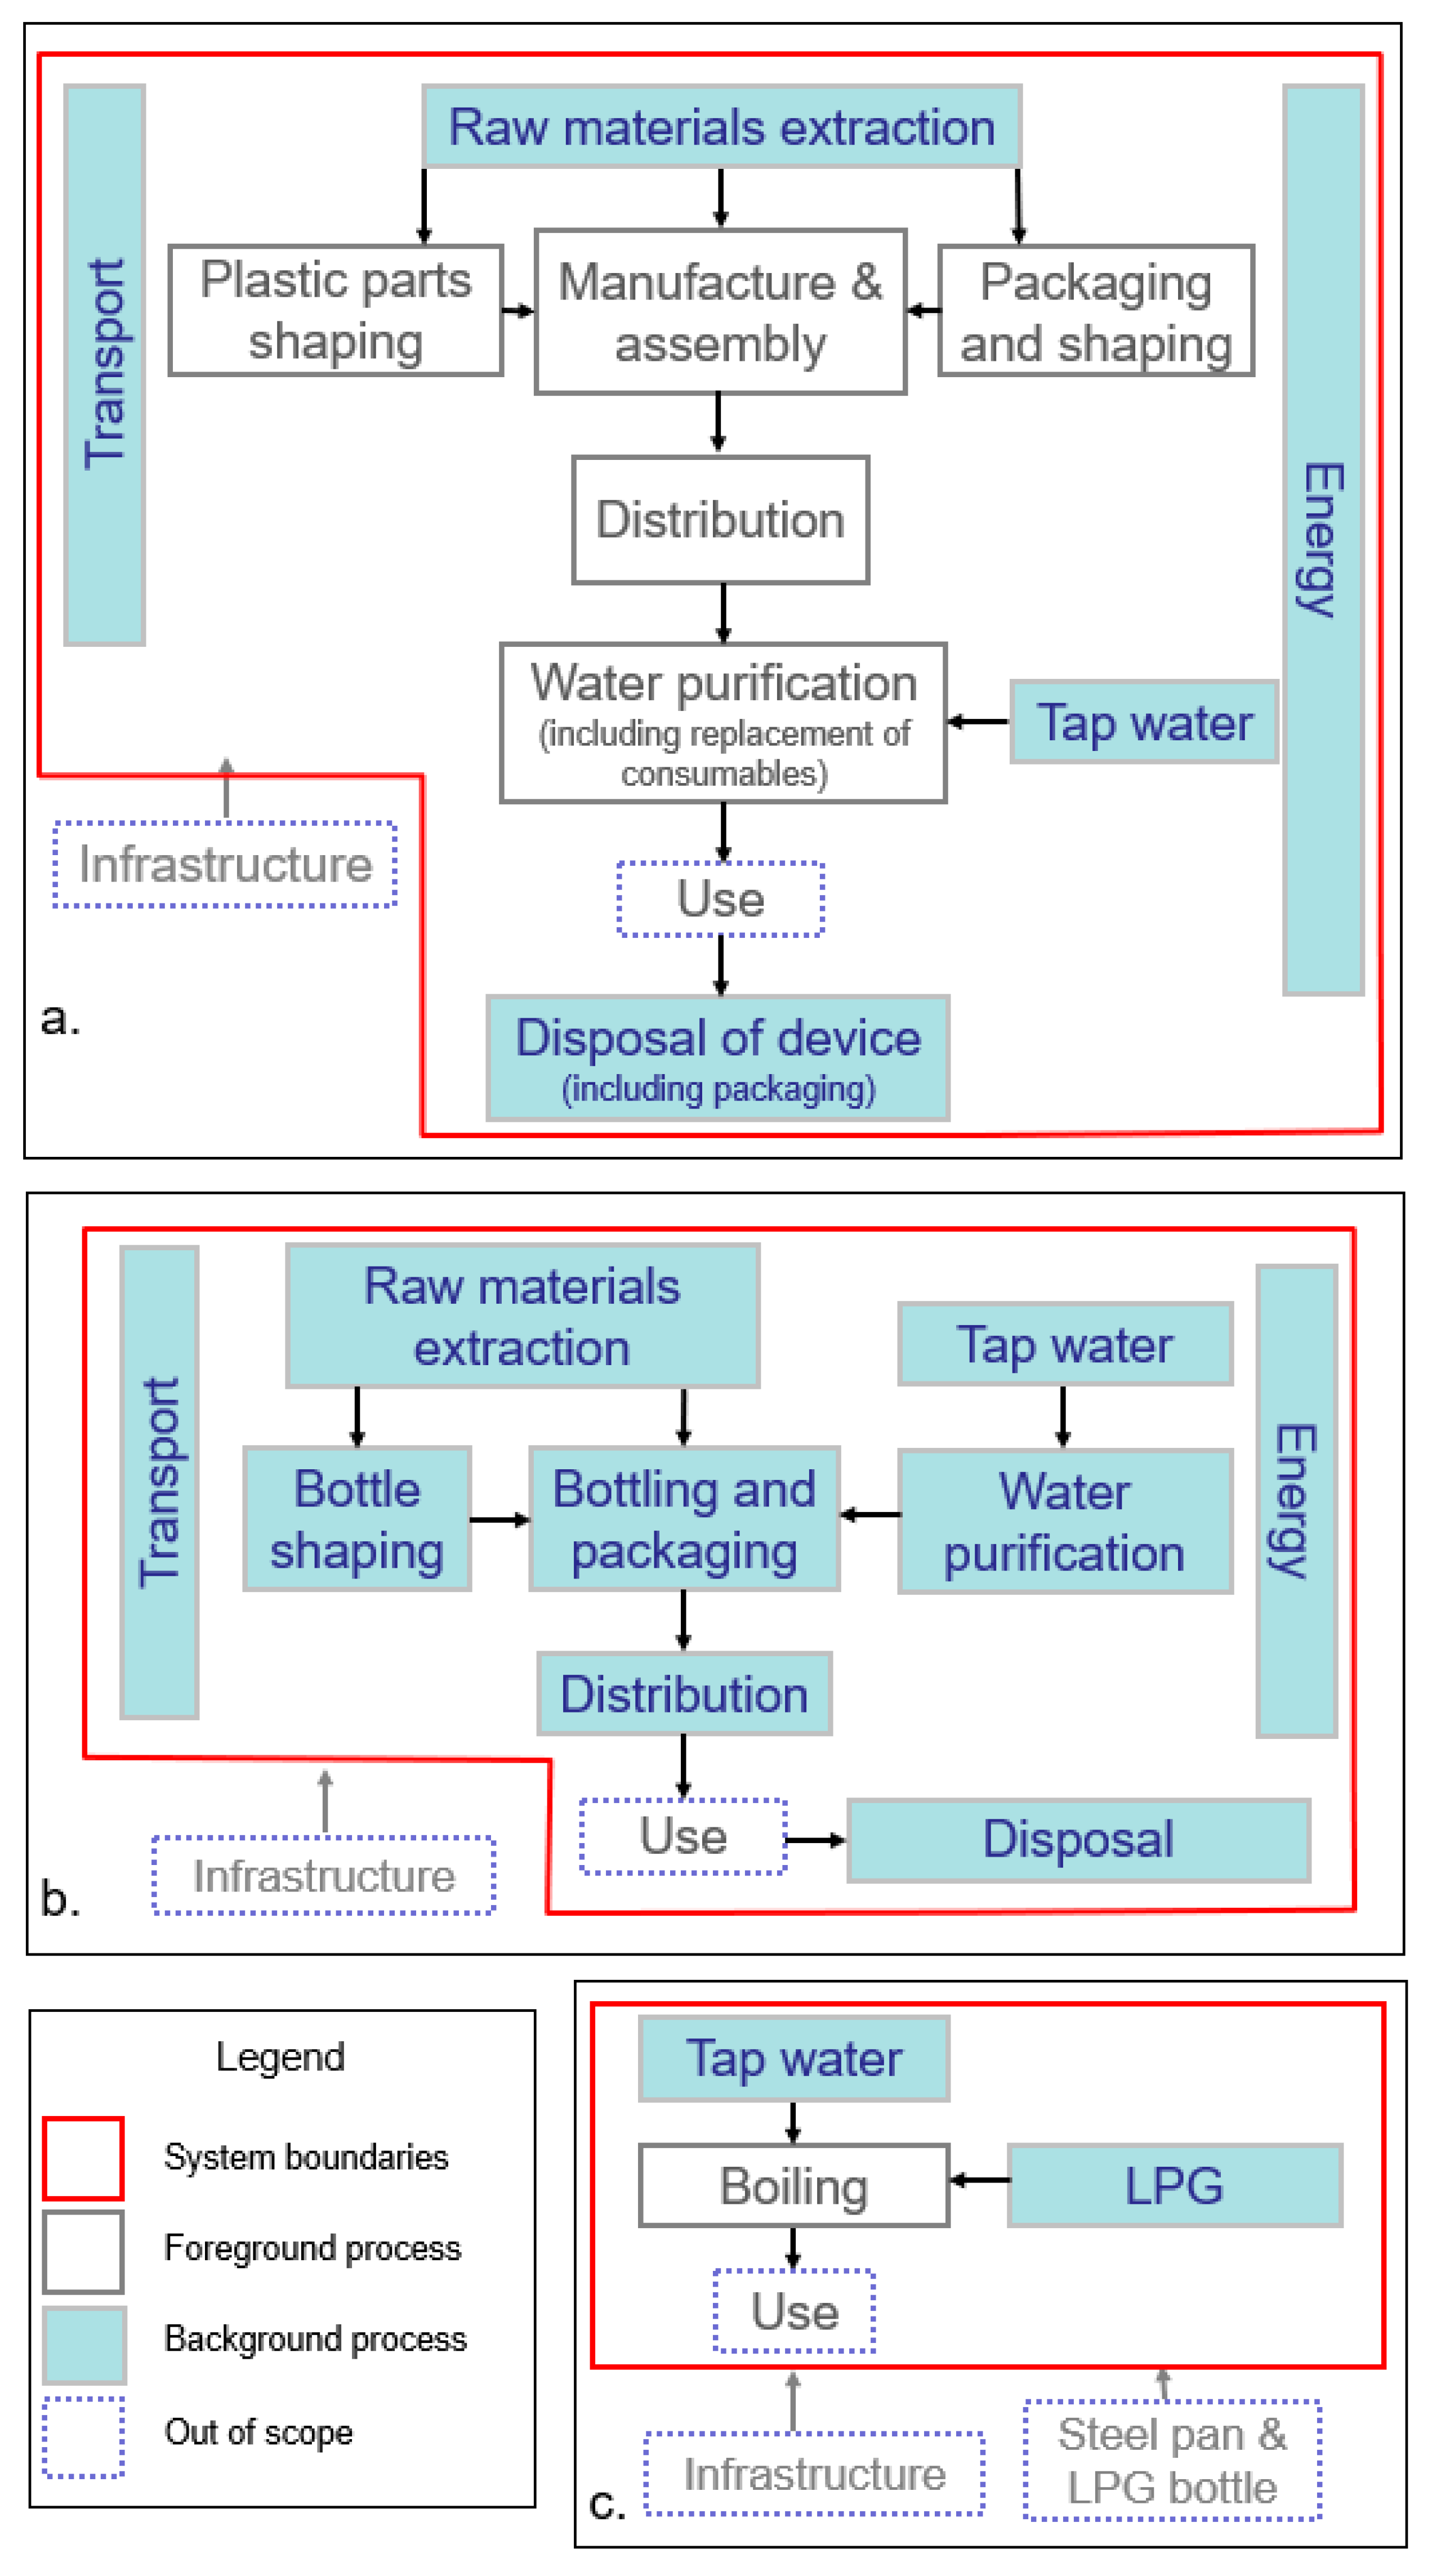
System Boundaries
- RO device. Includes primary data on the energy and material use for the molding and assembly of the device, consumables and its packaging, distribution of the device to retail, tap water production, water and electricity use of the device at home under typical conditions, disposal of the device, consumables and packaging.
- Bottled water. Includes tap water production, purification and desalination of tap water at the bottling plant, the manufacture and transport of empty bottles, the bottling and packaging operations, distribution to retail, and the disposal of bottle and other packaging after use.
- Boiled water. Covers the manufacturing, distribution and burning of Liquified Petroleum Gas (LPG), and tap water production. The impact contribution from both the lidded steel cooking pan and the steel LPG container are considered to be minimal—they are reused a large number of times for various cooking purposes and can last up to 15–20 years [9]. For this reason, they were excluded from the analysis.
2.2. Inventory Analysis
2.2.1. Process Flows of the Three Systems
2.2.2. Water Life Cycle Inventory
2.3. Impact Assessment
2.4. Sensitivity Analysis
3. Results
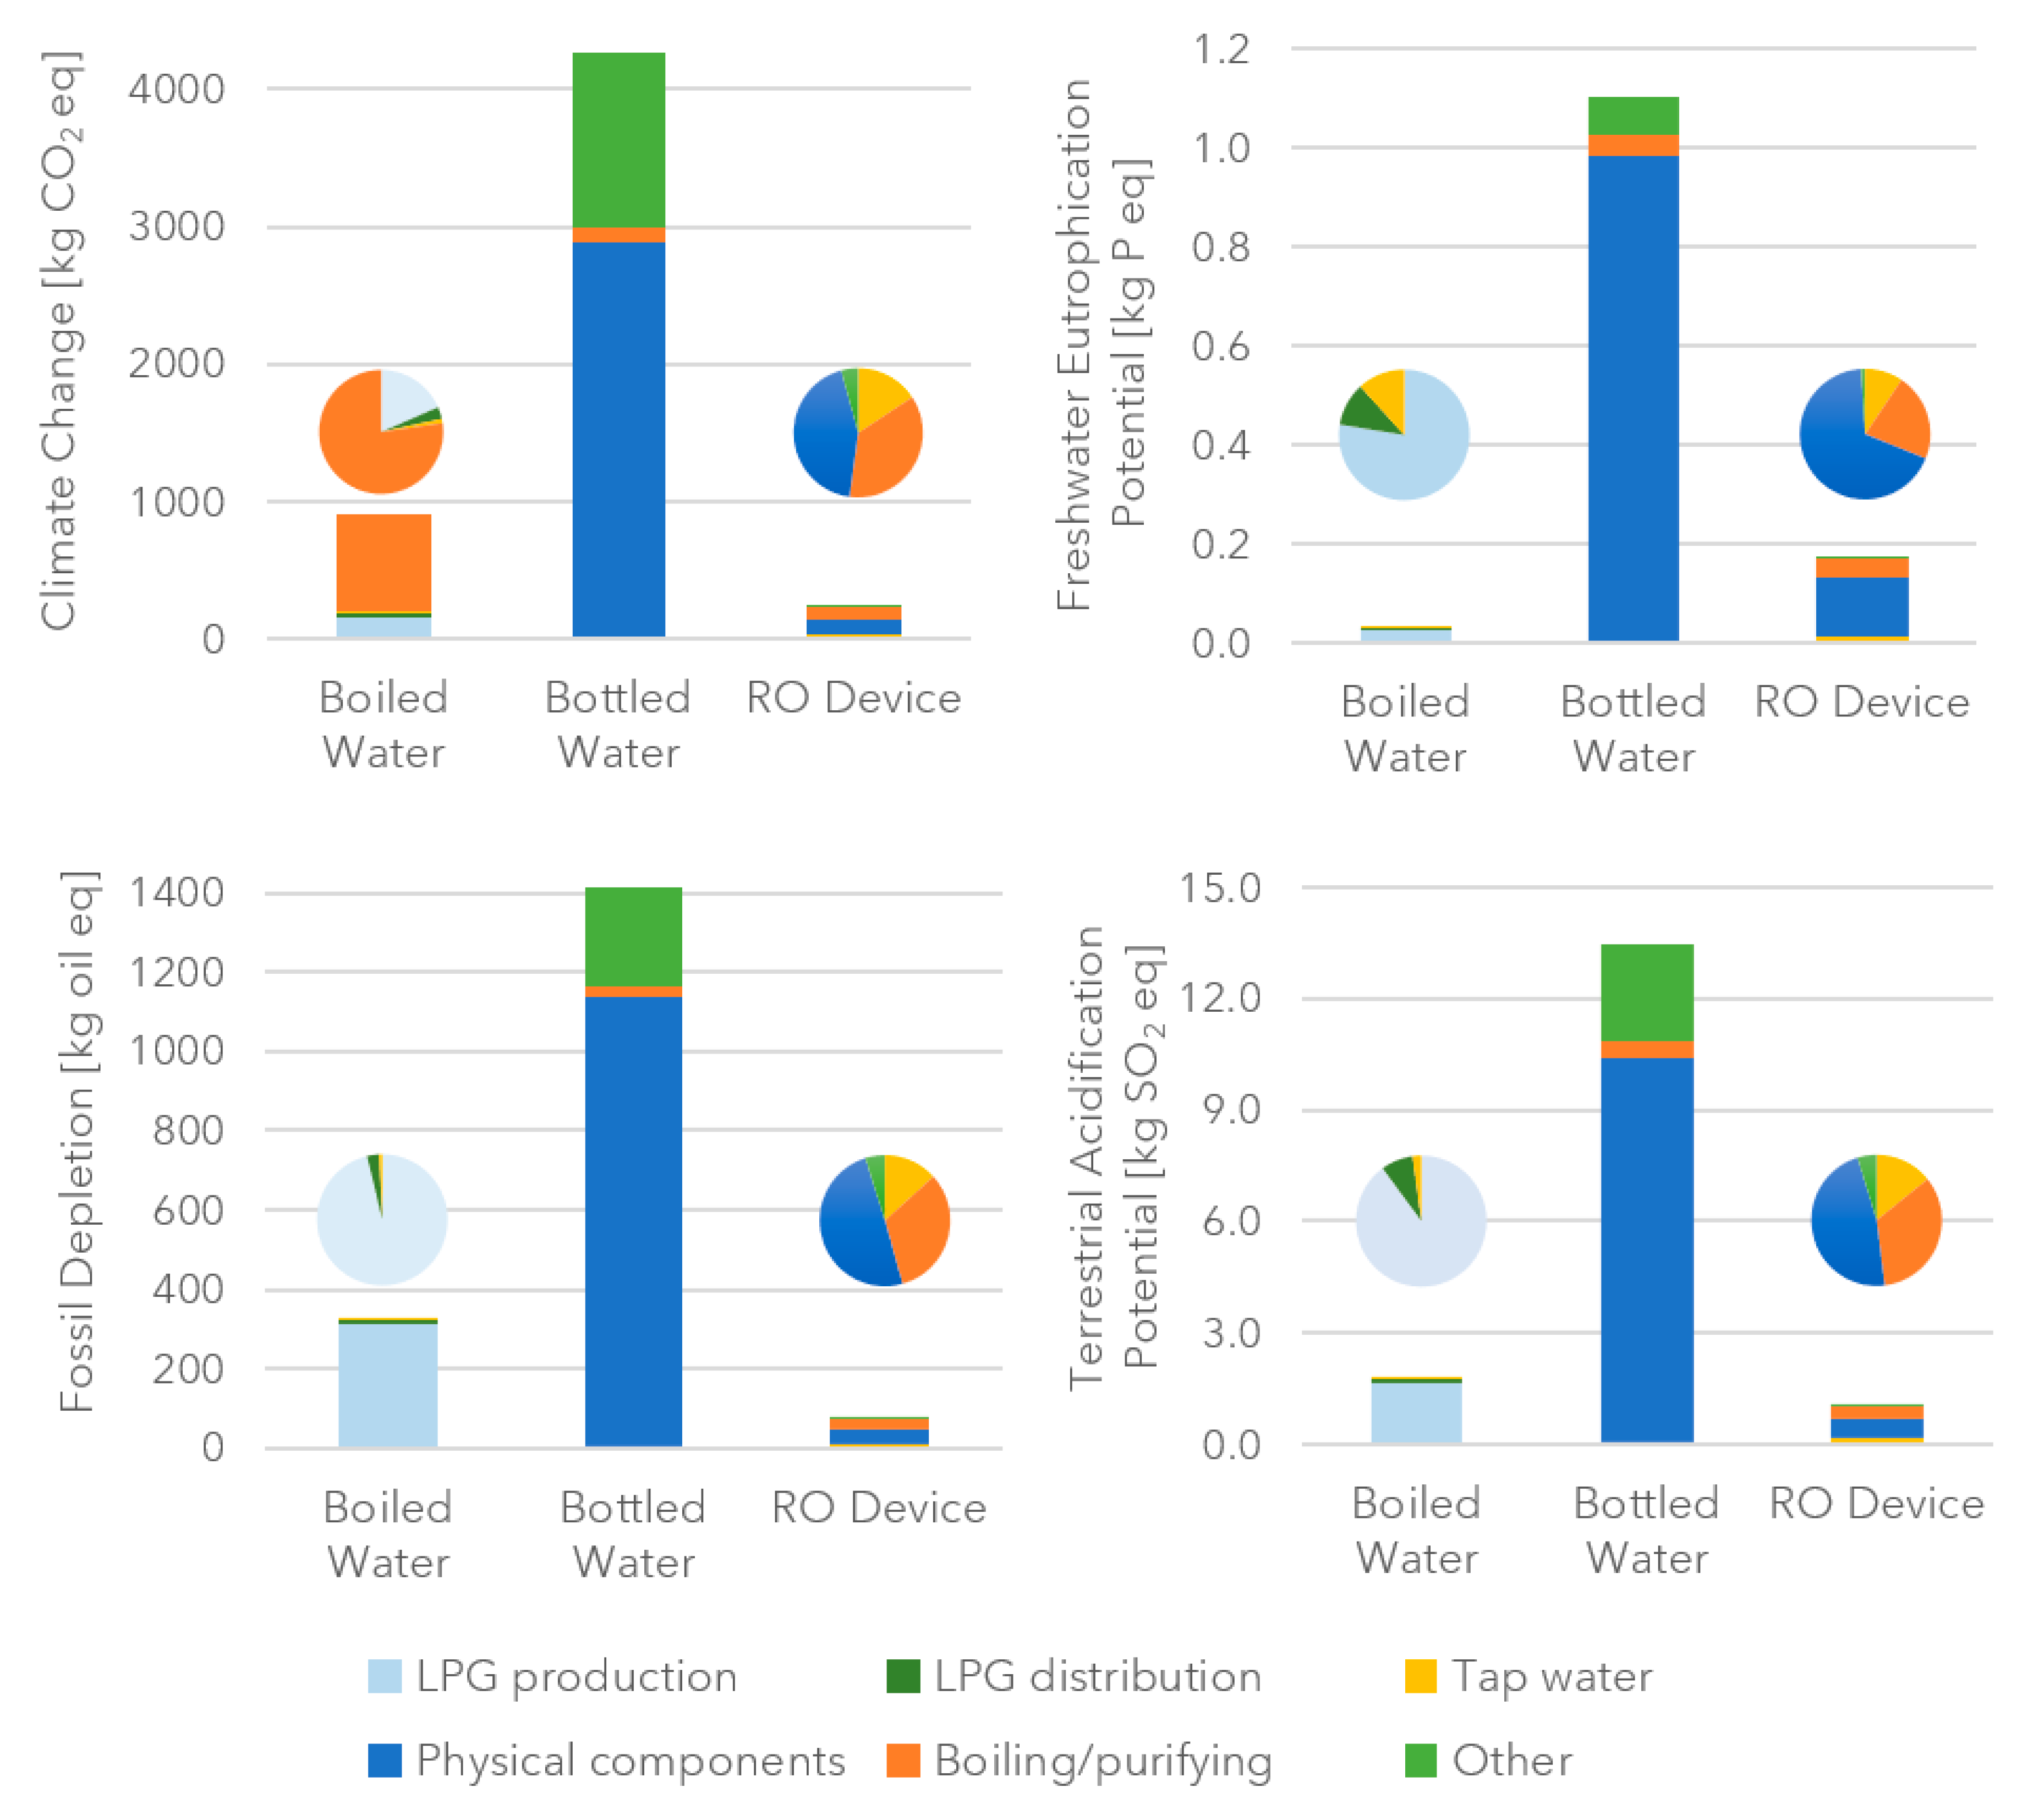
3.1. RO Device
3.2. Bottled Water
3.3. Boiled Water
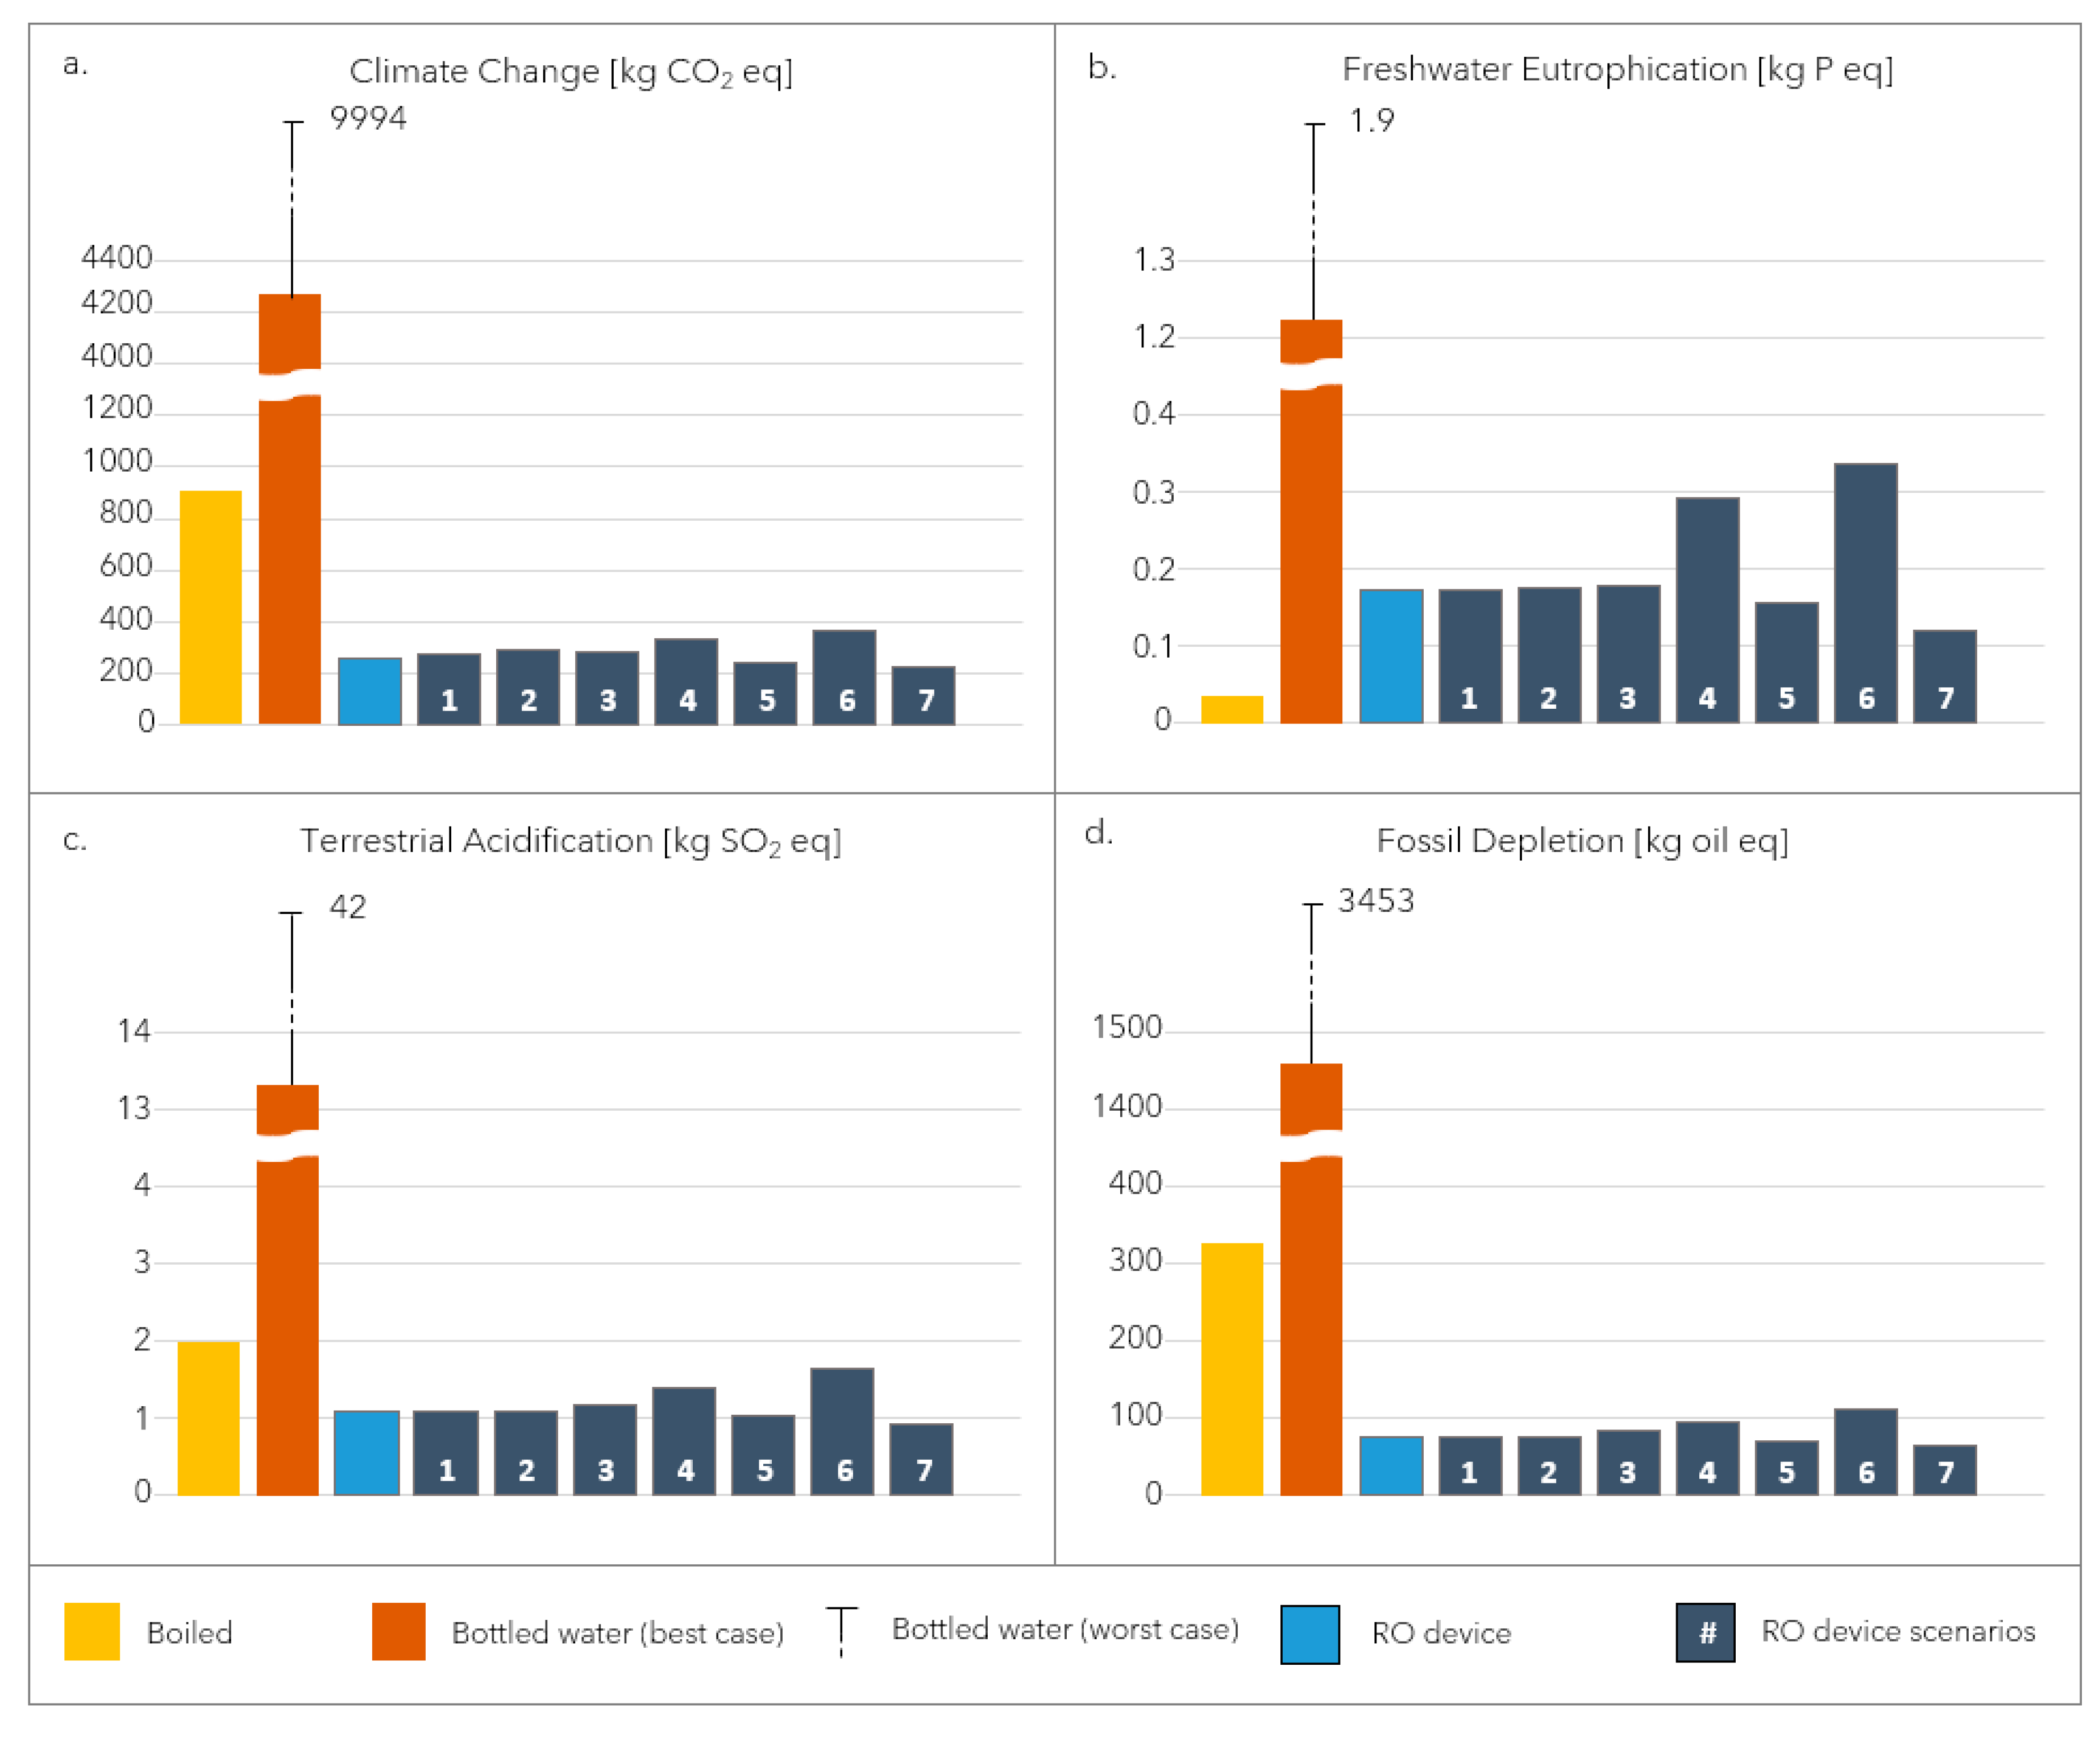
3.4. Sensitivity Analysis
4. Discussion
4.1. Largest Remaining Uncertainties and Their Potential Impacts on Conclusions
4.2. Functional Differences not Considered in the Choice of Functional Unit
4.3. Impacts not Considered in the Analysis
5. Conclusions
Author Contributions
Funding
Conflicts of Interest
Appendix A
Appendix A.1. Detailed Life Cycle Inventories

| Process | Unit | Quantity | |
|---|---|---|---|
| Inputs at consumer home | Tap water (adapted with Indian electricity mix) | kg (=L) | 80,000 |
| Electricity | MJ | 336 | |
| Pureit®: 1 main device, 5 sets of consumables | Acrylonitrile butadiene styrene copolymer, ABS, at plant | kg | 4.25 |
| Polypropylene, granulate, at plant | kg | 3.92 | |
| Other polymers | kg | 0.43 | |
| Electronic components | kg | 0.28 | |
| Pump and other hardware | kg | 2.6 | |
| Plastic molding and metal shaping | kg | 7.17 | |
| Electricity | MJ | 75.5 | |
| Inbound transport | Ship and lorry | tkm | 30.3 |
| Packaging | Paper and board | kg | 3.15 |
| Polystyrene expandable part (EPS) | kg | 0.14 | |
| Other polymers | kg | 0.04 | |
| Other | CaO, MgO | kg | 1.15 |
| Activated carbon | kg | 1.8 | |
| Outbound transport | Lorry and van | tkm | 29.6 |
| Waste (to sanitary landfill/municipal incineration depending on scenario) | Plastics | kg | 8.78 |
| Packaging cardboard and paper | kg | 3.15 | |
| Other municipal solid waste | kg | 5.83 | |
| Output water | Purified water | kg | 20,000 |
| Water rejected during the reverse osmosis (flowing down the drain) | kg | 60,000 |
| Process | Unit | Quantity | |
|---|---|---|---|
| Bottle | polyethylene terephthalate, granulate, bottle grade (adapted with Indian electricity mix) | kg | 360.0 |
| injection molding | kg | 360.1 | |
| stretch blow molding | kg | 360.0 | |
| Cap | polypropylene, granulate | kg | 28.0 |
| Injection molding | kg | 28.0 | |
| Bottle and cap inbound transport | transport, lorry 16–32 t, EURO3 | tkm | 740.0 |
| Secondary pack | packaging film, LDPE | kg | 67.2 |
| kraft paper, unbleached | kg | 1.4 | |
| Tertiary pack | packaging film, LDPE | kg | 13.3 |
| Corrugated board, recycling fiber, single wall | kg | 60.1 | |
| Secondary and tertiary pack inbound transport | transport, lorry 16–32 t, EURO3 | tkm | 14.0 |
| Bottling plant: reverse osmosis | Tap water (adapted with Indian electricity mix) | kg | 25,000 |
| Electricity | kWh | 101.1 | |
| Ozone, liquid, at plant | g | 7 | |
| Distribution transport * | Operation freight train diesel/electricity (adapted for India) | tkm | 2053 |
| Process | Unit | Quantity | |
|---|---|---|---|
| Inputs at consumer home | Tap water (adapted with Indian electricity mix) | kg (=L) | 20,000 |
| propane/butane at consumer (LPG) (adapted with Indian electricity mix and specific transport *) | kg | 251 | |
| LPG transport * | operation, freight train, diesel | tkm | 116 |
| operation, freight train, electricity | tkm | 65 | |
| operation, transoceanic freight ship | tkm | 249 | |
| transport, van <3.5 t | tkm | 4 | |
| transport, lorry 3.5–16 t, fleet average | tkm | 83 | |
| Emissions from burning * | Outputs | ||
| Carbon dioxide ** | kg | 698.293 | |
| Carbon monoxide | kg | 3.861 | |
| Methane | kg | 0.006 | |
| Nitrogen oxides | kg | 0.322 | |
| Nitrous oxide | kg | 0.004 | |
| NMVOC (non-methane volatile organic compounds) | kg | 0.429 | |
| Soot | kg | 0.001 |
Appendix A.2. Simplified Inventory Based on 1 L Purified Water
| Process | Flow | Unit | System under Study | |||
|---|---|---|---|---|---|---|
| Reverse-Osmosis Device | Bottled Water | Boiled Water | ||||
| Water | Tap water | kg | 4.00 | 0.13 | 1.00 | |
| Inputs | Energy | Liquefied Petroleum Gas (LPG) | kg | 1.26 × 10⁻² | ||
| Electricity | kWh | 5.77 × 10⁻³ (of which 4.71 × 10⁻³ at home) | 5.06 × 10⁻³ | |||
| Inbound transport | Train and truck | tkm | 1.52 × 10⁻³ | 4.06 × 10⁻² | 2.59 × 10⁻² | |
| Bottle materials | Virgin polyethylene terephthalate (PET) | kg | 1.80 × 10⁻² | |||
| Polypropylene (PP) (lid) | kg | 1.40 × 10⁻³ | ||||
| Reverse-Osmosis Device—consumable materials | Acrylonitrile Butadiene styrene | kg | 2.15 × 10⁻⁴ | |||
| PP | kg | 1.95 × 10⁻⁴ | ||||
| Other polymers | kg | 3.00 × 10⁻⁵ (includes packaging) | ||||
| Electronic parts | kg | 1.50 × 10⁻⁵ | ||||
| Pump and other hardware | kg | 2.60 × 10⁻⁴ | ||||
| Shaping | Plastic molding and metal shaping | kg | 3.60 × 10⁻⁴ | 3.74 × 10⁻² | ||
| Packaging | Low Density Polyethylene film | kg | 4.03 × 10⁻³ | |||
| Paper and board | kg | 1.95 × 10⁻⁴ | 3.08 × 10⁻³ | |||
| Outbound transport | Train and truck | tkm | 1.48 × 10⁻³ | 1.03 × 10⁻⁴ | ||
| Other | Ozone | kg | 3.50 × 10⁻⁷ | |||
| CaO, MgO | kg | 6.00 × 10⁻⁵ | ||||
| Outputs | Combustion | CO2 | kg | 3.49 × 10⁻² | ||
| Other (CO, CH4, NO, N2O, NMVOC, soot) | kg | 2.30 × 10⁻⁴ | ||||
| Purification | Wastewater | kg | 3.00 | 2.60 × 10⁻⁴ | ||
Appendix A.3. Description of the Systems and Their Inventories
Appendix A.3.1. RO Device
- 100% recycled: the RO device, consumables, and packaging are all recycled. Following the cut-off approach, no impacts are allocated to this scenario.
- 100% landfill: all the components and packaging are collected and landfilled. The relevant Swiss ecoinvent sanitary landfill operation datasets were used to estimate the impact of this scenario.
- 100% incineration: everything is collected and incinerated. The Swiss ecoinvent municipal incineration datasets were used for this scenario.
Appendix A.3.2. Bottled Water
Purification
- Water filtration (also called sand filtration or pre-filtration).
- Reverse osmosis with an 80% recovery rate of purified water, also considering organic emissions.
- Ozone treatment including the use of liquid ozone.
- Ultraviolet treatment.
- Filling operations including the cleaning of the bottles using a pressurized rinse.
Primary Packaging
- From Tandon, Kolekar and Kumar [7], 1 L PET bottle of an average 22.4 g and 1.6 g for a screw cap (in this study it was assumed that the cap was made from PP instead of PET, after consulting with a packaging expert).
- A “best-case scenario” 18 g PET bottle with a 1.4 g PP cap from the EcoGreen Line 1 L natural water bottle made by San Benedetto [17]. To reduce the impact of variability of bottles on conclusions, this scenario has been used throughout the study as a conservative baseline acting at the disadvantage of hypothesis that bottled water will have higher impacts than the other two alternatives (see results of sensitivity analysis).
Secondary and Tertiary Packaging
- A cardboard case for 12 bottles packed in a pallet with shrink wrap (Tandon, Kolekar, and Kumar [7]).
- A “best-case scenario” lighter option using a secondary shrink wrap and tertiary shrink wrap and pallet liners from the San Benedetto EcoGreen Line [17]. To reduce the impact of variability in the secondary and tertiary packaging of bottles on conclusions, this scenario has also been used as a conservative baseline throughout the study (see the results of the sensitivity analysis).
Distribution
Disposal
- PET bottle: 4% to incineration, 16% to landfill and 80% to recycling
- PP cap: 15% to incineration and 85% to landfill
Appendix A.3.3. Boiled Water
Appendix B
Adaptation of Inventories
Appendix C
Comparative Results for All ReCiPe v1.08 Impact Categories
| Impact Category | Unit | RO Device (Recycled) | Bottled Water | Boiled Water |
|---|---|---|---|---|
| Agricultural land occupation | m2a | 1.85 × 101 (7%) | 2.51 × 10² | 1.35 (1%) |
| Climate change, default, excl biogenic carbon | kg CO2-Equiv. | 2.59 ×10² (6%) | 4.27 × 10³ | 9.05 × 10² (21%) |
| Climate change, incl biogenic carbon | kg CO2-Equiv. | 2.55 × 10² (6%) | 4.28 × 10³ | 9.05 ×10² (21%) |
| Fossil depletion | kg oil eq | 7.60 × 101 (5%) | 1.46 × 10³ | 3.26 ×10² (22%) |
| Freshwater ecotoxicity | kg 1.4-DB eq | 7.85 (17%) | 4.57 × 101 | 2.46 (5%) |
| Freshwater eutrophication | kg P eq | 1.74 × 10⁻⁴ (14%) | 1.25 | 3.49×10⁻² (3%) |
| Human toxicity | kg 1.4-DB eq | 2.30 × 10² (18%) | 1.26 × 10³ | 7.55×101 (6%) |
| Ionizing radiation | kg U235 eq | 3.13 × 101 (8%) | 3.73 × 10² | 2.16×101 (6%) |
| Marine ecotoxicity | kg 1.4-DB eq | 7.25 (17%) | 4.28 × 101 | 2.79 (7%) |
| Marine eutrophication | kg N-Equiv. | 1.40 × 10⁻⁴ (9%) | 1.53 | 5.92×10⁻² (4%) |
| Metal depletion | kg Fe eq | 7.33 × 101 (59%) | 1.24 × 10² | 5.34 (4%) |
| Natural land transformation | m2 | 2.91 × 10⁻² (5%) | 5.57 × 10⁻⁴ | 4.87×10⁻⁴ (87%) |
| Ozone depletion | kg CFC-11 eq | 9.60 × 10⁻⁶ (2%) | 5.08 × 10⁻⁴ | 1.24×10⁻⁴ (24%) |
| Particulate matter formation | kg PM10 eq | 3.98 × 10⁻⁴ (8%) | 4.78 | 6.09×10⁻⁴ (13%) |
| Photochemical oxidant formation | kg NMVOC | 7.71 × 10⁻⁴ (6%) | 1.23 × 101 | 2.27 (18%) |
| Terrestrial acidification | kg SO2 eq | 1.09 (8%) | 1.42 × 101 | 2.00 (14%) |
| Terrestrial ecotoxicity | kg 1.4-DB eq | 2.13 × 10⁻⁴ (5%) | 4.41 | 1.33 (30%) |
| Urban land occupation | m2a | 3.70 (16%) | 2.34 × 101 | 2.41 (10%) |
| Water depletion | m3 | 1.19 × 10³ (13%) | 9.30 × 10³ | 3.16 ×10² (3%) |
Appendix D
Additional Sensitivity Analysis Information
| Scenario | Impact Category | Percentage of the Original Result |
|---|---|---|
| Truck 1300 km box “Worst case” | Climate Change | 261% |
| Eutrophication Potential | 172% | |
| Acidification Potential | 314% | |
| Fossil Depletion | 245% | |
| Water Consumption (blue + green) | 266% | |
| Truck 100 km shrink | Climate Change | 127% |
| Eutrophication Potential | 123% | |
| Acidification Potential | 128% | |
| Fossil Depletion | 127% | |
| Water Consumption (blue + green) | 100% | |
| Train 1300 km box | Climate Change | 159% |
| Eutrophication Potential | 153% | |
| Acidification Potential | 188% | |
| Fossil Depletion | 146% | |
| Water Consumption (blue + green) | 266% | |
| Train 100 km shrink, light bottle “Best-case” | Climate Change | 100% |
| Eutrophication Potential | 100% | |
| Acidification Potential | 100% | |
| Fossil Depletion | 100% | |
| Water consumption (blue + green) | 100% |
References
- World Health Organization; UNICEF. Progress on Sanitation and Drinking Water–2015 Update and MDG Assessment—9241509147. Available online: http://apps.who.int/iris/handle/10665/177752 (accessed on 1 December 2016).
- Wright, N.C.; Winter, V.A.G. Justification for community-scale photovoltaic-powered electrodialysis desalination systems for inland rural villages in India. Desalination 2014, 352, 82–91. [Google Scholar] [CrossRef]
- Indian Railways. Indian Railways Yearbook (2014–2015); Ministry of Railways (Railway Board): New Delhi, India, 2015.
- Fantin, V.; Scalbi, S.; Ottaviano, G.; Masoni, P. A method for improving reliability and relevance of LCA reviews: the case of life-cycle greenhouse gas emissions of tap and bottled water. Sci Total Environ. 2014, 476–477, 228–241. [Google Scholar] [CrossRef] [PubMed]
- Garfí, M.; Cadena, E.; Sanchez-Ramos, D.; Ferrer, I. Life cycle assessment of drinking water: Comparing conventional water treatment, reverse osmosis and mineral water in glass and plastic bottles. J. Clean. Prod. 2016, 137, 997–1003. [Google Scholar] [CrossRef]
- Homäki, K.; Nielsen, P.H.; Sathasivan, A.; Bohe, E.L.J. Life cycle assessment and environmental improvement of residential and drinking water supply systems in Hanoi, Vietnam. Int. J. Sustain. Dev. World Ecol. 2003, 10, 27–42. [Google Scholar] [CrossRef]
- Tandon, S.A.; Kolekar, N.; Kumar, R. Water and Energy Footprint Assessment of Bottled Water Industries in India. Nat. Resour. 2014, 5, 68–72. [Google Scholar] [CrossRef]
- Environmental Protection Agency. Emergency Disinfection of Drinking Water. Available online: https://www.epa.gov/sites/production/files/2015-11/documents/epa816f15003.pdf (accessed on 22 June 2016).
- Jungbluth, N. Life Cycle Assessment for the Use of Liquefied Petroleum Gas and Kerosene as Cooking Fuels in India. Master Thesis, Technischen Universität Berlin, Berlin, Germany, 1995. [Google Scholar]
- Government of India. Census of India 2011. In Housing Stock, Amenities & Assets in Slums; Ministry of Home Affairs; Registrar General and Census Commissioner of India: New Delhi, India, 2011. [Google Scholar]
- Frischknecht, R.; Jungbluth, N.; Althaus, H.-J.; Doka, G.; Dones, R.; Heck, T.; Hellweg, S.; Hischier, R.; Nemecek, T.; Rebitzer, G.; et al. The ecoinvent Database: Overview and Methodological Framework (7 pp.). Int. J. Life Cycle Assess. 2005, 10, 3–9. [Google Scholar] [CrossRef]
- GaBi, version 6.4; Thinkstep: Stuttgart, Germany, 2015.
- Vionnet, S.; Lessard, L.; Offutt, A.; Lévová, T.; Humbert, S. Quantis Water Database; Technical Report v1 for Quantis: Laussanne, Switzerland, 2012. [Google Scholar]
- Hoekstra, A.; Chapagain, A.; Aldaya, M.; Mekonnen, M. The Water Footprint Assessment Manual—Setting the Global Standard; Earthscan Ltd.: London, UK, 2011; p. 203. [Google Scholar]
- Brown, D.; Edwards, H.; Seaton, L.; Buckley, T. Lewis’s Medical-Surgical Nursing: Assessment and Management of Clinical Problems, 4th ed.; Elsevier Health Sciences APAC: Chatswood, Australia, 2014. [Google Scholar]
- Bhushan, C. The structure and economics of the Indian bottled water industry. Available online: http://www.frontline.in/static/html/fl2307/stories/20060421006702300.htm (accessed on 5 July 2016).
- EPD Environmental Product Declaration of Natural, Low Mineral Content Water San Benedetto in PET Bottles—EcoGreen Line. Available online: http://gryphon.environdec.com/data/files/6/9965/epd536en_rev1.pdf (accessed on 17 June 2015).
- Hawkins, T.R.; Singh, B.; Majeau-Bettez, G.; Strømman, A.H. Comparative Environmental Life Cycle Assessment of Conventional and Electric Vehicles. J. Ind. Ecol. 2013, 17, 53–64. [Google Scholar] [CrossRef]
- International Energy Agency India: Electricity and Heat for 2011. Available online: http://www.iea.org/statistics/statisticssearch/report/?country=INDIA&product=electricityandheat&year=2011 (accessed on 30 April 2015).
- World Resources Institute Sources of Eutrophication: Where Do Nutrients Come from? Available online: http://www.wri.org/our-work/project/eutrophication-and-hypoxia/sources-eutrophication (accessed on 18 June 2015).
- Jungbluth, N. Comparison of the Environmental Impact of Drinking Water vs. Bottled Mineral Water. Available online: http://aquadoc.typepad.com/waterwired/files/bottled_water_impact_lca.pdf (accessed on 5 August 2015).
- Eriksen, M.; Lebreton, L.C.M.; Carson, H.S.; Thiel, M.; Moore, C.J.; Borerro, J.C.; Galgani, F.; Ryan, P.G.; Reisser, J. Plastic Pollution in the World’s Oceans: More than 5 Trillion Plastic Pieces Weighing over 250,000 Tons Afloat at Sea. PLOS ONE 2014, 9, e111913. [Google Scholar] [CrossRef] [PubMed]
- Abdul, S.; Sharma, R.N. Water Consumption Patterns in Domestic Households in Major Cities. Econ. Polit. Wkly 2007, 42, 2190–2197. [Google Scholar]
- Franklin Associates. Life Cycle Assessment of Drinking Water System: Bottle Water, Tap Water, and Home/office delivery Water. Revised Final Peer-Reviewed LCA Report. Available online: http://www.deq.state.or.us/lq/pubs/docs/sw/LifeCycleAssessmentDrinkingWaterReportOnly.pdf (accessed on 19 April 2015).
- Hill, N.; Walker, H.; Choudrie, S.; James, K. 2012 Guidelines to Defra/DECC’s GHG Conversion Factors for Company Reporting: Methodology Paper for Emission Factors; Department for Environment, Food and Rural Affairs: London, UK, 2012.
- Singh, S.; Gupta, G.P.; Kumar, B.; Kulshrestha, U.C. Comparative study of indoor air pollution using traditional and improved cooking stoves in rural households of Northern India. Energy Sustain. Dev. 2014, 19, 1–6. [Google Scholar] [CrossRef]
- Gas India Benefits of Propane over LPG. Available online: http://www.gasindia.in/technical-specification.html (accessed on 19 May 2015).
- World Bank India: Road Transport Service Efficiency Study. Available online: https://openknowledge.worldbank.org/handle/10986/8356 License: CC BY 3.0 IGO (accessed on 20 May 2015).


| Process | Flow | Unit | System Under Study | |||
|---|---|---|---|---|---|---|
| Reverse-Osmosis Device | Bottled Water | Boiled Water | ||||
| Water | Tap water | kg | 80,000 | 25,200 | 20,000 | |
| Inputs | Energy | Liquefied Petroleum Gas (LPG) | kg | 251 | ||
| Electricity | kWh | 115.3 * | 101.1 | |||
| Inbound transport | Train and truck | tkm | 30.3 | 811.5 | 517 | |
| Bottle materials | Virgin polyethylene terephthalate (PET) | kg | 360 | |||
| Polypropylene (PP) (lid) | kg | 28 | ||||
| Reverse-Osmosis—consumable materials | Acrylonitrile Butadiene styrene | kg | 4.3 | |||
| PP | kg | 3.9 | ||||
| Other polymers | kg | 0.6 ** | ||||
| Electronic parts | kg | 0.3 | ||||
| Pump and other hardware | kg | 5.2 | ||||
| Shaping | Plastic molding and metal shaping | kg | 7.2 | 748 | ||
| Packaging | Low Density Polyethylene film | kg | 80.6 | |||
| Paper and board | kg | 3.9 | 61.5 | |||
| Outbound transport | Train and truck | tkm | 29.6 | 2053 | ||
| Other | Ozone | kg | 0.007 | |||
| CaO, MgO | kg | 1.2 | ||||
| Outputs | Combustion of LPG | CO2 | kg | 698.3 | ||
| Other (CO, CH4, NO, N2O, NMVOC, soot) | kg | 4.6 | ||||
| Purification | Wastewater Purified water | kg | 60,000 20,000 | 5200 20,000 | 20,000 | |
| Parameter | Baseline | Alternative 1 | Alternative 2 |
|---|---|---|---|
| Disposal | 100% recycled | 100% landfill (1) | 100% incineration (2) |
| Consumables needed | 5 pieces | 10 pieces (3) | |
| Electricity use | 4.7 Wh per liter | (+50%) 7.05 Wh per liter (4) | (−50%) 2.35 Wh per liter (5) |
| Device lifetime | 20 m3 | (2 years) 8 m3 (6) | (10 years) 40 m3 (7) |
| Scenario Name | Weight of PET Bottle (g) | Secondary Packaging | Mode of Transport | Distribution Distance (km) |
|---|---|---|---|---|
| Truck 1300 km box (“Worst-case scenario”) | 22.4 [7] (H) | Cardboard box [7] (H) | Truck (H) | 1300 [16] (H) |
| Truck 100 km shrink | 22.4 (H) | Shrink wrap [17] (L) | Truck (H) | 100 [4] (L) |
| Train 1300 km box | 22.4 (H) | Cardboard box (H) | Train (L) | 1300 (H) |
| Train 100 km shrink (“Best-case scenario”) | 18 [17] (L) | Shrink wrap (L) | Train (L) | 100 (L) |
| System | Total m3 | Blue Water (m3) | Green Water (m3) | |
|---|---|---|---|---|
| Direct | Indirect | Total (Only Indirect) | ||
| Boiled water | 10.14 | 7.20 | 2.92 | 0.02 |
| Bottled water | 32.80 | 7.20 | 23.40 | 2.20 |
| Reverse-osmosis device | 20.21 | 7.20 | 10.61 | 0.03 |
© 2019 by the authors. Licensee MDPI, Basel, Switzerland. This article is an open access article distributed under the terms and conditions of the Creative Commons Attribution (CC BY) license (http://creativecommons.org/licenses/by/4.0/).
Share and Cite
Garcia-Suarez, T.; Kulak, M.; King, H.; Chatterton, J.; Gupta, A.; Saksena, S. Life Cycle Assessment of Three Safe Drinking-Water Options in India: Boiled Water, Bottled Water, and Water Purified with a Domestic Reverse-Osmosis Device. Sustainability 2019, 11, 6233. https://doi.org/10.3390/su11226233
Garcia-Suarez T, Kulak M, King H, Chatterton J, Gupta A, Saksena S. Life Cycle Assessment of Three Safe Drinking-Water Options in India: Boiled Water, Bottled Water, and Water Purified with a Domestic Reverse-Osmosis Device. Sustainability. 2019; 11(22):6233. https://doi.org/10.3390/su11226233
Chicago/Turabian StyleGarcia-Suarez, Tirma, Michal Kulak, Henry King, Julia Chatterton, Arunima Gupta, and Skand Saksena. 2019. "Life Cycle Assessment of Three Safe Drinking-Water Options in India: Boiled Water, Bottled Water, and Water Purified with a Domestic Reverse-Osmosis Device" Sustainability 11, no. 22: 6233. https://doi.org/10.3390/su11226233
APA StyleGarcia-Suarez, T., Kulak, M., King, H., Chatterton, J., Gupta, A., & Saksena, S. (2019). Life Cycle Assessment of Three Safe Drinking-Water Options in India: Boiled Water, Bottled Water, and Water Purified with a Domestic Reverse-Osmosis Device. Sustainability, 11(22), 6233. https://doi.org/10.3390/su11226233