TVOCs and PM 2.5 in Naturally Ventilated Homes: Three Case Studies in a Mild Climate


Abstract
1. Introduction
2. Materials and Methods
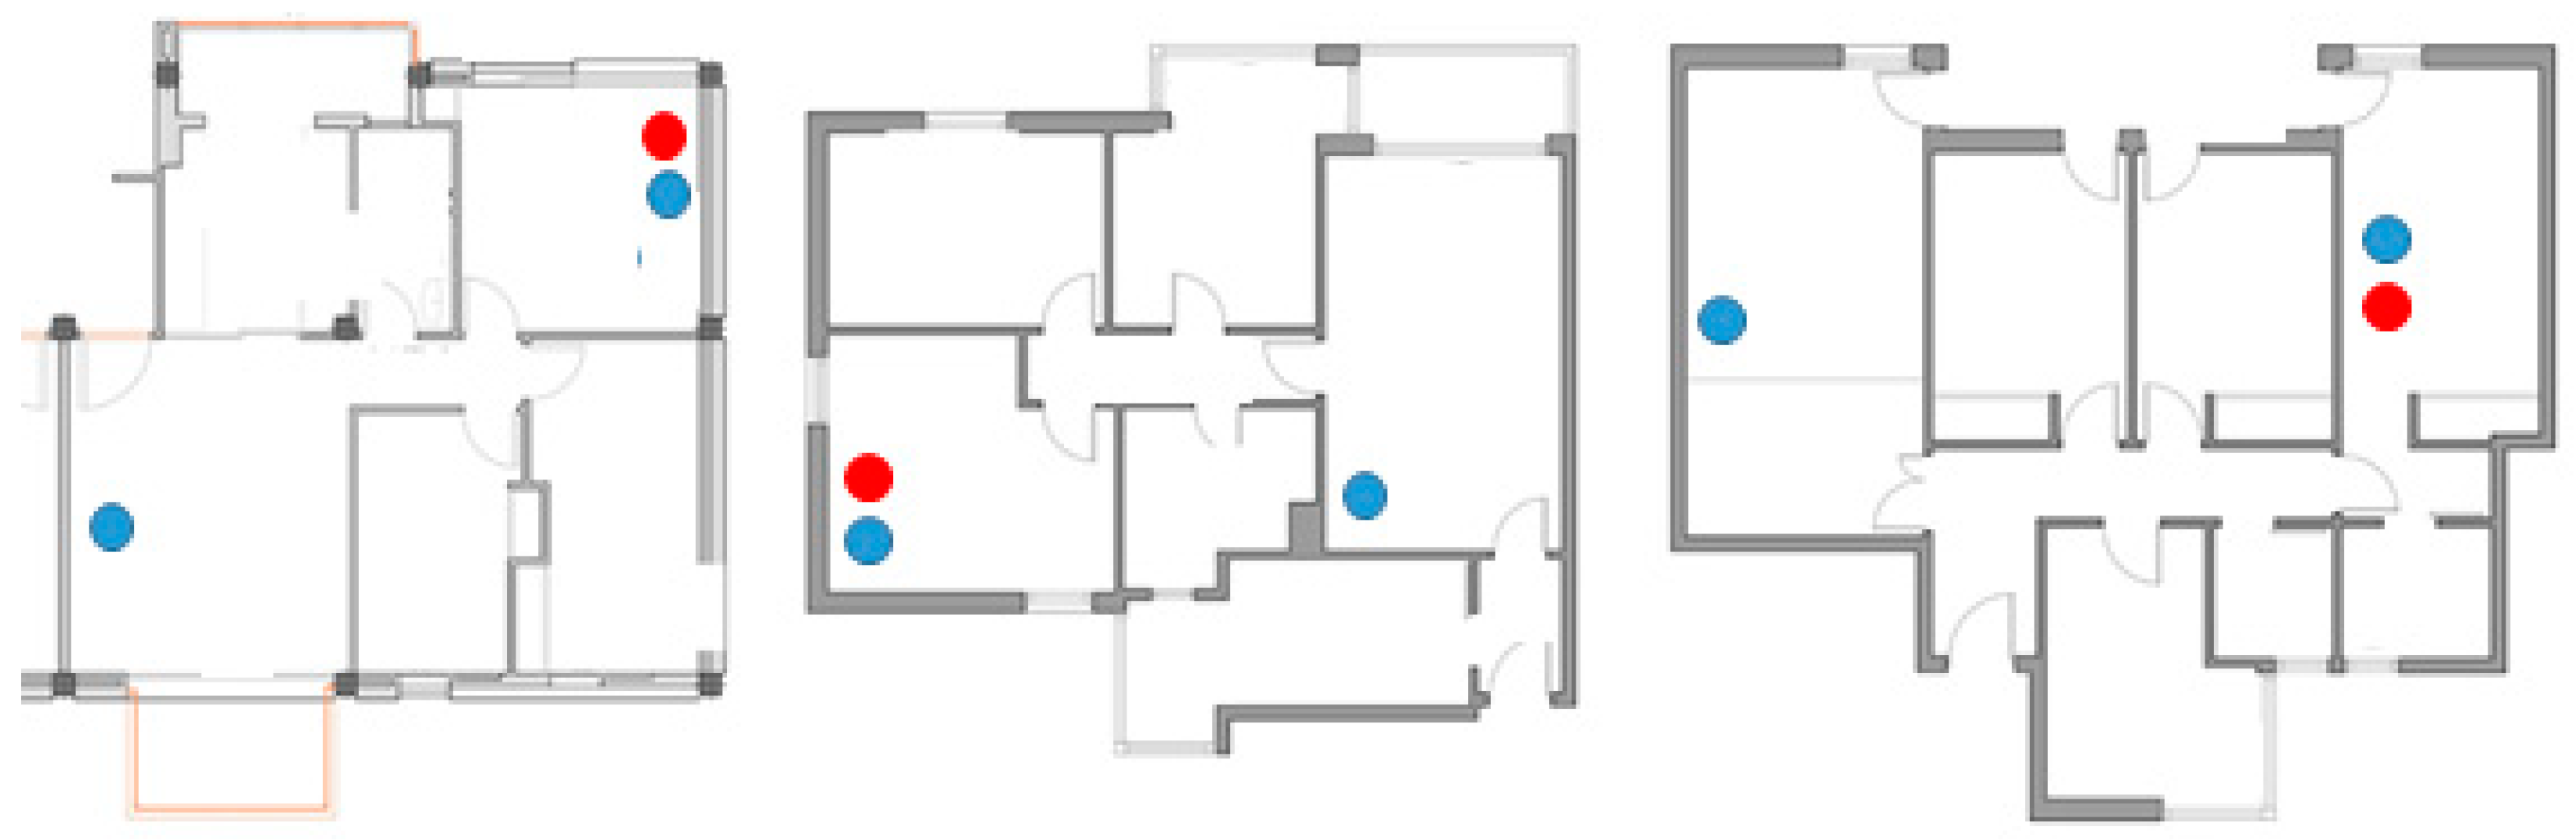
2.1. Context and Location
2.2. Sampling
2.3. Data Collection
2.4. Threshold Level
2.4.1. CO2 Concentration
2.4.2. PM2.5 Concentration
2.4.3. TVOCs Concentration
3. Results
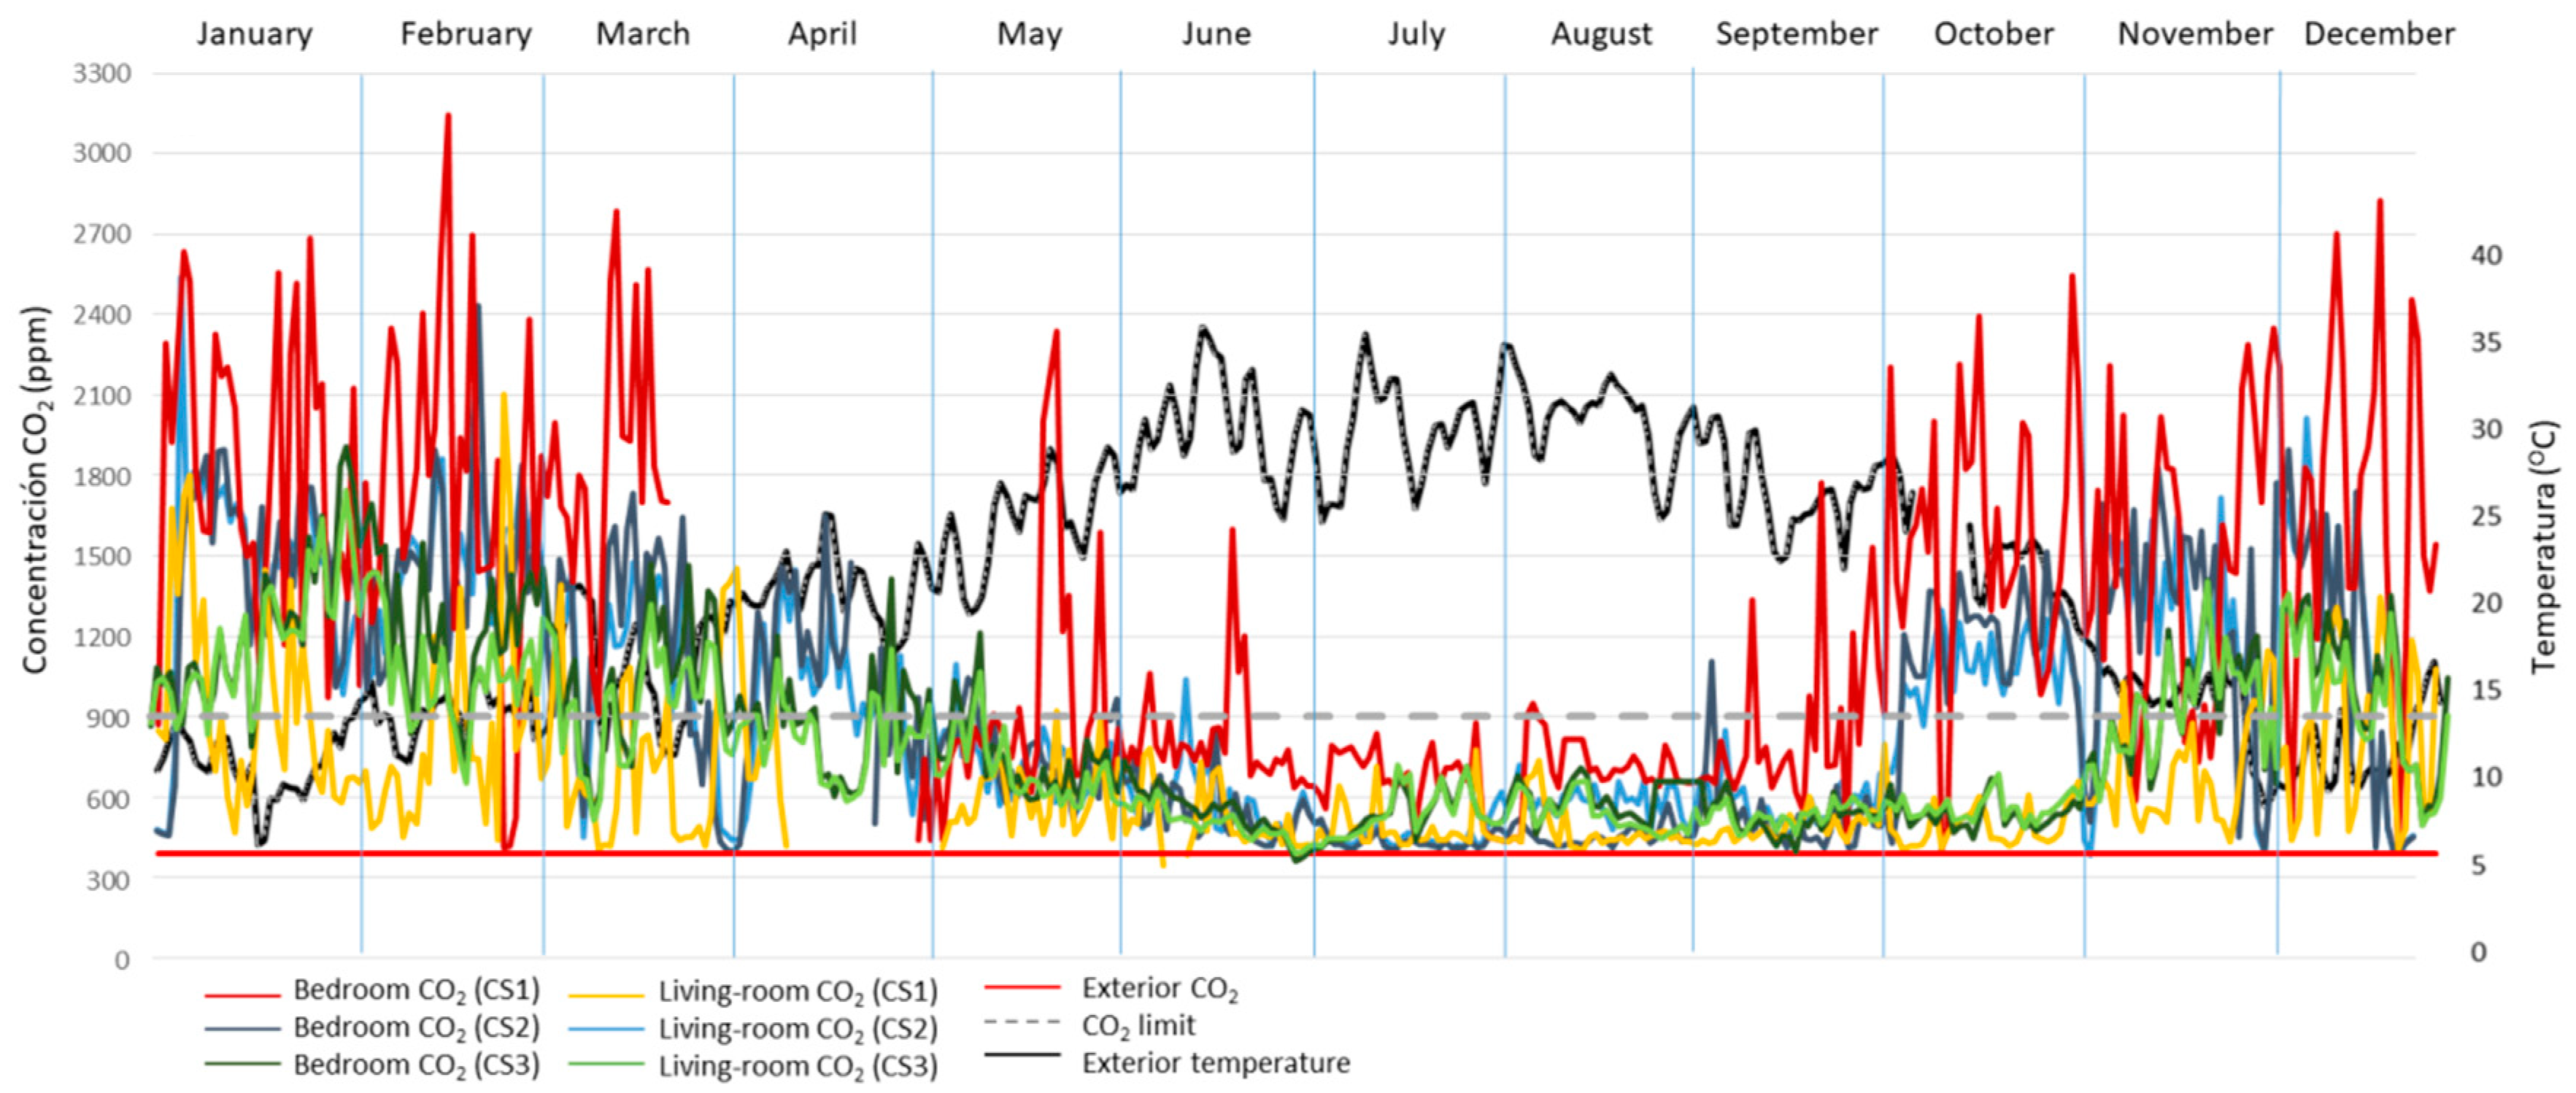
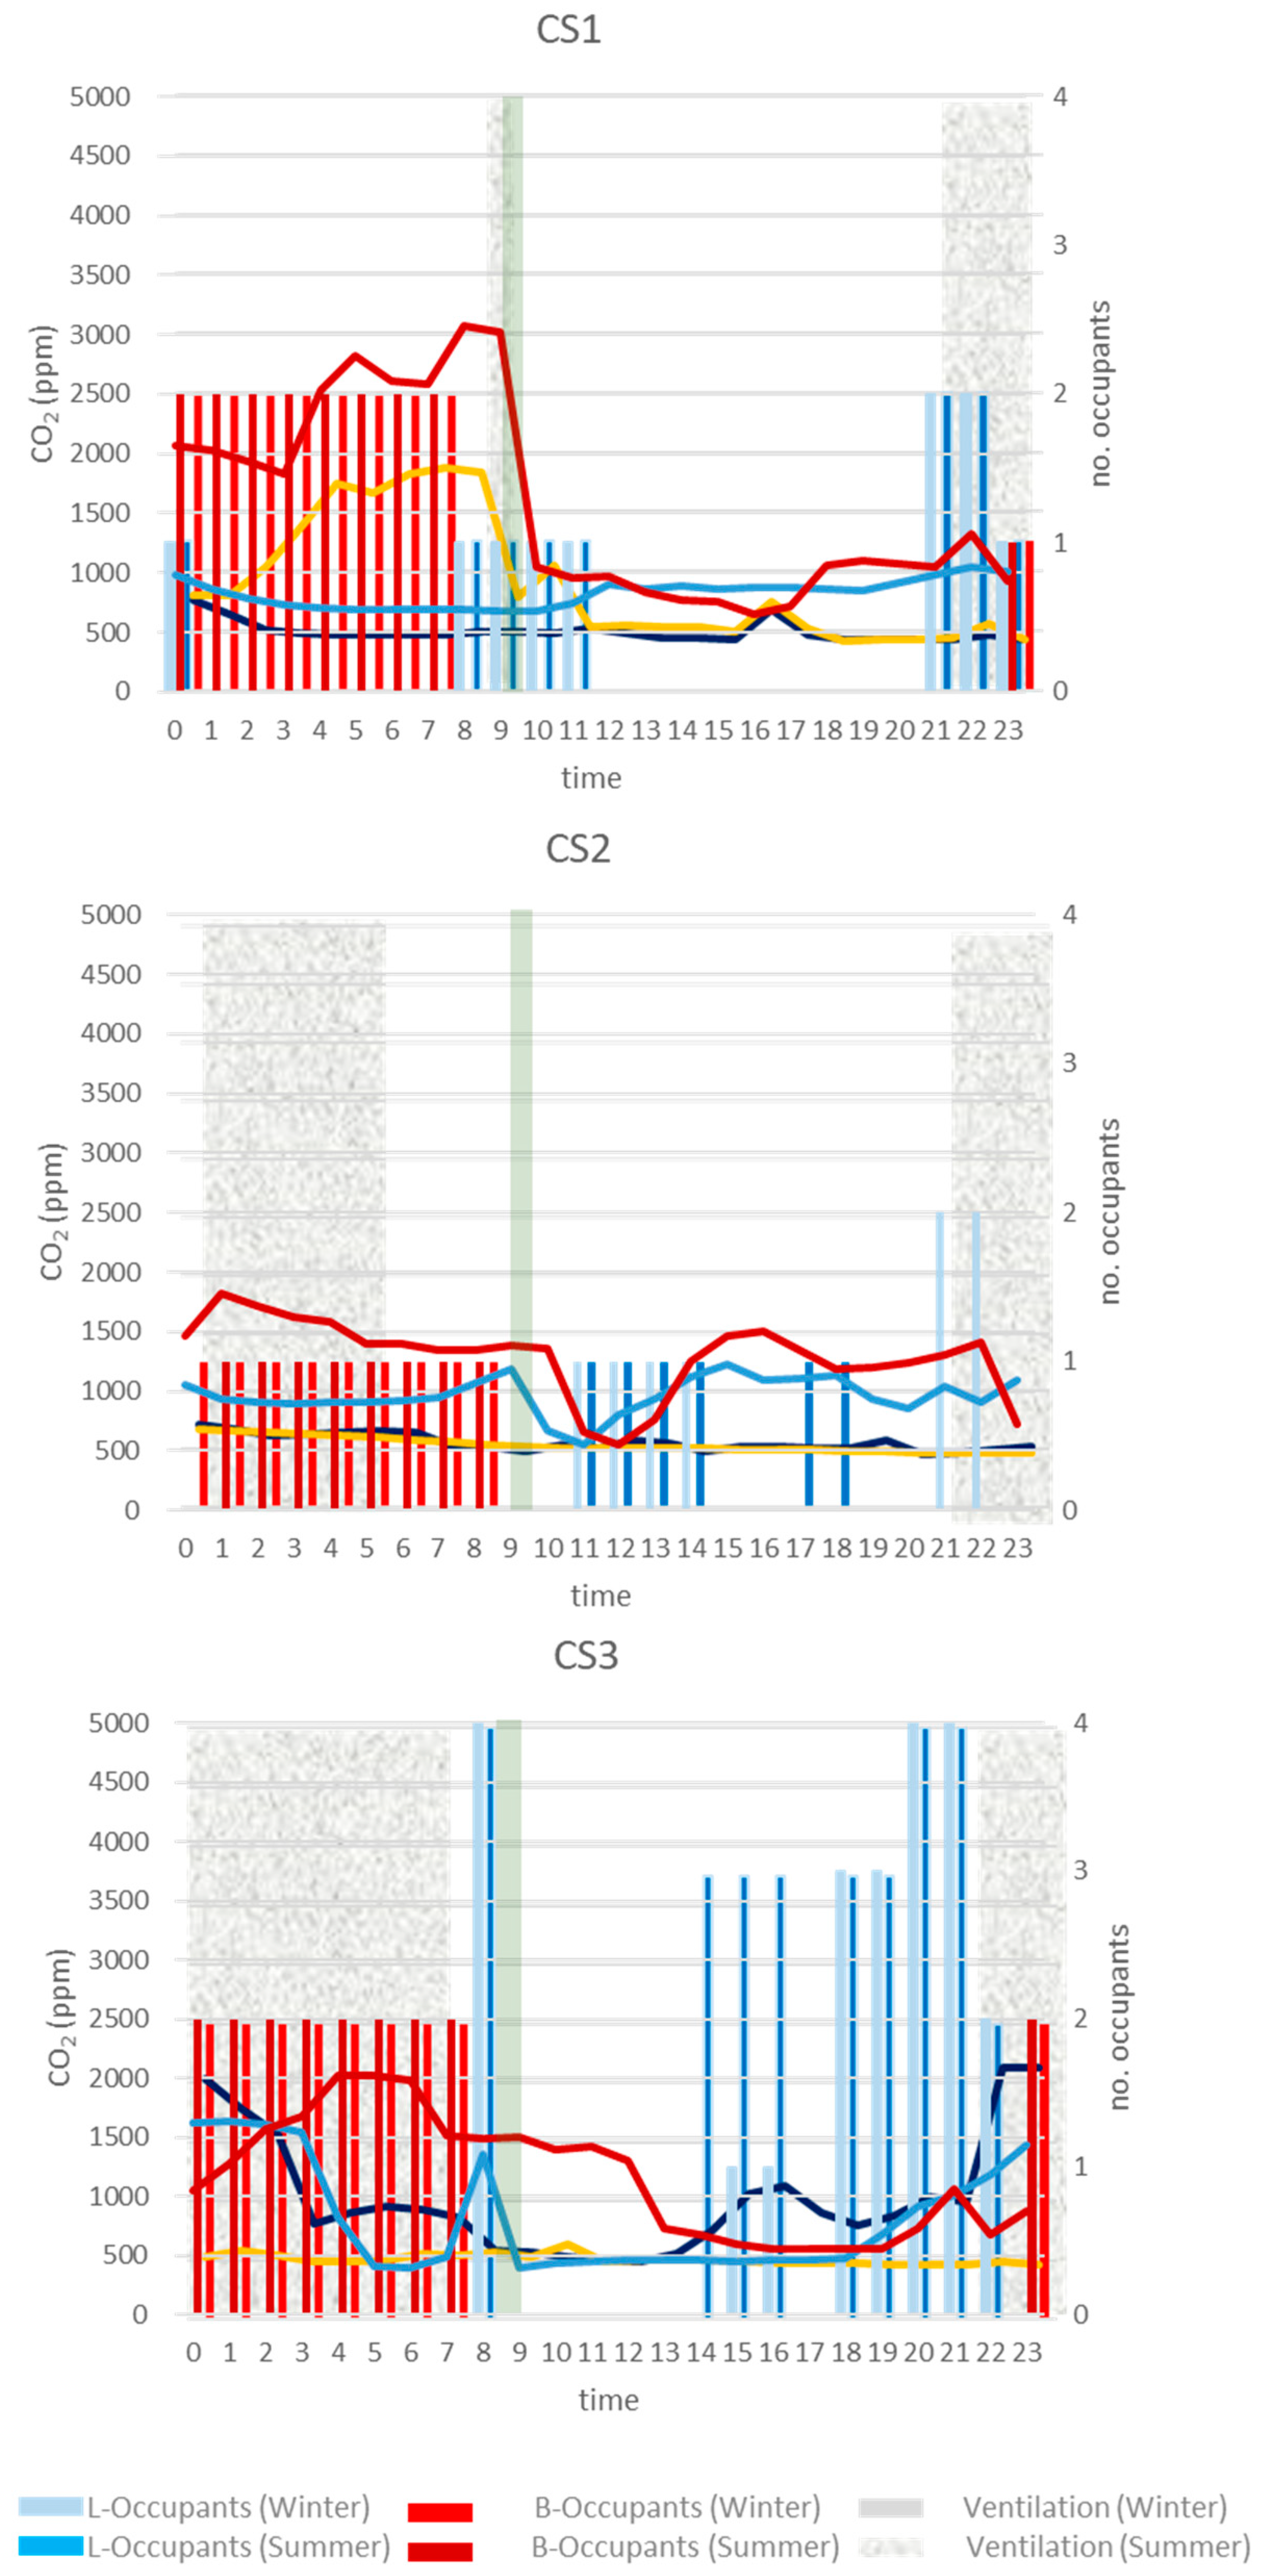
3.1. CO2
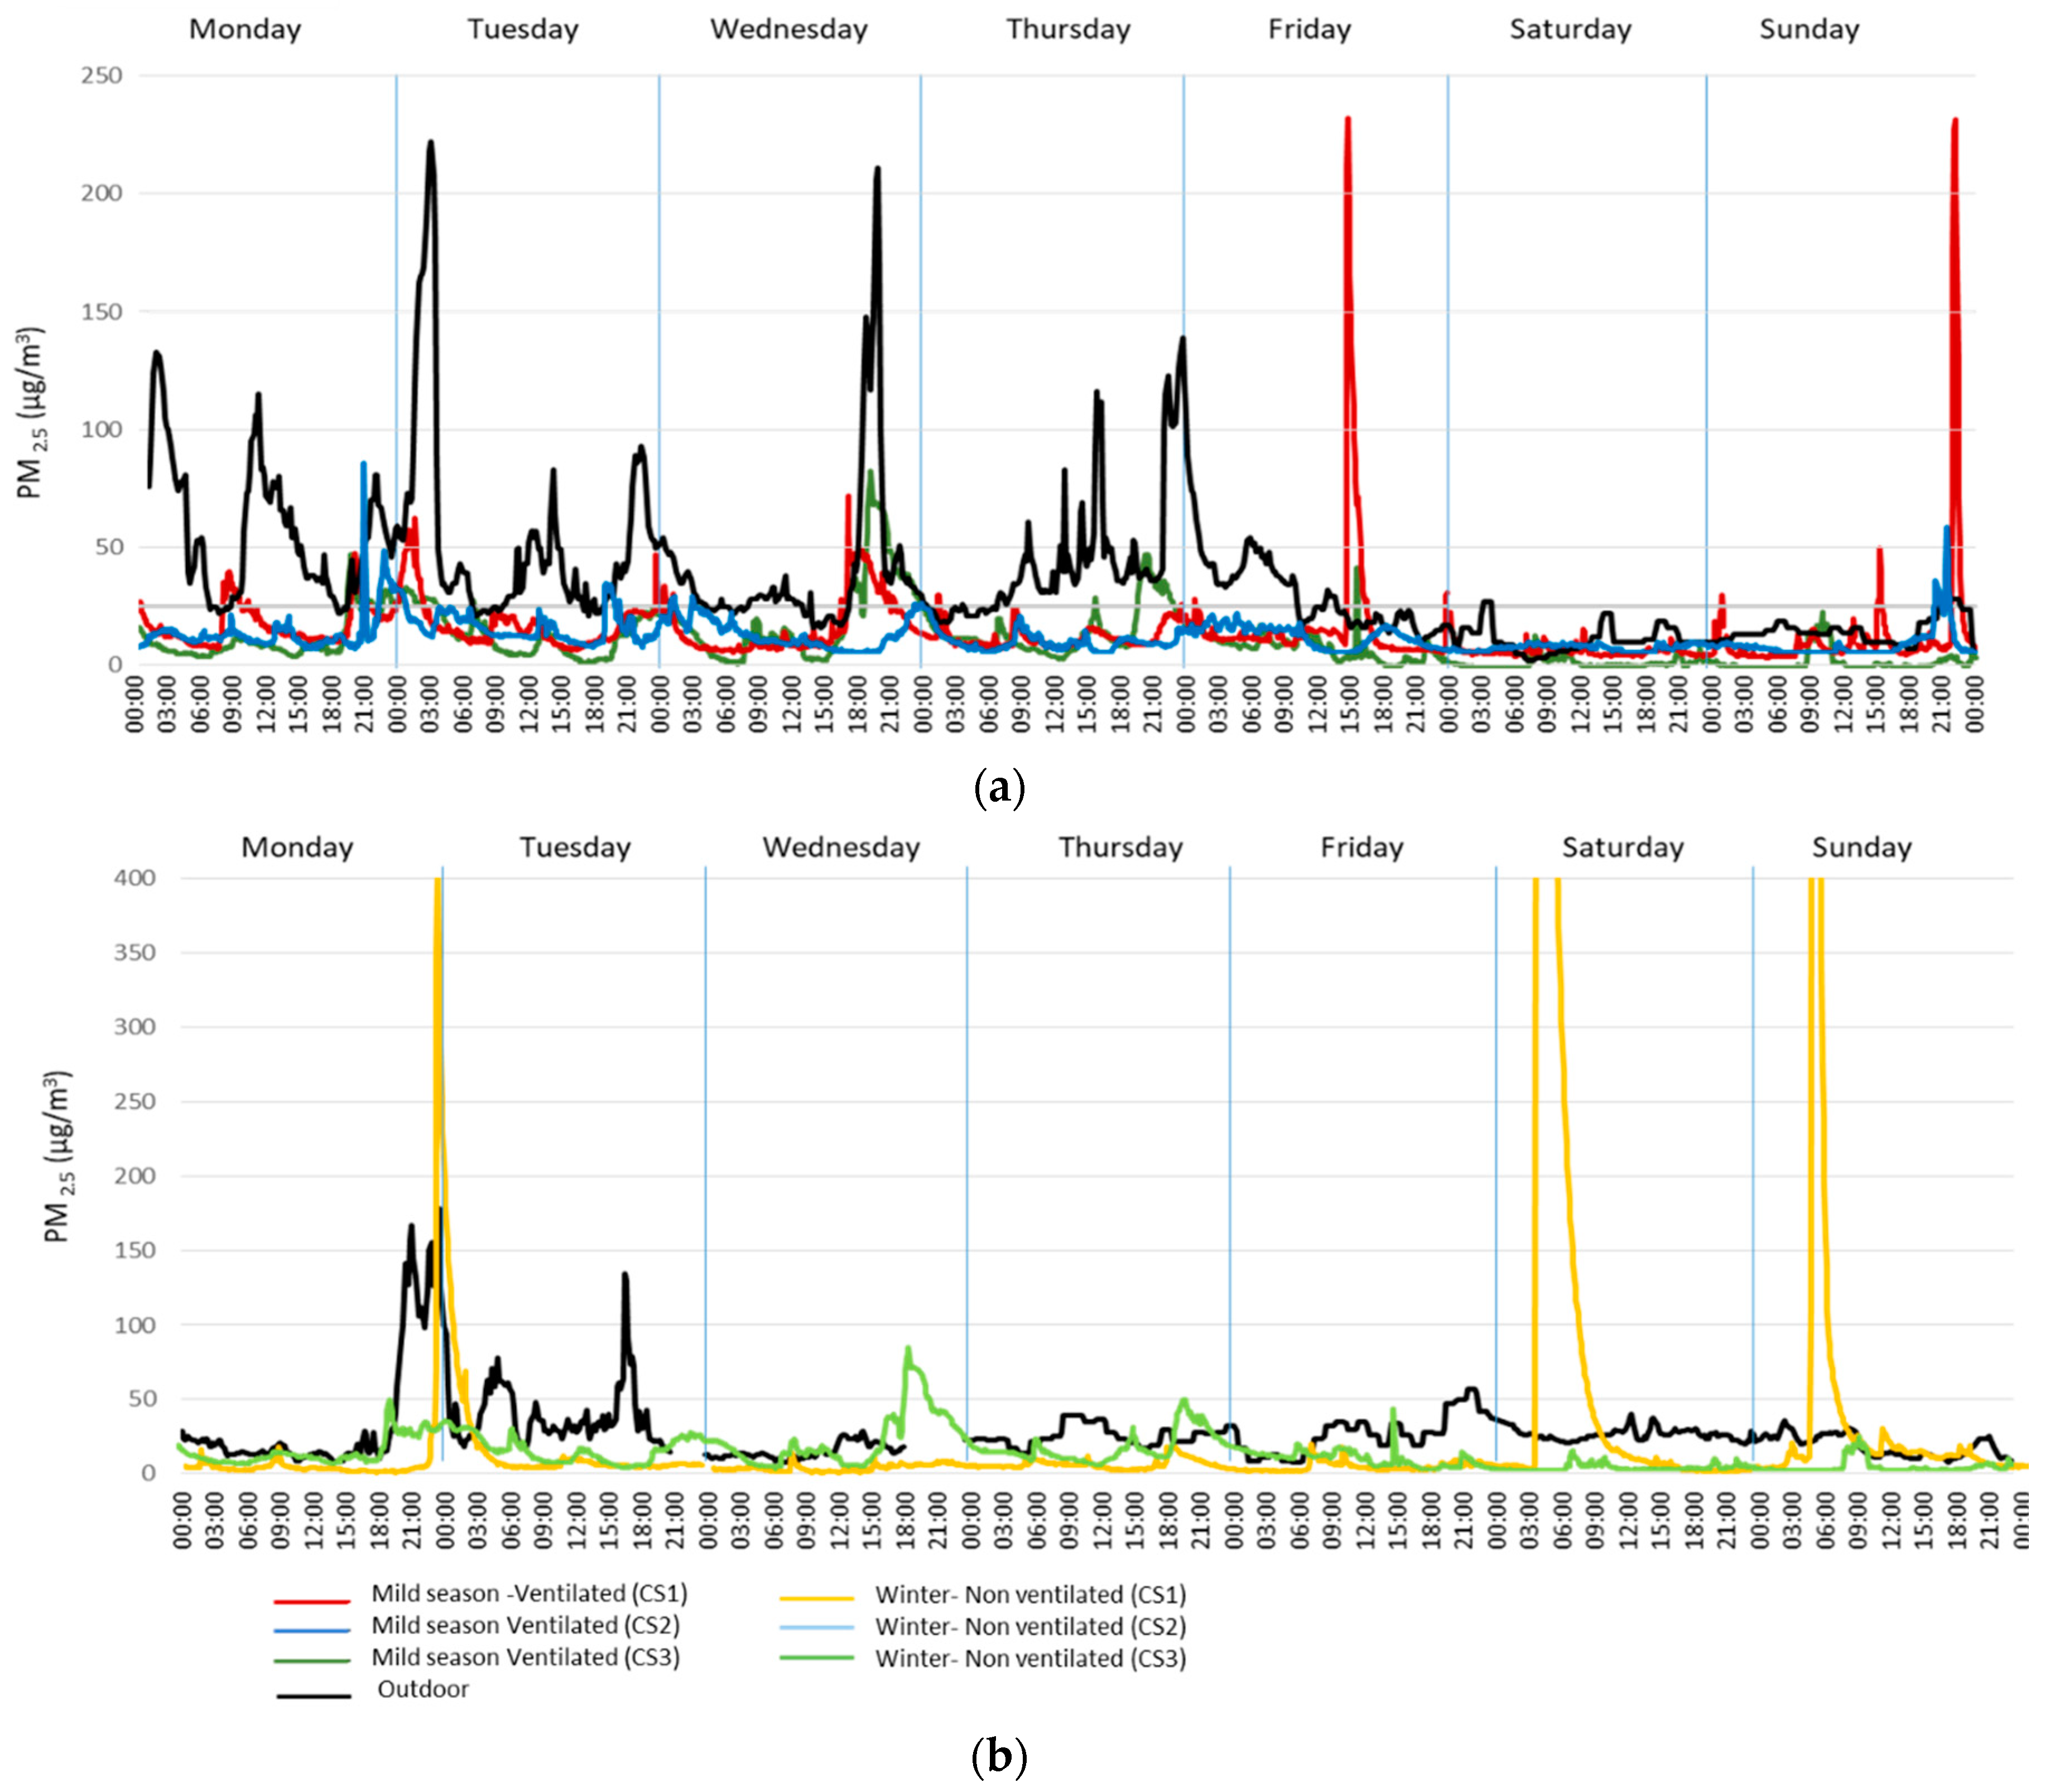
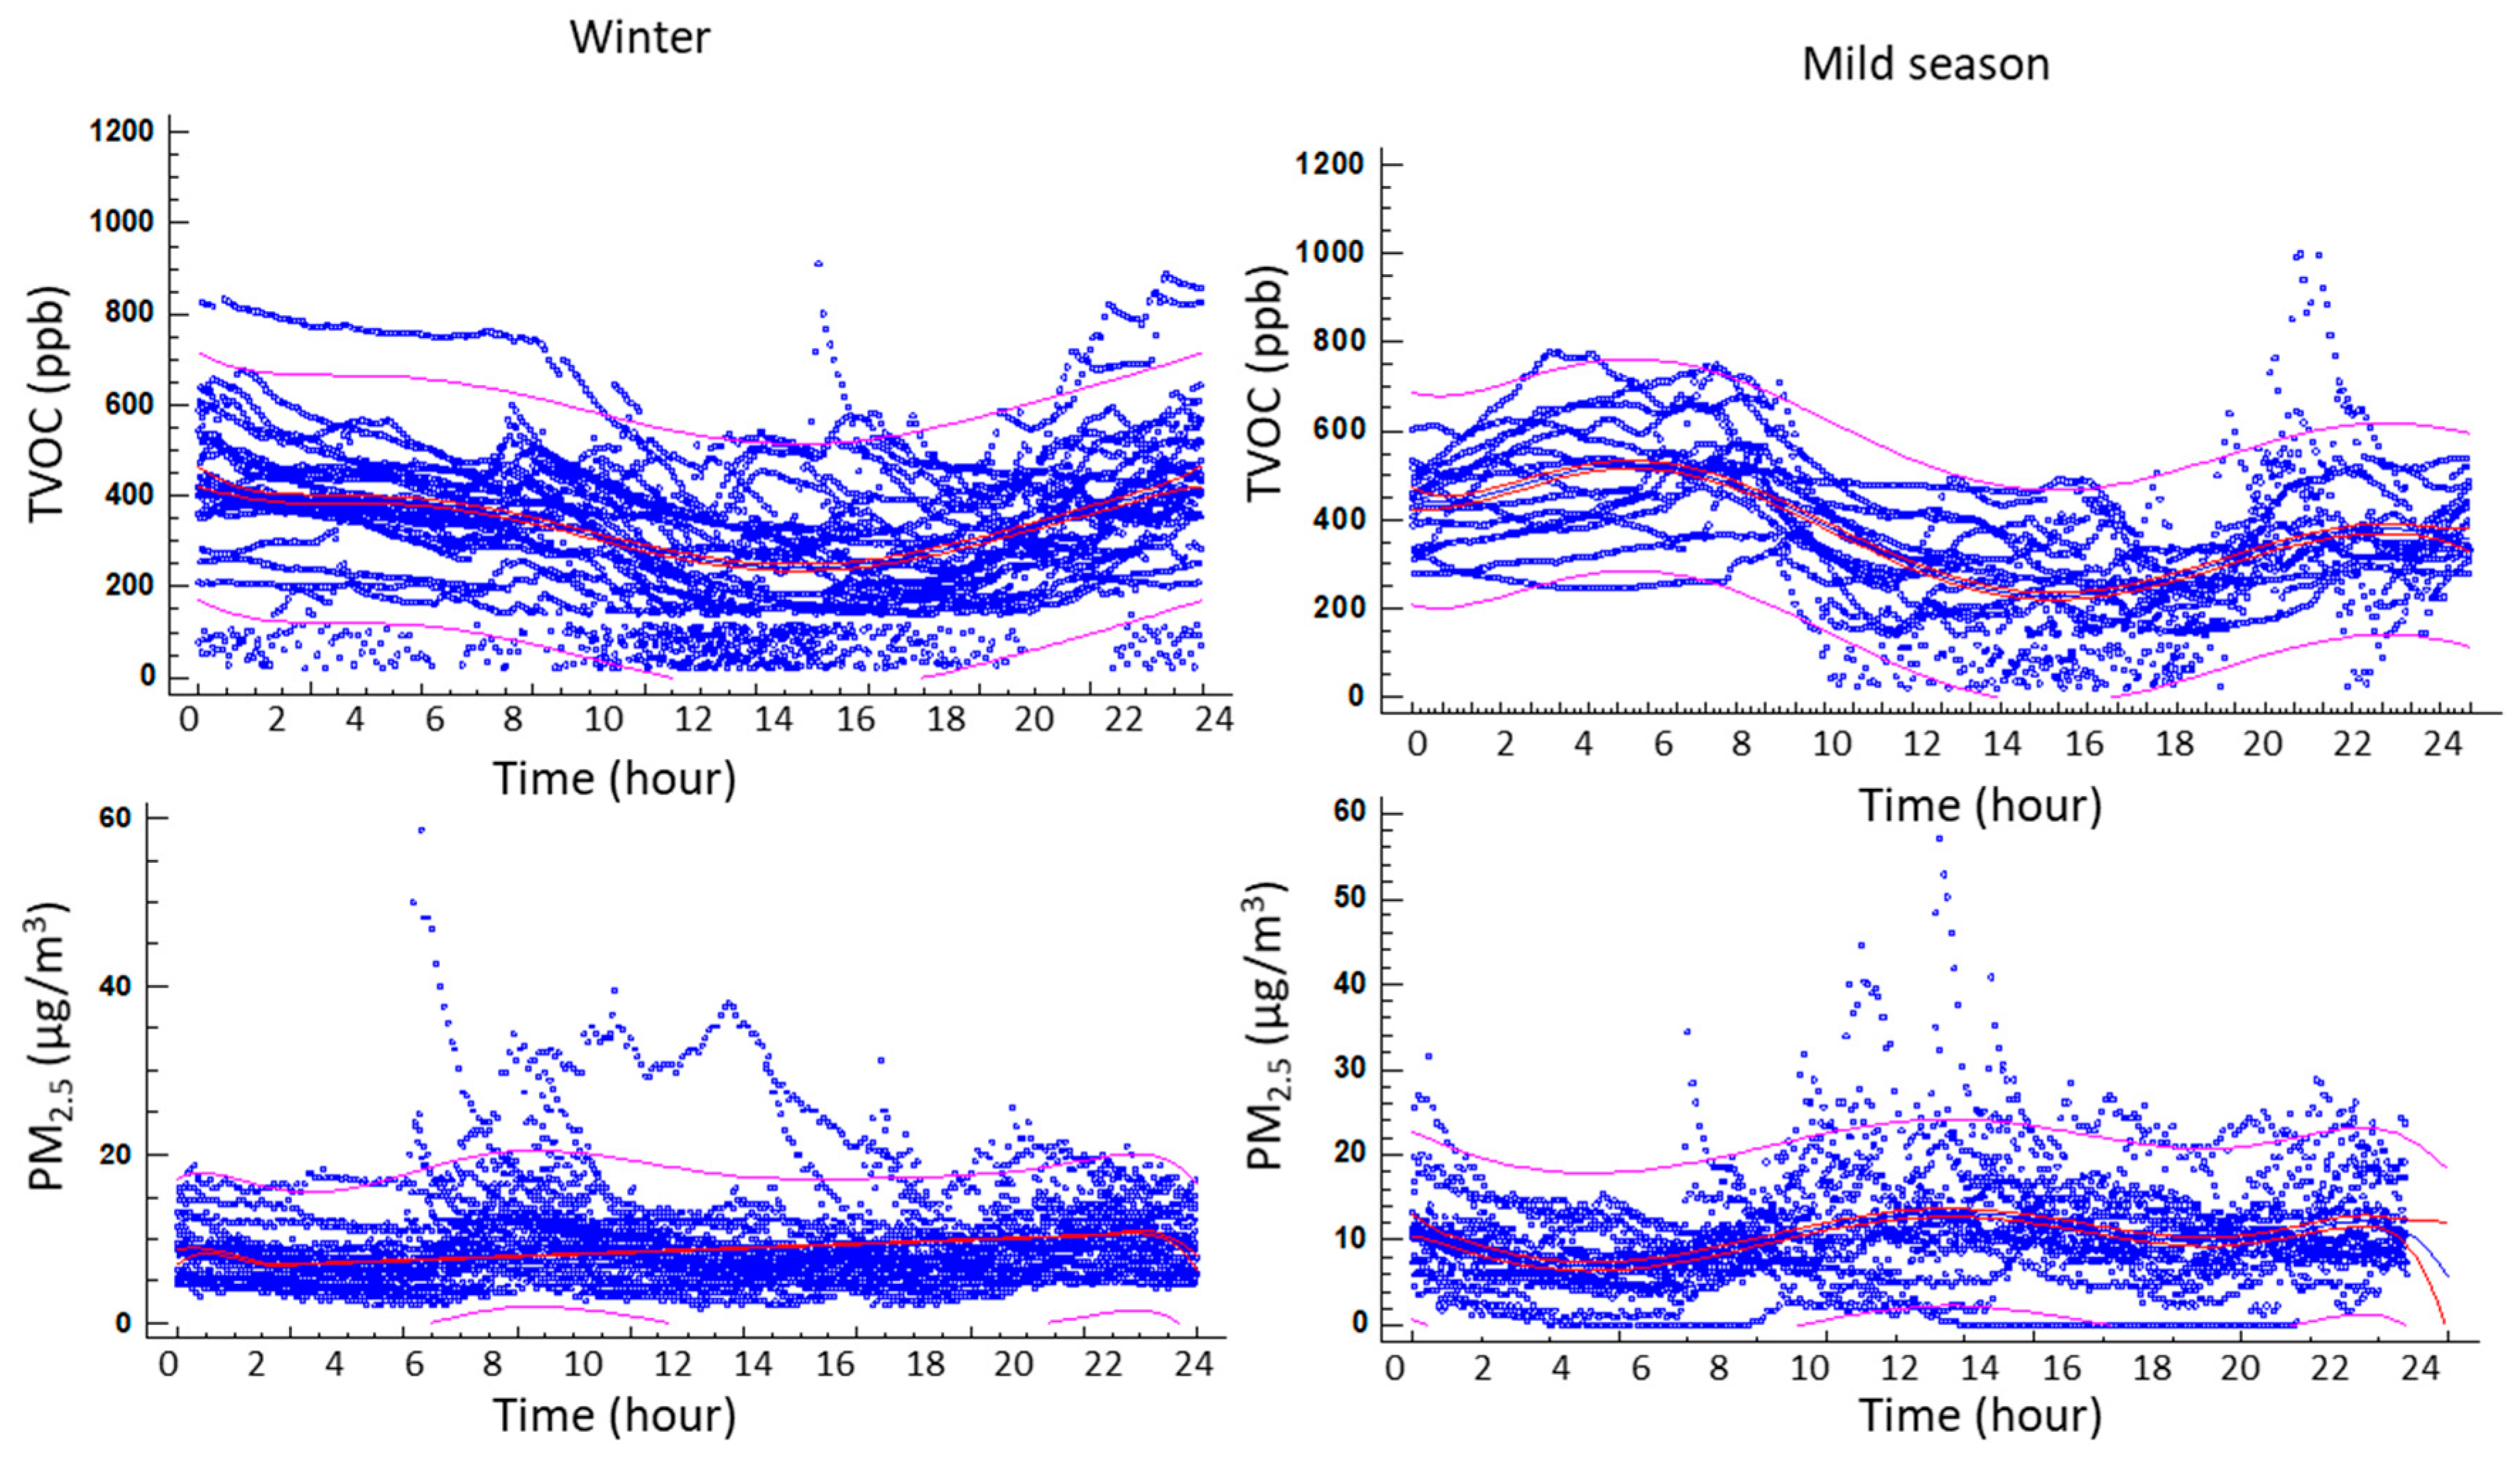
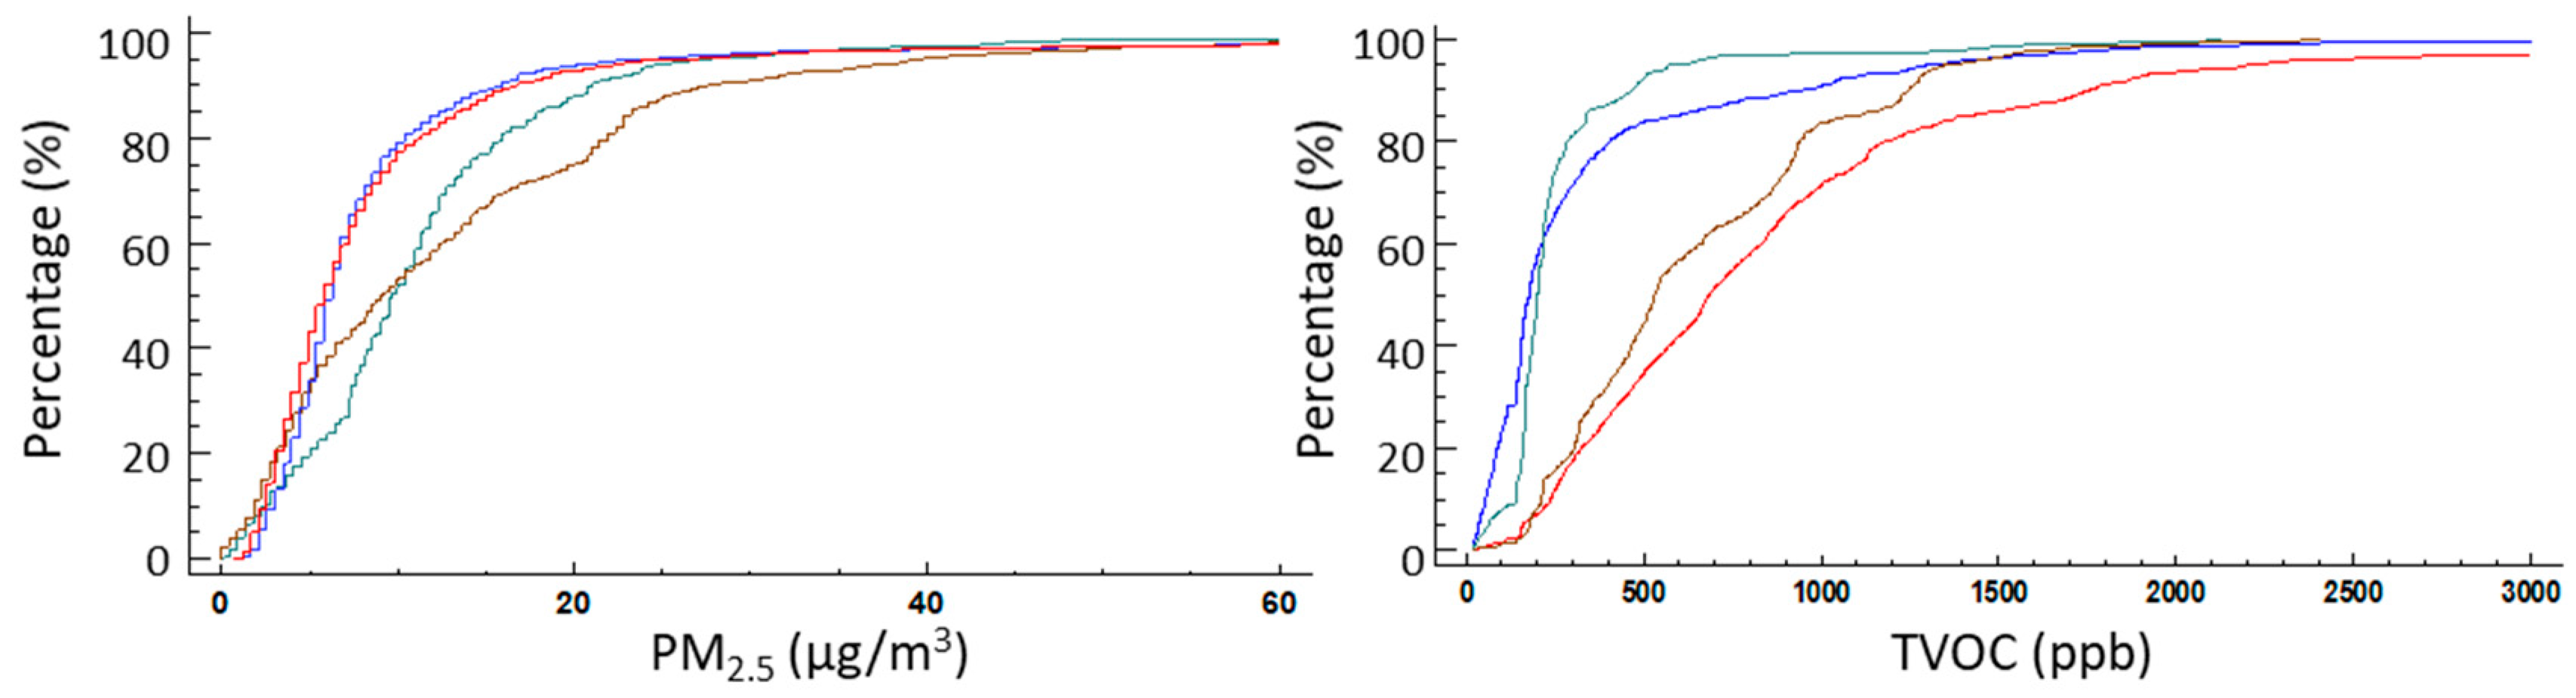
3.2. Particle Concentration (PM2.5)
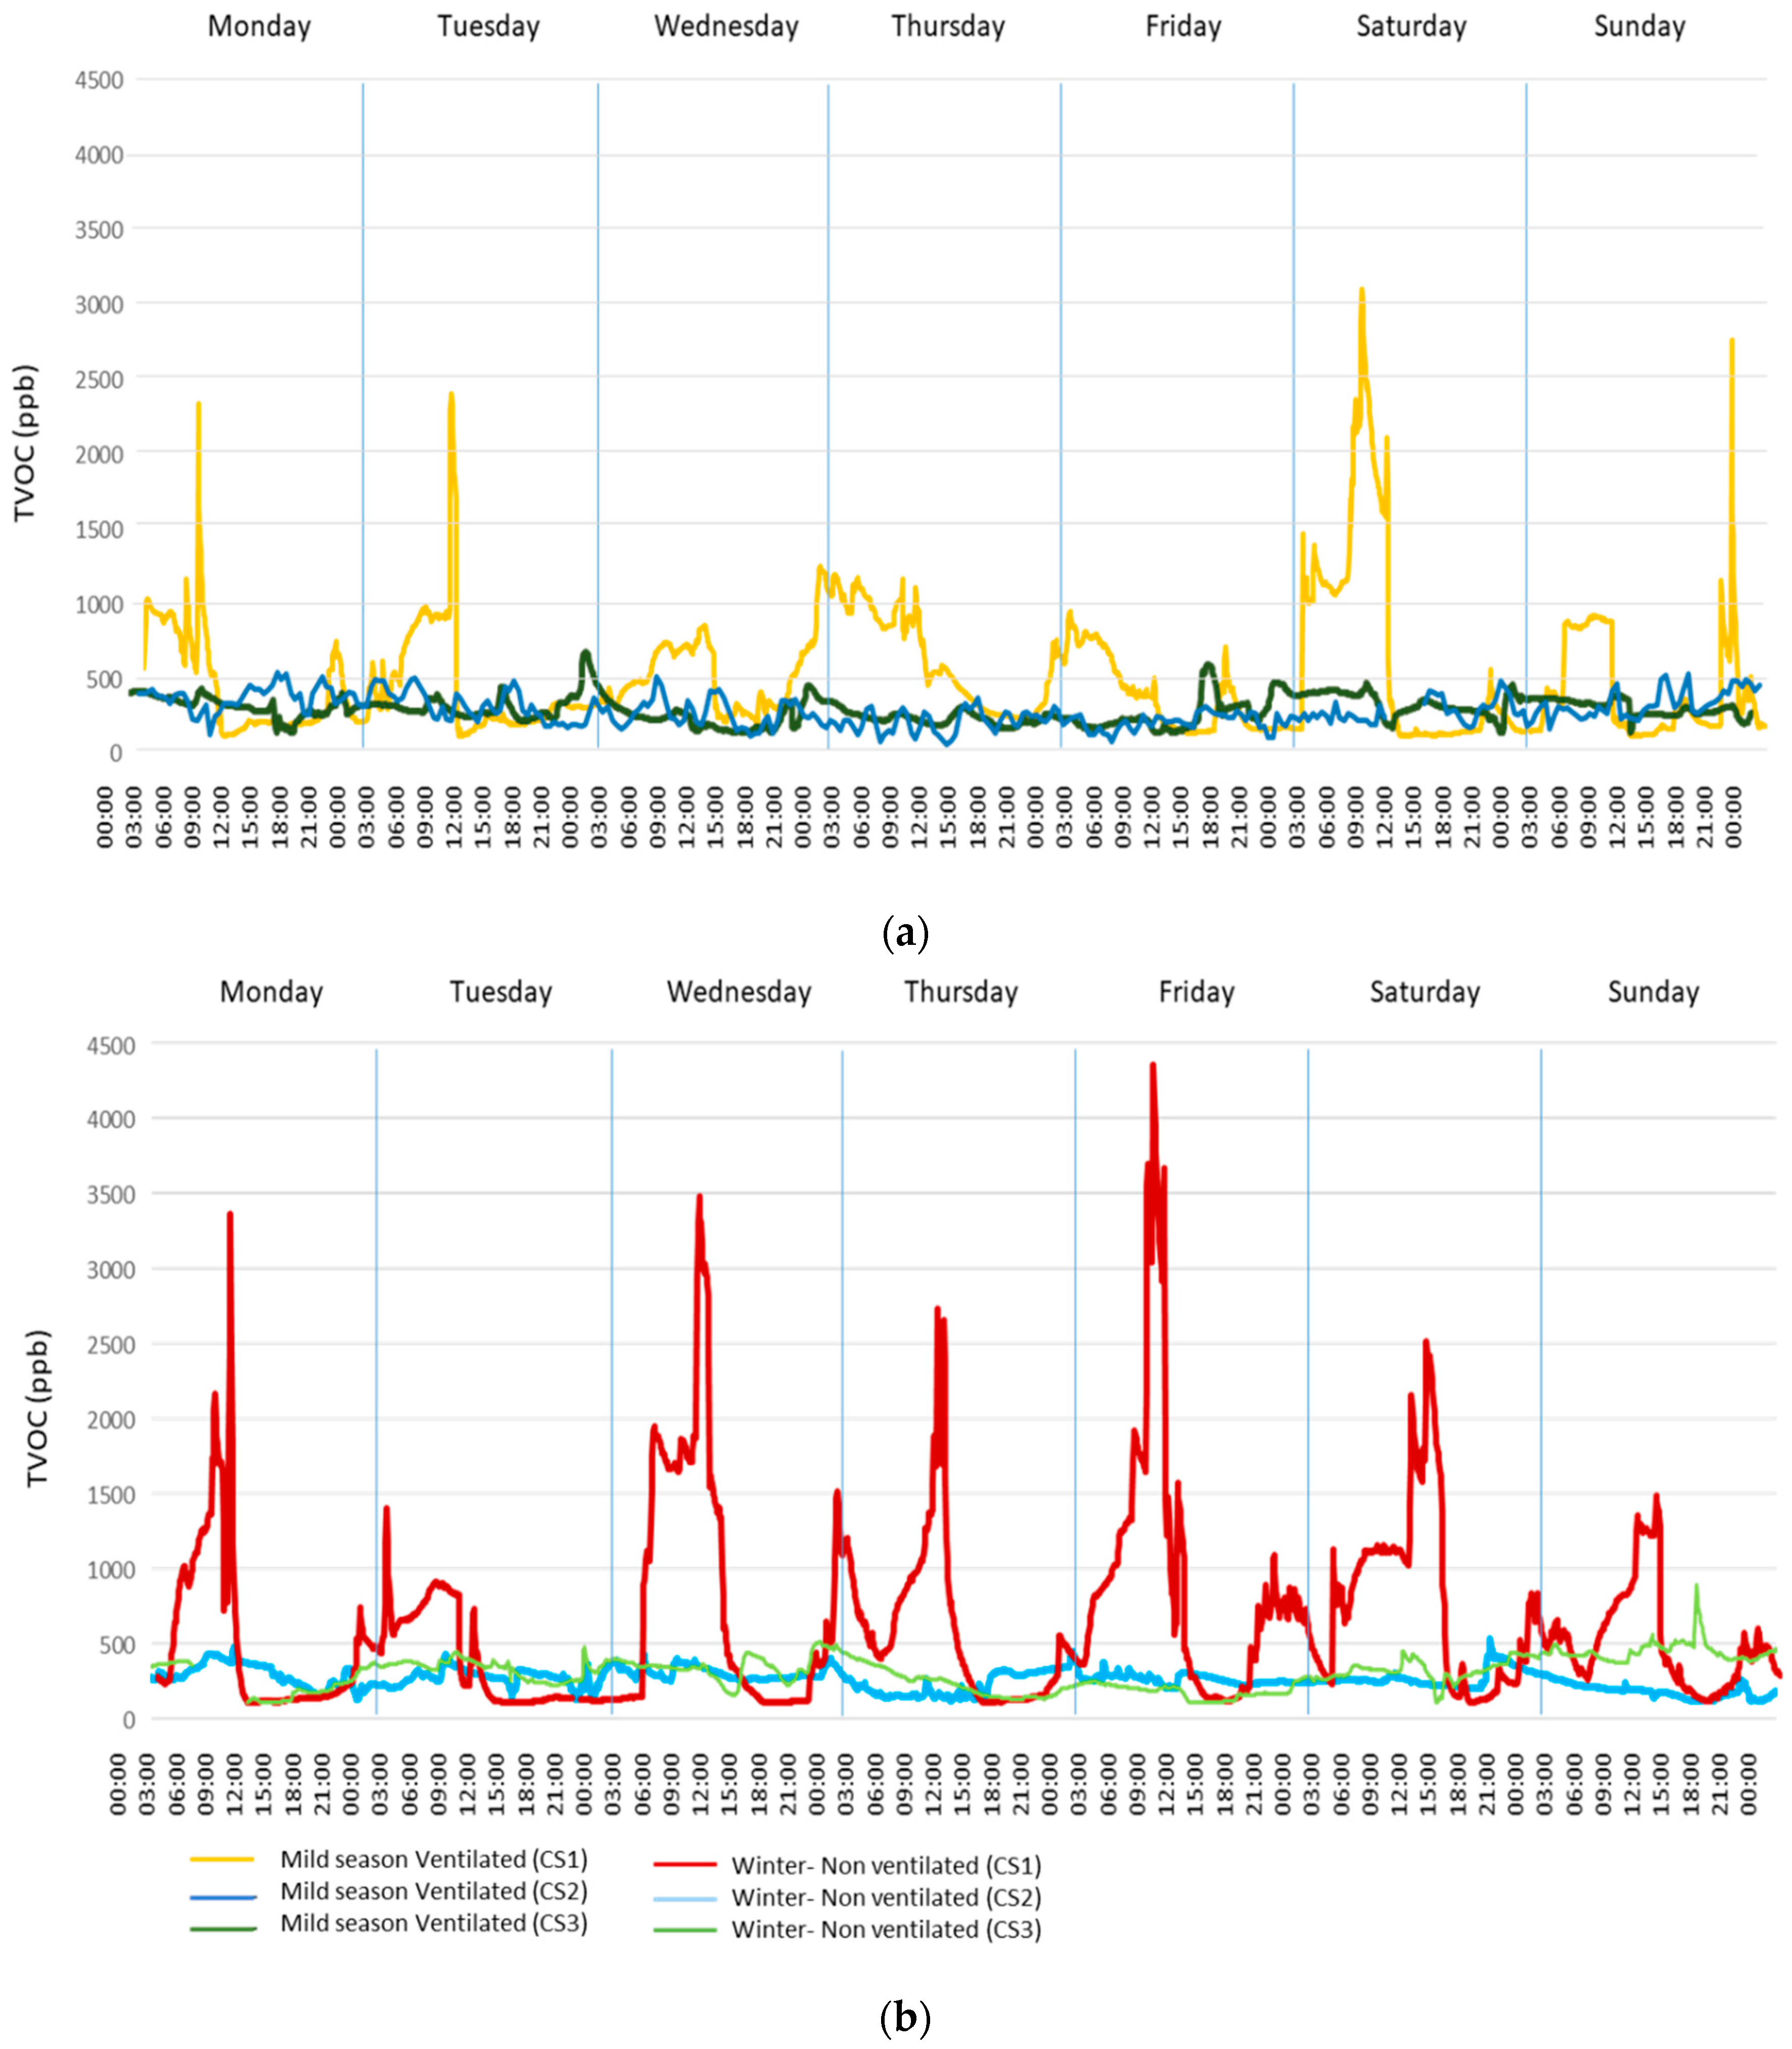
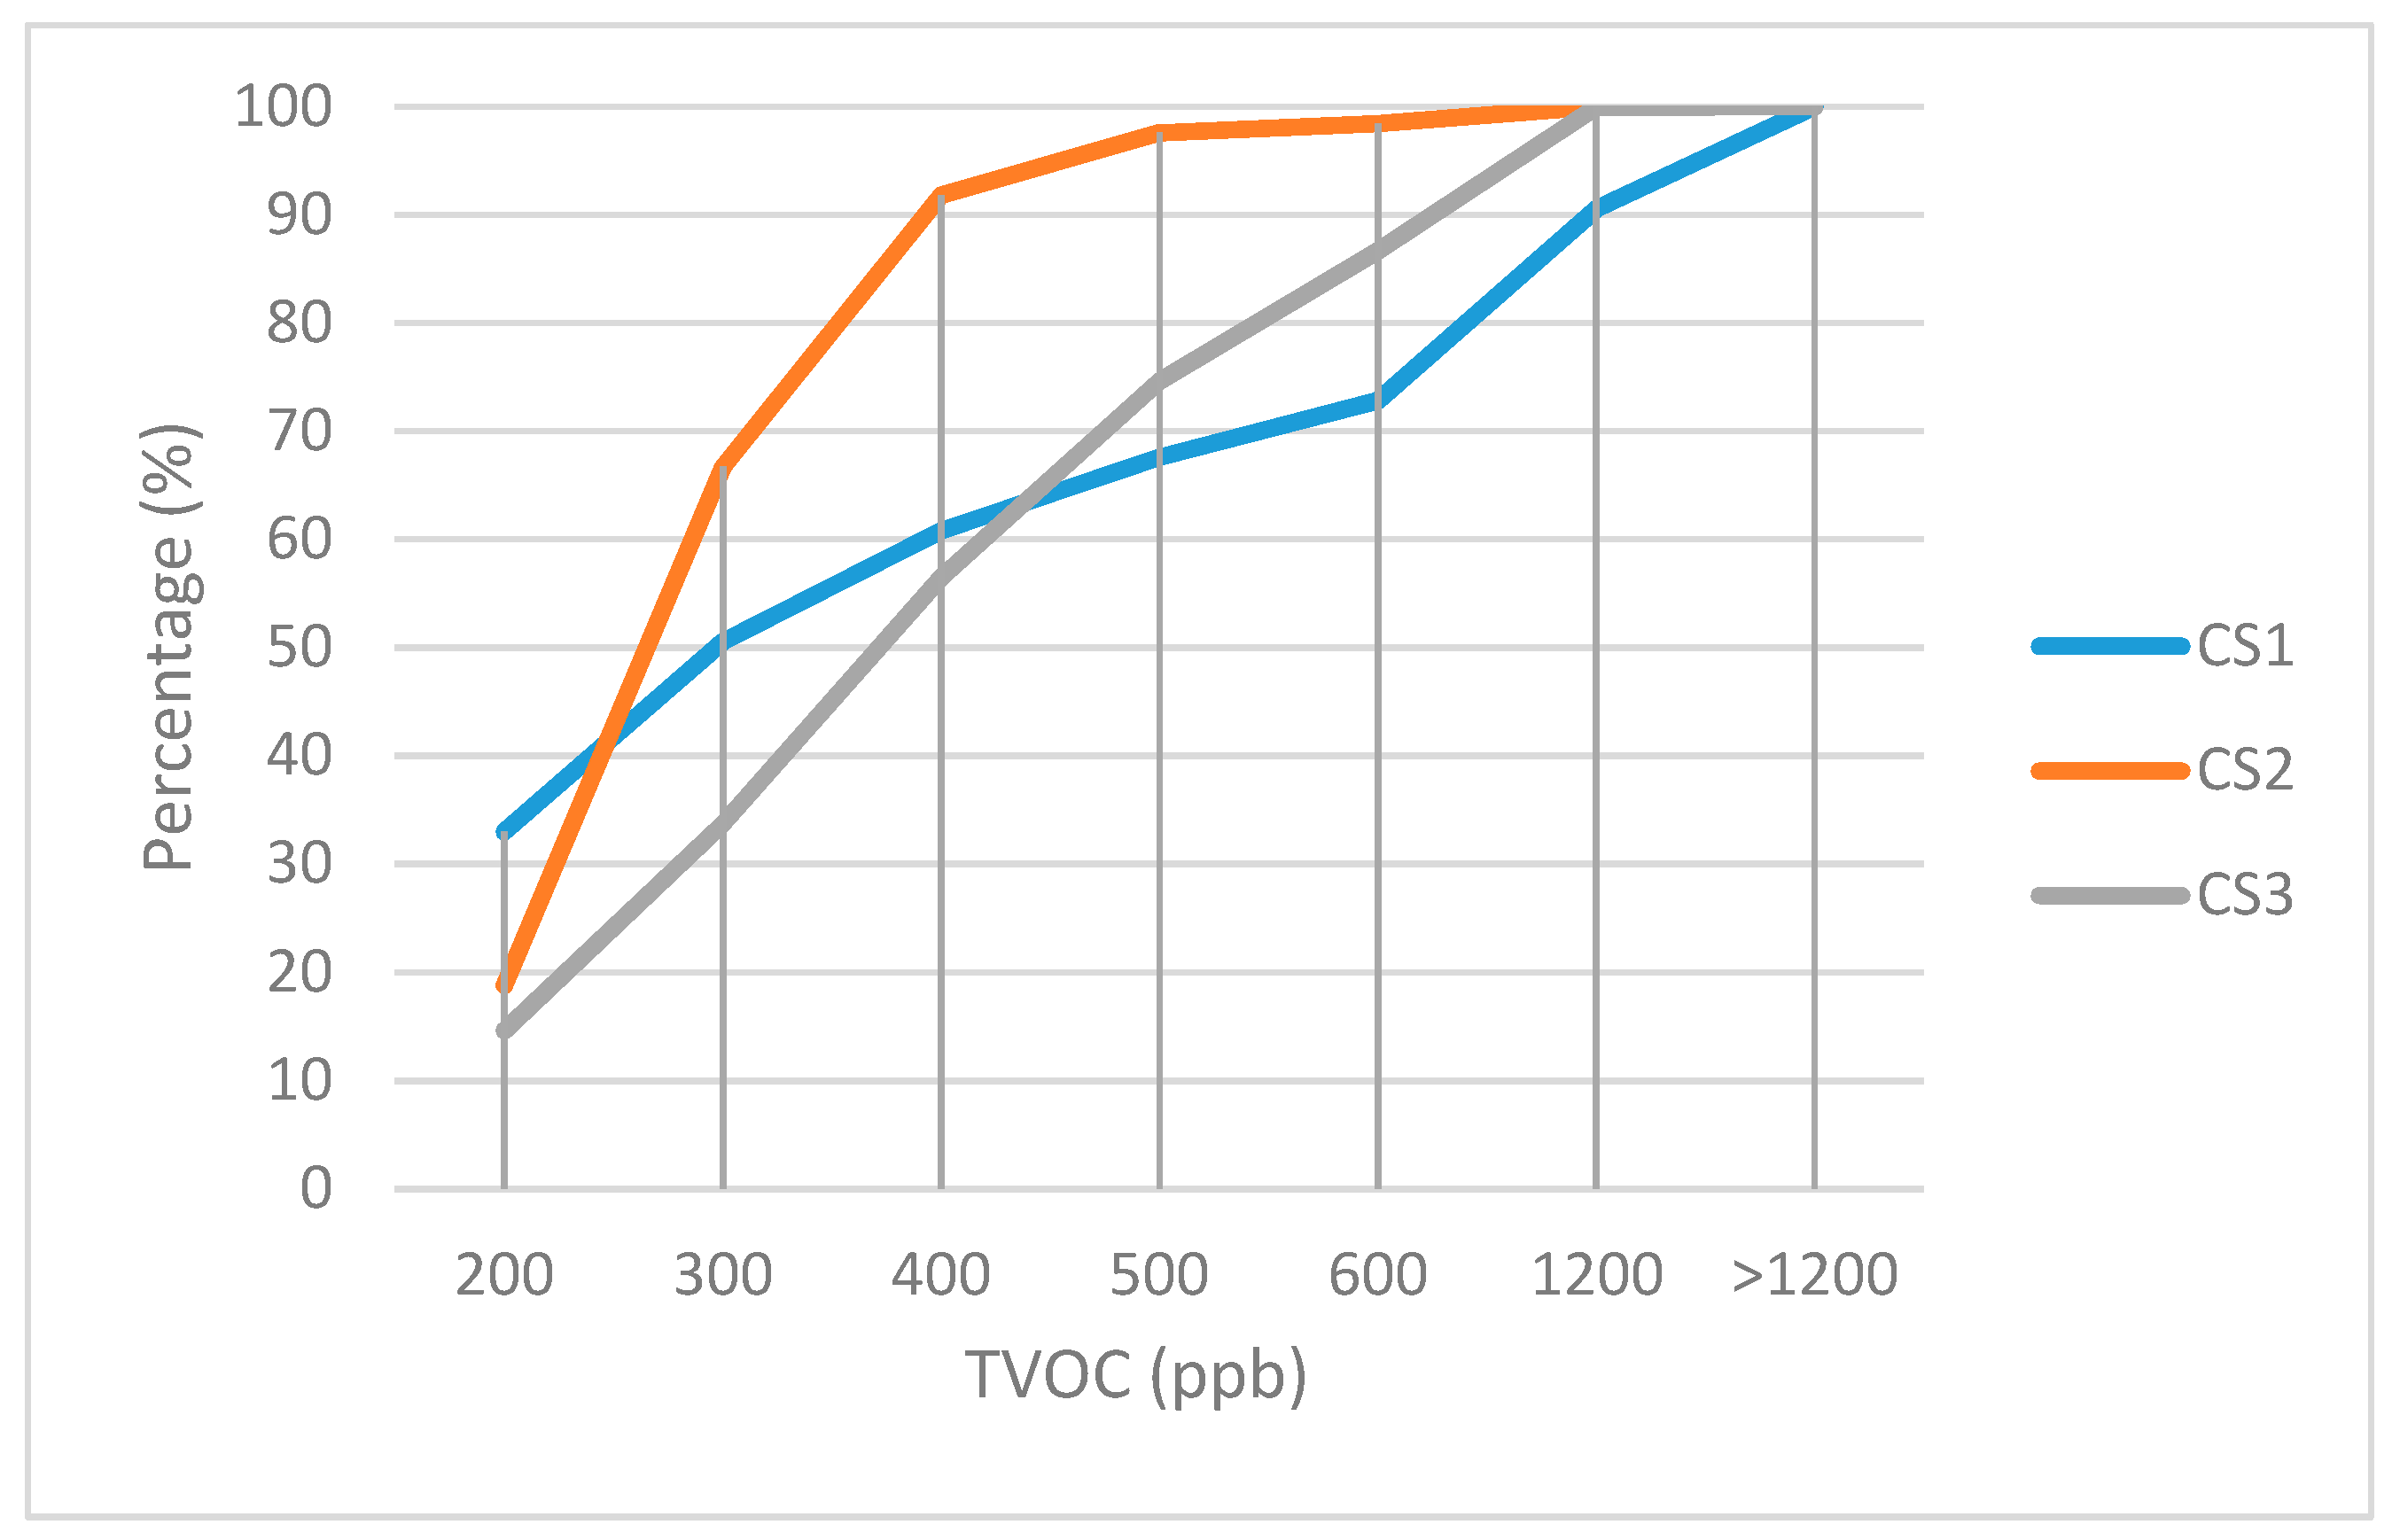
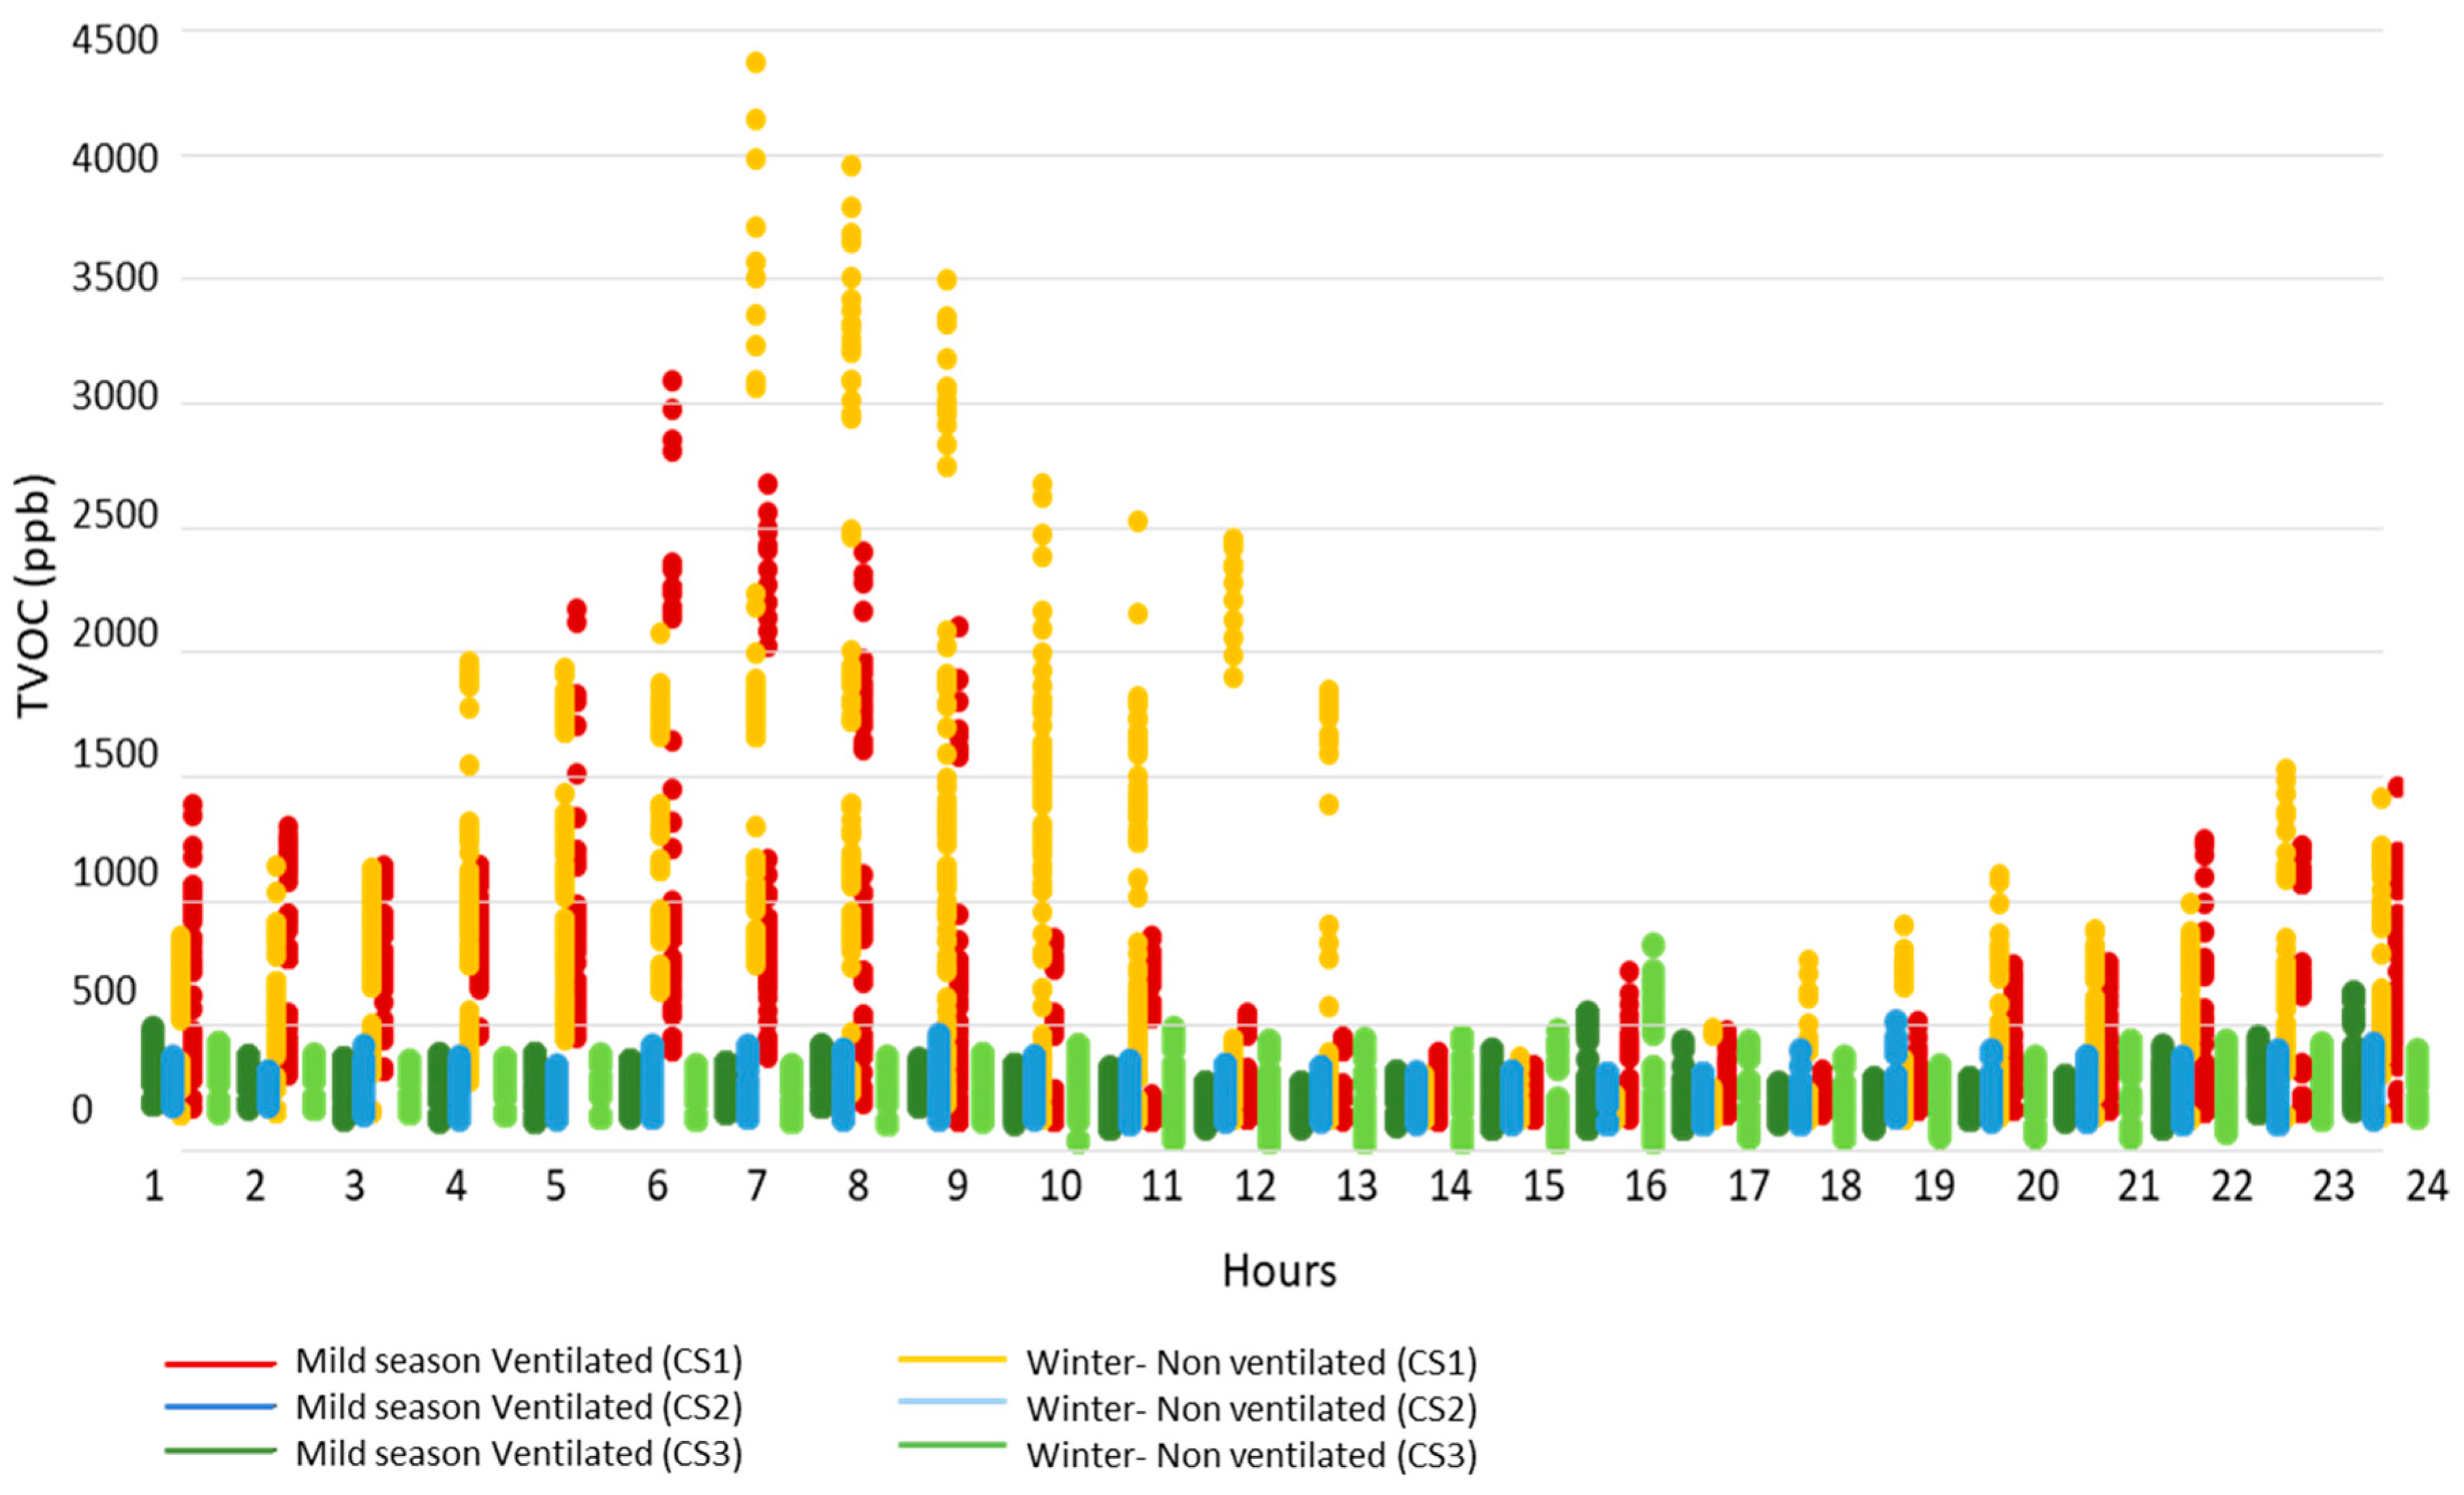
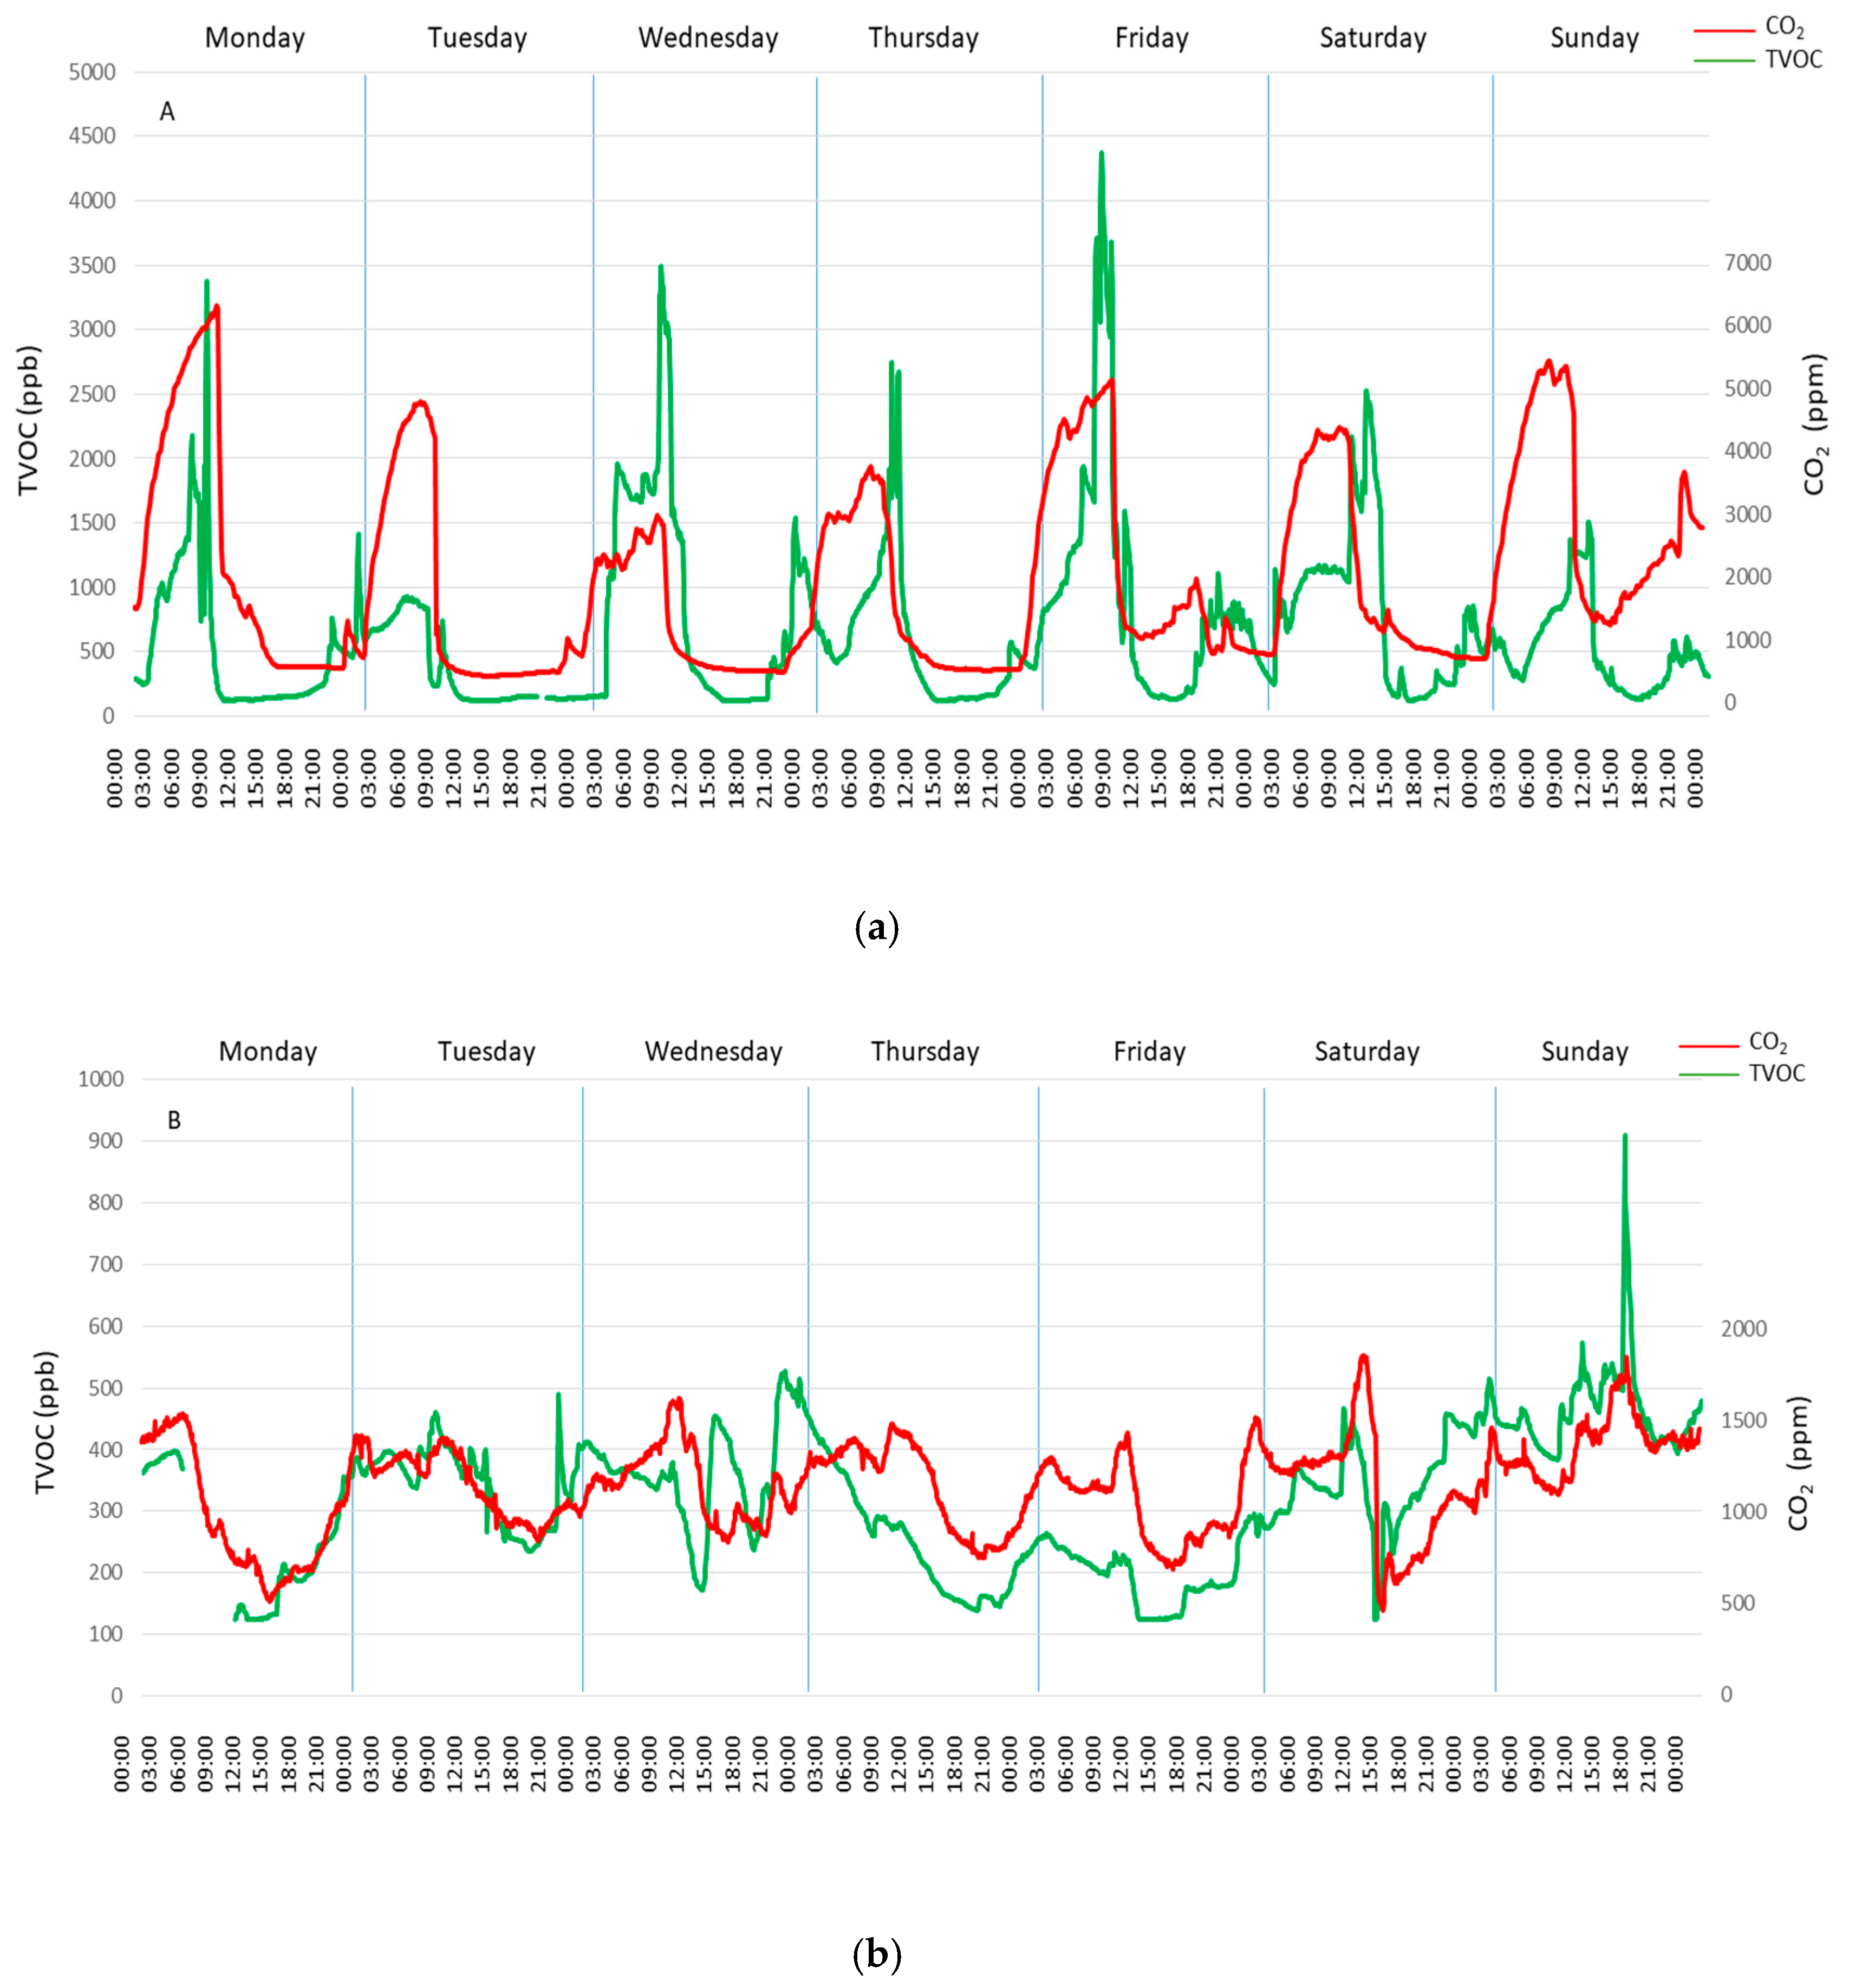
3.3. TVOC Concentration
4. Discussion
5. Conclusions
Author Contributions
Funding
Acknowledgments
Conflicts of Interest
References
- Sendra, J.J.; Domínguez-Amarillo, S.; Bustamante, P.; León, A.L. Energy intervention in the residential sector in the south of spain: Current challenges. Inf. Constr. 2013, 65, 457–464. [Google Scholar] [CrossRef]
- Fernández-Agüera, J.; Sendra Salas, J.J.; Suárez Medina, R.; Domínguez-Amarillo, S. Airtightness and Indoor Air Quality in Subsidised Housing in Spain. In Proceedings of the 36th AIVC Conference, Madrid, Spain, 23–24 September 2015. [Google Scholar]
- Domínguez, S.; Sendra, J.J.; León, A.L.; Esquivias, P.M. Towards Energy Demand Reduction in Social Housing Buildings: Envelope System Optimization Strategies. Energies 2012, 5, 2263–2287. [Google Scholar] [CrossRef]
- Eurostat. Living Conditions in Europe; European Union: Luxembourg, 2014; p. 1. [Google Scholar]
- Pennestrì, D. The energy and Enviromental requalification of post-war housing: Problematics and innovative solutions for the building envelope. In Central Europe Towards Sustainable Buildings 2013: Sustainable Refurbishment of Existing Building Stock; CESB13: Prague, the Czech Republic, 2013; pp. 1–7. Available online: http://www.cesb.cz/cesb13/proceedings/1_refurbishment/CESB13_1243.pdf (accessed on 7 November 2019).
- Domínguez-Amarillo, S.; Sendra, J.J.; Fernández-Agüera, J.; Escandón, R. La Construcción de la Vivienda Social en Sevilla y su Catalogación 1939–1979; Universidad de Sevilla: Sevilla, Spain, 2017. [Google Scholar]
- Ferrari, S.; Zanotto, V. Building Energy Performance Assessment in Southern Europe; Springer: Milano, Italy, 2015. [Google Scholar]
- Matteis, D. Affordable Housing Praxis for Urban Sustainability; Ipertesto. Europen Programme for Urban Sustainable Development: Verona, Italy, 2008. [Google Scholar]
- Domínguez-Amarillo, S.; Sendra, J.J.; Oteiza San José, I. La Envolvente Térmica de la Vivienda Social: El Caso de SEVILLA, 1939 a 1979 Title, 1st ed.; Editorial Consejo Superior de Investigaciones Científicas: Madrid, Spain, 2016. [Google Scholar]
- Allen, J.; Barlow, J.; Leal, J.; Maloutas, T.; Padovani, L. Housing and Welfare in Southern Europe; Blackwell Publishing Ltd: Hoboken, NJ, USA, 2008. [Google Scholar]
- BPIE. Europe’s Buildings under the Microscope; European Union: Bruxelles, Belgium, 2011. [Google Scholar]
- Código Técnico de la Edificación (CTE); Real Decreto 314/2006 de 17 de marzo: Madrid, Spain, 2006; Volume BOE 74 Ministerio de vivienda, pp. 1816–11831.
- Fernández-Agüera, J.; Domínguez-Amarillo, S.; Sendra, J.J.; Suárez, R. An approach to modelling envelope airtightness in multi-family social housing in Mediterranean Europe based on the situation in Spain. Energy Build. 2016, 128, 236–253. [Google Scholar] [CrossRef]
- Fernández-Agüera, J.; Sendra, J.J.; Domínguez, S.; Domínguez-Amarillo, S. Protocols for measuring the airtightness of multi-dwelling units in Southern Europe. Procedia Eng. 2011, 21, 98–105. [Google Scholar] [CrossRef]
- Fernández-Agüera, J.; Domínguez-Amarillo, S.; Sendra, J.J.; Suárez, R.; Oteiza, I. Social housing airtightness in Southern Europe. Energy Build. 2019, 183, 377–391. [Google Scholar] [CrossRef]
- Santamouris, M.; Kolokotsa, D.; Santamouris, M. On the impact of urban overheating and extreme climatic conditions on housing, energy, comfort and environmental quality of vulnerable population in Europe. Energy Build. 2015, 98, 125–133. [Google Scholar] [CrossRef]
- Giancola, E.; Soutullo, S.; Olmedo, R.; Heras, M.; Celemin, M.D.R. Evaluating rehabilitation of the social housing envelope: Experimental assessment of thermal indoor improvements during actual operating conditions in dry hot climate, a case study. Energy Build. 2014, 75, 264–271. [Google Scholar] [CrossRef]
- Domínguez-Amarillo, S.; Fernández-Agüera, J.; Sendra, J.J.; Roaf, S. Rethinking User Behaviour Comfort Patterns in the South of Spain—What Users Really Do. Sustainability 2018, 10, 4448. [Google Scholar] [CrossRef]
- McGill, G.; Oyedele, L.O.; McAllister, K. Case study investigation of indoor air quality in mechanically ventilated and naturally ventilated UK social housing. Int. J. Sustain. Built Environ. 2015, 4, 58–77. [Google Scholar] [CrossRef]
- European Commission. Risk Assessment on Inddor Air Quality; Eurpean Union: Brussels, Belgium, 2007. [Google Scholar]
- Begum, B.A.; Hopke, P.K. Identification of Sources from Chemical Characterization of Fine Particulate Matter and Assessment of Ambient Air Quality in Dhaka Bangladesh. Aerosol Air Qual. Res. 2018, 19, 118–128. [Google Scholar] [CrossRef]
- Kozákovác, J.; Leoni, C.; Klán, M.; Hovorka, J.; Racek, M.; Kostejn, M.; Ondráček, J.; Moravec, P.; Schwarz, J. Chemical Characterization of PM1-2.5 and its Associations with PM1, PM2.5-10 and Meteorology in Urban and Suburban Environments. Aerosol Air Qual. Res. 2018, 18, 1684–1697. [Google Scholar] [CrossRef]
- Vormittag, E.M.; Rodrigues, C.G.; De André, P.A.; Saldiva, P.H.N. Assessment and Valuation of Public Health Impacts from Gradual Biodiesel Implementation in the Transport Energy Matrix in Brazil. Aerosol Air Qual. Res. 2018, 18, 2375–2382. [Google Scholar] [CrossRef]
- Sarigiannis, D.A.; Kermenidou, M.; Nikolaki, S.; Zikopoulos, D.; Karakitsios, S.P. Mortality and Morbidity Attributed to Aerosol and Gaseous Emissions from Biomass Use for Space Heating. Aerosol Air Qual. Res. 2015, 15, 2496–2507. [Google Scholar] [CrossRef]
- Patino, E.D.L.; Siegel, J.A. Indoor environmental quality in social housing: A literature review. Build. Environ. 2018, 131, 231–241. [Google Scholar] [CrossRef]
- Vardoulakis, S.; Dimitroulopoulou, C.; Thornes, J.; Lai, K.-M.; Taylor, J.; Myers, I.; Heaviside, C.; Mavrogianni, A.; Shrubsole, C.; Chalabi, Z.; et al. Impact of climate change on the domestic indoor environment and associated health risks in the UK. Environ. Int. 2015, 85, 299–313. [Google Scholar] [CrossRef] [PubMed]
- Arvanitis, A.; Kotzias, D.; Kephalopoulos, S.; Carrer, P.; Cavallo, D.; Cesaroni, G.; De Brouwere, K.; de Oliveira-Fernandes, E.; Forastiere, F.; Fossati, S.; et al. The INDEX-PM project: Health risks from exposure to indoor particulate matter. Fresenius Environ. Bull. 2010, 9, 2458–2471. [Google Scholar]
- Bari, M.A.; Kindzierski, W.B.; Wheeler, A.J.; Héroux, M.-E.; Wallace, L.A. Source apportionment of indoor and outdoor volatile organic compounds at homes in Edmonton, Canada. Build. Environ. 2015, 90, 114–124. [Google Scholar] [CrossRef]
- Jones, A.P. Indoor air quality and health. Atmos. Environ. 1999, 33, 4535–4564. [Google Scholar] [CrossRef]
- Deng, Q.; Lu, C.; Ou, C.; Liu, W. Effects of early life exposure to outdoor air pollution and indoor renovation on childhood asthma in China. Build. Environ. 2015, 93, 84–91. [Google Scholar] [CrossRef]
- McGill, G.; Qin, M.; Oyedele, L. A case study investigation of indoor air quality in UK Passivhaus dwellings. Energy Procedia 2014, 62, 190–199. [Google Scholar] [CrossRef]
- McGill, G.; Oyedele, L.O.; McAllister, K.; Qin, M. Effective indoor air quality for energy-efficient homes: A comparison of UK rating systems. Archit. Sci. Rev. 2016, 59, 159–173. [Google Scholar] [CrossRef]
- Vilčeková, S.; Apostoloski, I.; Mečiarová, Ľ.; Burdová, E.; Kiseľák, J. Investigation of Indoor Air Quality in Houses of Macedonia. Int. J. Environ. Res. Public Health 2017, 14, 37. [Google Scholar] [CrossRef] [PubMed]
- Mečiarová, Ľ; Vilčeková, S.; Burdová, E.K.; Kiselák, J. Factors Effecting the Total Volatile Organic Compound (TVOC) Concentrations in Slovak Households. Int. J. Environ. Res. Public Health 2017, 14, 1443. [Google Scholar]
- Satish, U.; Mendell, M.J.; Shekhar, K.; Hotchi, T.; Sullivan, D.; Streufert, S.; Fisk, W.J. Is CO2 an indoor pollutant? Direct effects of low-to-moderate CO2 concentrations on human decision-making performance. Environ. Health Perspect. 2012, 120, 1671–1677. [Google Scholar] [CrossRef] [PubMed]
- Hesaraki, A.; Myhren, J.A.; Holmberg, S. Influence of different ventilation levels on indoor air quality and energy savings: A case study of a single-family house. Sustain. Cities Soc. 2015, 19, 165–172. [Google Scholar] [CrossRef]
- Derbez, M.; Berthineau, B.; Cochet, V.; Lethrosne, M.; Pignon, C.; Ribéron, J.; Kirchner, S. Indoor air quality and comfort in seven newly built, energy-efficient houses in France. Build. Environ. 2014, 72, 173–187. [Google Scholar] [CrossRef]
- Fernández-Agüera, J.; Domínguez-Amarillo, S.; Alonso, C.; Martín-Consuegra, F.; Domínguez, S. Thermal comfort and indoor air quality in low-income housing in Spain: The influence of airtightness and occupant behaviour. Energy Build. 2019, 199, 102–114. [Google Scholar] [CrossRef]
- Fernández-Agüera, J.; Campano, M.Á.; Domínguez-Amarillo, S.; Acosta, I.; Sendra, J.J. CO2 Concentration and Occupants’ Symptoms in Naturally Ventilated Schools in Mediterranean Climate. Buildings 2019, 9, 197. [Google Scholar]
- Missia, D.A.; Demetriou, E.; Michael, N.; Tolis, E.; Bartzis, J. Indoor exposure from building materials: A field study. Atmos. Environ. 2010, 44, 4388–4395. [Google Scholar] [CrossRef]
- Rosch, C.; Kohajda, T.; Röder, S.; Von Bergen, M.; Schlink, U. Relationship between sources and patterns of VOCs in indoor air. Atmos. Pollut. Res. 2014, 5, 129–137. [Google Scholar] [CrossRef]
- Sharpe, T.; Farren, P.; Howieson, S.; Tuohy, P.G.; McQuillan, J. Occupant interactions and effectiveness of natural ventilation strategies in contemporary new housing in Scotland, UK. Int. J. Environ. Res. Public Health 2015, 12, 8480–8497. [Google Scholar] [CrossRef] [PubMed]
- Langer, S.; Bekö, G. Indoor air quality in the Swedish housing stock and its dependence on building characteristics. Build. Environ. 2013, 69, 44–54. [Google Scholar] [CrossRef]
- D’Ambrosio Alfano, F.R.; Dell’Isola, M.; Ficco, G.; Palella, B.I.; Riccio, G. Experimental air-tightness analysis in mediterranean buildings after windows retrofit. Sustainability 2016, 8, 991. [Google Scholar] [CrossRef]
- Imessad, K.; Derradji, L.; Mokhtari, F.; Chenak, A.; Kharchi, R.; Messaoudene, N.A. Impact of passive cooling techniques on energy demand for residential buildings in a Mediterranean climate. Renew. Energy 2014, 71, 589–597. [Google Scholar] [CrossRef]
- De Vivienda, M. Real Decreto 314/2006, de 17 de Marzo, por el que se Aprueba el Código Técnico de la Edificación; BOE-A-2006-5515; Gobierno de España, España, 2006; Available online: https://www.boe.es/buscar/doc.php?id=BOE-A-2006-5515 (accessed on 7 November 2019).
- Instituto Nacional de Estadistica. Encuesta Continua de Hogares Año 2017; INE: Madrid, Spain, 2017. [Google Scholar]
- Rubel, F.; Kottek, M. Observed and projected climate shifts 1901-2100 depicted by world maps of the Köppen-Geiger climate classification. Meteorol. Z. 2010, 19, 135–141. [Google Scholar] [CrossRef]
- Vasconcelos, J.; Freire, E.; Morais, J.; Machado, J.; Santana, P. The health impacts of poor housing conditions and thermal discomfort. Procedia Environ. Sci. 2011, 4, 158–164. [Google Scholar] [CrossRef]
- AEMET. Guía Resumida del Clima en España (1981–2010); Agencia Estatal de Meteorología: Madrid, Spain, 2012. [Google Scholar]
- UNE-EN ISO 7726:2002. Ergonomía de los Ambientes Térmicos. Instrumentos de Medida de las Magnitudes Físicas; Asociación Española de Normalización–ISO: Madrid, Spain, 2002. [Google Scholar]
- Sousan, S.; Koehler, K.; Hallett, L.; Thomas, P. Evaluation of consumer monitors to measure particulate matter. J. Aerosol Sci. 2017, 107, 123–133. [Google Scholar] [CrossRef]
- Seppanen, O.A.; Fisk, W.J.; Mendell, M.J. Association of ventilation rates and CO2 concentrations with health and other responses in commercial and institutional buildings. Indoor Air 1999, 9, 226–252. [Google Scholar] [CrossRef]
- Porteus, C.D. Sensing a historic low CO2 future. In Chemistry, Emission Control, Radioactive Pollution and Indoor Air Quality; Books on Demand: Norderstedt, Germany, 2011. [Google Scholar]
- CEN EN Standrad 15251. Indoor Environment Input Parameters for Design and Assessment of Energy Performance of Buildings; New CEN standard: EN: Madrid, Spain, 2007. [Google Scholar]
- Witorsch, P.; Spagnolo, S.V. Air Pollution and Lung Disease in Adults; CRC Press: Boca Raton, FL, USA, 1994. [Google Scholar]
- Karagulian, F.; Belis, C.A.; Dora, C.F.C.; Prüss-Ustün, A.M.; Bonjour, S.; Adair-Rohani, H.; Amann, M. Contributions to cities’ ambient particulate matter (PM): A systematic review of local source contributions at global level. Atmos. Environ. 2015, 120, 475–483. [Google Scholar] [CrossRef]
- ISO. ISO 23210: Stationary Source Emissions—Determination of PM10/PM2,5 Mass Concentration in Flue Gas—Measurement at Low Concentrations by Use of Impactors; International Organization for Standardization: Geneva, Switzerland, 2009. [Google Scholar]
- Henschel, S.; Chan, G.; World Health Organization. Health Risks of Air Pollution in Europe—HRAPIE Project New Emerging Risks to Health from Air Pollution—Results from the Survey of Experts; World Heath Organization (WHO): Geneva, Switzerland, 2013. [Google Scholar]
- Katsouyanni, K. Ambient air pollution and health. Br. Med. Bull. 2003, 68, 143–156. [Google Scholar] [CrossRef]
- Autrup, H. Ambient air pollution and adverse health effects. Procedia Soc. Behav. Sci. 2010, 2, 7333–7338. [Google Scholar] [CrossRef][Green Version]
- OMS. Guías de Calidad del aire de la OMS Relativas al Material Particulado, el Ozono, el Dióxido de Nitrógeno y el Dióxido de Azufre. Actualización Mundial 2005; Organización Mundial de la Salud: Geneva, Switzerland, 2005; p. 25. [Google Scholar]
- Gotschi, T.; Oglesby, L.; Mathys, P.; Monn, C.; Manalis, N.; Koistinen, K.; Jantunen, M.; Hanninen, O.; Polanska, L.; Kunzli, N. Comparison of black smoke and PM2.5 levels in indoor and outdoor environments of four European cities. Environ. Sci. Technol. 2002, 36, 1191–1197. [Google Scholar] [CrossRef] [PubMed]
- European Collaborative Action. Sampling Strategies for Volatile Organic Compounds in Indoor Air; Publications Office of the European Union: Brussels, Belgium, 1995. [Google Scholar]
- Larsen, L. Environmental Health Sourcebook; Omnigraphics: Detroit, MI, USA, 2010. [Google Scholar]
- Fujiwara, D. Indoor Air Quality Assessment; Ontoario Association of Architects: Toronto, ON, Canada, 2014. [Google Scholar]
- U.S. EPA. Exposure Factors Handbook 2011 Edition (Final Report); EPA/600/R-09/052F; U.S. Environmental Protection Agency: Washington, DC, USA, 2011. [Google Scholar]
- Penney, D.; Benignus, V.; Kephalopoulos, S.; Kotzias, D.; Kleinman, M.; Verrier, A. Guidelines for Indoor Air Quality; National Institutes for Healt: Bethesda, MD, USA, 2010. [Google Scholar]
- EEA. Air Quality in EUROPE—2016 Report; European Environment Agency: København, Denmark, 2016. [Google Scholar]
- Martín-Olmedo, P.; Sánchez-Villegas, P.; Daponte, A. Improving Knowledge and Communication for Decision Making on Air Pollution and Health in Europe: Local City Report Seville; Public Health Agency of Barcelona: Barcelona, Spain, 2008. [Google Scholar]
- Alonso, E.F.; Martínez, T.R.; Cambra, K.C.; Lopez, L.C.; Boldo, E.P.; Zorrilla, B.T.; Daponte, A.C.; Aguilera, I.J.; Toro, S.C.; Iñiguez, C.H.; et al. Health impact evaluation of particle air pollution in five Spanish cities. European APHEIS project. Rev. Esp. Salud Publica 2005, 79, 297–308. [Google Scholar]
- Tan, C.C.; Finney, K.N.; Chen, Q.; Russell, N.V.; Sharifi, V.N.; Swithenbank, J. Experimental investigation of indoor air pollutants in residential buildings. Indoor Built Environ. 2013, 22, 471–489. [Google Scholar] [CrossRef]
- Gens, A.; Hurley, J.F.; Tuomisto, J.T.; Friedrich, R. Health impacts due to personal exposure to fine particles caused by insulation of residential buildings in Europe. Atmos. Environ. 2014, 84, 213–221. [Google Scholar] [CrossRef]
- Asikainen, A.; Carrer, P.; Kephalopoulos, S.; Fernandes, E.D.O.; Wargocki, P.; Hanninen, O. Reducing burden of disease from residential indoor air exposures in Europe (HEALTHVENT project). Environ. Health 2016, 15, S35. [Google Scholar] [CrossRef]
- Fernández-Agüera, J.; Domínguez-Amarillo, S.; Sendra, J.J.; Suarez, R. Predictive models for airtightness in social housing in a Mediterranean region. Sustain. Cities Soc. 2019, 51, 101695. [Google Scholar] [CrossRef]
- Norton, T.; Grant, J.; Fallon, R.; Sun, D.-W. Optimising the ventilation configuration of naturally ventilated livestock buildings for improved indoor environmental homogeneity. Build. Environ. 2010, 45, 983–995. [Google Scholar] [CrossRef]
- Prignon, M.; Van Moeseke, G. Factors influencing airtightness and airtightness predictive models: A literature review. Energy Build. 2017, 146, 87–97. [Google Scholar] [CrossRef]


| Case Study | CS1 | CS2 | CS3 |
|---|---|---|---|
| Year of construction | 1965 | 1978 | 1993 |
| N° inhabitants | 2 | 2 | 4 |
| Floor area (m2) | 49 | 75 | 73 |
| Indoor volume (m3) | 113 | 178 | 191 |
| Height | 2.3 | 2.37 | 2.62 |
| Windows gross area (m2) | 13 | 19 | 15 |
| Heating system | Electric heater (portable) | Electric heater (portable) | Ducted XD Heat pump (whole house unit) |
| Cooling system | Split XD unit in bedroom | Split XD unit in living-room | Ducted XD Heat pump (whole house unit) |
| Ventilation system | Natural ventilation operable windows | Natural ventilation operable windows | Natural ventilation operable windows |
| n50 (h−1) | 9.5 | 14 | 15.5 |
| Smokers | No | No | No |
| Gas stove | Yes | No | No |
| Carpets | No | No | No |
| DHW boiler (indoor) | No | No | Yes |
| Urban location | Urban square, middle town | Secondary streets | Boulevard, outskirt area |
| Floor | 3 | 4 | 4 |
| Facades exposed to the wind | 2 | 2 | 2 |
| Occupied schedule | 00–10 h(miao) and (miao)17–24 h | 00–07 h (miao)and (miao)19–24 h | 00 –24 h |
| CS1 | CS2 | CS3 | ||
|---|---|---|---|---|
| Annual | Average (µg/m3) | 16.09 | 7.10 | 9.66 |
| Median (µg/m3) | 8.76 | 4.40 | 8.60 | |
| Standard deviation | 53.85 | 13.20 | 6.84 | |
| Range (µg/m3) | 0÷1402 | 0÷367 | 0÷283 | |
| Mild season | Average (µg/m3) | 14.83 | 7.30 | 11.17 |
| Median (µg/m3) | 8.40 | 4.50 | 9.80 | |
| Standard deviation | 46.99 | 12.40 | 7.41 | |
| Range (µg/m3) | 0÷1396 | 0÷367 | 0÷283 | |
| Winter | Average (µg/m3) | 13.5 | 6.4 | 9.4 |
| Median (µg/m3) | 7.6 | 4.3 | 9.1 | |
| Standard deviation | 52.7 | 11.2 | 7.3 | |
| Range (µg/m3) | 0÷1402 | 0÷324 | 0÷103 | |
| Summer | Average (µg/m3) | 25.47 | 5.34 | 7.62 |
| Median (µg/m3) | 22.10 | 3.26 | 6.76 | |
| Standard deviation | 22.19 | 9.72 | 5.04 | |
| Range (µg/m3) | 10÷1200 | 0÷298 | 0÷99 |
| Mild Season | Winter | |||||||
|---|---|---|---|---|---|---|---|---|
| Day | Exterior (µg/m3) | CS1 (µg/m3) | CS2 (µg/m3) | CS3 (µg/m3) | Exterior (µg/m3) | CS1 (µg/m3) | CS2 (µg/m3) | CS3 (µg/m3) |
| Monday | 35.4 | 17.6 | 9.6 | 12.6 | 27.2 | 21.1 | 5.6 | 11.5 |
| Tuesday | 53.2 | 17.9 | 3.6 | 14.2 | 40.8 | 6.7 | 4.3 | 10.6 |
| Wednesday | 38.7 | 16.1 | 0.2 | 20.7 | 15.1 | 5.3 | 1.2 | 10.4 |
| Thursday | 45.0 | 11.9 | 0.6 | 15.6 | 25.5 | 6.3 | 1.6 | 10.7 |
| Friday | 29.0 | 17.8 | 4.0 | 8.5 | 26.9 | 9.3 | 3.7 | 13.8 |
| Saturday | 10.9 | 6.0 | 2.1 | 11.8 | 27.2 | 88.3 | 3.1 | 13.5 |
| Sunday | 15.0 | 13.0 | 3.4 | 12.3 | 18.8 | 49.8 | 2.4 | 11.3 |
| Weekly | 32.5 | 14.3 | 3.4 | 13.7 | 25.9 | 26.7 | 3.1 | 11.7 |
| CS1 | CS2 | CS3 | ||
|---|---|---|---|---|
| Annual | Average (ppb) | 528.1 | 277.9 | 394.6 |
| Median (ppb) | 296.0 | 266.0 | 372.0 | |
| Standard deviation | 626.8 | 100.8 | 182.1 | |
| Range (ppb) | 125–13966 | 125–1326 | 125–1448 | |
| Mild season | Average (ppb) | 403.3 | 277.9 | 364.3 |
| Median (ppb) | 234.0 | 225.0 | 351.0 | |
| Standard deviation | 455.1 | 100.8 | 152.3 | |
| Range (ppb) | 125–6651 | 125–1035 | 125–1230 | |
| Winter | Average (ppb) | 564.7 | 326.0 | 420.6 |
| Median (ppb) | 340.0 | 305.9 | 406.0 | |
| Standard deviation | 594.4 | 167.1 | 182.7 | |
| Range (ppb) | 125–13966 | 125–1326 | 125–1448 | |
| Summer | Average (ppb) | 572.0 | 274.0 | 371.0 |
| Median (ppb) | 358.0 | 268.0 | 353.0 | |
| Standard deviation | 570.0 | 94.0 | 163.0 | |
| Range (ppb) | 125÷5725 | 125÷1021 | 125÷1256 |
| CO2IND | PM2.5IND | VOCIND | HRIND | TIND | TOUT | ∆T | |
|---|---|---|---|---|---|---|---|
| CO2IND | 0.04 | 0.48 | 0.2 | 0.18 | −0.46 | 0.5 | |
| PM2.5IND | 0.04 | 0.2 | 0.18 | 0.13 | −0.05 | 0.07 | |
| VOCIND | 0.48 | 0.2 | 0.68 | −0.02 | −0.33 | 0.33 | |
| HRIND | 0.2 | 0.18 | 0.68 | −0.09 | −0.59 | 0.59 | |
| TIND | 0.18 | 0.13 | −0.02 | -0.09 | 0.23 | −0.06 | |
| TOUT | −0.46 | −0.05 | −0.33 | −0.59 | 0.23 | −0.99 | |
| ∆T | 0.5 | 0.07 | 0.33 | 0.59 | −0.06 | −0.99 |
| PM2.5IND | VOCIND | TIND | HRIND | PM2.5OUT | |
|---|---|---|---|---|---|
| PM2.5IND | 0.11 | −0.06 | 0.41 | 0.37 | |
| VOCIND | 0.11 | 0.2 | −0.08 | 0.18 | |
| TIND | −0.06 | 0.2 | −0.38 | 0.11 | |
| HRIND | 0.41 | −0.08 | −0.38 | 0.26 | |
| PM2.5OUT | 0.37 | 0.18 | 0.11 | 0.26 |
© 2019 by the authors. Licensee MDPI, Basel, Switzerland. This article is an open access article distributed under the terms and conditions of the Creative Commons Attribution (CC BY) license (http://creativecommons.org/licenses/by/4.0/).
Share and Cite
Fernández-Agüera, J.; Dominguez-Amarillo, S.; Fornaciari, M.; Orlandi, F. TVOCs and PM 2.5 in Naturally Ventilated Homes: Three Case Studies in a Mild Climate. Sustainability 2019, 11, 6225. https://doi.org/10.3390/su11226225
Fernández-Agüera J, Dominguez-Amarillo S, Fornaciari M, Orlandi F. TVOCs and PM 2.5 in Naturally Ventilated Homes: Three Case Studies in a Mild Climate. Sustainability. 2019; 11(22):6225. https://doi.org/10.3390/su11226225
Chicago/Turabian StyleFernández-Agüera, Jesica, Samuel Dominguez-Amarillo, Marco Fornaciari, and Fabio Orlandi. 2019. "TVOCs and PM 2.5 in Naturally Ventilated Homes: Three Case Studies in a Mild Climate" Sustainability 11, no. 22: 6225. https://doi.org/10.3390/su11226225
APA StyleFernández-Agüera, J., Dominguez-Amarillo, S., Fornaciari, M., & Orlandi, F. (2019). TVOCs and PM 2.5 in Naturally Ventilated Homes: Three Case Studies in a Mild Climate. Sustainability, 11(22), 6225. https://doi.org/10.3390/su11226225