
Modulation of Adipogenesis and Oxidative Status by Quercetin and Ochratoxin A: Positive or Negative Impact on Rat Adipocyte Metabolism?


Abstract
1. Introduction
2. Results
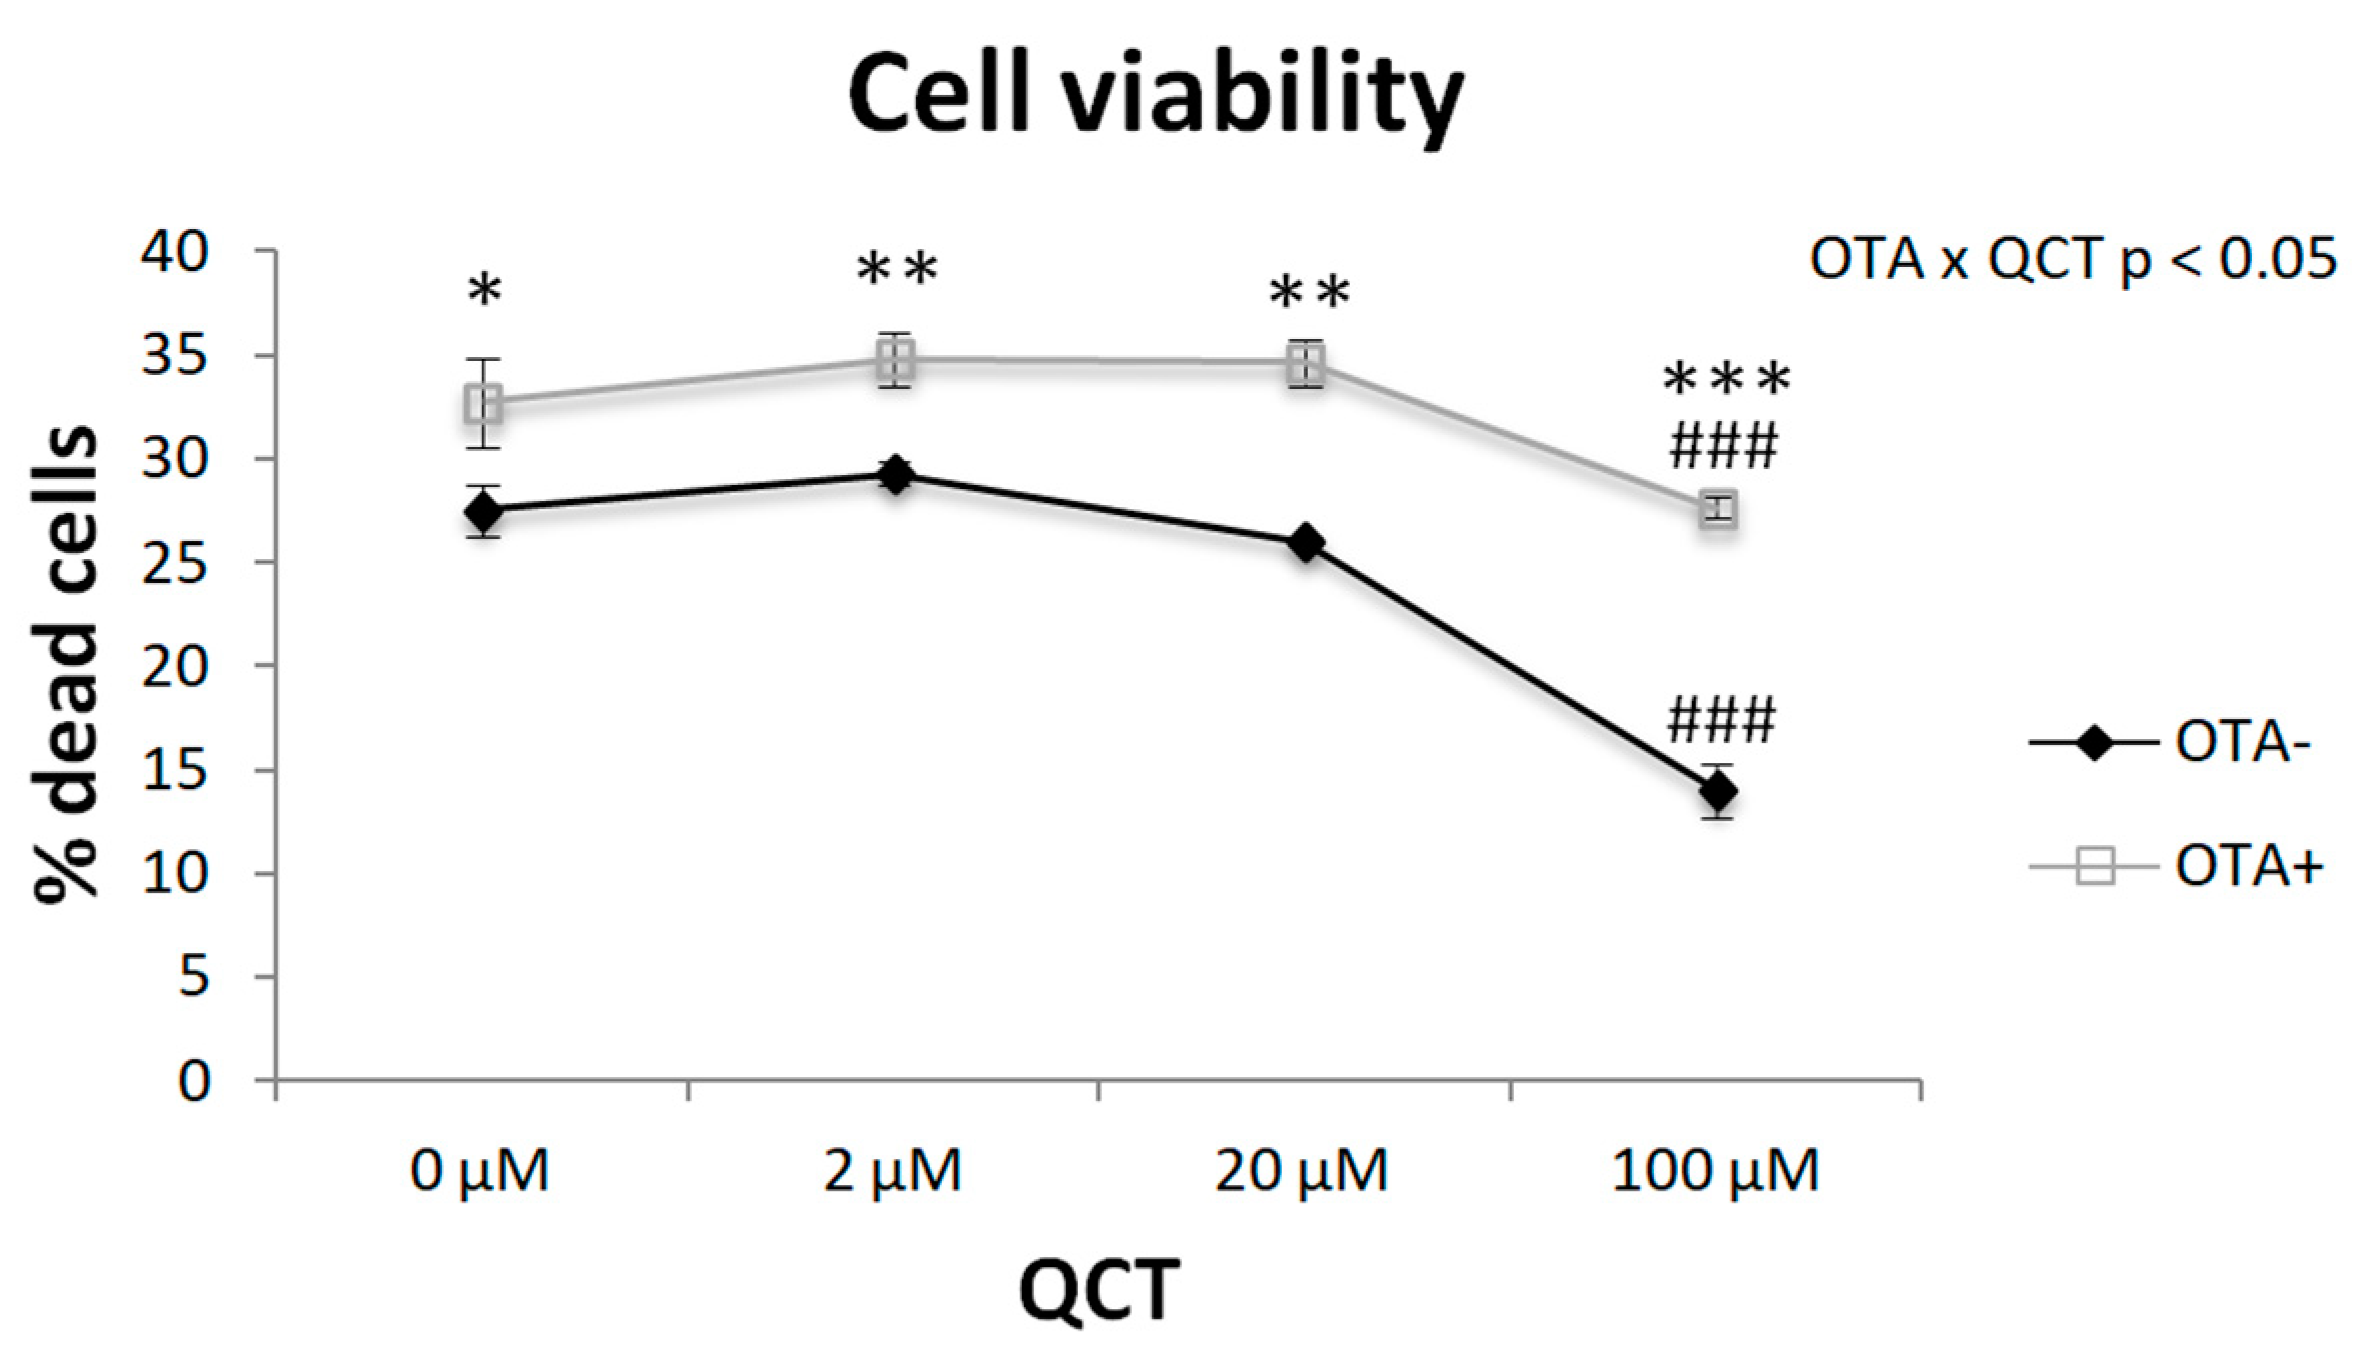
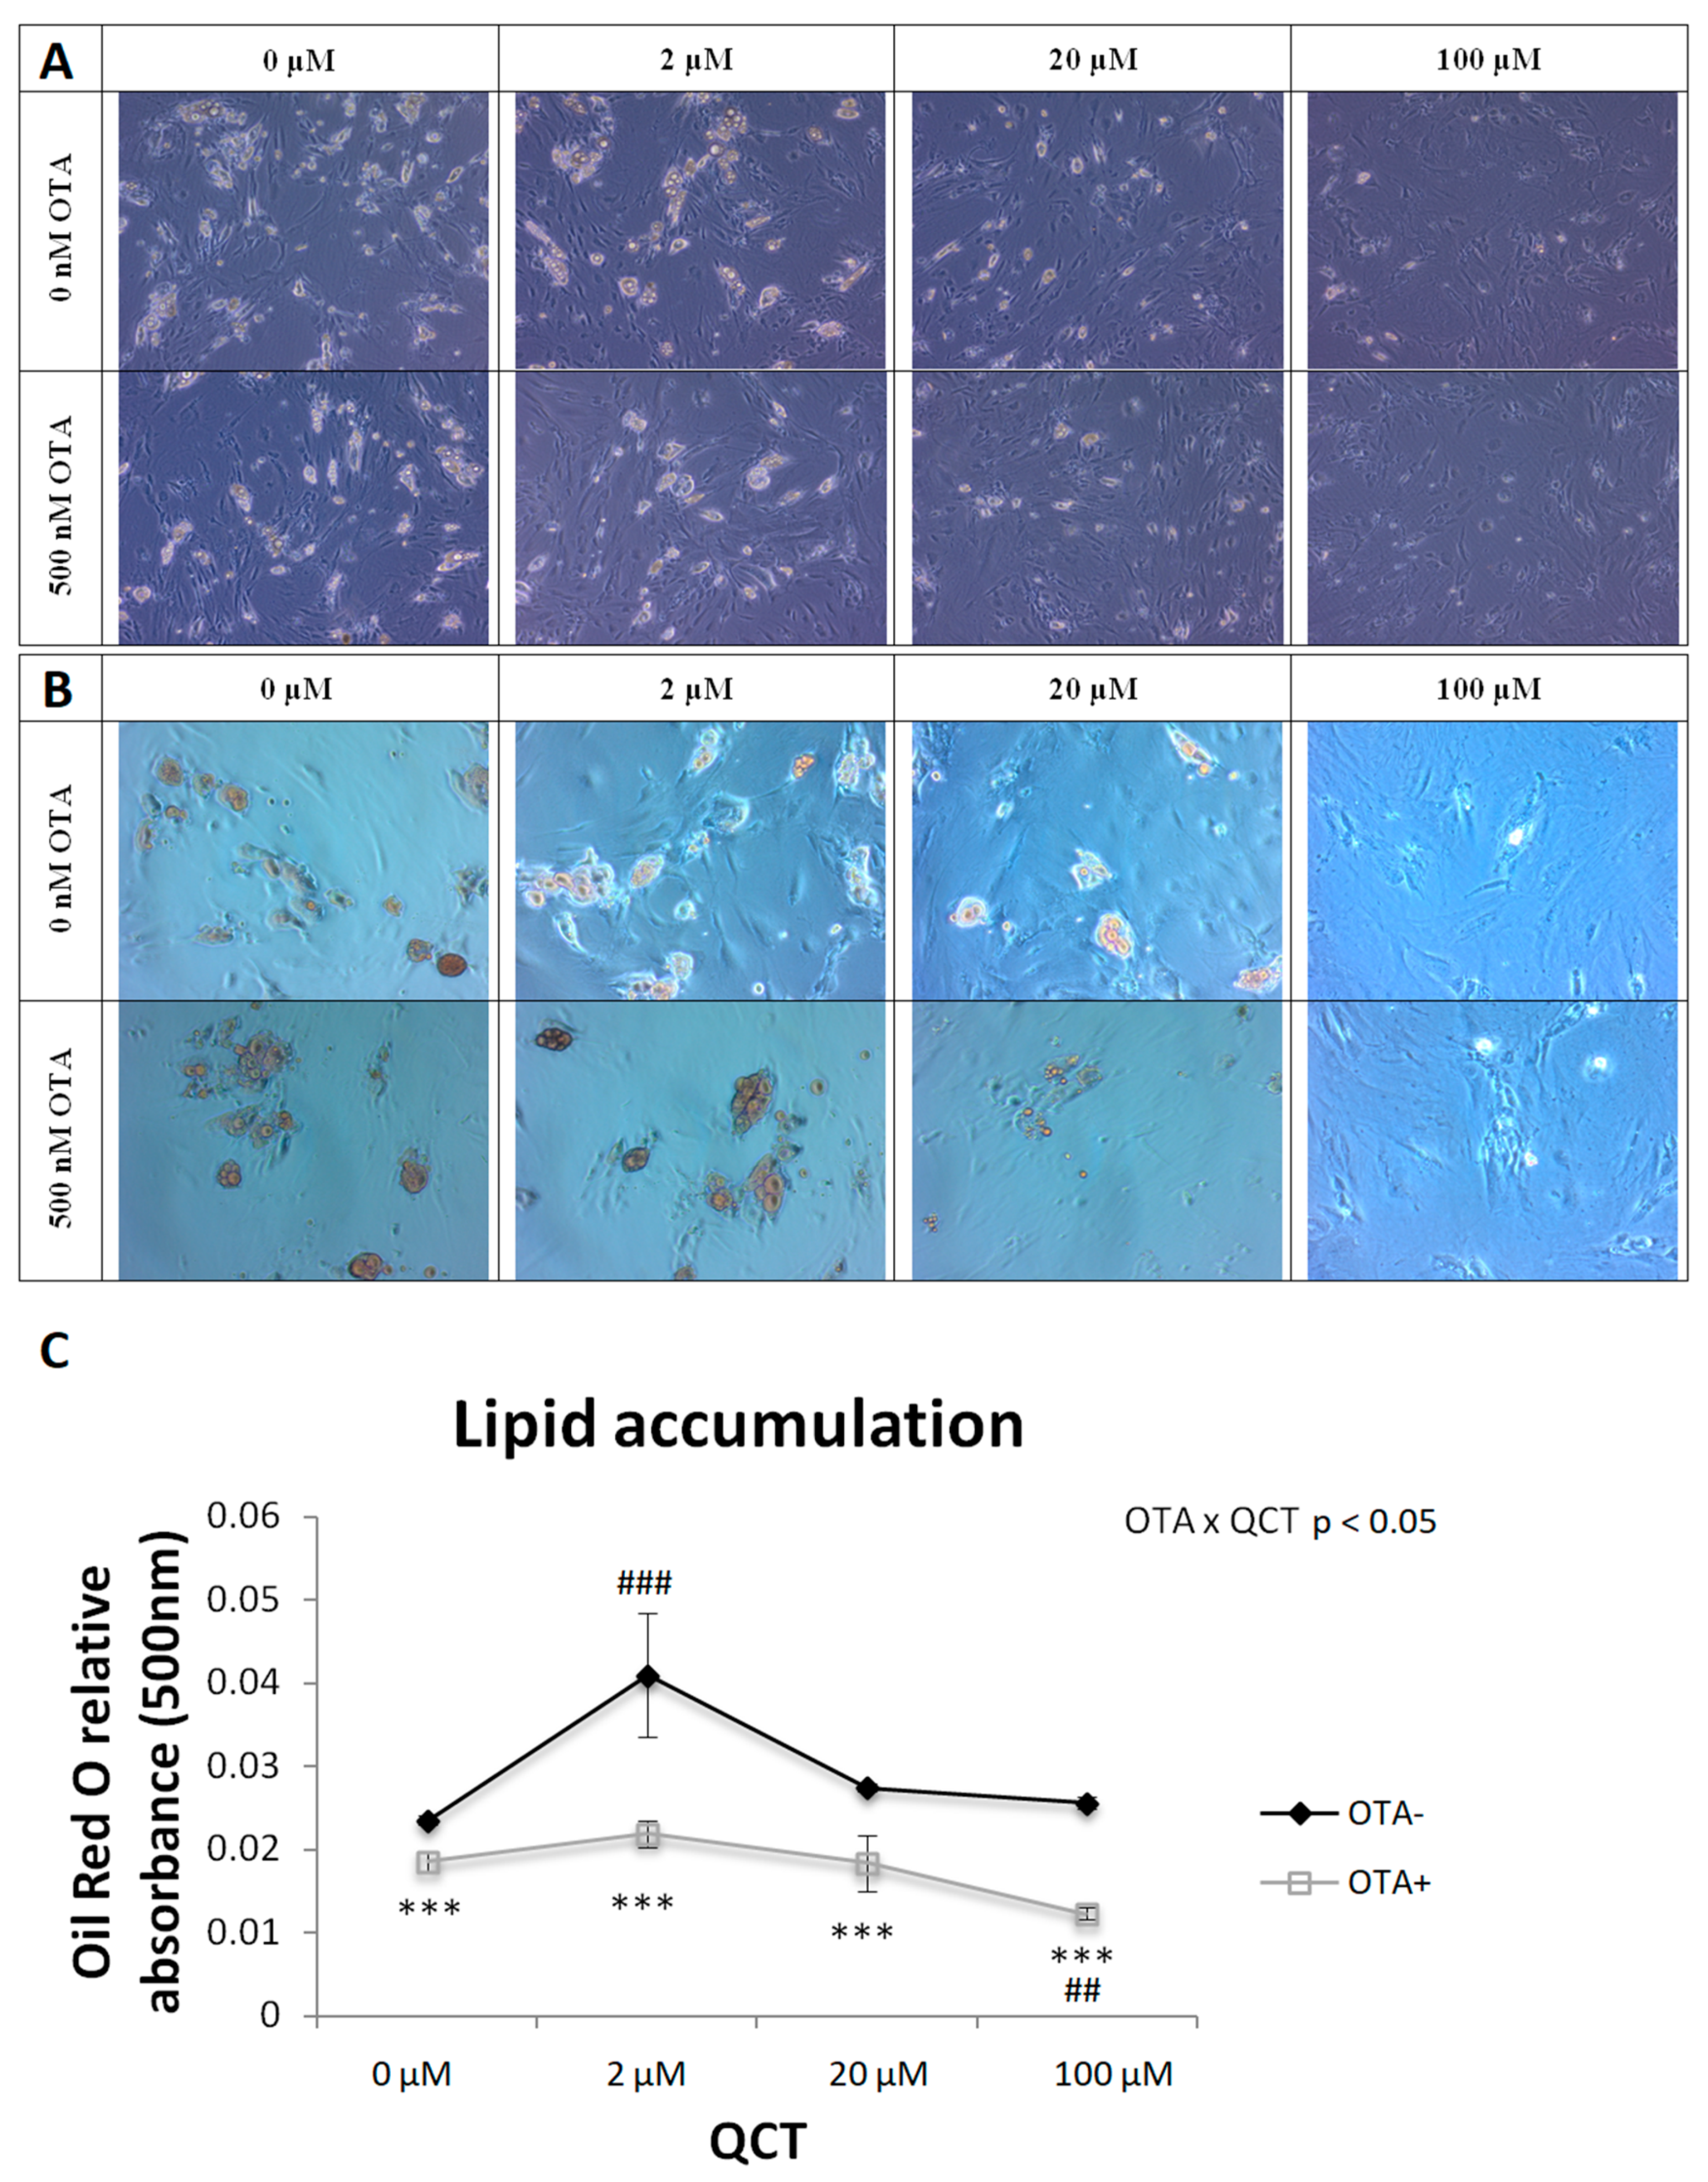
2.1. Adipogenesis
2.2. Adipokines
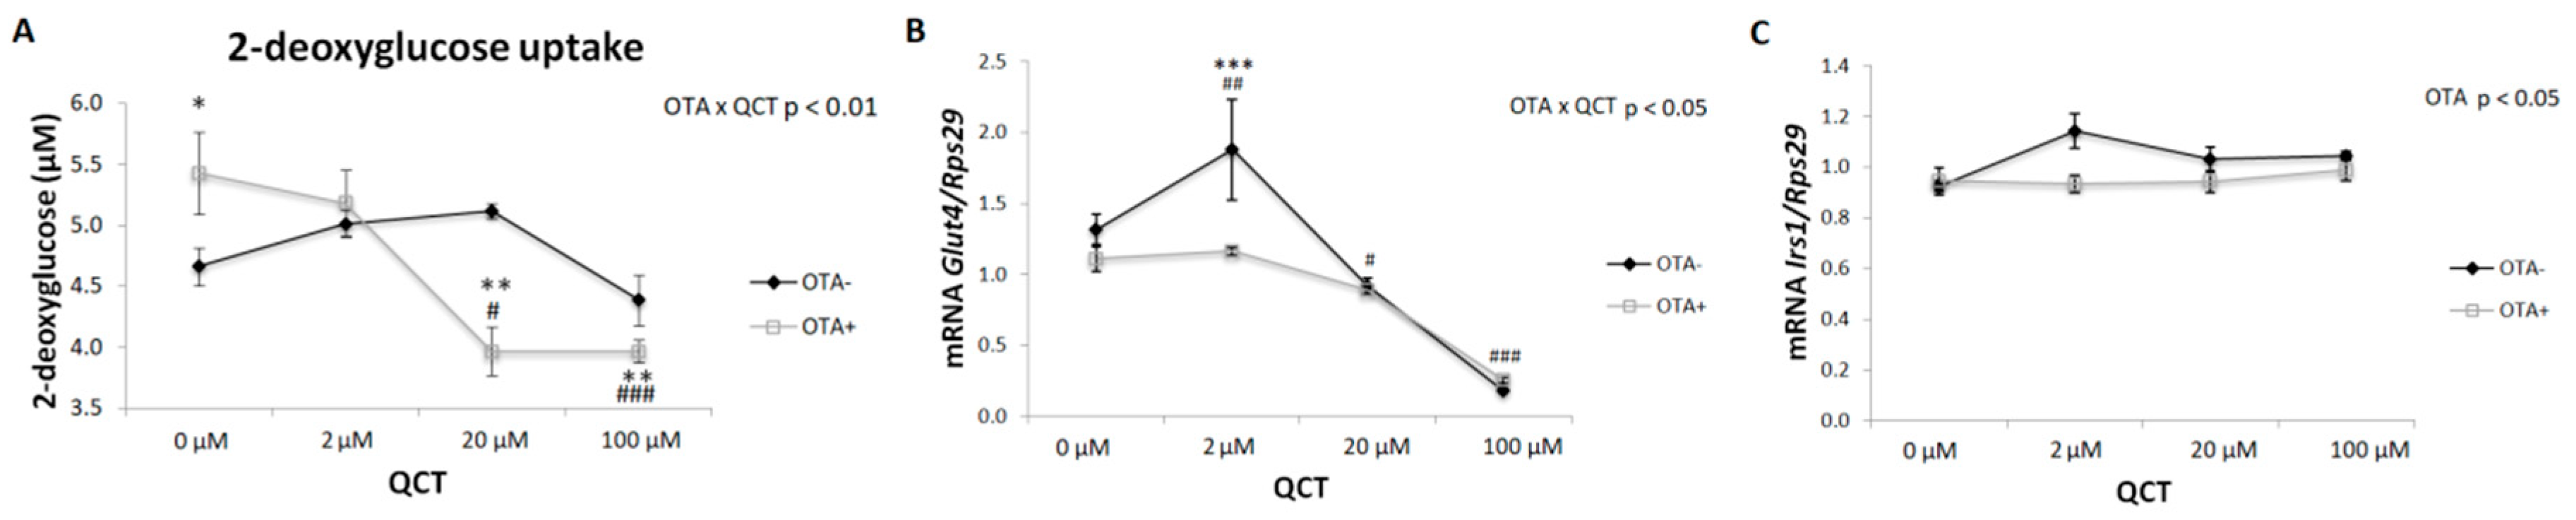
2.3. Glucose Uptake
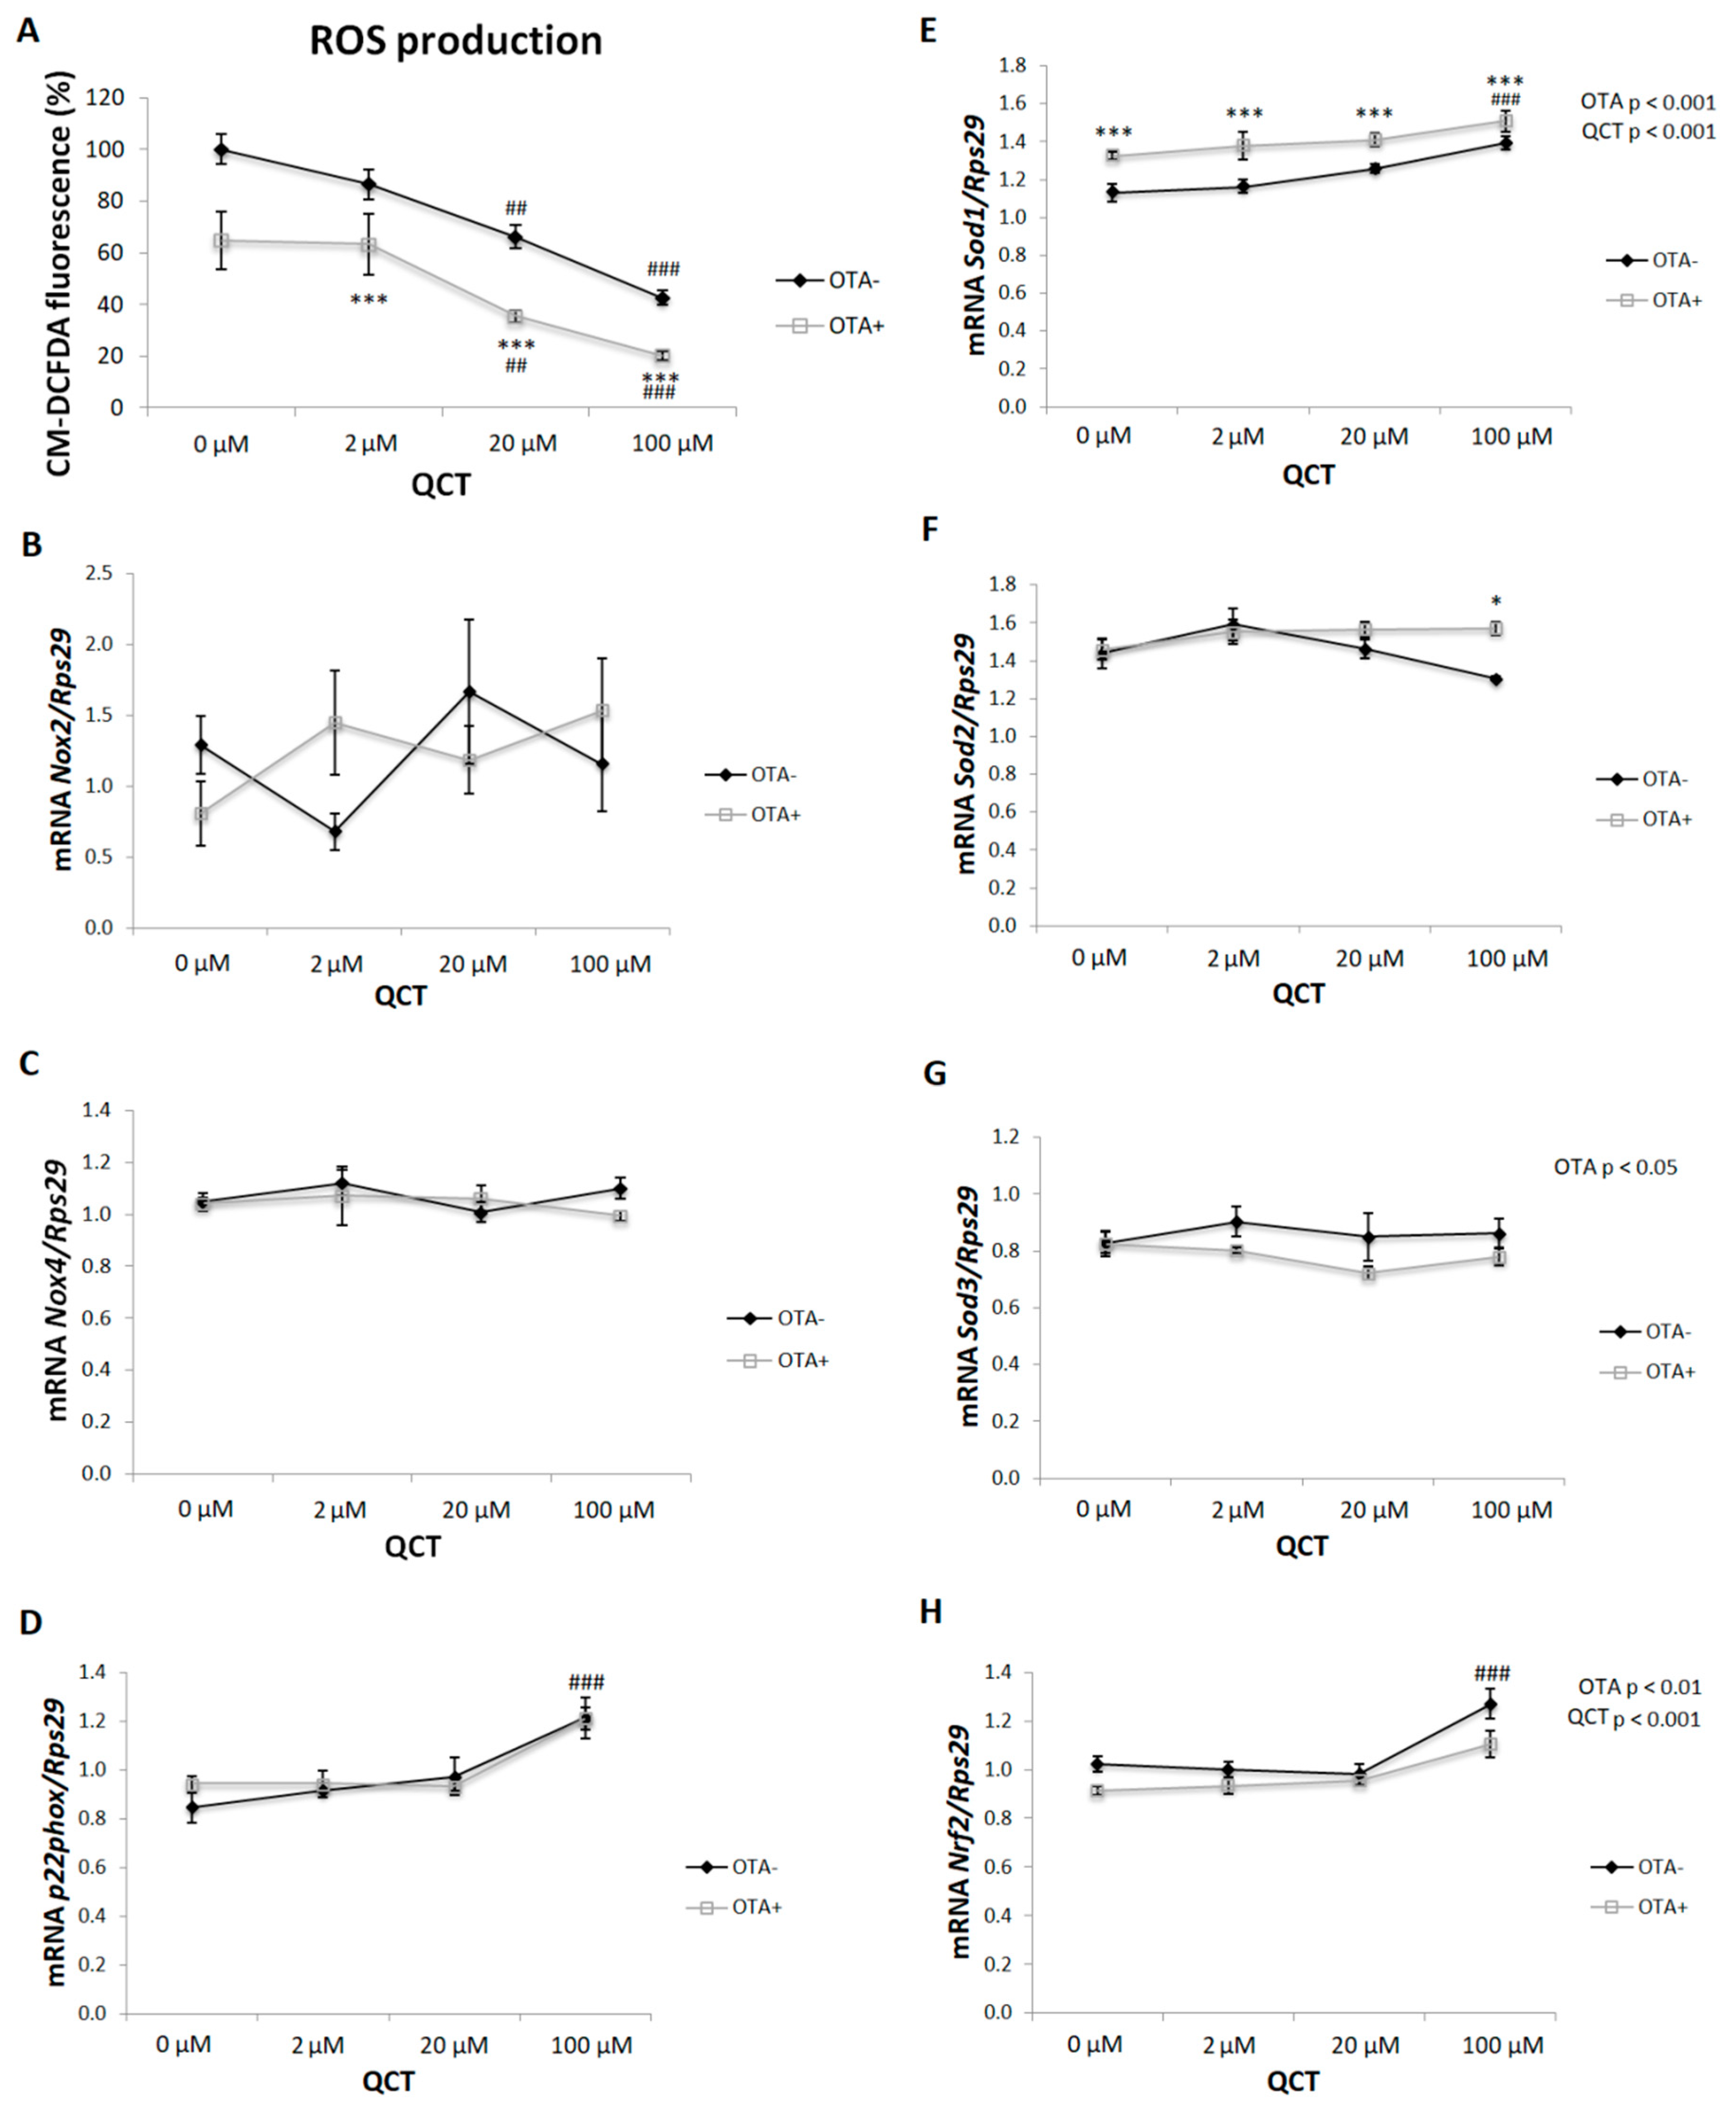
2.4. ROS Production
3. Discussion
4. Conclusions
5. Materials and Methods
5.1. Isolation of Primary Rat Preadipocytes from Subcutaneous Adipose Tissue of Wistar Rats
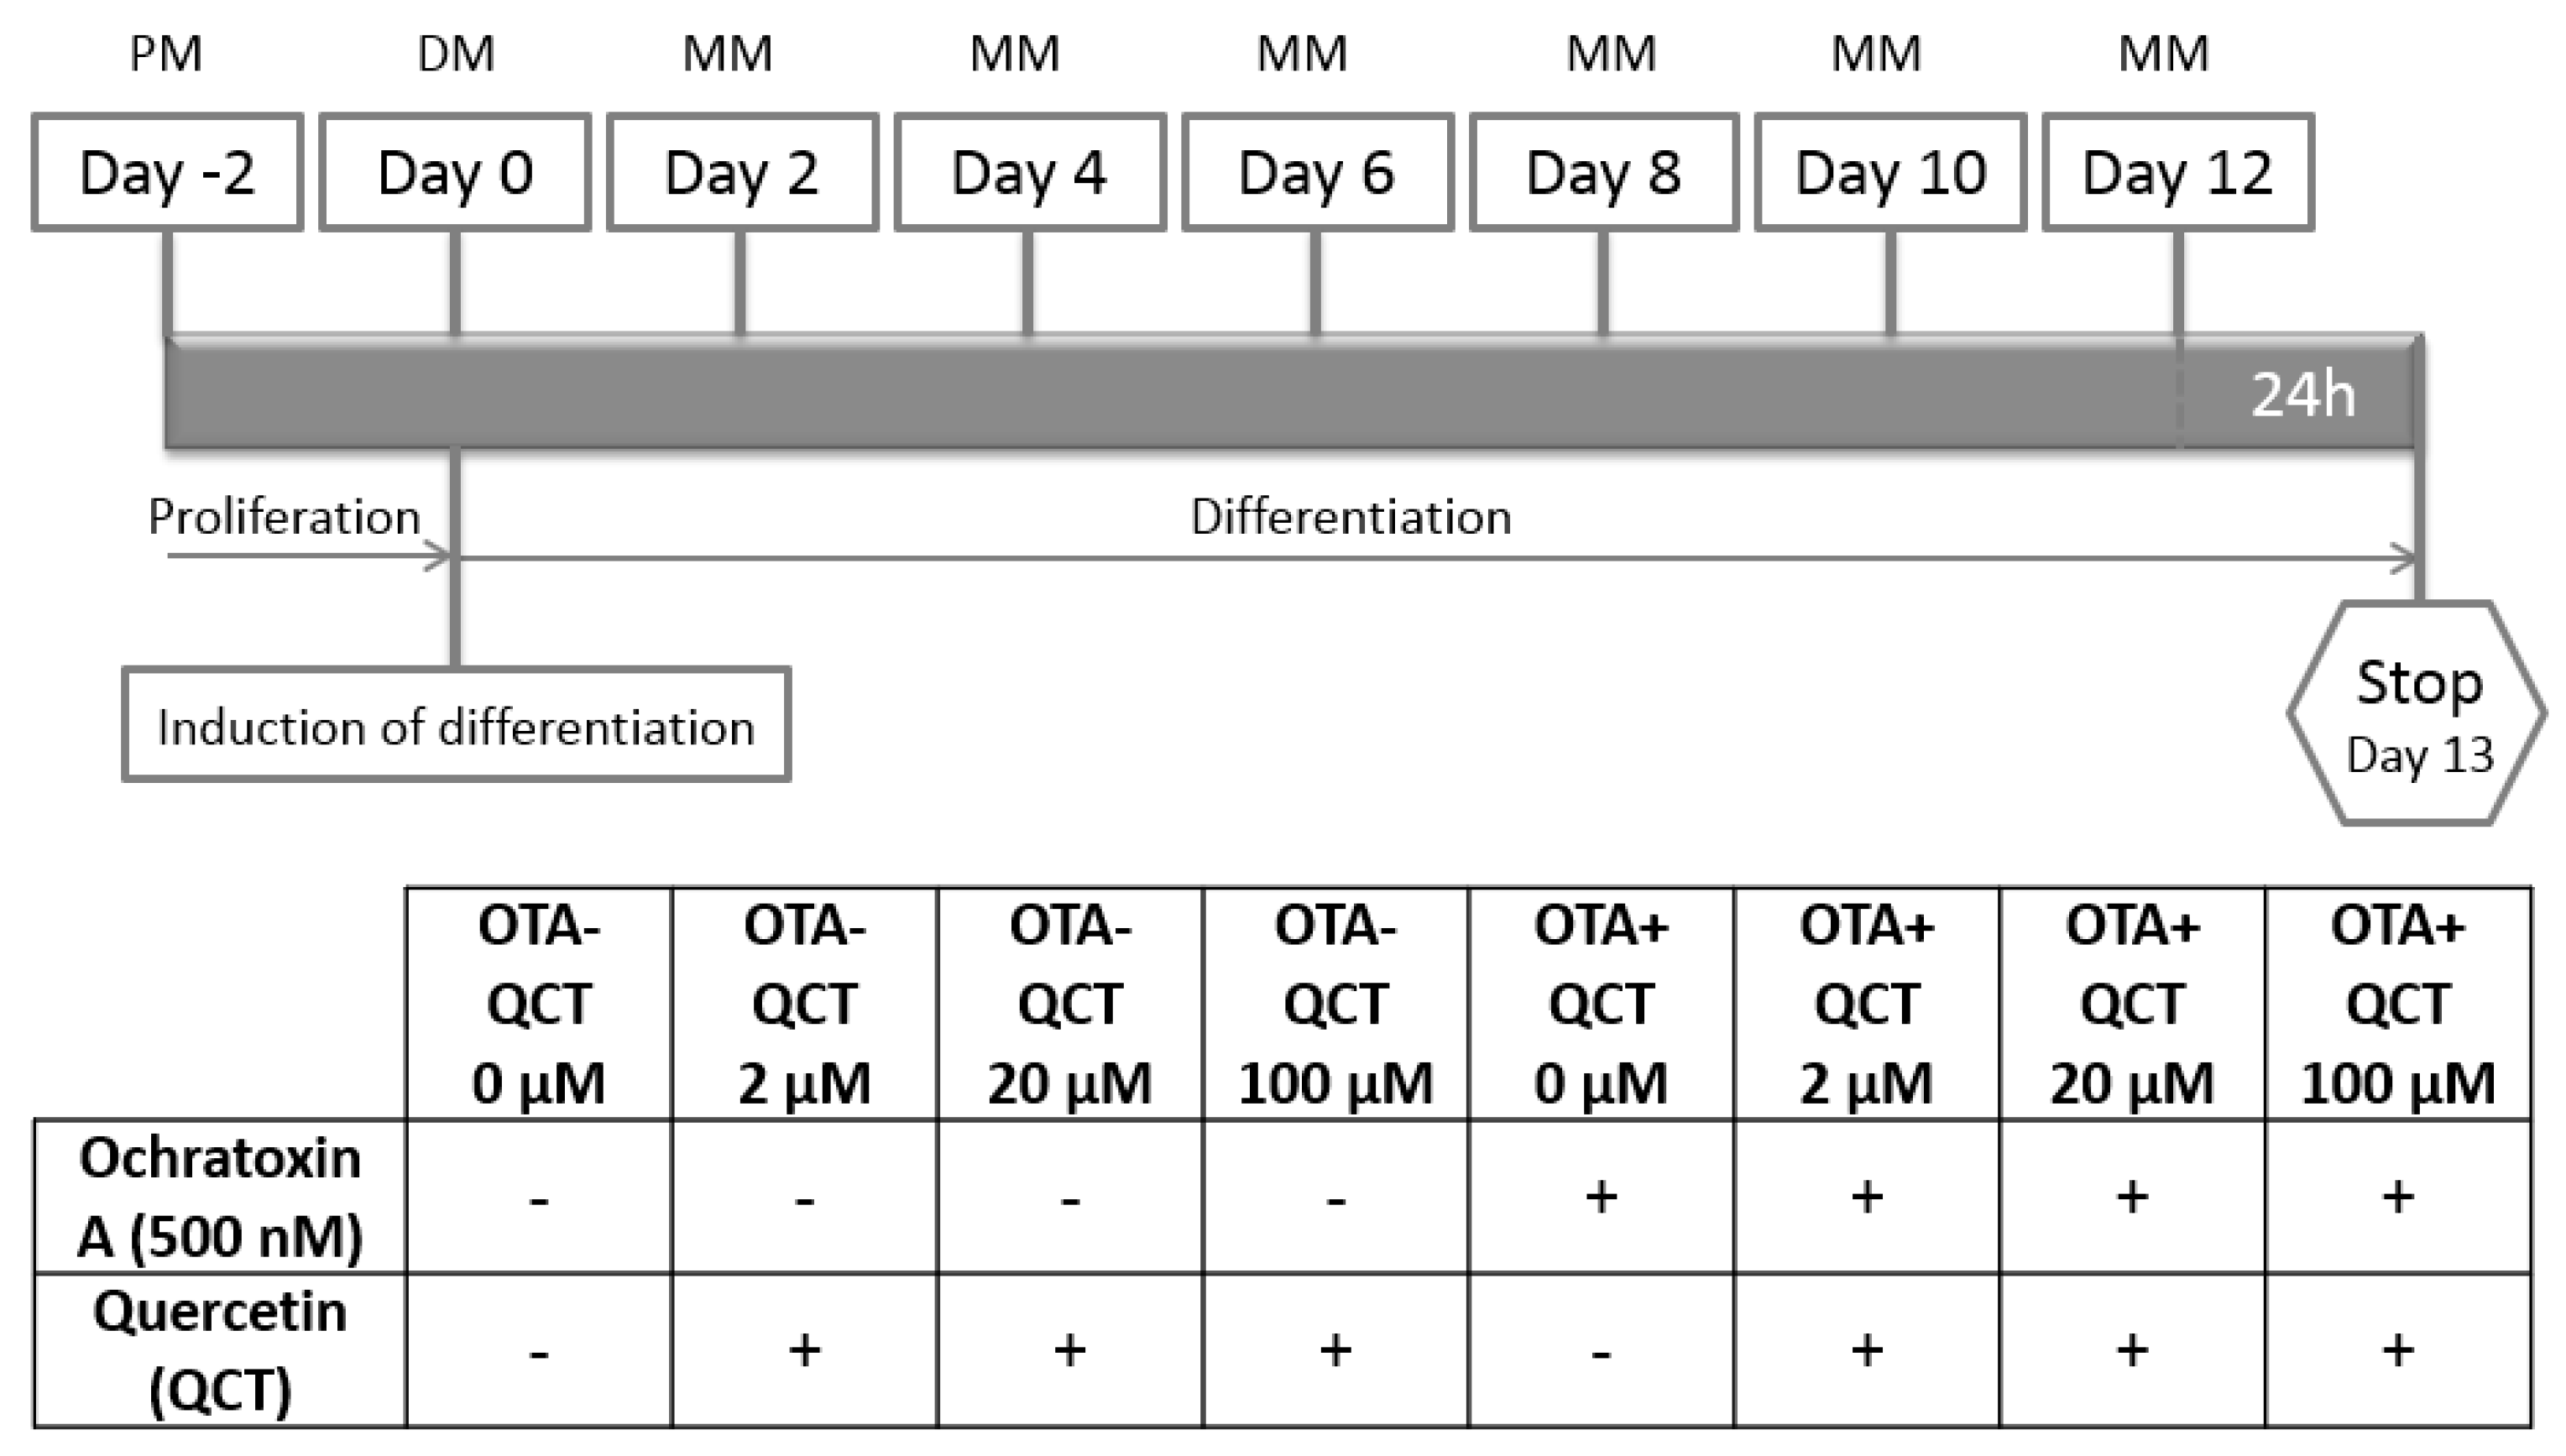
5.2. Adipogenic Differentiation Protocol
5.3. RNA Isolation and Real-Time PCR
5.4. ELISA
5.5. ROS Production
5.6. Cell Viability
5.7. Insulin-Stimulated Glucose Uptake
5.8. Oil Red O Staining
5.9. Statistical Analysis
Author Contributions
Funding
Conflicts of Interest
References
- Yan, M.H.; Wang, X.; Zhu, X. Mitochondrial defects and oxidative stress in Alzheimer disease and Parkinson disease. Free Radic. Biol. Med. 2013, 62, 90–101. [Google Scholar] [CrossRef] [PubMed]
- Droge, W. Free radicals in the physiological control of cell function. Physiol. Rev. 2002, 82, 47–95. [Google Scholar] [CrossRef] [PubMed]
- Czech, M.P.; Fain, J.N. Cu ++ -dependent thiol stimulation of glucose metabolism in white fat cells. J. Biol. Chem. 1972, 247, 6218–6223. [Google Scholar] [PubMed]
- Czech, M.P.; Lawrence, J.C., Jr.; Lynn, W.S. Evidence for electron transfer reactions involved in the Cu2+-dependent thiol activation of fat cell glucose utilization. J. Biol. Chem. 1974, 249, 1001–1006. [Google Scholar] [PubMed]
- Rhee, E.P. NADPH Oxidase 4 at the Nexus of Diabetes, Reactive Oxygen Species, and Renal Metabolism. J. Am. Soc. Nephrol. 2016, 27, 337–339. [Google Scholar] [CrossRef] [PubMed]
- Schroder, K.; Wandzioch, K.; Helmcke, I.; Brandes, R.P. Nox4 acts as a switch between differentiation and proliferation in preadipocytes. Arterioscler. Thromb. Vasc. Biol. 2009, 29, 239–245. [Google Scholar] [CrossRef]
- Jankovic, A.; Korac, A.; Buzadzic, B.; Otasevic, V.; Stancic, A.; Daiber, A.; Korac, B. Redox implications in adipose tissue (dys)function—A new look at old acquaintances. Redox Biol. 2015, 6, 19–32. [Google Scholar] [CrossRef]
- Bischoff, S.C. Quercetin: Potentials in the prevention and therapy of disease. Curr. Opin. Clin. Nutr. Metab. Care 2008, 11, 733–740. [Google Scholar] [CrossRef]
- Vicentini, F.T.; Fonseca, Y.M.; Pitol, D.L.; Iyomasa, M.M.; Bentley, M.V.; Fonseca, M.J. Evaluation of protective effect of a water-in-oil microemulsion incorporating quercetin against UVB-induced damage in hairless mice skin. J. Pharm. Pharm. Sci. 2010, 13, 274–285. [Google Scholar] [CrossRef]
- Wagner, C.; Vargas, A.P.; Roos, D.H.; Morel, A.F.; Farina, M.; Nogueira, C.W.; Aschner, M.; Rocha, J.B. Comparative study of quercetin and its two glycoside derivatives quercitrin and rutin against methylmercury (MeHg)-induced ROS production in rat brain slices. Arch. Toxicol. 2010, 84, 89–97. [Google Scholar] [CrossRef]
- Seo, Y.S.; Kang, O.H.; Kim, S.B.; Mun, S.H.; Kang, D.H.; Yang, D.W.; Choi, J.G.; Lee, Y.M.; Kang, D.K.; Lee, H.S.; et al. Quercetin prevents adipogenesis by regulation of transcriptional factors and lipases in OP9 cells. Int. J. Mol. Med. 2015, 35, 1779–1785. [Google Scholar] [CrossRef] [PubMed]
- Bae, C.R.; Park, Y.K.; Cha, Y.S. Quercetin-rich onion peel extract suppresses adipogenesis by down-regulating adipogenic transcription factors and gene expression in 3T3-L1 adipocytes. J. Sci. Food Agric. 2014, 94, 2655–2660. [Google Scholar] [CrossRef] [PubMed]
- Wang, Y.; Wang, L.; Liu, F.; Wang, Q.; Selvaraj, J.N.; Xing, F.; Zhao, Y.; Liu, Y. Ochratoxin A Producing Fungi, Biosynthetic Pathway and Regulatory Mechanisms. Toxins 2016, 8, 83. [Google Scholar] [CrossRef] [PubMed]
- Clark, H.A.; Snedeker, S.M. Ochratoxin a: Its cancer risk and potential for exposure. J. Toxicol. Environ. Health B Crit. Rev. 2006, 9, 265–296. [Google Scholar] [CrossRef]
- Lim, S.; Jang, H.J.; Kim, J.K.; Kim, J.M.; Park, E.H.; Yang, J.H.; Kim, Y.H.; Yea, K.; Ryu, S.H.; Suh, P.G. Ochratoxin A inhibits adipogenesis through the extracellular signal-related kinases-peroxisome proliferator-activated receptor-gamma pathway in human adipose tissue-derived mesenchymal stem cells. Stem Cells Dev. 2011, 20, 415–426. [Google Scholar] [CrossRef]
- Sorrenti, V.; Di Giacomo, C.; Acquaviva, R.; Barbagallo, I.; Bognanno, M.; Galvano, F. Toxicity of ochratoxin a and its modulation by antioxidants: A review. Toxins 2013, 5, 1742–1766. [Google Scholar] [CrossRef]
- Periasamy, R.; Kalal, I.G.; Krishnaswamy, R.; Viswanadha, V. Quercetin protects human peripheral blood mononuclear cells from OTA-induced oxidative stress, genotoxicity, and inflammation. Environ. Toxicol. 2016, 31, 855–865. [Google Scholar] [CrossRef]
- Costa, J.G.; Saraiva, N.; Guerreiro, P.S.; Louro, H.; Silva, M.J.; Miranda, J.P.; Castro, M.; Batinic-Haberle, I.; Fernandes, A.S.; Oliveira, N.G. Ochratoxin A-induced cytotoxicity, genotoxicity and reactive oxygen species in kidney cells: An integrative approach of complementary endpoints. Food Chem. Toxicol. 2016, 87, 65–76. [Google Scholar] [CrossRef]
- Casado-Diaz, A.; Anter, J.; Dorado, G.; Quesada-Gomez, J.M. Effects of quercetin, a natural phenolic compound, in the differentiation of human mesenchymal stem cells (MSC) into adipocytes and osteoblasts. J. Nutr. Biochem. 2016, 32, 151–162. [Google Scholar] [CrossRef]
- Park, H.J.; Yang, J.Y.; Ambati, S.; Della-Fera, M.A.; Hausman, D.B.; Rayalam, S.; Baile, C.A. Combined effects of genistein, quercetin, and resveratrol in human and 3T3-L1 adipocytes. J. Med. Food 2008, 11, 773–783. [Google Scholar] [CrossRef]
- Yang, J.Y.; Della-Fera, M.A.; Rayalam, S.; Ambati, S.; Hartzell, D.L.; Park, H.J.; Baile, C.A. Enhanced inhibition of adipogenesis and induction of apoptosis in 3T3-L1 adipocytes with combinations of resveratrol and quercetin. Life Sci. 2008, 82, 1032–1039. [Google Scholar] [CrossRef] [PubMed]
- Eseberri, I.; Miranda, J.; Lasa, A.; Churruca, I.; Portillo, M.P. Doses of Quercetin in the Range of Serum Concentrations Exert Delipidating Effects in 3T3-L1 Preadipocytes by Acting on Different Stages of Adipogenesis, but Not in Mature Adipocytes. Oxid. Med. Cell Longev. 2015, 2015, 480943. [Google Scholar] [CrossRef] [PubMed]
- Giralt, M.; Cereijo, R.; Villarroya, F. Adipokines and the Endocrine Role of Adipose Tissues. Handb. Exp. Pharmacol. 2016, 233, 265–282. [Google Scholar] [CrossRef]
- Tontonoz, P.; Hu, E.; Spiegelman, B.M. Regulation of adipocyte gene expression and differentiation by peroxisome proliferator activated receptor gamma. Curr. Opin. Genet. Dev. 1995, 5, 571–576. [Google Scholar] [CrossRef]
- Kobayashi, H.; Matsuda, M.; Fukuhara, A.; Komuro, R.; Shimomura, I. Dysregulated glutathione metabolism links to impaired insulin action in adipocytes. Am. J. Physiol. Endocrinol. Metab. 2009, 296, E1326–E1334. [Google Scholar] [CrossRef] [PubMed]
- Tao, Y.; Xie, S.; Xu, F.; Liu, A.; Wang, Y.; Chen, D.; Pan, Y.; Huang, L.; Peng, D.; Wang, X.; et al. Ochratoxin A: Toxicity, oxidative stress and metabolism. Food Chem. Toxicol. 2018, 112, 320–331. [Google Scholar] [CrossRef] [PubMed]
- Cui, J.; Liu, J.; Wu, S.; Wang, Y.; Shen, H.; Xing, L.; Wang, J.; Yan, X.; Zhang, X. Oxidative DNA damage is involved in ochratoxin A-induced G2 arrest through ataxia telangiectasia-mutated (ATM) pathways in human gastric epithelium GES-1 cells in vitro. Arch. Toxicol. 2013, 87, 1829–1840. [Google Scholar] [CrossRef]
- Hermenean, A.; Munteanu, M.C.; Postolache, L.; Dinu, D.; Zarnescu, O.; Costache, M.; Dinischiotu, A. Ochratoxin A induced oxidative stress promotes apoptosis in HepG2 cells. Toxicol. Lett. 2009, 189, S77. [Google Scholar] [CrossRef]
- Li, J.M.; Shah, A.M. ROS generation by nonphagocytic NADPH oxidase: Potential relevance in diabetic nephropathy. J. Am. Soc. Nephrol. 2003, 14, S221–S226. [Google Scholar] [CrossRef]
- Hu, T.; Ramachandrarao, S.P.; Siva, S.; Valancius, C.; Zhu, Y.; Mahadev, K.; Toh, I.; Goldstein, B.J.; Woolkalis, M.; Sharma, K. Reactive oxygen species production via NADPH oxidase mediates TGF-beta-induced cytoskeletal alterations in endothelial cells. Am. J. Physiol. Renal Physiol. 2005, 289, F816–F825. [Google Scholar] [CrossRef]
- Martyn, K.D.; Frederick, L.M.; von Loehneysen, K.; Dinauer, M.C.; Knaus, U.G. Functional analysis of Nox4 reveals unique characteristics compared to other NADPH oxidases. Cell. Signal. 2006, 18, 69–82. [Google Scholar] [CrossRef] [PubMed]
Sample Availability: Samples of the compounds are available from the authors. |


| Gene | Primer Sequences | |
|---|---|---|
| Adiponectin | Fw | 5′-ACC CTT GGC AGG AAA GGA-3′ |
| Rv | 5′-CCT ACG CTG AAT GCT GAG TGA T-3′ | |
| aP2 (FABP4) | Fw | 5′-AGC GTA GAA GGG GAC TTG GT-3′ |
| Rv | 5′-ATG GTG GTC GAC TTT CCA TC-3′ | |
| Fas | Fw | 5′-GAG TCT GTC TCC CGC TTG AC-3′ |
| Rv | 5′-TGG AAA TGA GGG CCA TAG TC-3′ | |
| Glut4 | Fw | 5′-TTT CCA GTA TGT TGC GGA TG-3′ |
| Rv | 5’-TCA GTC ATT CTC ATC TGG CC-3’ | |
| Irs-1 | Fw | 5′-CCA AGG GCT TAG GTC AGA CAA A-3′ |
| Rv | 5′-GCC TCA GAG TTG AGC TTC ACA A-3′ | |
| Leptin | Fw | 5′-TCC AGG ATG ACA CCA AAA CC-3′ |
| Rv | 5′-GAA GGC AAG CTG GTG AGG AT-3′ | |
| Nox2 | Fw | 5′-TGA TCA TCA CAT CCT CCA CCA A-3′ |
| Rv | 5′-GAT GGC AAG GCC GAT GAA-3′ | |
| Nox4 | Fw | 5′-CTG CAT CTG TCC TGA ACC TCA A-3′ |
| Rv | 5′-TCT CCT GCT AGG GAC CTT CTG T-3′ | |
| Nrf2 | Fw | 5′-GTT GAG AGC TCA GTC TTC AC-3′ |
| Rv | 5′-CAG AGA GCT ATC GAG TGA CT-3′ | |
| p22 | Fw | 5′-TGG CCT GAT CCT CAT CAC AG-3′ |
| Rv | 5′-AGG CAC GGA CAG CAG TAA GT-3′ | |
| Pparγ | Fw | 5′-AGG ATT CAT GAC CAG GGA GTT-3′ |
| Rv | 5′-AGC AAA CTC AAA CTT AGG CTC CAT-3′ | |
| Rps29 | Fw | 5′-GCT GAA CAT GTG CCG ACA CT-3′ |
| Rv | 5′-GGT CGC TTA GTC CAA CTT AAT GAA-3′ | |
| Sod1 | Fw | 5′-CAC TCT AAG AAA CAT GGC G-3′ |
| Rv | 5′-CTG AGA GTG AGA TCA CAC G-3′ | |
| Sod2 | Fw | 5′-TTC AGC CTG CAC TGA AG-3′ |
| Rv | 5′-GTC ACG CTT GAT AGC CTC-3′ | |
| Sod3 | Fw | 5′-CTT GAC CTG GTT GAG AAG ATA G-3′ |
| Rv | 5′-GAT CTG TGG CTG ATC GG-3′ |
© 2019 by the authors. Licensee MDPI, Basel, Switzerland. This article is an open access article distributed under the terms and conditions of the Creative Commons Attribution (CC BY) license (http://creativecommons.org/licenses/by/4.0/).
Share and Cite
Dobrocsyova, V.; Krskova, K.; Capcarova, M.; Zorad, S. Modulation of Adipogenesis and Oxidative Status by Quercetin and Ochratoxin A: Positive or Negative Impact on Rat Adipocyte Metabolism? Molecules 2019, 24, 3726. https://doi.org/10.3390/molecules24203726
Dobrocsyova V, Krskova K, Capcarova M, Zorad S. Modulation of Adipogenesis and Oxidative Status by Quercetin and Ochratoxin A: Positive or Negative Impact on Rat Adipocyte Metabolism? Molecules. 2019; 24(20):3726. https://doi.org/10.3390/molecules24203726
Chicago/Turabian StyleDobrocsyova, Viktoria, Katarina Krskova, Marcela Capcarova, and Stefan Zorad. 2019. "Modulation of Adipogenesis and Oxidative Status by Quercetin and Ochratoxin A: Positive or Negative Impact on Rat Adipocyte Metabolism?" Molecules 24, no. 20: 3726. https://doi.org/10.3390/molecules24203726
APA StyleDobrocsyova, V., Krskova, K., Capcarova, M., & Zorad, S. (2019). Modulation of Adipogenesis and Oxidative Status by Quercetin and Ochratoxin A: Positive or Negative Impact on Rat Adipocyte Metabolism? Molecules, 24(20), 3726. https://doi.org/10.3390/molecules24203726