
Sequential Response of Sage Antioxidant Metabolism to Chilling Treatment

 ,
,  , ,
, ,
Abstract
1. Introduction
2. Results and Discussion
3. Materials and Methods
3.1. Plant Material and Treatment Conditions
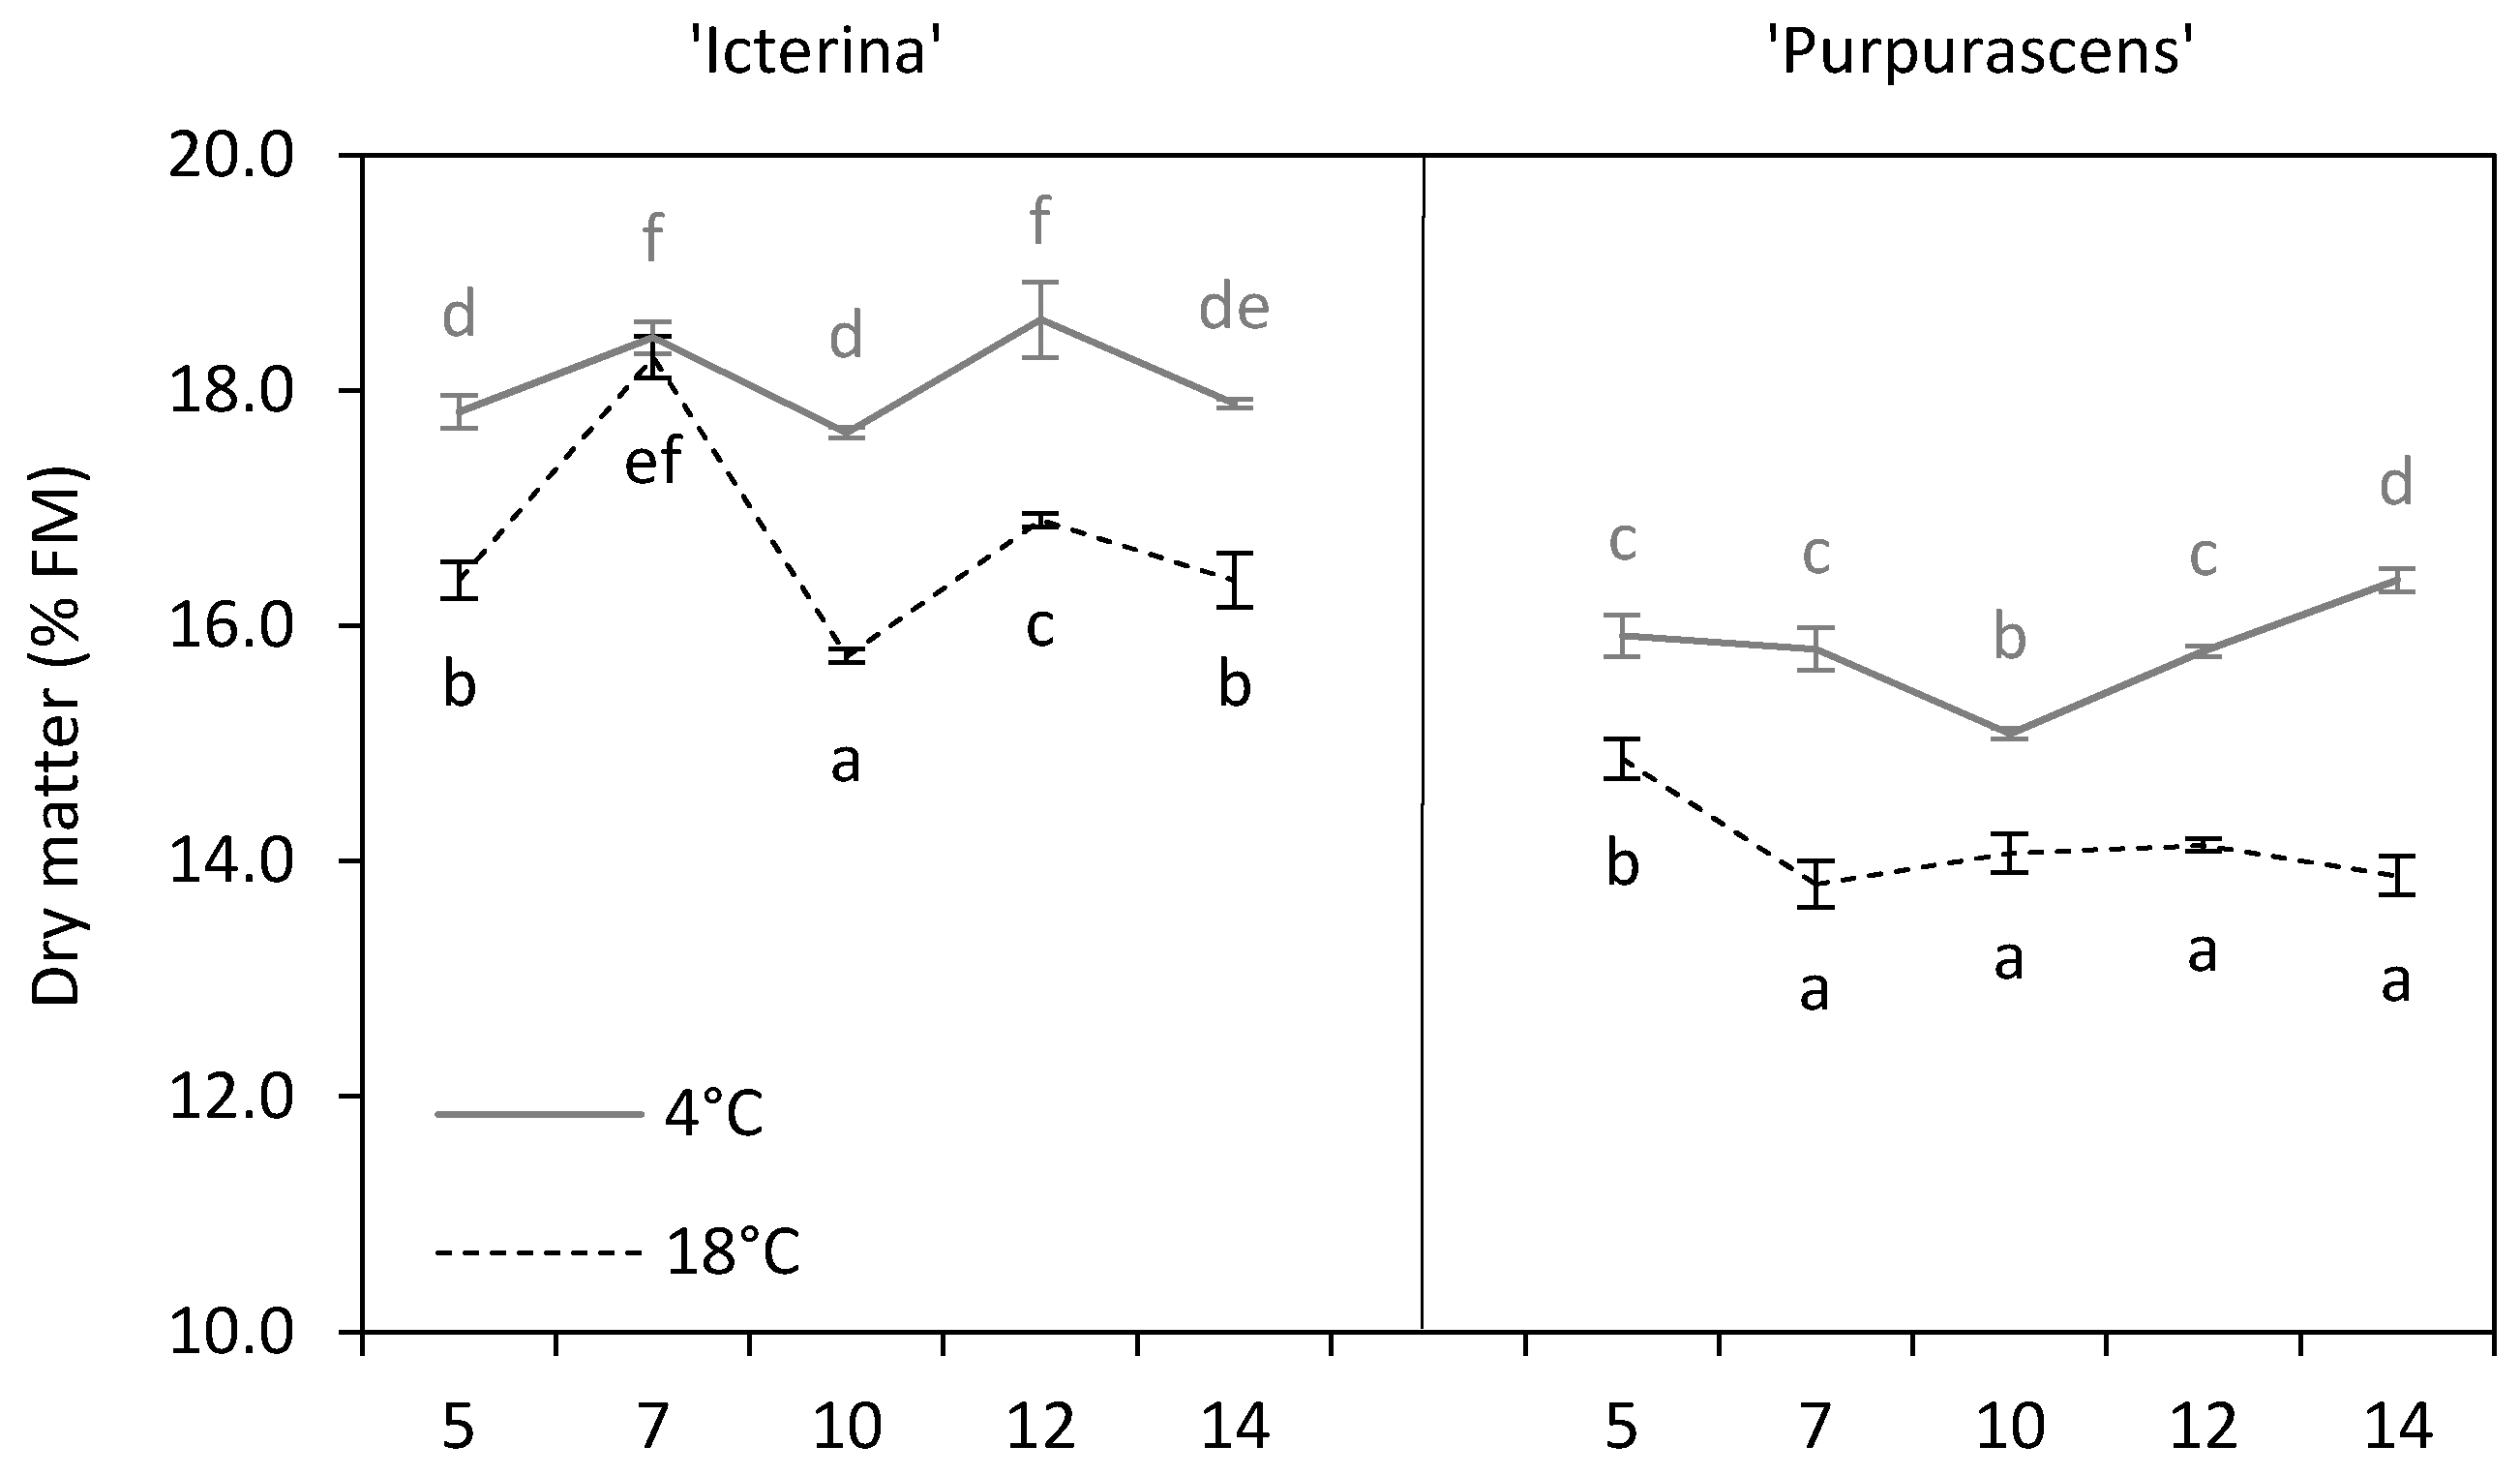
3.2. Dry Matter
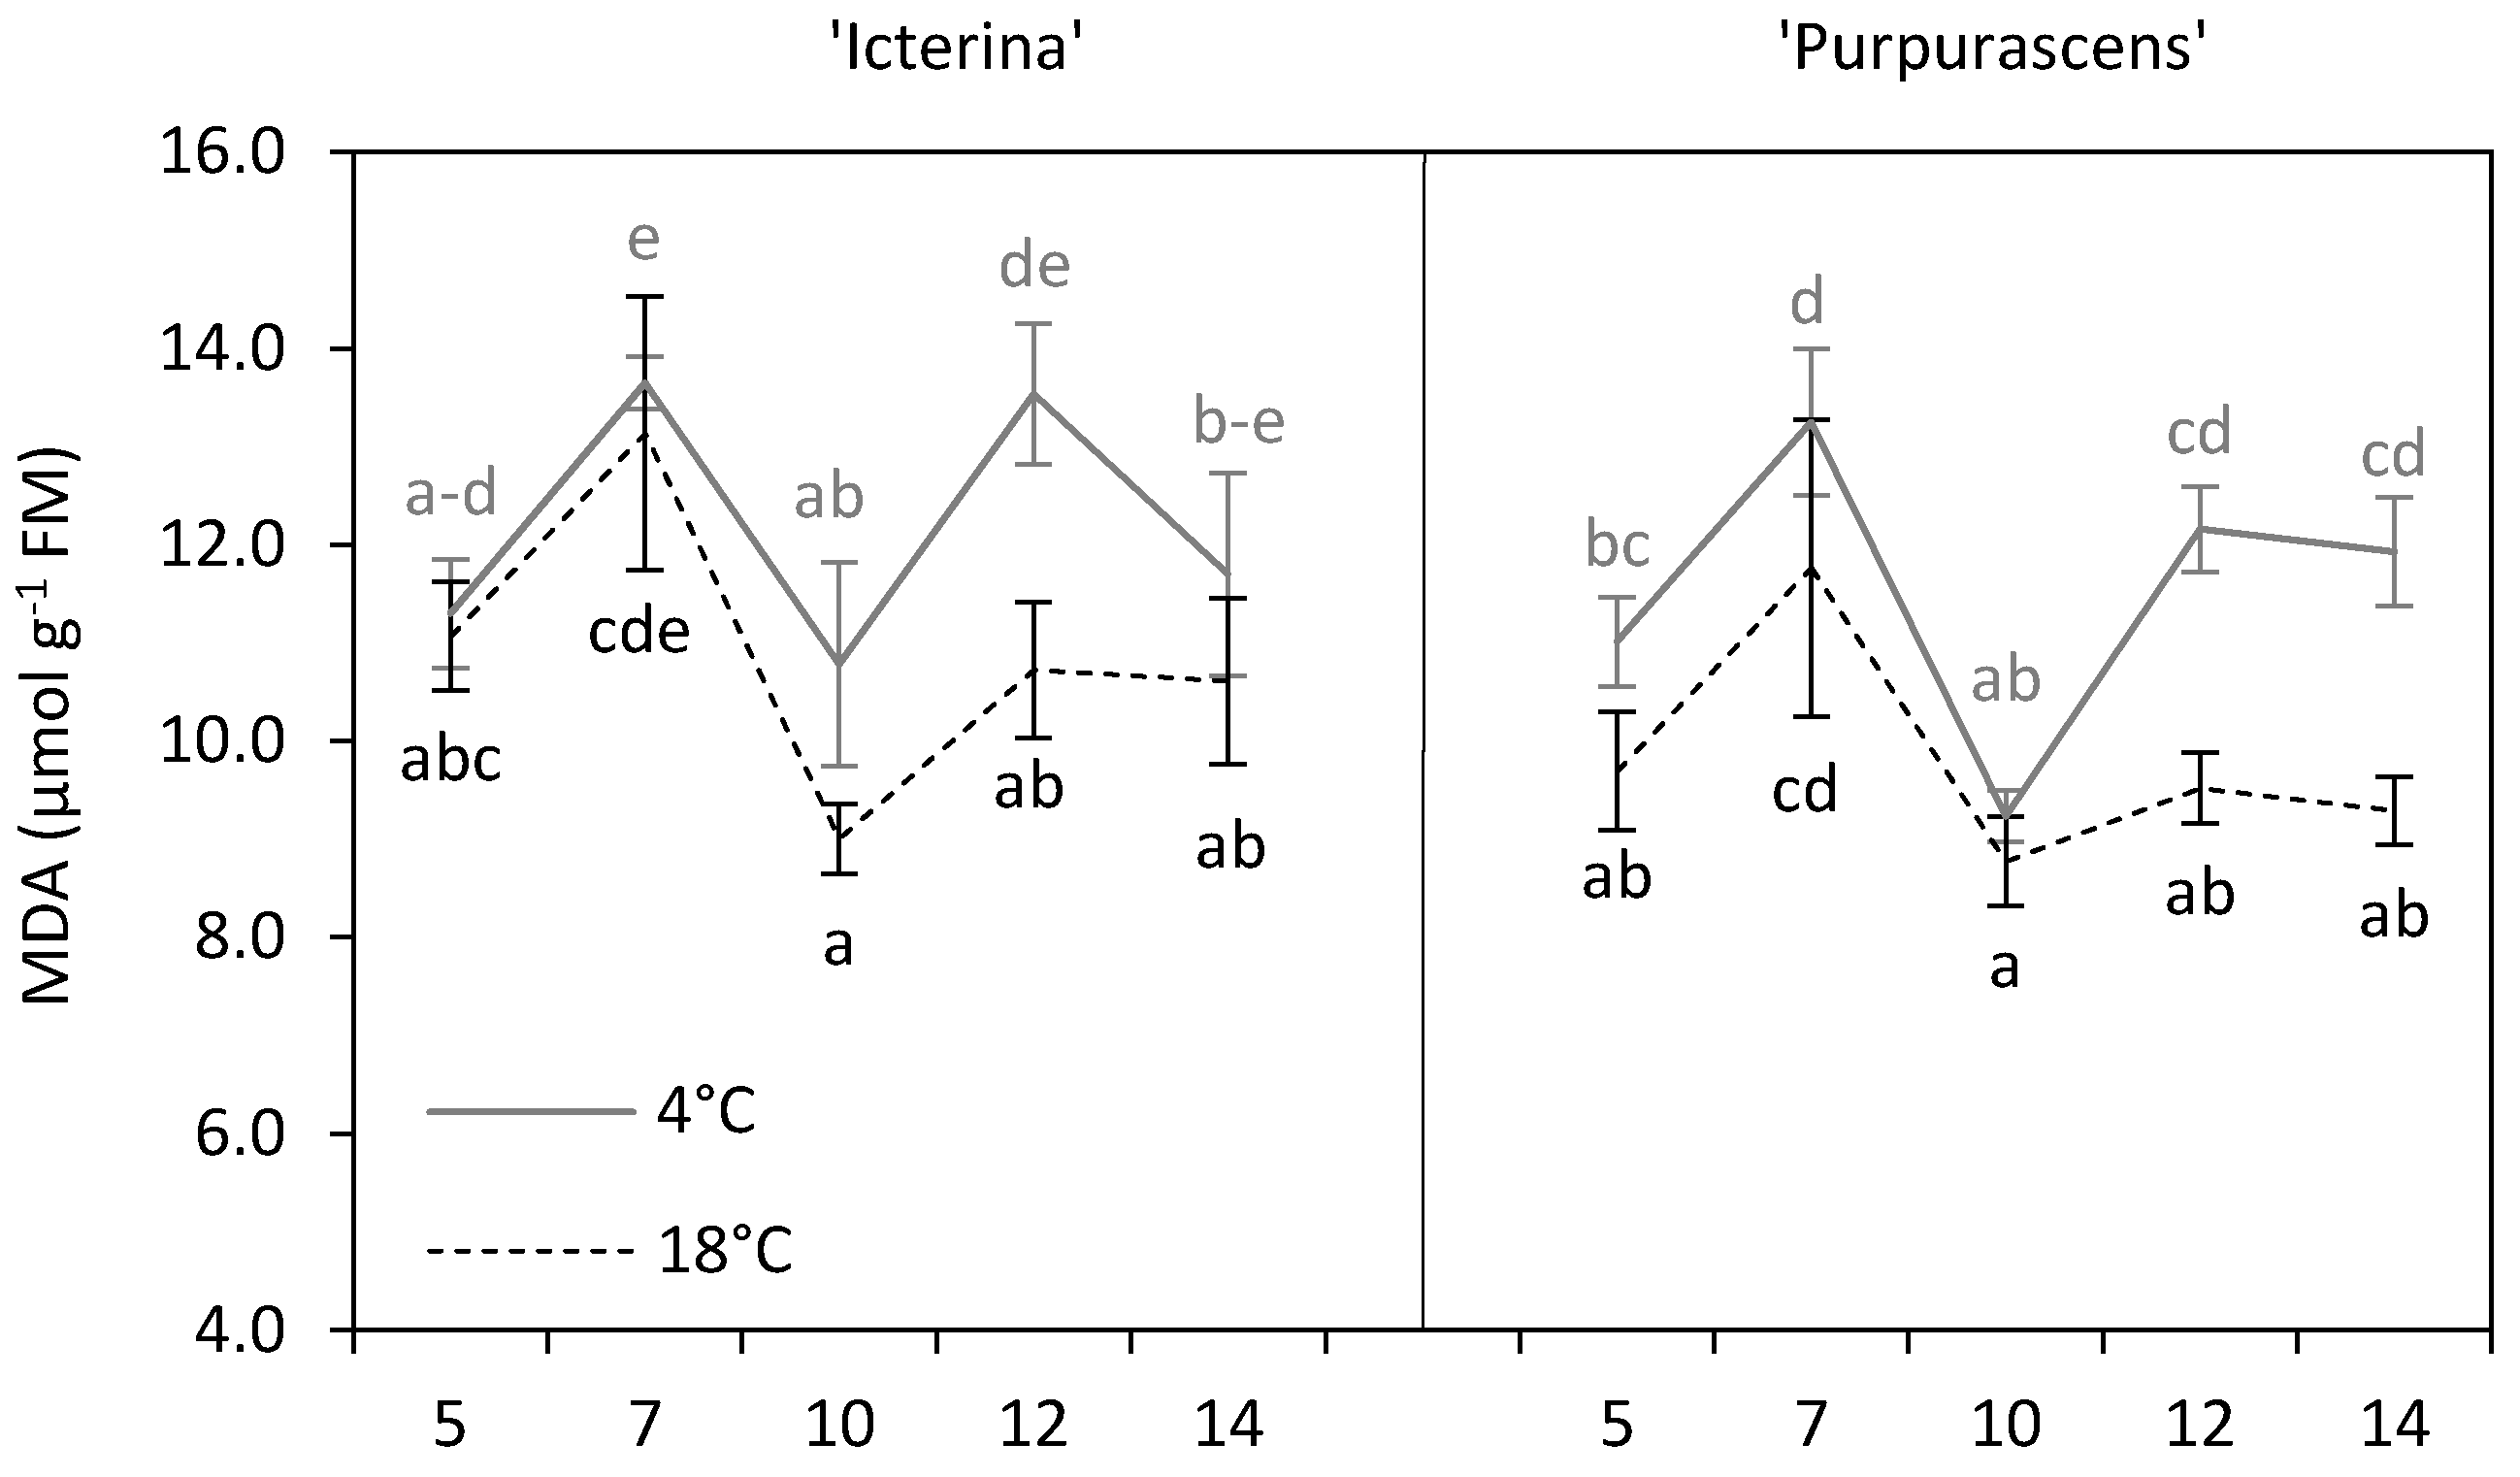
3.3. Malondialdehyde
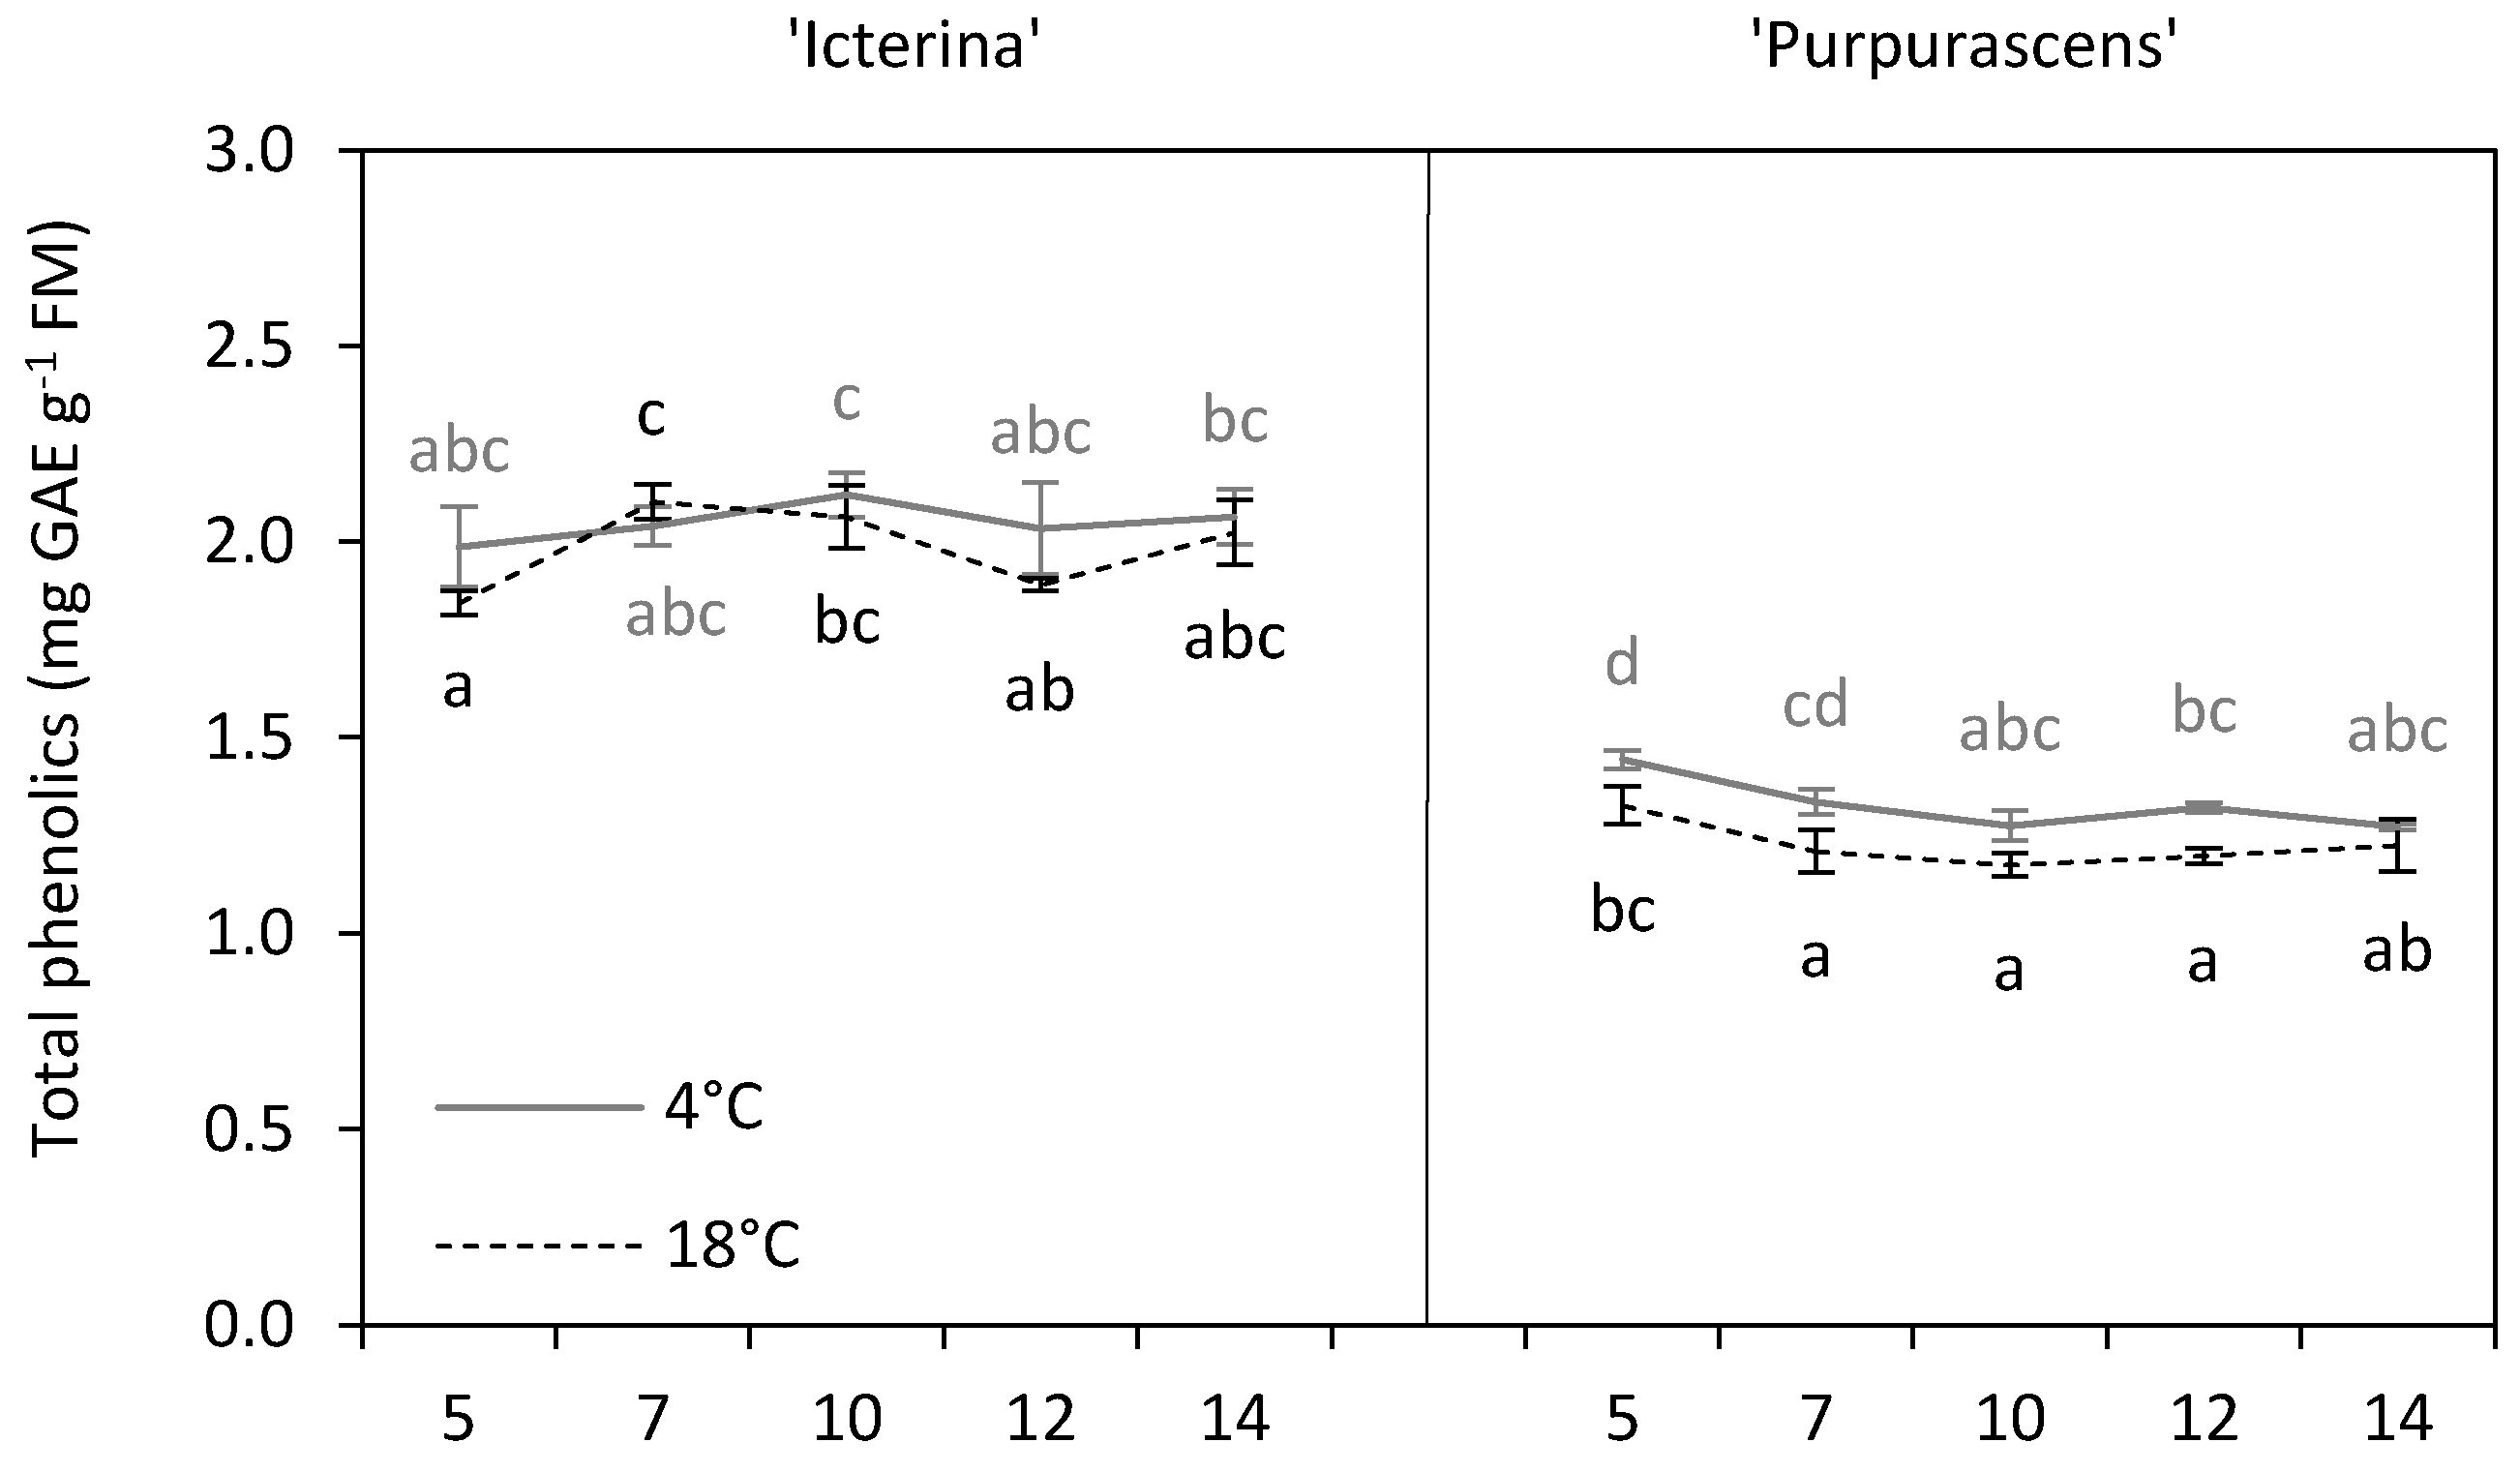
3.4. Total Phenolics
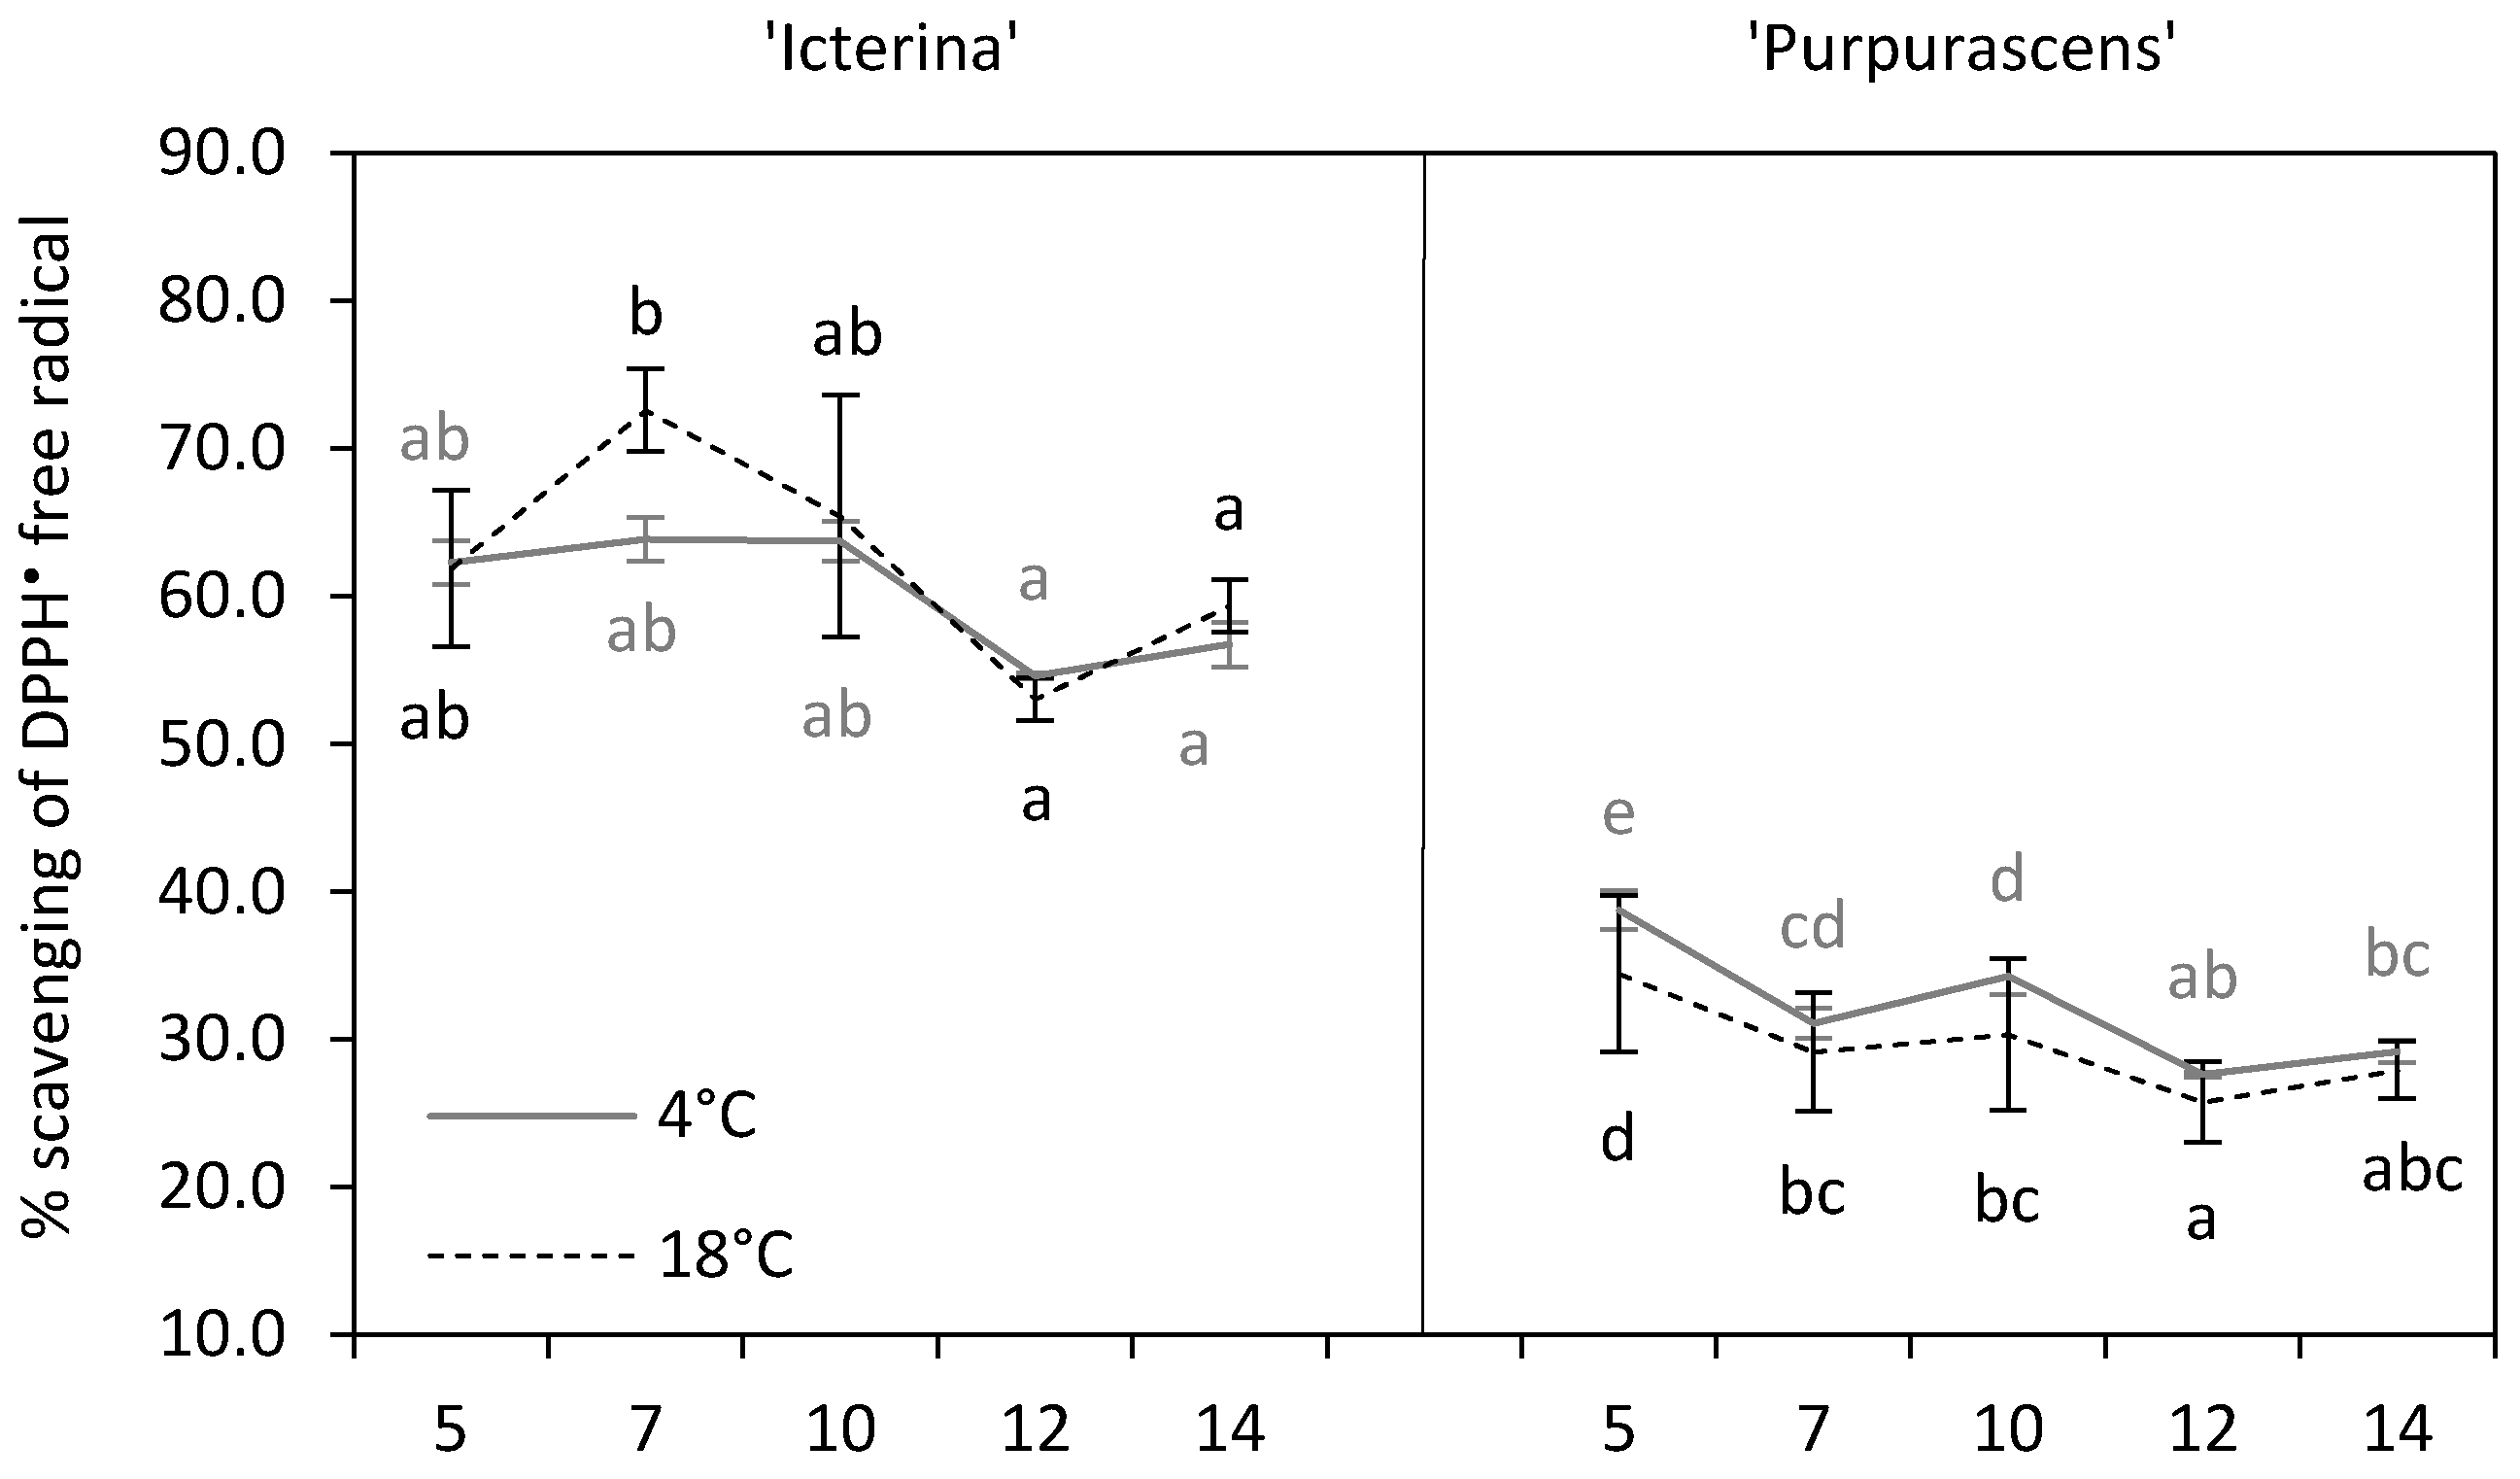
3.5. DPPH• Radical Scavenging Activity
3.6. Antioxidant Enzyme Assays
3.7. Statistical Analysis
4. Conclusions
Author Contributions
Funding
Conflicts of Interest
References
- Apel, K.; Hirt, H. Reactive oxygen species: Metabolism, oxidative stress, and signal transduction. Annu. Rev. Plant Biol. 2004, 55, 373–399. [Google Scholar] [CrossRef] [PubMed]
- Gill, S.S.; Tuteja, N. Reactive oxygen species and antioxidant machinery in abiotic stress tolerance in crop plants. Plant Physiol. Biochem. 2010, 48, 909–930. [Google Scholar] [CrossRef] [PubMed]
- Suzuki, N.; Mittler, R. Reactive oxygen species and temperature stresses: A delicate balance between signaling and destruction. Physiol. Plant. 2006, 126, 45–51. [Google Scholar] [CrossRef]
- Yonny, M.E.; Torressi, A.R.; Nazareno, M.A.; Cerutti, S. Development of a novel, sensitive, selective, and fast methodology to determine malondialdehyde in leaves of melon plants by ultra-high-performance liquid chromatography-tandem mass spectrometry. J. Anal. Methods Chem. 2017, 2017. [Google Scholar] [CrossRef] [PubMed]
- Caverzan, A.; Casassola, A.; Brammer, S.P. Reactive oxygen species and antioxidant enzymes involved in plant tolerance to stress. In Abiotic and Biotic Stress in Plants—Recent Advances and Future Perspectives, 1st ed.; Shanker, A., Chanker, C., Eds.; InTechOpen: Rijeka, Croatia, 2016; pp. 463–480. [Google Scholar]
- Mittler, R. Oxidative stress, antioxidants and stress tolerance. Trends Plant Sci. 2002, 7, 405–410. [Google Scholar] [CrossRef]
- Sharma, P.; Jha, A.B.; Dubey, R.S.; Pessarakli, M. Reactive oxygen species, oxidative damage, and antioxidative defense mechanism in plants under stressful conditions. J. Bot. 2012, 2012. [Google Scholar] [CrossRef]
- Huang, M.; Guo, Z. Responses of antioxidative system to chilling stress in two rice cultivars differing in sensitivity. Biol. Plant. 2005, 49, 81–84. [Google Scholar] [CrossRef]
- Oh, M.M.; Carey, E.E.; Rajashekar, C.B. Environmental stresses induce health-promoting phytochemicals in lettuce. Plant Physiol. Biochem. 2009, 47, 578–583. [Google Scholar]
- Kuk, Y.I.; Shin, J.S.; Burgos, N.R.; Hwang, T.E.; Han, O.; Cho, B.H.; Jung, S.; Guh, J.O. Antioxidative enzymes offer protection from chilling damage in rice plants. Crop. Sci. 2003, 43, 2109–2117. [Google Scholar] [CrossRef]
- Lee, D.H.; Lee, C.B. Chilling stress-induced changes of antioxidant enzymes in the leaves of cucumber: In gel enzyme activity assays. Plant Sci. 2000, 159, 75–85. [Google Scholar] [CrossRef]
- Airaki, M.; Leterrier, M.; Mateos, R.M.; Valderrama, R.; Chaki, M.; Barroso, J.B.; Del Río, L.A.; Palma, J.M.; Corpas, F.J. Metabolism of reactive oxygen species and reactive nitrogen species in pepper (Capsicum annuum L.) plants under low temperature stress. Plant Cell Environ. 2012, 35, 281–295. [Google Scholar] [CrossRef] [PubMed]
- Cheng, F.; Lu, J.; Gao, M.; Shi, K.; Kong, Q.; Huang, Y.; Bie, Z. Redox signaling and CBF-responsive pathway are involved in salicylic acid-improved photosynthesis and growth under chilling stress in watermelon. Front. Plant Sci. 2016, 7, 1519. [Google Scholar] [CrossRef] [PubMed]
- Yadegari, L.Z.; Heidari, R.; Carapetian, J. Cold pretreatment-induced changes in antioxidant enzyme activities and relative water content and soluble sugars in shoots and roots of soybean seedlings. J. Biol. Sci. 2007, 7, 1525–1530. [Google Scholar]
- Kalisz, A.; Pokluda, R.; Jezdinský, A.; Sękara, A.; Grabowska, A.; Gil, J.; Neugebauerová, J. Chilling-induced changes in the antioxidant status of basil plants. Acta Physiol. Plant. 2016, 38, 196. [Google Scholar] [CrossRef]
- Soengas, P.; Rodríguez, V.M.; Velasco, P.; Cartea, M.E. Effect of temperature stress on antioxidant defenses in Brassica oleracea. ACS Omega 2018, 3, 5237–5243. [Google Scholar] [CrossRef] [PubMed]
- Sivaci, A.; Kaya, A.; Duman, S. Effects of ascorbic acid on some physiological changes of pepino (Solanum muricatum Ait.) under chilling stress. Acta Biol. Hungarica 2014, 65, 305–318. [Google Scholar] [CrossRef] [PubMed]
- Proietti, S.; Moscatello, S.; Famiani, F.; Battistelli, A. Increase of ascorbic acid content and nutritional quality in spinach leaves during physiological acclimation to low temperature. Plant Physiol. Biochem. 2009, 47, 717–723. [Google Scholar] [CrossRef] [PubMed]
- Janda, T.; Kósa, E.; Pintér, J.; Szalai, G.; Marton, C.; Páldi, E. Antioxidant activity and chilling tolerance of young maize inbred lines and their hybrids. Cereal Res. Commun. 2005, 33, 541–548. [Google Scholar] [CrossRef]
- Xu, S.C.; Li, Y.P.; Hu, J.; Guan, Y.J.; Ma, W.G.; Zheng, Y.Y.; Zhu, S.J. Responses of antioxidant enzymes to chilling stress in tobacco seedlings. Agric. Sci. China 2010, 9, 1594–1601. [Google Scholar] [CrossRef]
- Xu, P.L.; Guo, Y.K.; Bai, J.G.; Shang, L.; Wang, X.J. Effects of long-term chilling on ultrastructure and antioxidant activity in leaves of two cucumber cultivars under low light. Physiol. Plant. 2008, 132, 467–478. [Google Scholar] [CrossRef] [PubMed]
- Borowski, E. Response to chilling in cucumber (Cucumis sativus L.) plants treated with triacontanol and Asahi SL. Acta Agrobot. 2009, 62, 165–172. [Google Scholar] [CrossRef][Green Version]
- Bloom, A.J.; Zwieniecki, M.A.; Passioura, J.B.; Randall, L.B.; Holbrook, N.M.; Clair, D.A. Water relations under root chilling in a sensitive and tolerant tomato species. Plant Cell Environ. 2004, 27, 971–979. [Google Scholar] [CrossRef]
- Lukatkin, A.S.; Brazaitytė, A.; Bobinas, Č.; Duchovskis, P. Chilling injury in chilling-sensitive plants: A review. Agriculture 2012, 99, 111–124. [Google Scholar]
- Rodríguez, V.M.; Soengas, P.; Alonso-Villaverde, V.; Sotelo, T.; Cartea, M.E.; Velasco, P. Effect of temperature stress on the early vegetative development of Brassica oleracea L. BMC Plant Biol. 2015, 15, 145. [Google Scholar] [CrossRef] [PubMed]
- Kalisz, A.; Sękara, A.; Pokluda, R.; Jezdinský, A.; Neugebauerová, J.; Grabowska, A.; Jurkow, R.; Slezák, K.A. Physio-biochemical responses of sage genotypes to chilling. Hort. Sci. 2019. under review. [Google Scholar]
- Habán, M.; Habánová, M.; Holovičová, M.; Ražná, K. Rosmarinic acid content in selected varieties of sage (Salvia officinalis L.). J. Cent. Eur. Agric. 2019, 20, 305–320. [Google Scholar] [CrossRef]
- Rivero, R.M.; Ruiz, J.M.; García, P.C.; López-Lefebre, L.R.; Sánchez, E.; Romero, R. Resistance to cold and heat stress: Accumulation of phenolic compounds in tomato and watermelon plants. Plant Sci. 2001, 160, 315–321. [Google Scholar] [CrossRef]
- Kang, H.M.; Saltveit, M.E. Reduced chilling tolerance in elongating cucumber seedling radicles is related to their reduced antioxidant enzyme and DPPH-radical scavenging activity. Physiol. Plant. 2002, 115, 244–250. [Google Scholar] [CrossRef] [PubMed]
- Pop, A.V.; Tofană, M.; Socaci, S.A.; Pop, C.; Rotar, A.M.; Nagy, M.; Salanță, L. Determination of antioxidant capacity and antimicrobial activity of selected Salvia species. Bull. UASVM Food Sci. Technol. 2016, 73, 14–18. [Google Scholar]
- Das, K.; Roychoudhury, A. Reactive oxygen species (ROS) and response of antioxidants as ROS-scavengers during environmental stress in plants. Front. Environ. Sci. 2014, 2, 53. [Google Scholar] [CrossRef]
- Shigeoka, S.; Ishikawa, T.; Tamoi, M.; Miyagawa, Y.; Takeda, T.; Yabuta, Y.; Yoshimura, K. Regulation and function of ascorbate peroxidase isoenzymes. J. Exp. Bot. 2002, 53, 1305–1319. [Google Scholar] [CrossRef] [PubMed]
- Guo, Z.; Ou, W.; Lu, S.; Zhong, Q. Differential responses of antioxidative system to chilling and drought in four rice cultivars differing in sensitivity. Plant Physiol. Biochem. 2006, 4, 828–836. [Google Scholar] [CrossRef] [PubMed]
- Caverzan, A.; Passaia, G.; Rosa, S.B.; Ribeiro, C.W.; Lazzarotto, F.; Margis-Pinheiro, M. Plant responses to stresses: Role of ascorbate peroxidase in the antioxidant protection. Genet. Mol. Biol. 2012, 35, 1011–1019. [Google Scholar] [CrossRef] [PubMed]
- Pandey, S.; Fartyal, D.; Agarwal, A.; Shukla, T.; James, D.; Kaul, T.; Negi, Y.K.; Arora, S.; Reddy, M.K. Abiotic stress tolerance in plants: Myriad roles of ascorbate peroxidase. Front. Plant Sci. 2017, 8, 581. [Google Scholar] [CrossRef] [PubMed]
- Duan, M.; Feng, H.L.; Wang, L.Y.; Li, D.; Meng, Q.W. Overexpression of thylakoidal ascorbate peroxidase shows enhanced resistance to chilling stress in tomato. J. Plant Physiol. 2012, 169, 867–877. [Google Scholar] [CrossRef] [PubMed]
- Guo, W.L.; Chen, R.G.; Gong, Z.H.; Yin, Y.X.; Ahmed, S.S.; He, Y.N. Exogenous abscisic acid increases antioxidant enzymes and related gene expression in pepper (Capsicum annuum) leaves subjected to chilling stress. Genet. Mol. Res. 2012, 11, 4063–4080. [Google Scholar] [CrossRef] [PubMed]
- Dhindsa, R.S.; Matowe, W. Drought tolerance in two mosses: Correlated with enzymatic defense against lipid peroxidation. J. Exp. Bot. 1981, 32, 79–91. [Google Scholar] [CrossRef]
- Djeridane, A.; Yousfi, M.; Nadjemi, B.; Boutassouna, D.; Stocker, P.; Vidal, N. Antioxidant activity of some Algerian medicinal plants extracts containing phenolic compound. Food Chem. 2006, 97, 654–660. [Google Scholar] [CrossRef]
- Bartosz, G. Druga Twarz Tlenu. Wolne Rodniki W Przyrodzie [Free Radicals in Nature], 2nd ed.; PWN: Warszawa, Poland, 2009. [Google Scholar]
- Aebi, H. Catalase in vitro. Method Enzymol. 1984, 105, 121–126. [Google Scholar]
- Nakano, Y.; Asada, K. Hydrogen peroxide is scavenged by ascorbate specific peroxidase in spinach chloroplasts. Plant Cell Physiol. 1981, 22, 867–880. [Google Scholar]
- Zhang, Z.; Pang, X.; Duan, X.; Ji, Z.L.; Jiang, Y. Role of peroxidase in anthocyanine degradation in litchi fruit pericarp. Food Chem. 2005, 90, 47–52. [Google Scholar] [CrossRef]
Sample Availability: Not available. |


| Parameter | Source of Variation | |||||
|---|---|---|---|---|---|---|
| Icterina | Purpurascens | |||||
| T | S | T × S | T | S | T × S | |
| Dry matter | *** | *** | *** | *** | *** | *** |
| Malondialdehyde | *** | *** | *** | *** | *** | *** |
| Total phenolics | * | * | ** | *** | *** | *** |
| Antioxidant capacity | ns | *** | *** | *** | *** | *** |
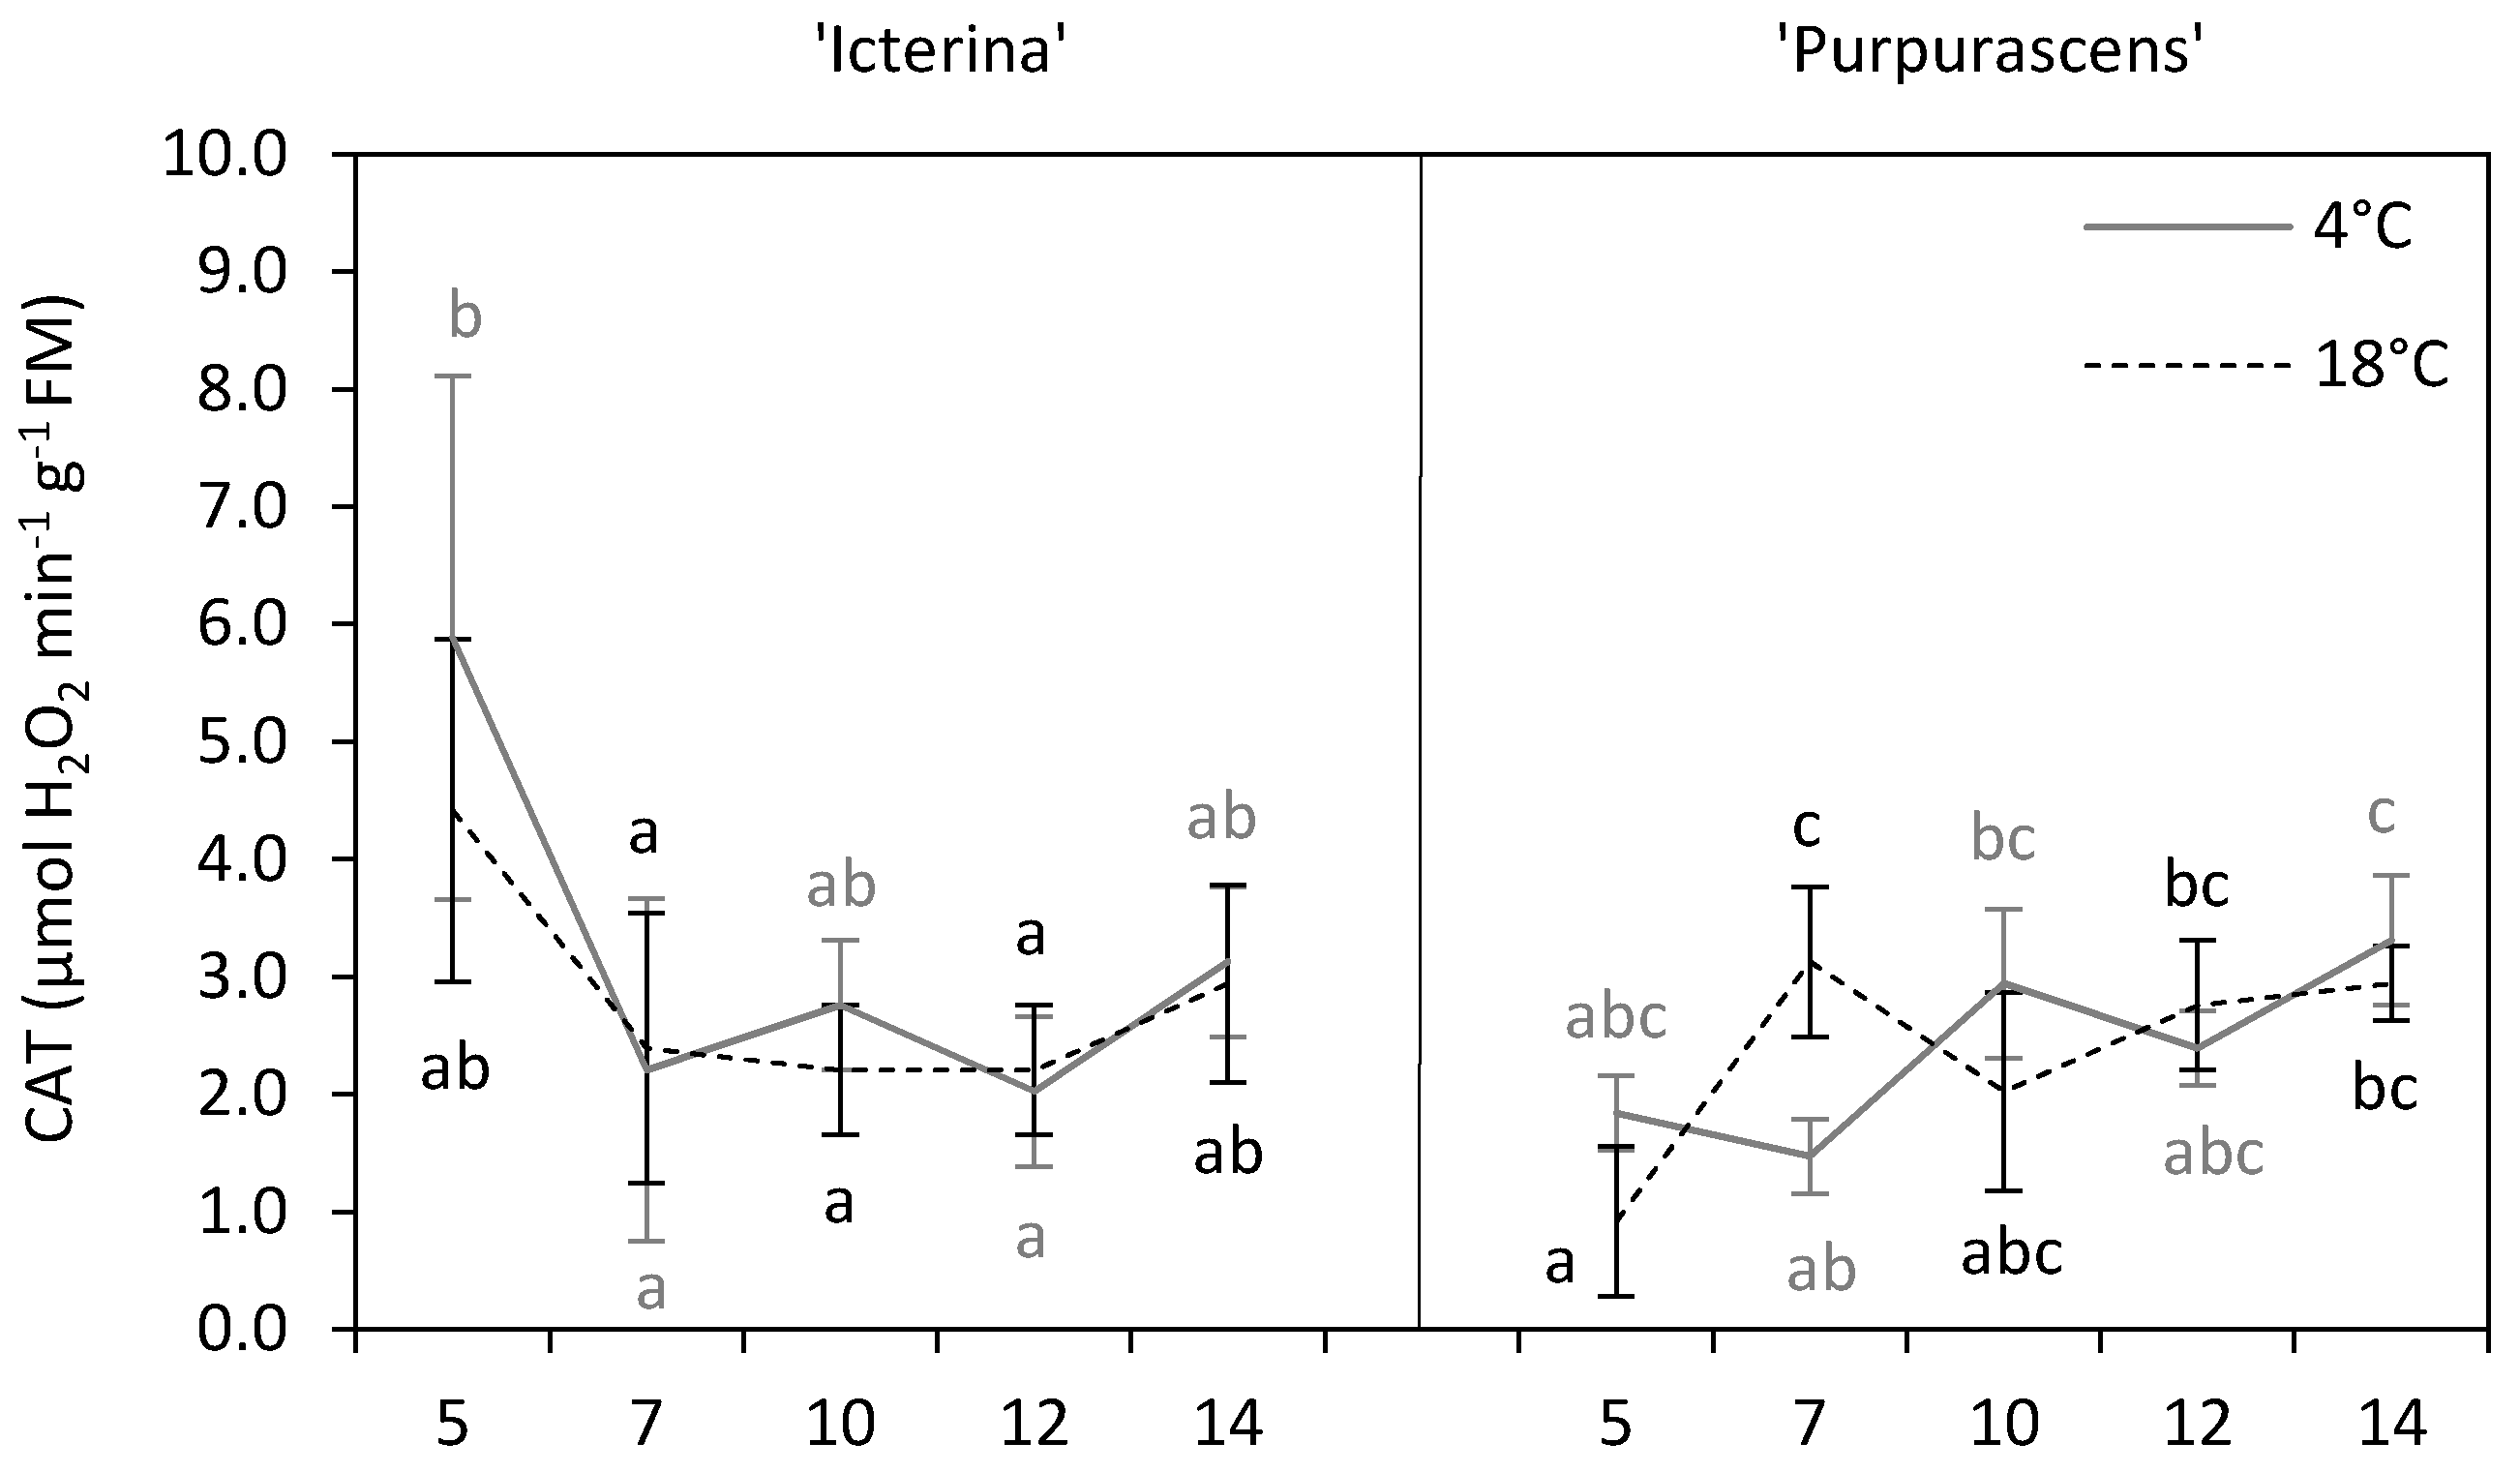
| Catalase | ns | ** | * | ns | *** | ** |
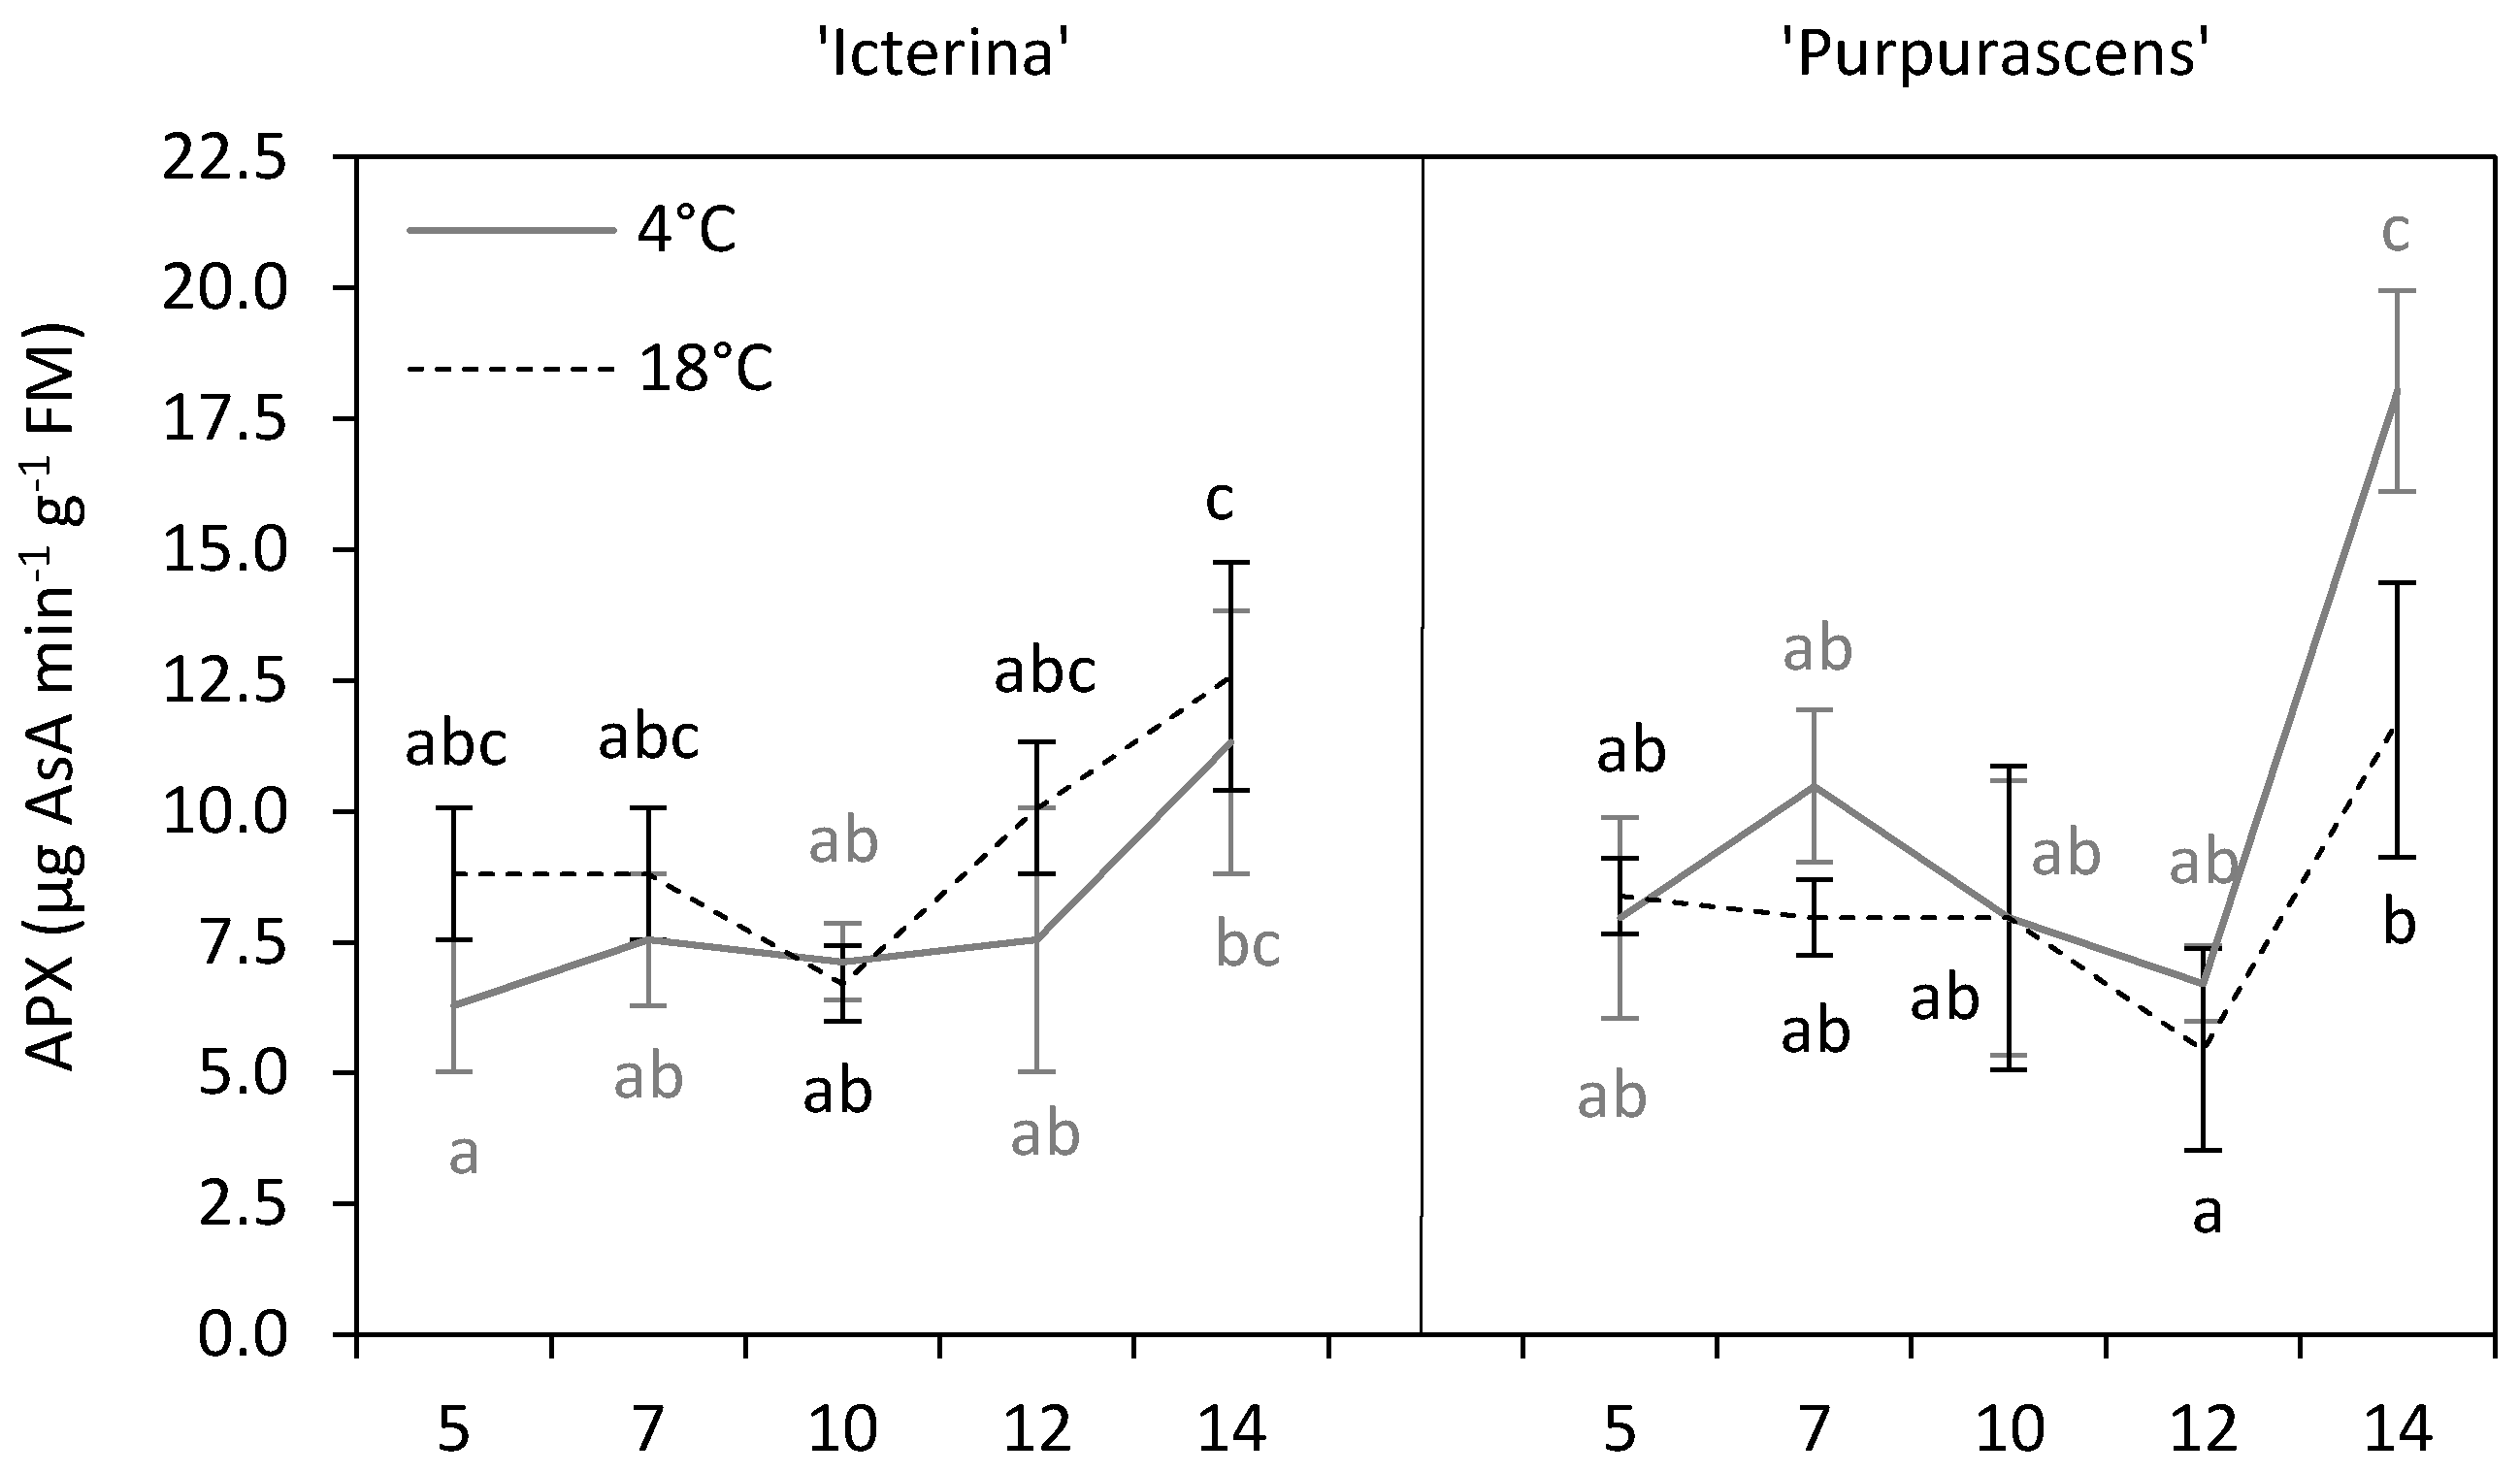
| Ascorbate peroxidase | * | *** | ** | * | *** | *** |
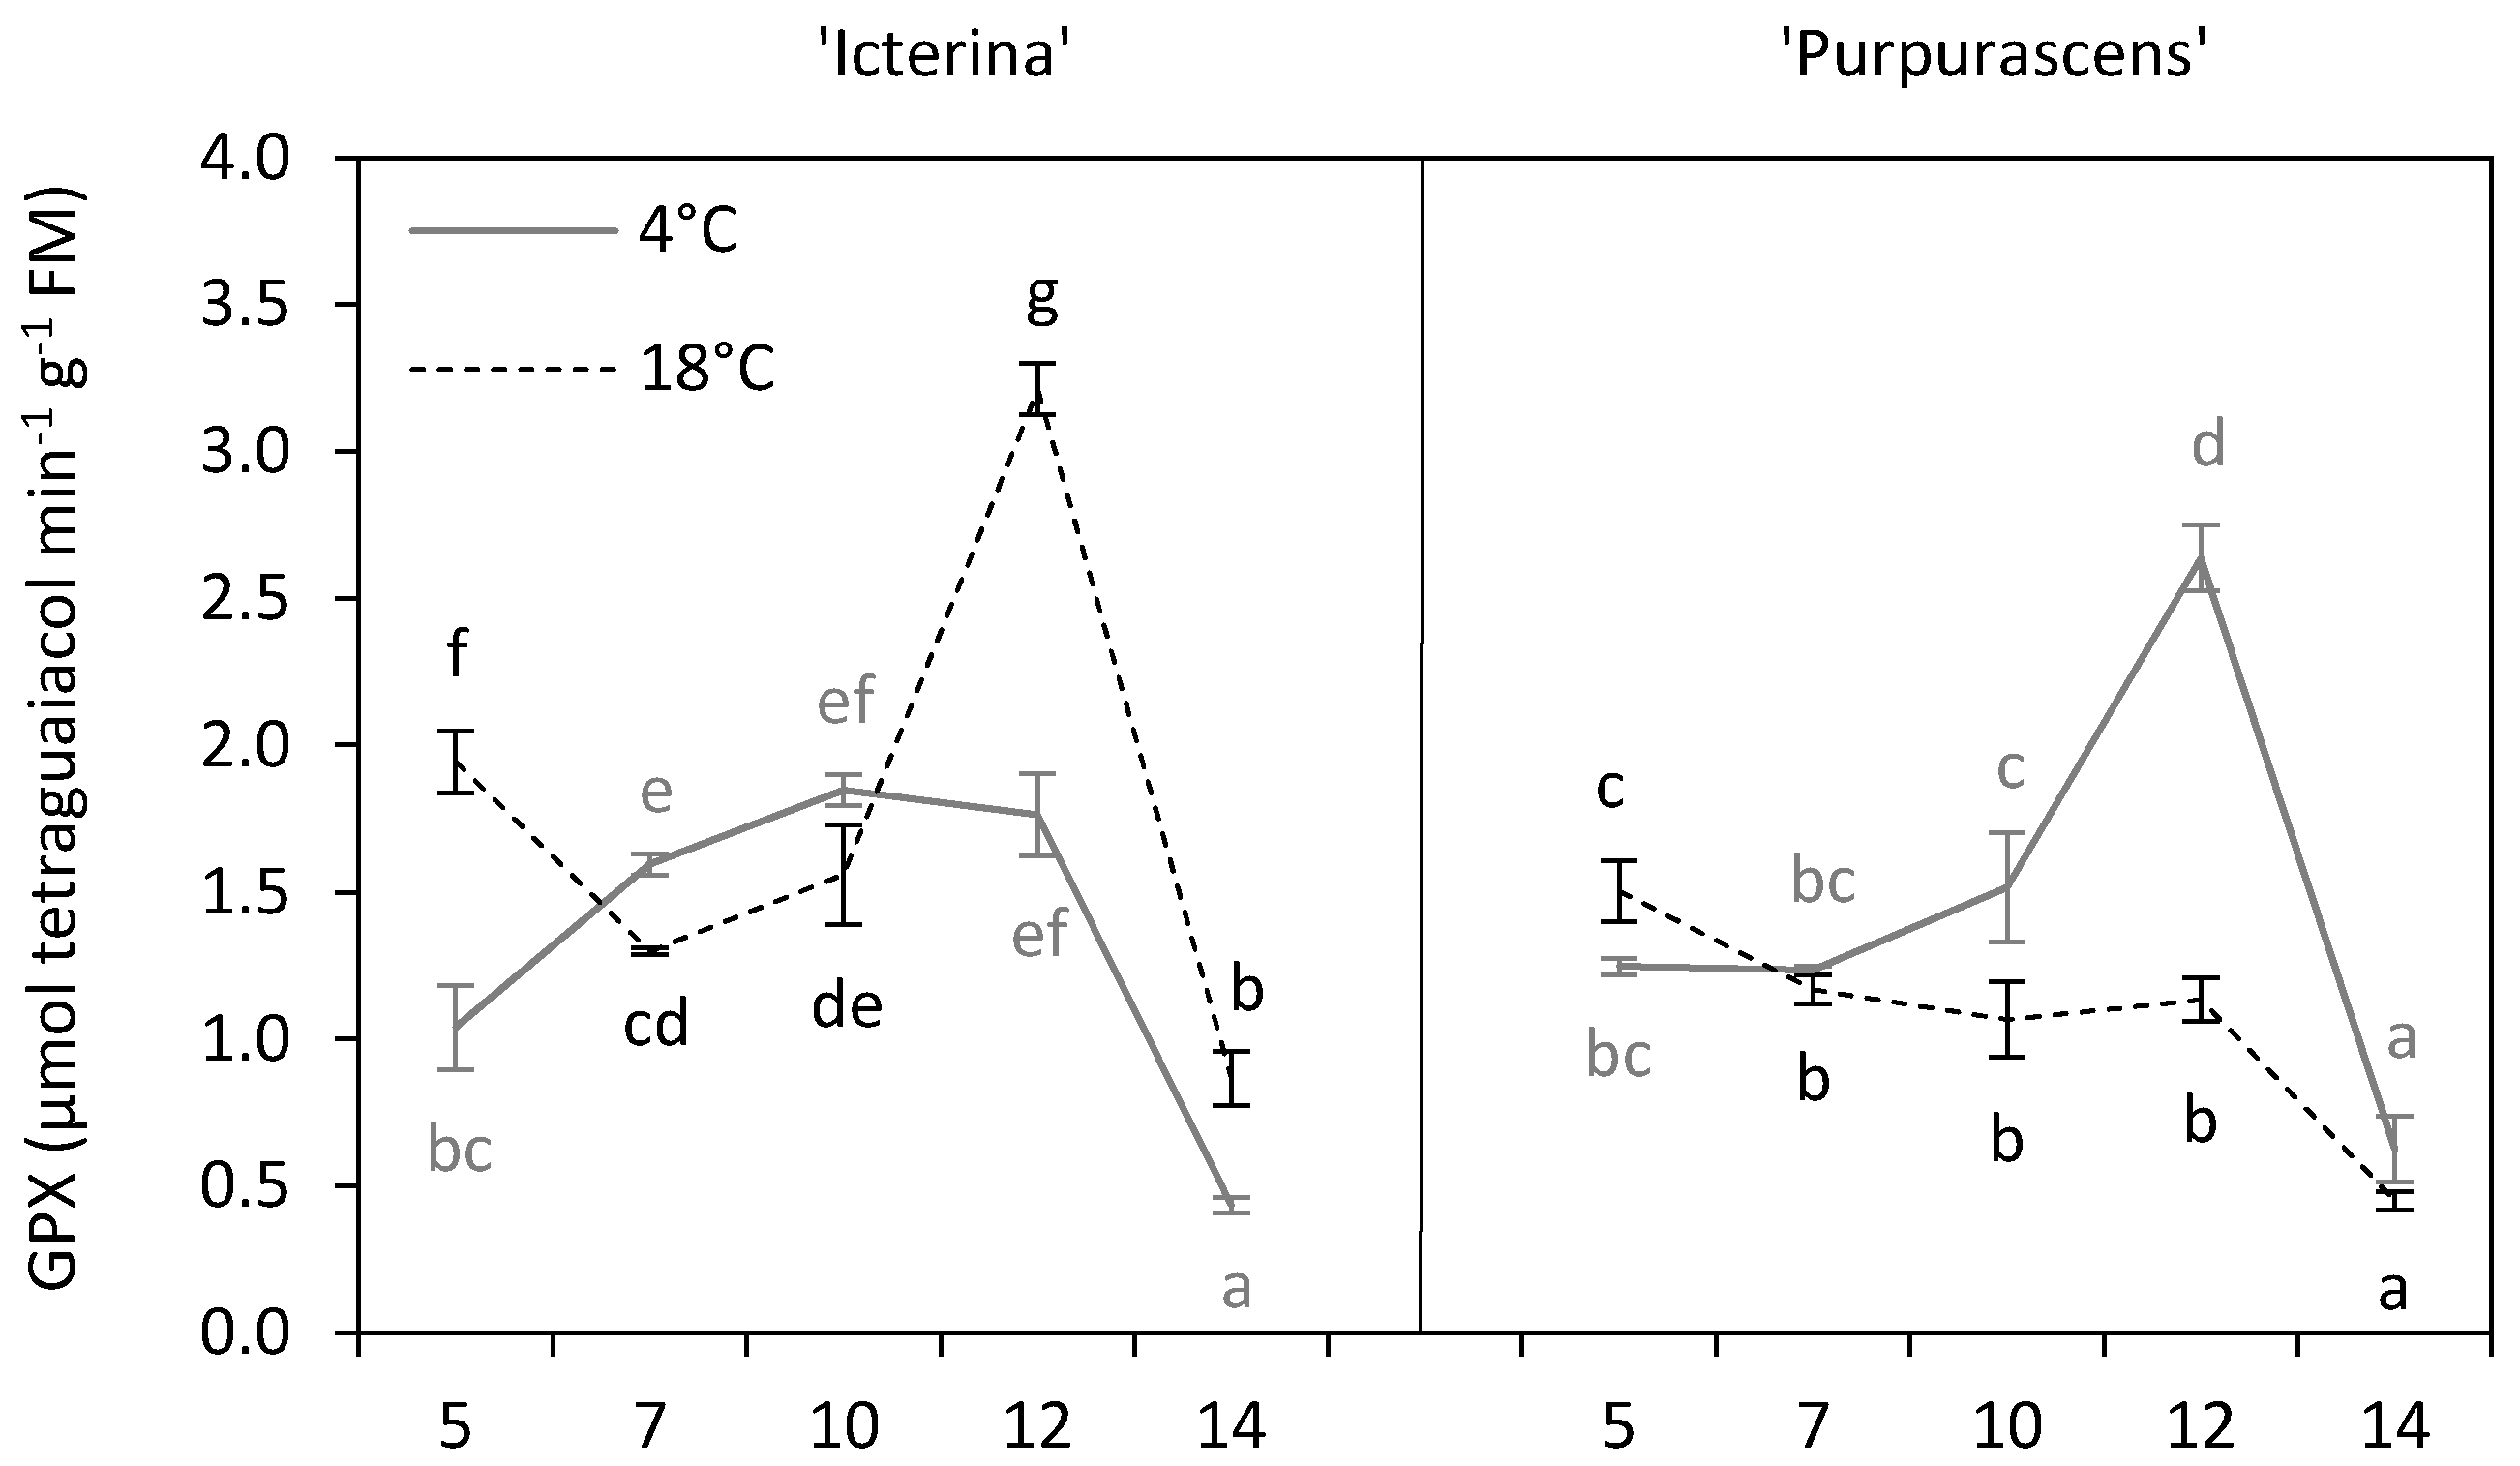
| Guaiacol peroxidase | *** | *** | *** | *** | *** | *** |
| Parameter | Unit | Icterina | Purpurascens | Significance |
|---|---|---|---|---|
| Dry matter | % FM | 17.41 b | 14.97 a | *** |
| Malondialdehyde | µmol g−1 FM | 11.55 b | 10.66 a | * |
| Total phenolics | mg GAE g−1 FM | 2.02 b | 1.28 a | *** |
| Antioxidant capacity | % scavenging of DPPH• | 61.36 b | 30.86 a | *** |
| Catalase | µmol H2O2 min−1 g−1 FM | 3.02 b | 2.37 a | * |
| Ascorbate peroxidase | µg AsA min−1 g−1 FM | 8.68 a | 9.27 a | ns |
| Guaiacol peroxidase | µmol tetraguaiacol min−1 g−1 FM | 1.56 a | 1.26 a | ns |
© 2019 by the authors. Licensee MDPI, Basel, Switzerland. This article is an open access article distributed under the terms and conditions of the Creative Commons Attribution (CC BY) license (http://creativecommons.org/licenses/by/4.0/).
Share and Cite
Kalisz, A.; Sękara, A.; Pokluda, R.; Jezdinský, A.; Neugebauerová, J.; Slezák, K.A.; Kunicki, E. Sequential Response of Sage Antioxidant Metabolism to Chilling Treatment. Molecules 2019, 24, 4087. https://doi.org/10.3390/molecules24224087
Kalisz A, Sękara A, Pokluda R, Jezdinský A, Neugebauerová J, Slezák KA, Kunicki E. Sequential Response of Sage Antioxidant Metabolism to Chilling Treatment. Molecules. 2019; 24(22):4087. https://doi.org/10.3390/molecules24224087
Chicago/Turabian StyleKalisz, Andrzej, Agnieszka Sękara, Robert Pokluda, Aleš Jezdinský, Jarmila Neugebauerová, Katalin Angéla Slezák, and Edward Kunicki. 2019. "Sequential Response of Sage Antioxidant Metabolism to Chilling Treatment" Molecules 24, no. 22: 4087. https://doi.org/10.3390/molecules24224087
APA StyleKalisz, A., Sękara, A., Pokluda, R., Jezdinský, A., Neugebauerová, J., Slezák, K. A., & Kunicki, E. (2019). Sequential Response of Sage Antioxidant Metabolism to Chilling Treatment. Molecules, 24(22), 4087. https://doi.org/10.3390/molecules24224087