Article

Solar UV Radiation in Saint-Denis, La Réunion and Cape Town, South Africa: 10 years Climatology and Human Exposure Assessment at Altitude

by
Jean-Maurice Cadet
1,*,
Hassan Bencherif
1,2,
David J. du Preez
3,
Thierry Portafaix
1,
Nathalie Sultan-Bichat
4,
Matthias Belus
5,
Colette Brogniez
6,
Frederique Auriol
6,
Jean-Marc Metzger
7,
Katlego Ncongwane
8,
Gerrie J. R. Coetzee
8 and
Caradee Y. Wright
3,9
1
LACy, Laboratoire de l’Atmosphère et des Cyclones (UMR 8105 CNRS, Université de La Réunion, Météo-France), 97744 Saint-Denis de La Réunion, France
2
School of Chemistry and Physics, University of KwaZulu-Natal, Durban 4041, South Africa
3
Department of Geography, Geoinformatics and Meteorology, University of Pretoria, Pretoria 0002, South Africa
4
Centre Hospitalier Ouest Réunion, Service Dermatologie, 5 Impasse Plaine Chabier, Le Grand Pourpier Sud, 97460 Saint-Paul, Réunion, France
5
Conseil Régional de la Réunion, 5 Avenue René Cassin, Sainte-Clotilde, 97490 La Réunion, France
6
Université Lille, CNRS, UMR 8518, Laboratoire d’Optique Atmosphérique, F-59000 Lille, France
7
Observatoire des Sciences de l’Univers de la Réunion, UMS3365, 97744 Saint-Denis de la Réunion, France
8
SAWS, South African Weather Service, Private Bag X097, Pretoria 0001, South Africa
9
Environment and Health Research Unit, South African Medical Research Council, Pretoria 0001, South Africa
*
Author to whom correspondence should be addressed.
Atmosphere 2019, 10(10), 589; https://doi.org/10.3390/atmos10100589
Submission received: 5 August 2019 / Revised: 20 September 2019 / Accepted: 26 September 2019 / Published: 1 October 2019

Abstract

:
Solar ultraviolet radiation (UVR) monitoring is important since it depends on several atmospheric parameters which are associated with climate change and since excess solar UVR exposure and has significant impacts on human health and wellbeing. The objective of this study was to investigate the trends in solar UVR during a decade (2009–2018) in Saint-Denis, Reunion Island (20.9°S, 55.5°E, 85 m ASL) and Cape Town, South Africa (33.97°S, 18.6°E, 42 m ASL). This comparison was done using total daily erythema exposure as derived from UVR sensors continuously at both sites. Climatology over the 10-year period showed extreme UVR exposure for both sites. Slight changes with opposite trends were found, +3.6% at Saint-Denis and −3.7% at Cape Town. However, these two sites often experience extreme weather conditions thereby making the trend evaluation difficult. Human exposure assessment was performed for hiking activities at two popular high-altitude hiking trails on the Maïdo–Grand Bénare (Reunion) and Table Mountain (Cape Town) with a handheld radiometer. Extreme exposure doses of 64 SED and 40 SED (Standard Erythemal Dose, 1 SED = 100 J.m−2) were recorded, respectively. These high exposure doses highlight the importance of raising public awareness on the risk related to excess UVR exposure at tourist sites, especially those at high altitude.

1. Introduction

The effects of ultraviolet radiation (UVR) on humans are well known today and depend on several factors including atmospheric variables influencing the amount of surface solar UVR such as cloud cover and altitude, as well as skin phototype which determines the individual risk to excess solar UVR [1]. The Fitzpatrick Skin Phototype classification (Table 1) [2] is commonly used and classifies skin phototypes as a function of their characteristics and sunburn susceptibility. The harmful effects of excess ultraviolet (UV) exposure include sunburn, skin cancer, cataracts, and ocular melanoma [3,4]. About 90% of skin-related health impacts are related to UVR exposure [5]. In South Africa, the melanoma rate is stable at 5 and 3 cases per 100,000 persons (computed for a world standard population) for males and females, respectively [6]. Even though statistics are not deemed comprehensive, a possible increasing trend is evident for invasive melanoma from 2006 to 2015 for La Reunion [7]. For 2006 to 2015, in a male standard population, the increase was 2.7 to 7.1 cases per 100,000 persons and 3.0 to 6.1 cases per 100,000 persons in a female standard population [8]. Human behaviour change is another important factor influencing solar UVR exposure and subsequent ill health effects [9]. In a social context in which people spend time outdoors and expose themselves to the sun, public awareness and skin cancer prevention campaigns are crucial.
This study focused on understanding total daily UVR exposure doses in Saint-Denis, Reunion Island and in Cape Town, South Africa. Firstly, UVR exposure dose was analyzed from a climatological point of view and then, by focusing on the trend over a 10-year period from 2009 to 2018. Secondly, results from two case studies that measured ambient solar UVR exposure at points along popular hiking sites located at altitude are presented.

2. Experiments

2.1. UV Instruments

2.1.1. Ground-Based UVR Instrument at Saint-Denis

UVR is recorded at Saint-Denis on the roof of the Laboratoire de l’Atmosphère et des Cyclones (20.9°S, 55.5°E, 85 m ASL, Figure 1). The instrument is a double-monochromator Bentham DTMc300 provided by Bentham Instrument Ltd. Co. (United Kingdom). Since February 2009, UV irradiance between 280 nm and 400 nm is sampled in 0.5 nm increments every 15-minutes. The instrument is calibrated every three months, a 150 W and a 1000 W tungsten-halogen lamp are used for spectral calibration and a software tool developed at Laboratoire d’Optique Atmosphérique is used for the wavelength misalignment correction [10]. These lamps are traceable to the National Institute of Standards and Technology (NIST). The UV Index (UVI) is calculated following standard formula and standard erythemal action spectrum [11]. The UVR doses are extracted from UVI using Equation (1):
U V d = i Δ t   ×   U V i n d e x 40 × 100   ,
where UVd is the daily dose and ∆t the interval time between two measurements. The UVI uncertainty has recently been estimated to be 5% [10]. This instrument is affiliated with the Network for the Detection of Atmospheric Composition Change (NDACC). A parametric and sensitivity study has been done by Lamy et al., 2018 [12] on Tropospheric Ultraviolet and Visible Model (TUV) at Saint-Denis. Ground-based and satellite data was used for clear sky UVI modelling and a relative difference of 0.5% was found with UVI from the Bentham DTMc300 (Bentham Instruments Ltd, Berkshire, UK).

2.1.2. Ground-based UVR instrument at Cape Town

The South African Weather Service (SAWS) maintains a network of six broadband radiometers (280–340 nm) in South Africa. The Cape Town station is located at the Cape Town International Airport (33.97°S, 18.6°E, 42 m ASL, Figure 1).
The instrument is a UV-biometer model 501 (SN#10414) manufactured by Solar Light Company, Inc. (Glenside, PA, United States). Erythemal UVR is recorded hourly in Minimal Erythemal Dose (MED) unit by a GaAsP diode, where 1 MED is set to 210 J.m−2 [13]. UVR doses are calculated following Equation (2):
U V d = i U V m × 210 100   ,
where UVd is the daily dose and UVm the one-hour cumulative dose in MED.
A generic table is used to correct the spectral response of the instrument, depending on total ozone and solar zenith angle [14,15]. In 2012, an inter-comparison was conducted with the SAWS Solar Light SL-501 travelling standard instrument (SN#12010). This travelling standard instrument was calibrated at the Deutscher Wetterdienst (DWD, Germany) with spectroradiometer SPECTRO 320D NO 15 (Instrument Systems GmbH, Munich, Germany) and had traceability to the International Bureau of Weights and Measures (BIPM). The Cape Town biometer accuracy was estimated to be 8% [13].

2.1.3. Field UVR Instrument

The UVR instrument used for field measurements was the Solarmeter Model 6.5 UV Index Meter (SN#03692) from Solarmeter® (Glenside, PA, USA), a trademark of Solar Light Company Inc. This handheld instrument records erythemal weighted UV irradiance from 280 to 400 nm via a silicon carbide photodiode. UVI is provided with 10% manufacturer accuracy traceable to NIST. A previous inter-comparison campaign showed that this instrument has long-term stability and good agreement with a reference instrument (~ 5% bias) [16].

2.2. Methods and Statistical Analysis

The analyses were conducted using two variables: the daily cumulative UVR doses and the UVI, as the former provides an indication of human exposure and the latter provides UVR intensity.

2.2.1. Climatology Analysis

The climatological monthly mean of the total daily UVR dose was computed. Since daily total cumulative UVR dose in SED units was used, days with incomplete data were removed from the datasets. The monthly climatology mean, standard deviation, and box diagrams were computed. Then, the UVR intensity was analyzed by investigating the UVI threshold frequency using the UVI categories of low, moderate, high, very high, and extreme over the 10-year study period. In addition, the half-month maximum was used, following the World Health Organization (WHO) UVR exposure categories [17].

2.2.2. Trend Analysis

The second objective was to estimate the trend in UVR dose over the period of one decade. This was performed in two steps. The first year (2009) and the last year (2018) of the decade were compared. Correlation, bias, and standard deviation were computed using Equations (3)–(5), respectively:
r = i = 1 n ( U V d 2009 , i U V d 2009 ¯ ) ( U V d 2018 , i U V d 2018 ¯ ) ( i = 1 n ( U V d 2009 , i U V d 2009 ¯ ) 2 ) ( i = 1 n ( U V d 2018 , i U V d 2018 ¯ ) 2 )   ,
B i a s = 1 n i = 1 n ( U V d 2018 , i U V d 2009 , i U V d 2009 , i )   ,
S t d = 1 n 1 i = 1 n ( ( U V d 2018 , i U V d 2009 , i U V d 2009 , i ) B i a s ) 2   ,
where UVd is the daily dose in SED unit, r the correlation coefficient, n the number of days.
Secondly, the evolution of UVR doses was analyzed for the decade using monthly mean values to reduce dispersion due to the influence of clouds. The trend was estimated from the difference between the monthly mean of daily doses and the climatological monthly mean of daily doses. Months without data were replaced using the monthly climatology mean. The trend analysis was performed for the whole period and by season. Based on the least-squares method, the linear trend, and a 90% confidence interval were computed.

2.2.3. Case Study

Ambient erythemal UVR measurements were made at two popular hiking sites at relatively high altitude, namely, Maïdo–Grand Bénare (GB) hike in La Reunion and Table Mountain (TM) via Platteklip Gorge hike in Cape Town. TM in Cape Town is annually visited by approximately 800,000 people. The UVI was recorded by volunteers with the handheld Solarmeter Model 6.5 every 10 min while hiking on the mountains, following the supplier measurement recommendations, and UVR doses were calculated using Equation (1) (above). This instrument and method have been used in a previous study [18]. While many environmental parameters can affect the direct and diffuse UVR here only the presence of cloud and topography [19,20] occulting the direct sun were visually recorded, even though the diffuse UV irradiance is an important part of the global irradiance [21].
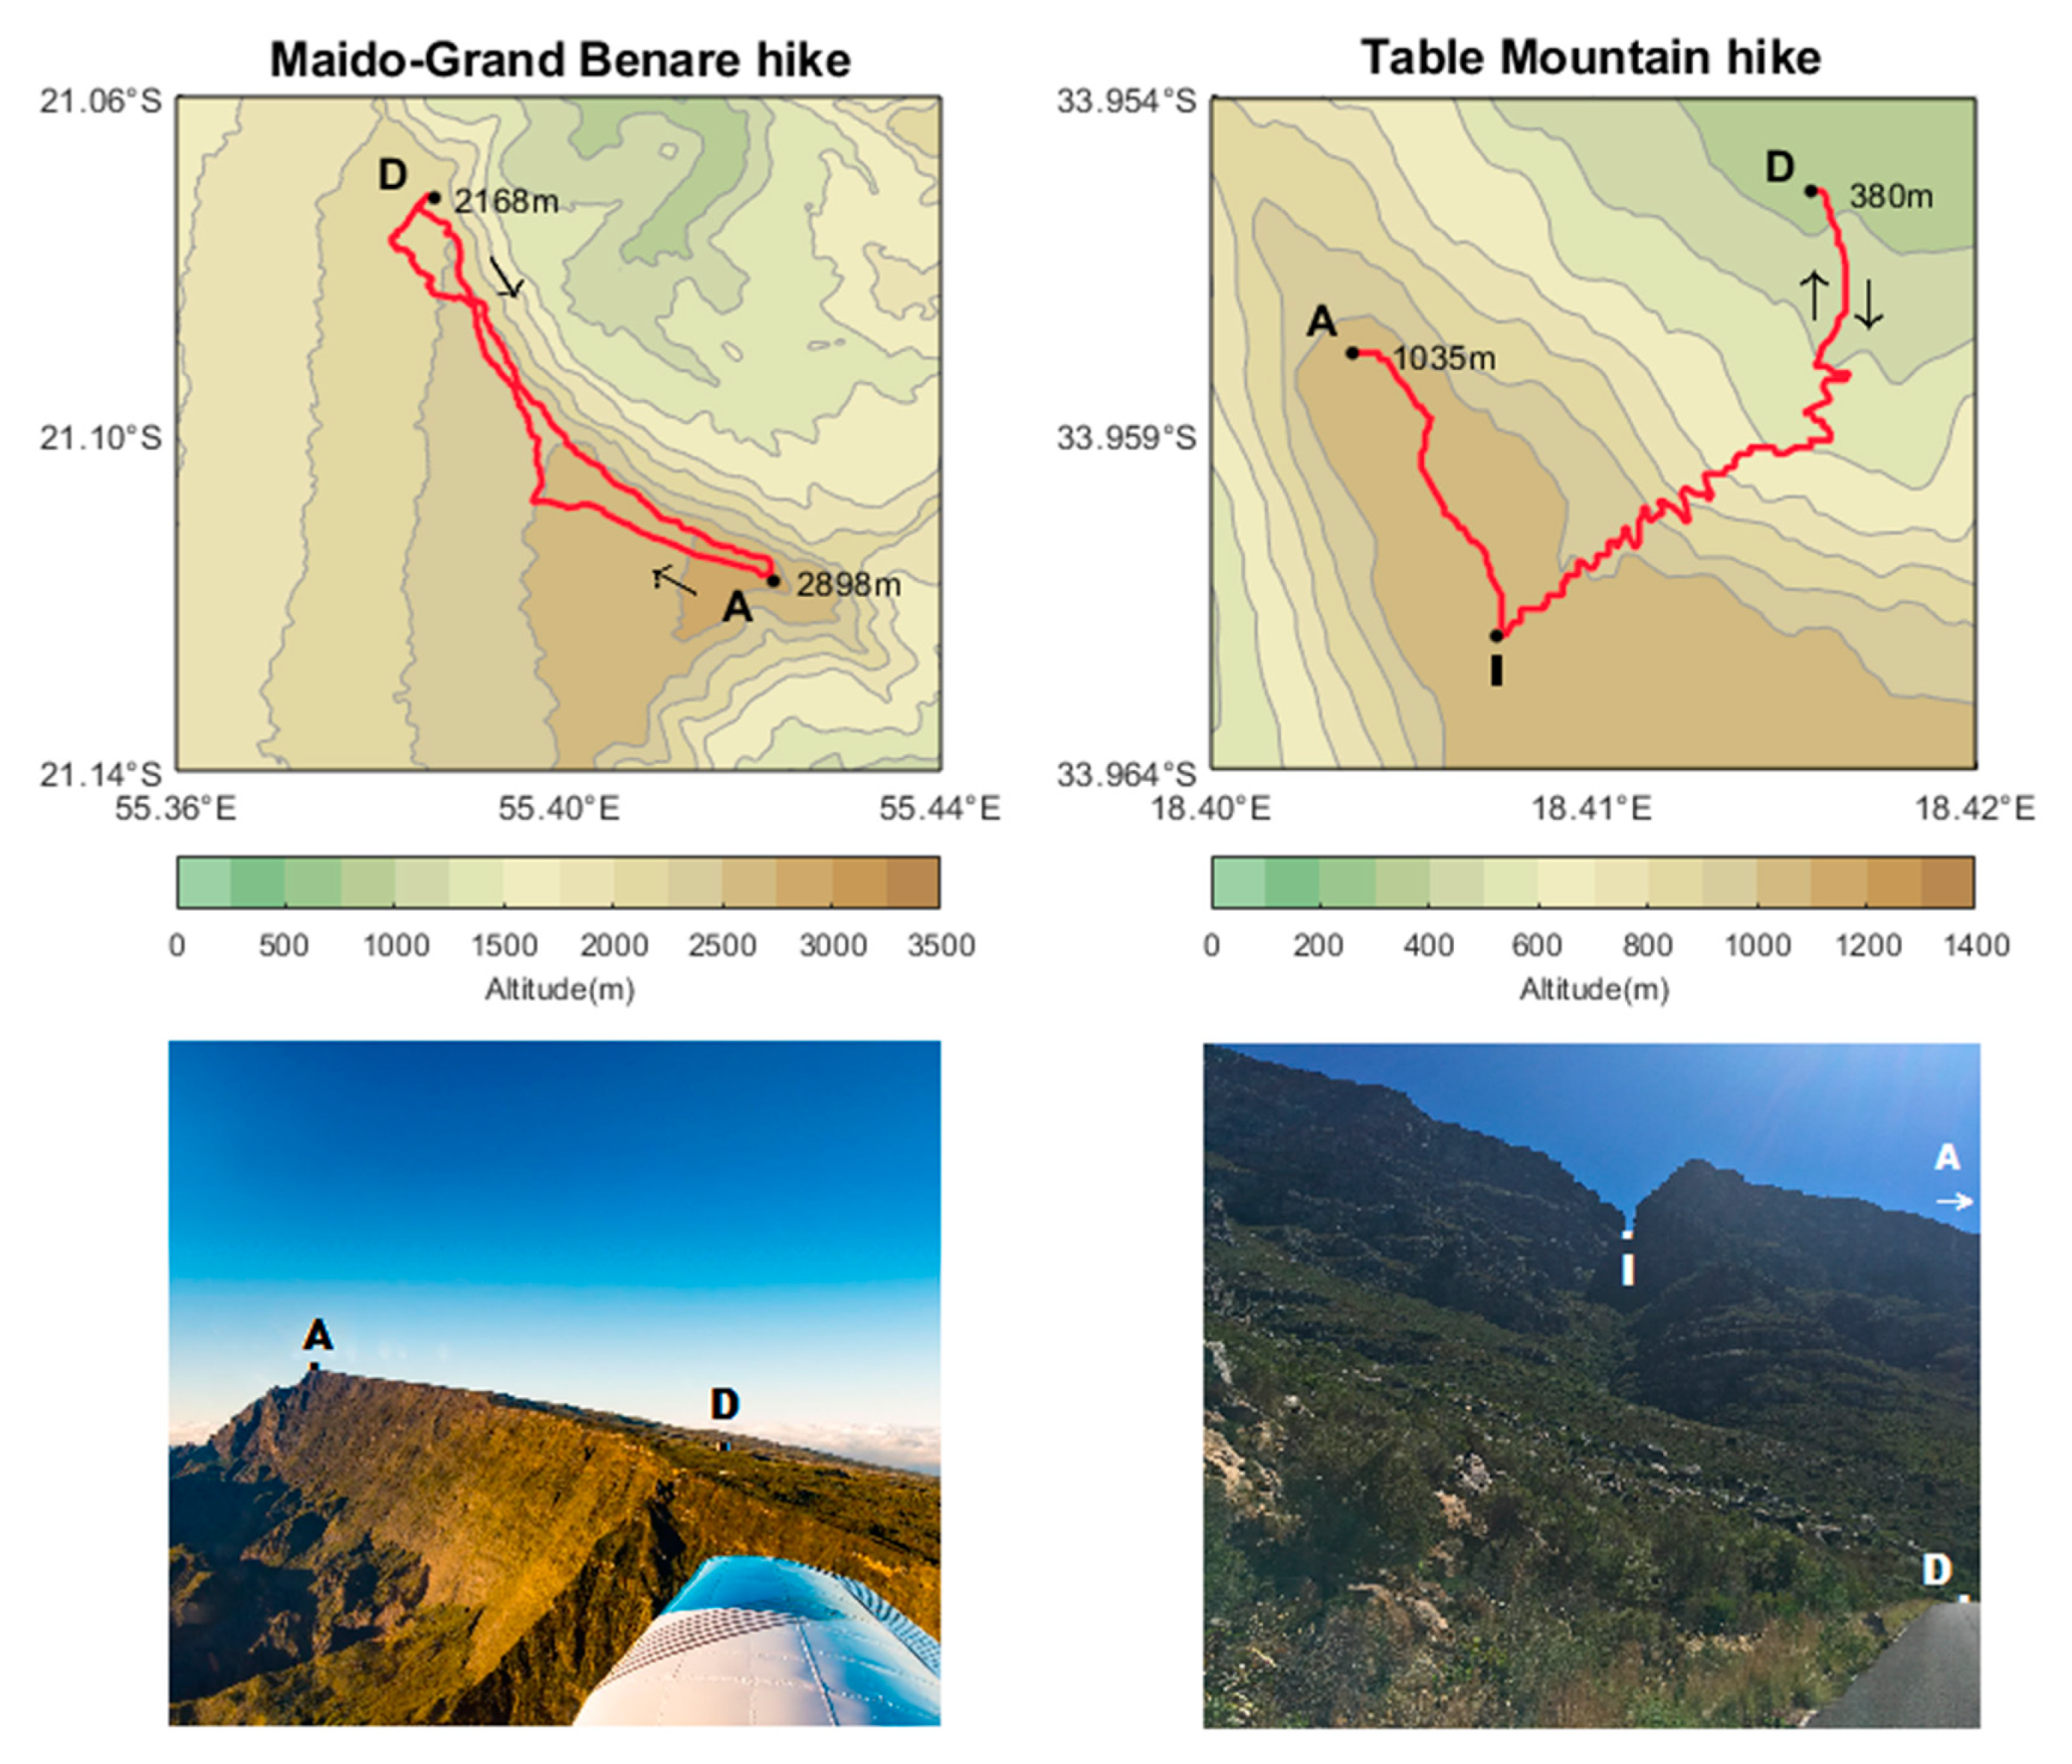
The GB hike took place on the 2 December 2018 and the TM hike took place a week later on the 10 December 2018. Topographic maps and photos of the two study sites are shown in Figure 2. The two mountain hikes environments have short (<2 m height) or very little vegetation and therefore the presence of vegetation did not interfere with the measured UVR levels. At both sites, there was the direct sun for the full duration of the hikes. The diffuse UVR was likely reduced in the Platteklip gorge on the TM hike due to the proximity of the cliff in the gorge.

3. Results and Discussion

3.1. Climatology

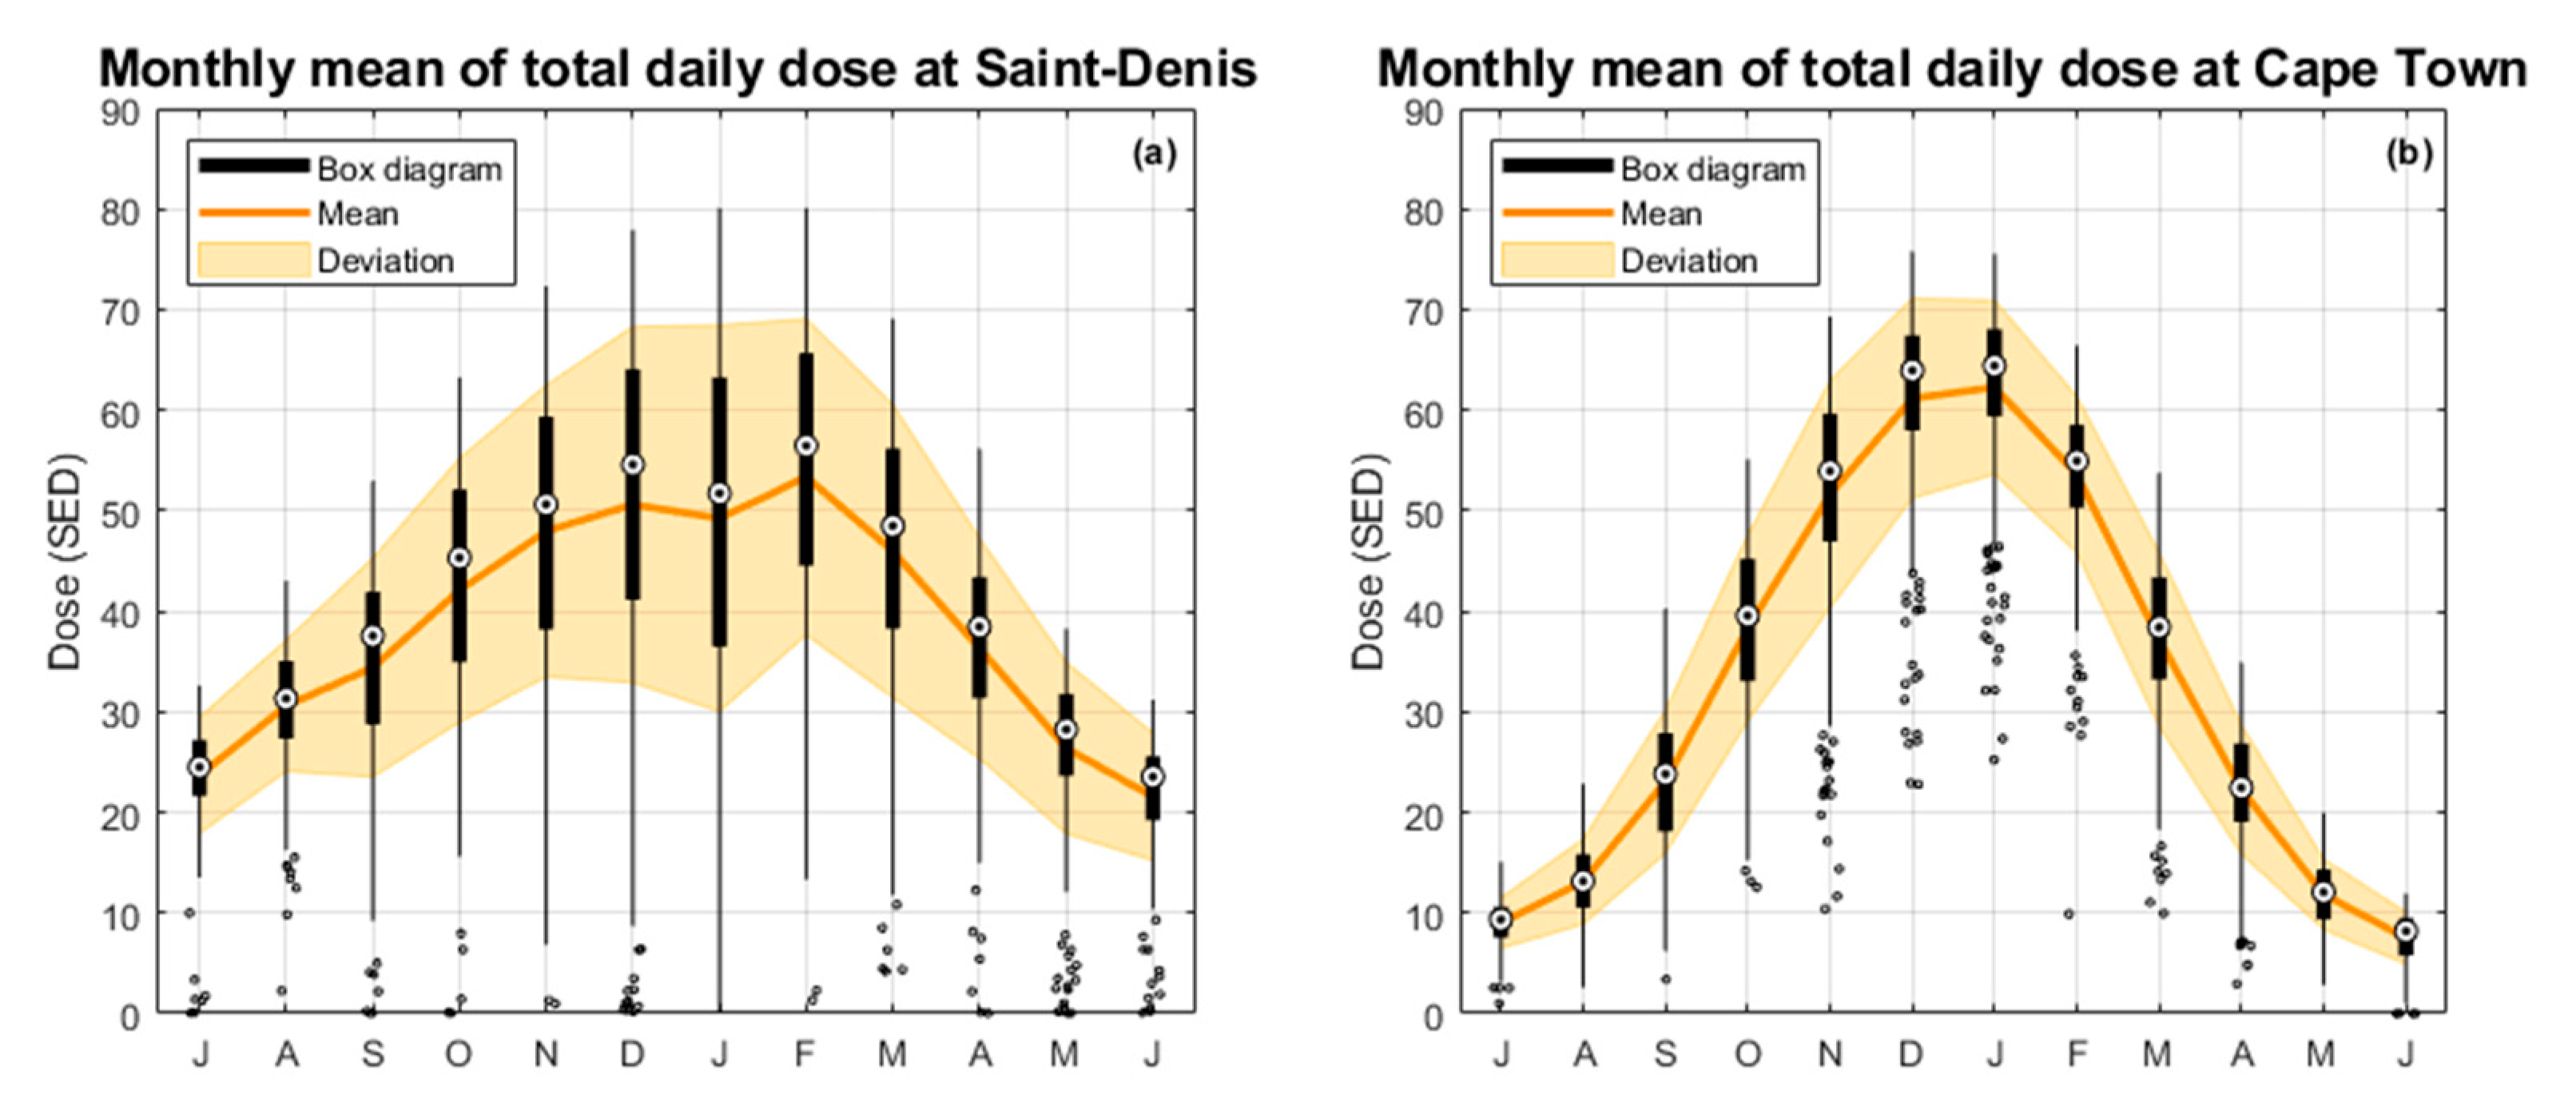
The monthly climatology of total daily erythemal UVR doses for both locations over the period of study (2009–2018) is presented in Figure 3. The black boxplots provide the UVI median, interquartile range and absolute extreme values, while the orange lines illustrate the mean values framed with ±1 standard deviation. As expected, the most important forcing that drives the annual course of UVR doses is the annual oscillation, with maximum UVR doses during austral summer for both sites but showing a greater amplitude for Cape Town. In fact, for Reunion and Cape Town the total daily dose is at a maximum during austral summer (December, January, February) and at a minimum during austral winter (June, July, August). By focusing on the monthly mean (solid orange line), the seasonal minimum is lower at Cape Town than at Saint-Denis. This could be due to latitude effect. However, the maximum seasonal dose is higher at Cape Town than at Saint-Denis (≈ 63 SED and 55 SED, respectively). This likely depends on the seasonal variability of cloud cover at each site. In fact, the Reunion site of Saint-Denis, located 13° latitude to the north of the Cape Town site, is dominated by a tropical climate which is characterized by strong cloud cover during austral summer [22,23]. This may explain the lower amplitude of surface UVR recorded in Reunion in comparison with Cape Town. Moreover, as indicated by the SED standard-deviations (superimposed with orange lines in Figure 3), Saint-Denis shows more variability (larger standard-deviations). This seems to reflect the intermittent aspect of the cloud cover over the site. Also, the monthly maximum dose, presented by the top of the vertical black thin lines reveals a higher austral summer total daily doses in Saint-Denis than in Cape Town. Outliers are present, but only for days when the total daily doses are very low due to cloud cover.
The UVR climatology at Cape Town can be compared to the Cape Point UVR station as these stations are located within a short geographical distance one from each other (~50km). However, the UVR behaviour is different due to different atmospheric conditions—Cape Town is in the airport area, near the city center, and Cape Point station is on the Cape Point peninsula which is an isolated site protruding into the ocean. A previous study on the total daily UVR dose during 2009 showed a lower dose during the austral summer at Cape Point compared to Cape Town [24].
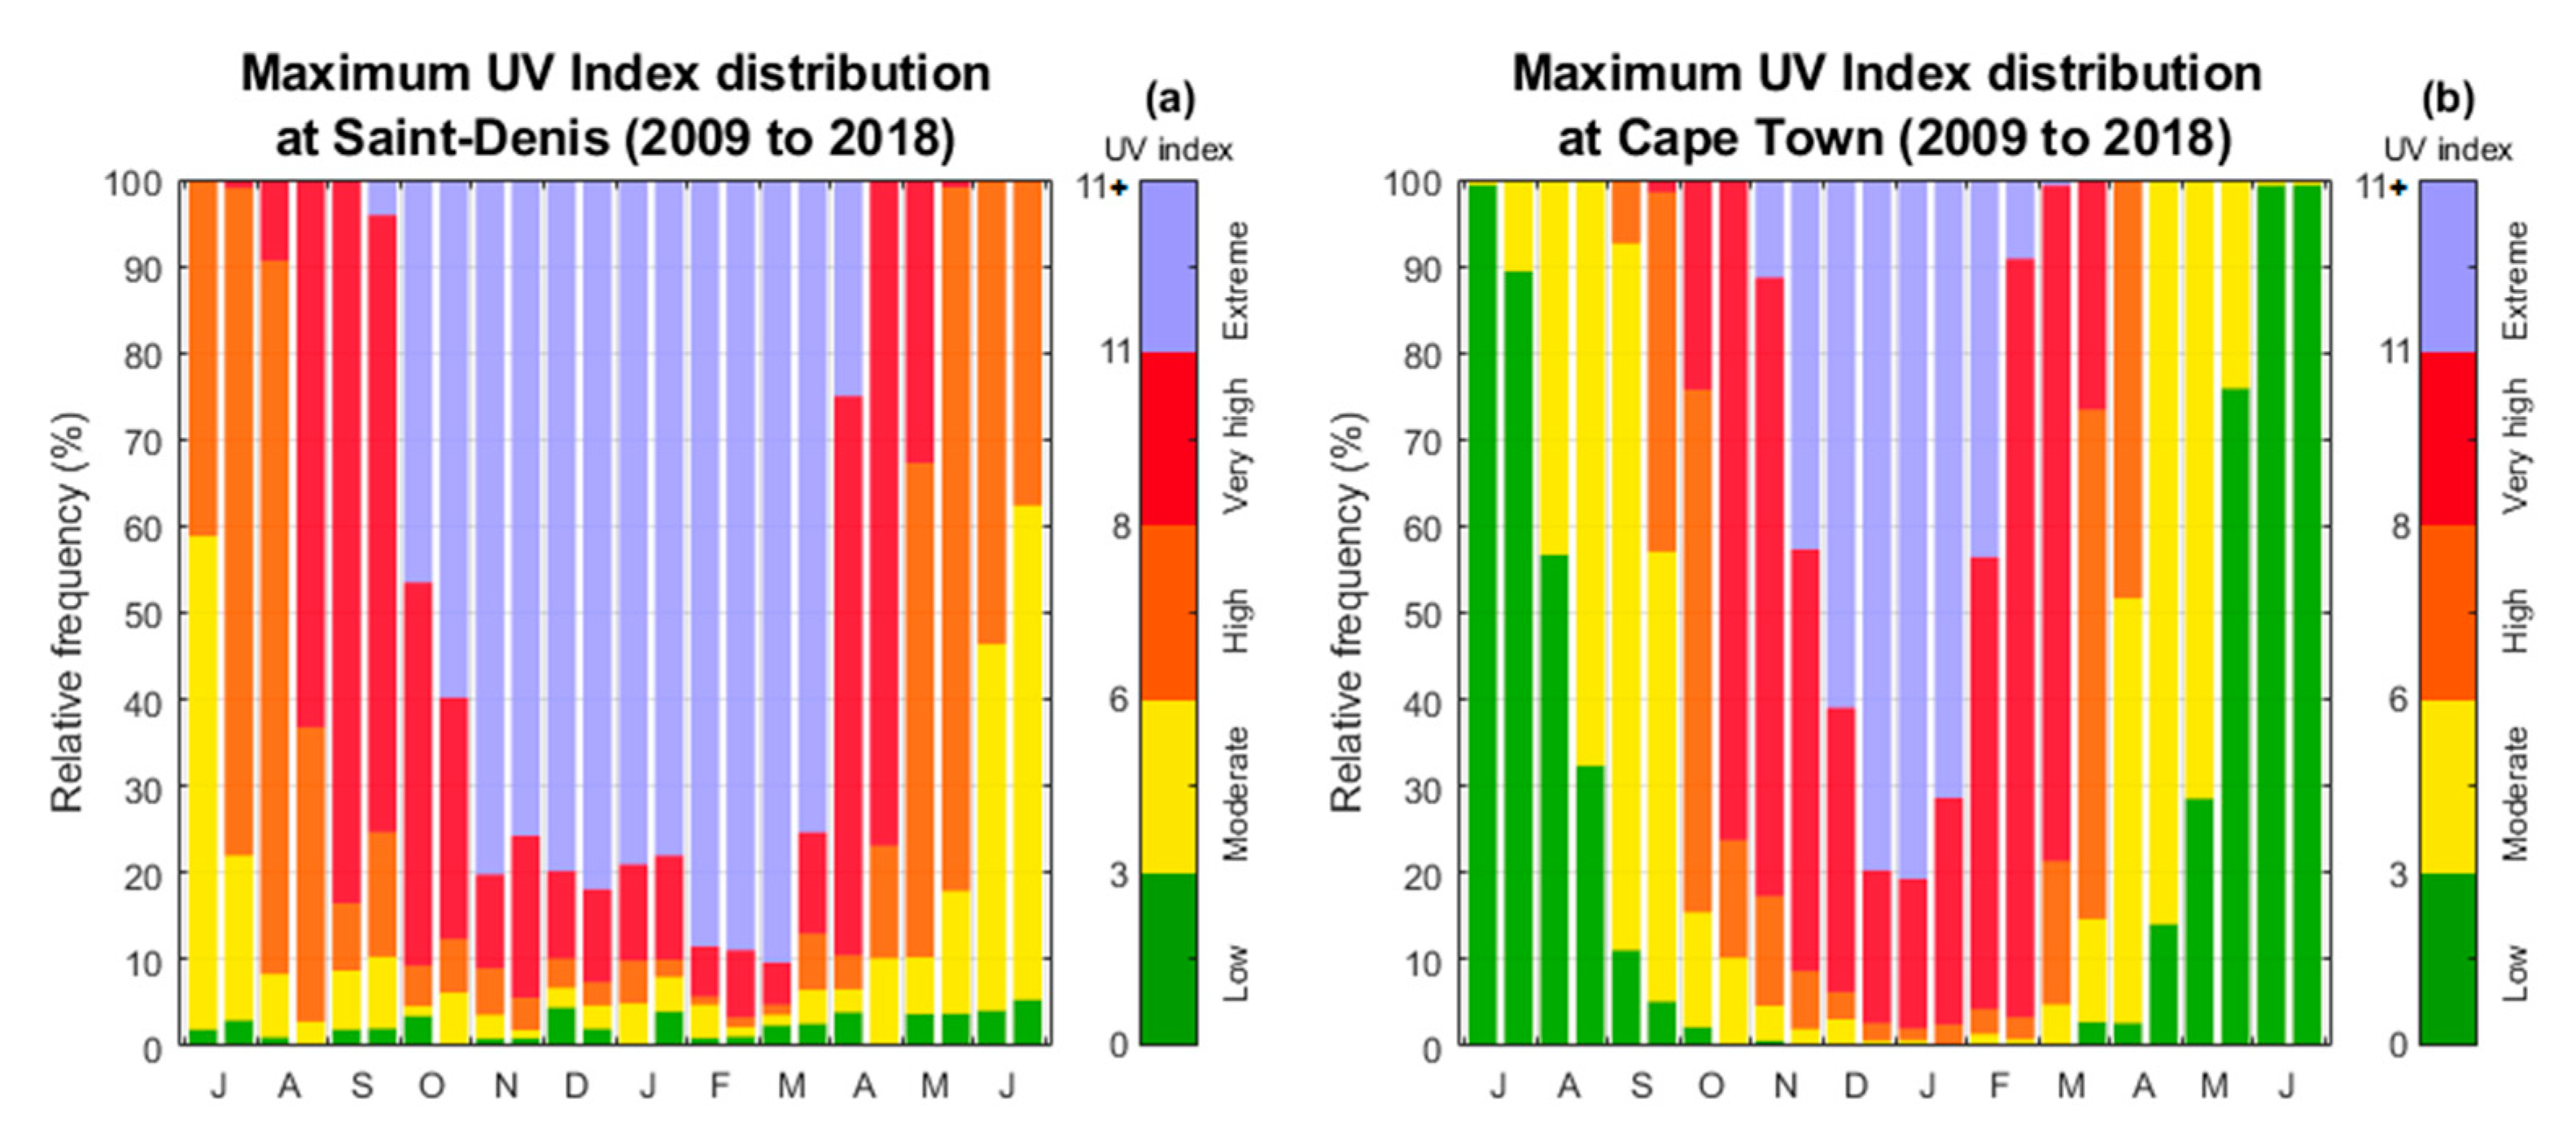
With a special focus on user-oriented presentations, the relative frequency of the WHO UVI exposure categories (low, moderate, high, very high, extreme) [25] was calculated for half-month means of UVI (Figure 4). Regarding the Reunion site (Figure 4a), the pattern of UVI distribution is dominated by “High”, “Very-High”, and “Extreme” UVI values almost all-year-round. However, we can differentiate two dominant seasons in Reunion: wet/summer (October to March) and dry/winter (April to September) seasons. During summer, UVI levels reach “Extreme” thresholds and represent more than 80% of the total number of observations, while during the winter season, UVI frequencies are distributed between “Moderate” and “High” categories. In addition, for the Reunion site, the “Low” UVI category remains infrequent regardless of the month and season, with an average frequency less than 5%. For Cape Town site (Figure 4b), the relative frequency distribution shows that “Low” and “Moderate” UVI categories dominate (about 100%) during winter, while during summer there was a preponderance of “High”, “Very-High”, and “Extreme” UVI thresholds, almost at 100% of the total number of observations. Overall, UVI is extreme during summer for both sites, but for a longer period at Saint-Denis. During winter, UVI is “Low” at Cape Town and “Moderate” to “High” at Saint-Denis. During summer, one can see that UVI shows “Extreme” values with relative frequencies from 60% up to 80% per fortnightly.
Considering the high UVI levels calculated for the two studied sites, and considering the high exposure of populations to solar UVR due to outdoor activities for leisure or professional reasons, our results raise an important question: are the UVI thresholds, as defined by WHO classification [25], relevant for tropical and subtropical regions? Historically, the UVI scale was defined in Canada and it is indeed not adapted for the tropical and sub-tropical region [26,27]. While seeking an answer to the question above was not part of this work, specific studies on solar UVR and health impacts are necessary, and the concerned populations must be informed of the associated health risks using the most meaningful metrics.

3.2. Trend Analysis

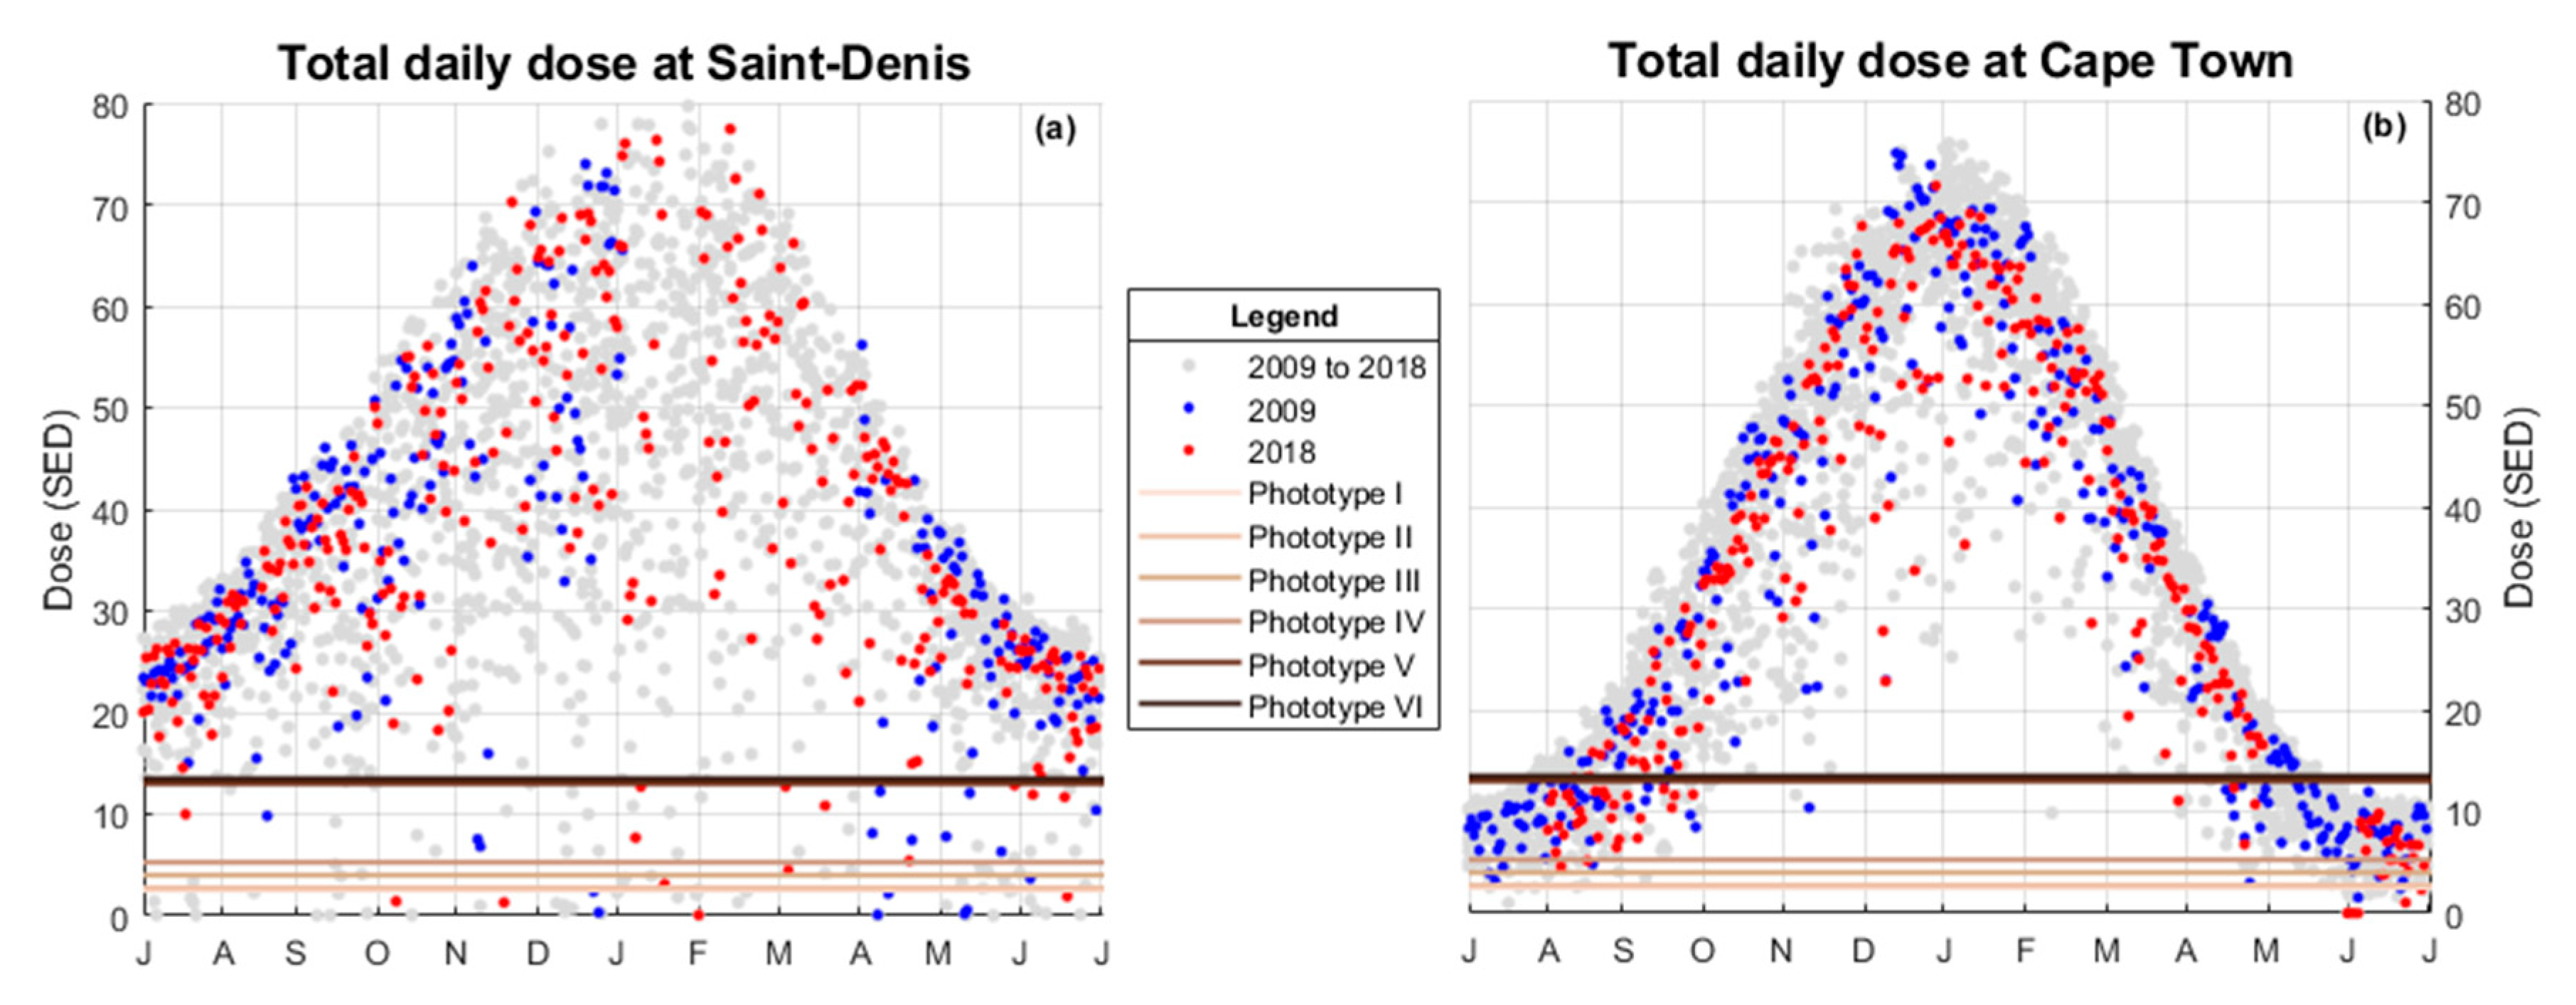
Although the observation period is rather short (i.e., 2009–2018), we used ground-based UVR data from the two study sites to investigate changes and trends over a decade. Trend analyses were performed based on daily and monthly values obtained from observations at Saint-Denis and Cape Town sites. All UVR data were integrated into daily erythemal doses (Figure 5). There is a larger dispersion of UVR doses at Saint-Denis (Figure 5a) in comparison with Cape Town distributions (Figure 5b). There was a moderate correlation at Saint-Denis, 63% (220/365 points), and a high correlation of 90% (289/365 points) at Cape Town. For both study sites, by comparing UVR doses recorded in 2009 and 2018, positive differences are evident. A bias of +15 ± 90% at Saint-Denis and +4 ± 50% at Cape Town was found by comparing 2009 and 2018. There was no significant difference in the total daily UVR doses between 2009 and 2018 for both sites. Overall, total daily doses were very high during austral summer, reaching 80 SED for both sites, and decreased as low as 30 SED and 10 SED during austral winter for Saint-Denis and Cape Town, respectively. Even though winter doses are lower than summer doses, they are still higher than the threshold for potential sunburn for almost all sun phototypes (Table 1) represented by the horizontal lines in Figure 5, except for sun phototypes V and VI at Cape Town. Similar high ambient UVR exposures were reported in a previous study [24].
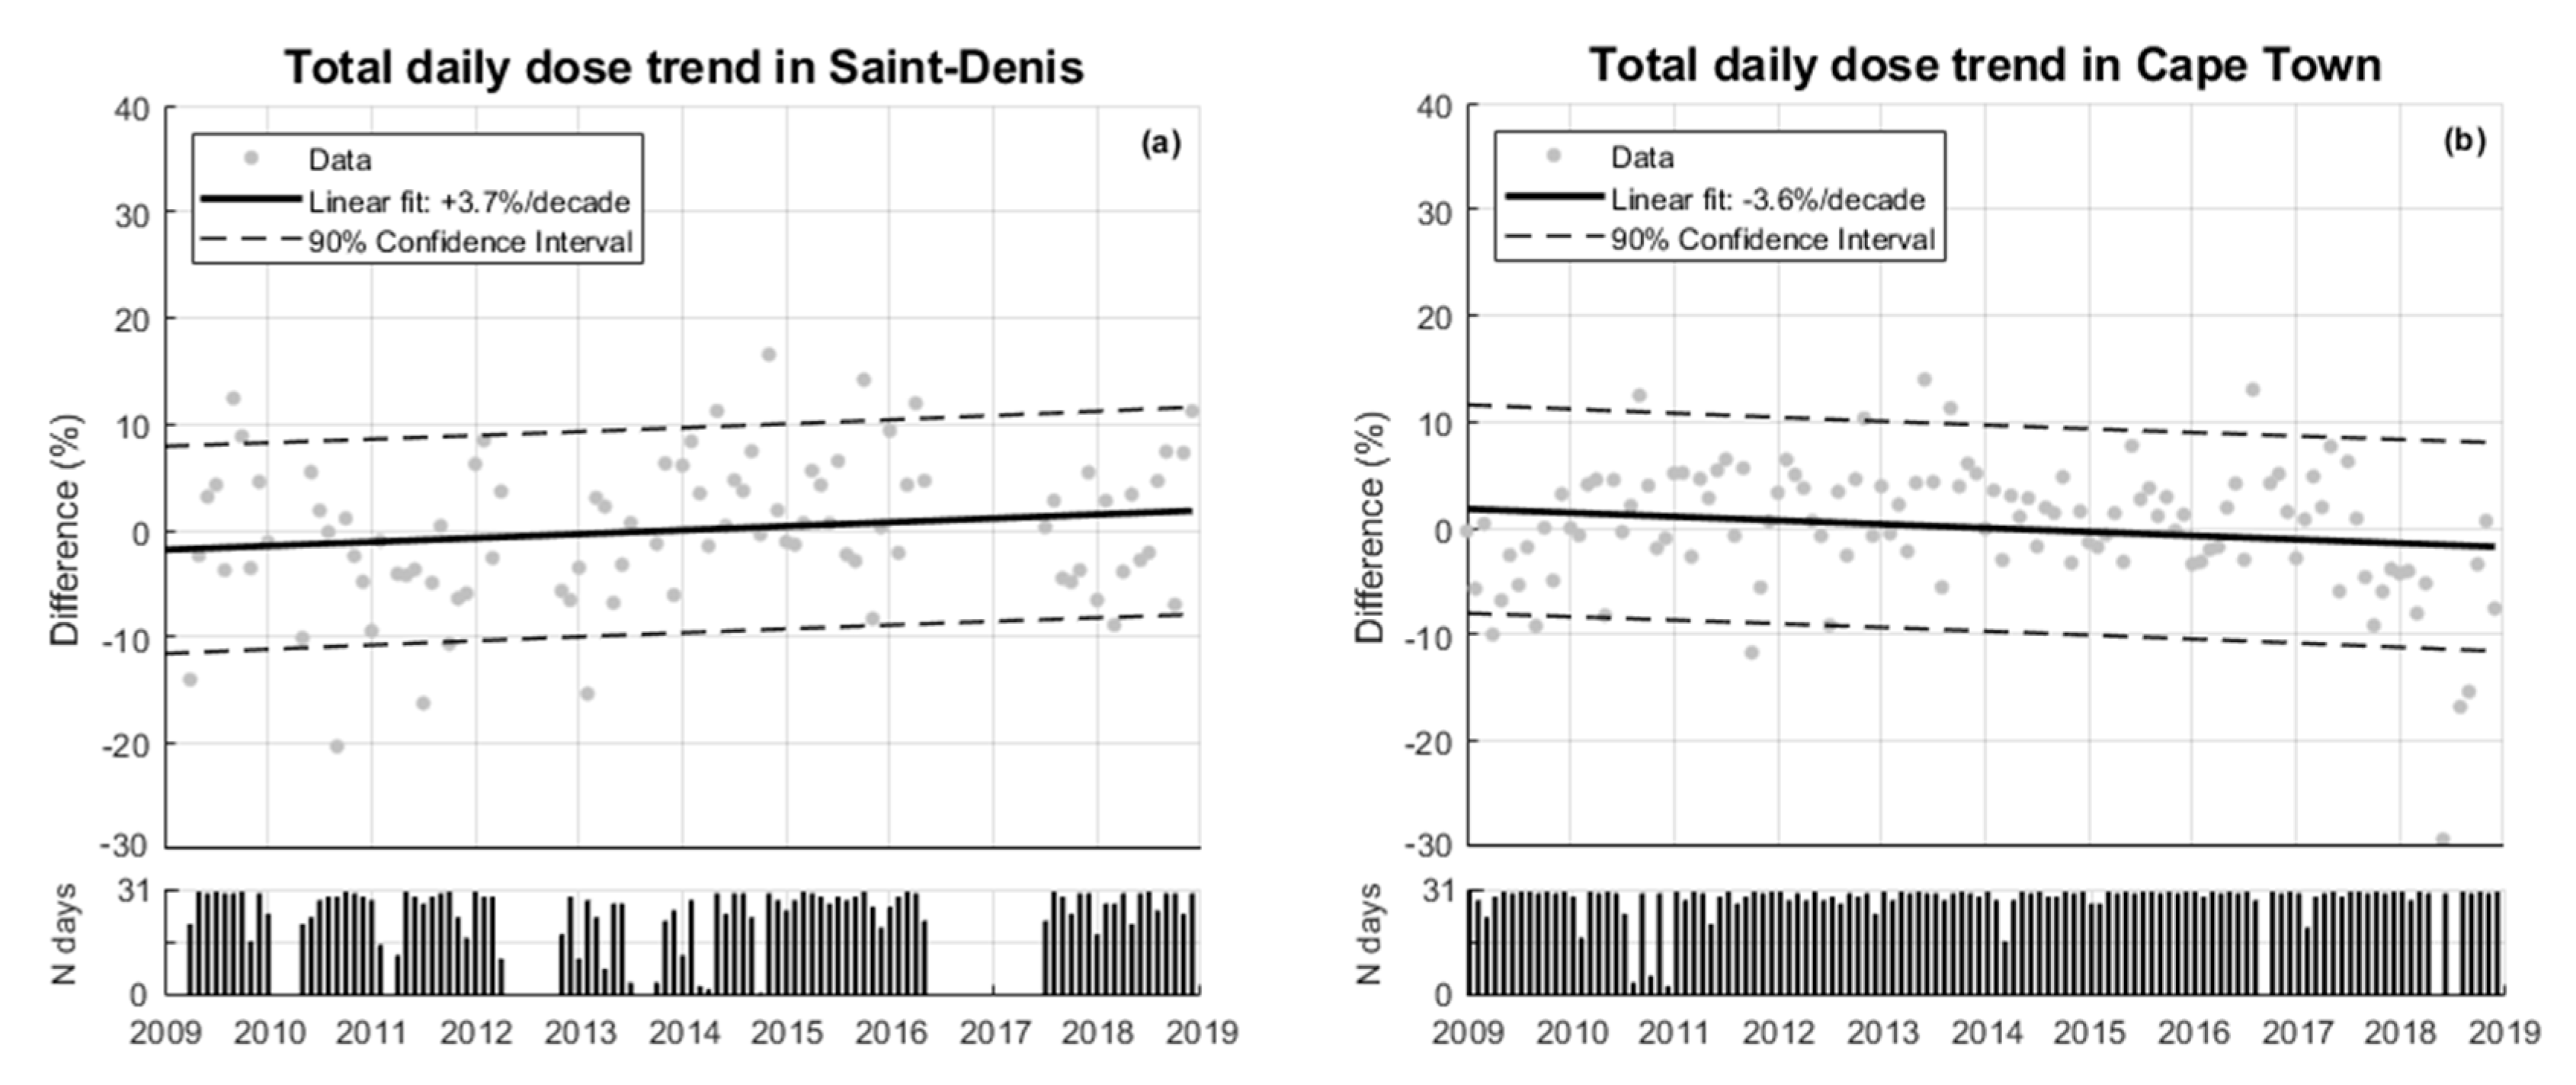
We applied the least-squares method to the monthly mean UVR values derived for the two sites to estimate linear trends over a decade (2009–2018). For both sites, UVR trends were investigated in two ways: on a global and a seasonal basis. For each site, total daily erythemal doses (in SED unit) were averaged monthly and used from January 2009 to December 2018. The trend analyses are shown in Figure 6a,b. The relevance of this analysis depends on the total number of daily observations applied. The histograms at the bottom of each plot show the number of days with available data. The two sites had a rate of observational measurement higher than 60%: 62% for Saint-Denis and 92% for Cape Town over the studied period. Figure 6 shows two opposed global daily erythemal UVR trends for the two sites: an increasing trend at Reunion Island (+3.7%) and a decreasing trend at Cape Town (−3.6%). Fountoulakis et al., 2018 found an increase in UVR of about 3% per decade over Europe, Canada and Japan, by using a 25-year ground-based database while zonal trend analysis (20 years) from Total Ozone Mapping Spectrometer (TOMS) also showed an increase of 3% per decade for latitudes similar to our study sites [28,29]. The two opposite trends may be explained by the wavelength range of the UV-biometer (280–340 nm). Since the spectral response is corrected by coefficient depending only on ozone and solar zenith angle, differences on atmospheric conditions (aerosols, clouds, …) can induce bias in dataset. Moreover, the trend estimates for Saint-Denis site should be interpreted with care since 38% of daily observations were missing, while 8% of daily observations were missing for Cape Town.
As UVR depends on seasonal variability and on changes in the forcings that modulate UVR fluxes at the surface, we broke down the trend analysis by season (DJF: December-January-February, MAM: March-April-May, JJA: June-July-August, and SON: September-October-November), as shown in Table 2. The seasonal decomposition showed two positive trends in Saint-Denis, about +5.4% for summer (DJF) and autumn (MAM), and +1.8% for winter (JJA) and spring (SON), while it shows opposite trends for Cape Town site: negative trends from spring, summer and autumn, with about −5% in average, and a slightly positive trend (+1%) during winter.
In addition to aerosols and cloud cover, stratospheric ozone is an important atmospheric parameter affecting surface UVR [30]. A recent study by Ball et al. [31] using satellite data showed a continuous decrease in ozone in the lower stratosphere from 1998. However, the reasons for the continued reduction of lower stratospheric ozone are still unclear. This decrease appeared despite positive trends in total ozone following the Montreal protocol [32]. Models are not able to reproduce this decreasing trend of ozone in the lower stratosphere. The latter may be due to dynamical changes in the Brewer-Dobson circulation, which is a large-scale circulation that takes place in the winter stratosphere and depends on planetary waves propagation in the middle atmosphere [33,34,35]. Moreover, by analyzing radiosonde and satellite datasets, Toihir et al. [32] found no significant change in stratospheric ozone in the southern tropics over the period 1998–2013. Indeed, the positive change obtained for surface solar UVR in Reunion could not be attributed to the change in stratospheric ozone. It may be associated with a possible change in the troposphere. Climate models predict that the geographic distribution of cloud changes in response to anthropogenic warming, and the expected forced changes are likely to appear in the upper troposphere [36].
The change in solar UVR levels at the surface may also be due to a change in aerosol loading [37] or in tropospheric ozone formation. The two study sites are famous tourist sites and increasing anthropogenic activities may have resulted in an increase in air pollution. A positive trend in tropospheric ozone over Cape Town has been found by using ground-based, satellite-based, and modeling datasets for past decades [38]. This change in tropospheric ozone content can explain the change in surface UVR. However, the effect of aerosols is different for our study sites. Indeed, Saint-Denis is continuously affected by the trade winds that result in a short residence time of aerosols. The retrieved UVR trends derived for Saint-Denis should be interpreted with caution mainly because 1) there is missing data in the time series and 2) it is a tropical site with extensive cloud cover, especially during the summer season, and because of the possible change in cloud cover. Reunion Island is in a tropical region where the inter-tropical convergence zone (ITCZ) has a large impact on cloud cover.
Furthermore, within the context of climate change, there is a direct link between increasing sea surface temperatures and the distribution of cloud cover in the tropics [39]. The negative trends obtained for the Cape Town site could result from a combination of many processes at different scales. Aerosols and air pollutant loading in the troposphere has a negative forcing on surface UVR [28]. Moreover, biomass burning is the most significant source of gases and particulate matter emissions to the atmosphere. Almost 90% of all biomass burning emissions are anthropogenic [40]. Pollutants associated with anthropogenic activities and biomass burning could lead to the formation of ozone and other photochemical oxidants, in addition to UVR reductions at the surface. According to the South African National Veldfire Risk Assessment, there is a marked increasing trend in fire incidence in South Africa [41]. This is consistent with a recent review on trends of tropospheric ozone by Cooper et al. [38]. They showed the seasonal variations in the tropospheric column of ozone over South Africa in accordance with the biomass burning season and found a significant positive trend in surface ozone time series at Cape Town (0.19 ± 0.05 ppbv/year) for the 1986–2011 period. Our findings support these observed changes in the troposphere composition.

3.3. Case Study

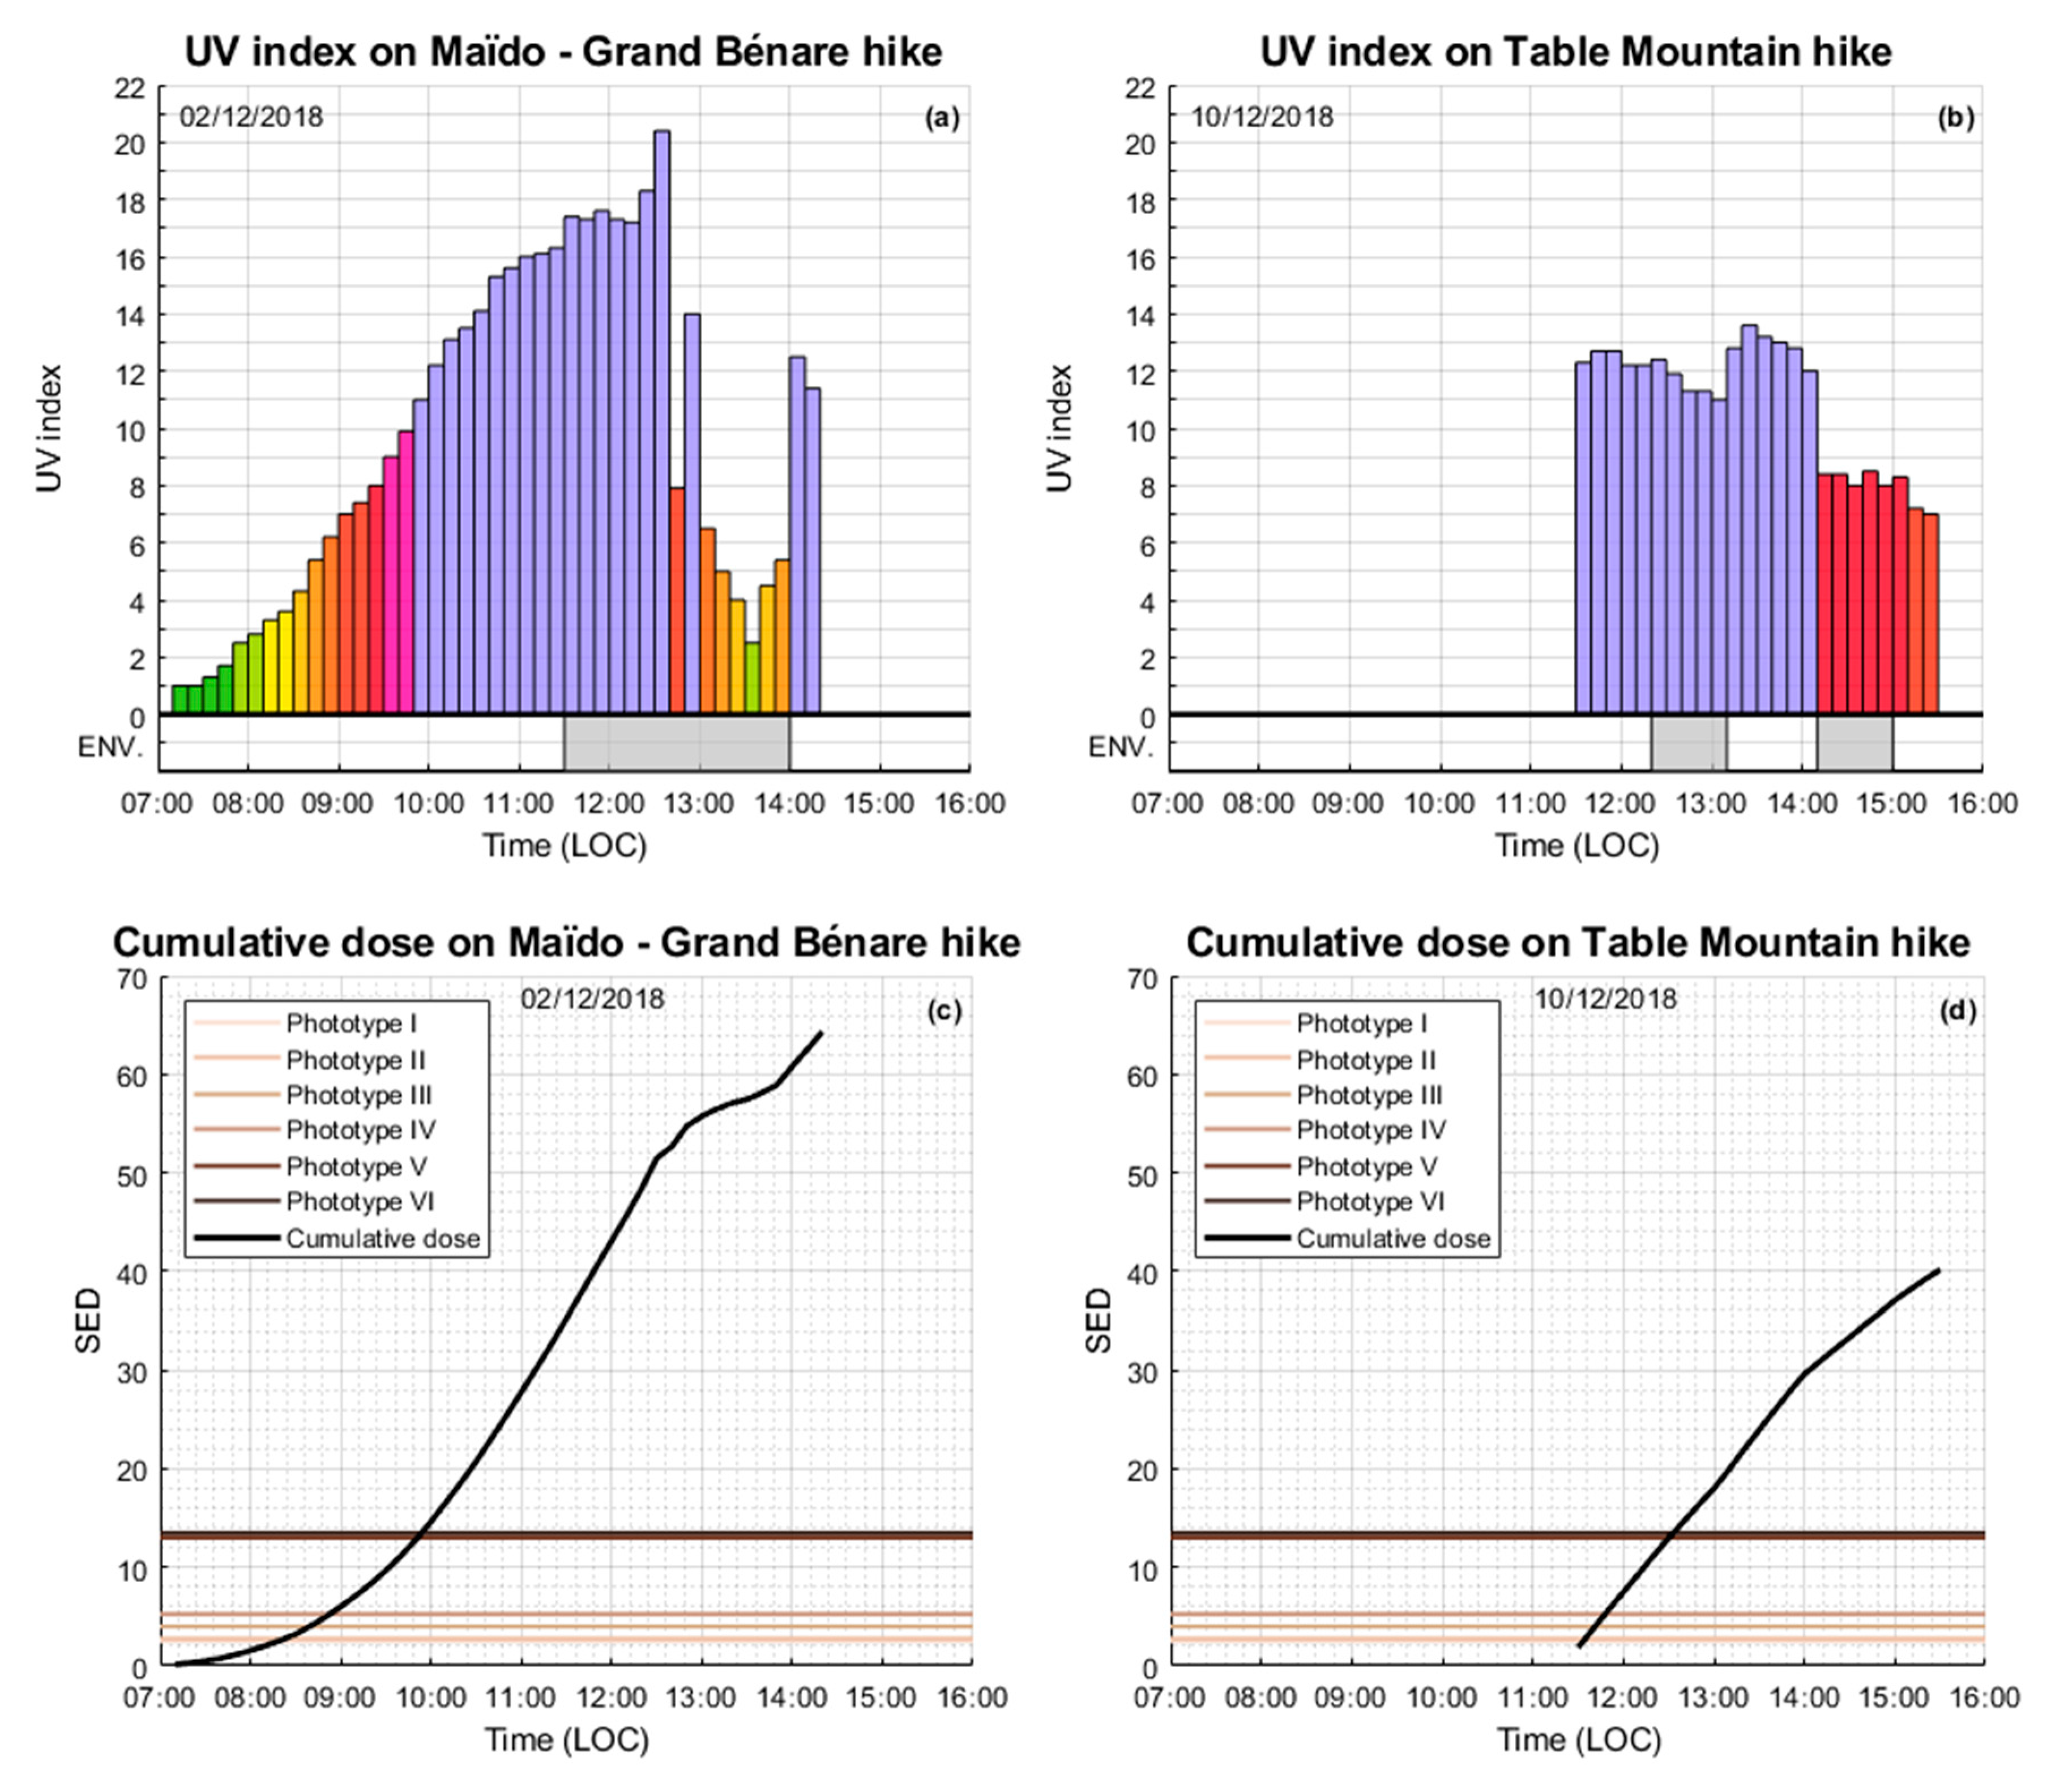
Reunion Island and Cape Town, South Africa are well-known tourist destinations due to their natural landscapes and varied terrains which are very popular for outdoor activities, almost all-year-round. Given the elevation at high altitude sites, such as Grand Bénare (GB, 2898 m) in Reunion Island and Table Mountain (TM, 1035 m) in Cape Town, intense UVR levels may be experienced by users such as tourists, trailers or hikers, as well as employees in the local national parks. In order to complete our comparative study between Reunion and Cape Town sites, we carried out two field experiments under quasi-similar conditions: measurements of UVI during ascent hikes of GB and TM with the same instrument and the same operational protocol (same time sampling and same sensor directional pointing, etc.). The recorded UVI and cumulative UVR doses for GB and TB hikes are shown in Figure 7. The GB hike started at 7:00 local time, while the TM hike started at 11:00. This is because the GB hike is more challenging to complete with steep ascents and lasts longer than the TM one. Moreover, we recorded some environmental parameters such as shading due to cloud cover or due to the topography (e.g., gorge passageway) during the two hikes. They are shown with grey boxes at the bottom of Figure 7a,b.
For the GB hike (Figure 7a) some clouds (cumulus humilis) were recorded from 11:30 to 14:00, local time. During this time interval, as a result of the increase in cloud scattering, UVI increased to a high maximum value of 20.4 then progressively decreased and dropped as low as 2.5 due to the cloud spread and attenuation.
During the TM hike (Figure 7b) two environmental events occurred: the first one was the crossing upward of the Platteklip gorge (from 12:30 to 13:00). The gorge is a steeply sloping and shaded area. The second event was the crossing downward (from 14:10 to 14:40) of the gorge. One can observe from Figure 7b a decrease in UVI during the crossing of the gorge. The effect of the decrease in diffuse radiation by topography is noticeable where the UVI dropped by 4 units and went from 13 to about 8.
Figure 7c,d show the cumulative doses were extremely high during both GB and TM hikes, with total exposure doses of 64 SED and 40 SED, respectively. This corresponds to 3 to 25 times the minimal dose required to elicit a sunburn response for phototype I to phototype VI (see Table 1).
The likely difference in cumulative exposure doses between the two sites was in part due to the differences in the hike duration as well as the maximum altitude (i.e., 7h10 duration and 2898 m elevation for GB hike, and 4h and 1035m elevation for TM hike).

4. Conclusions

The aim of this study was to assess the level of UVR exposure doses in Saint-Denis, Reunion Island, France and Cape Town, South Africa. This evaluation was performed by analyzing 10 years of data (2009–2018) and by the assessment of UVR at two popular hiking sites located at high altitude. The trend analysis showed different levels of solar UVR at the two sites: an increase of 3.7% of total daily erythemal UVR dose in Saint-Denis and a decrease of 3.6% in Cape Town over the ten-year period. Environmental factors such as ozone, aerosols and cloud cover are sensitive to climate change and may be responsible for changes in UVR levels. Moreover, the evolution of UVR is difficult to evaluate in sites such as Reunion Island and Cape Town which are subject to many different forcings and atmospheric changes. The trends obtained must be interpreted carefully due to the relatively short time period (10 years) and the missing data.
The climatological analysis highlighted extreme UVR levels occur during the austral summer in Saint-Denis and Cape Town. Erythemal UVR levels are also high at Saint-Denis during the winter season at about 30 SED. These high erythemal UVR levels may lead to sunburn in people who spend extended periods of time outdoors without adequate sun protection. Similarly, in situ measurements showed potentially extreme UVR exposure doses for hikers walking the GB and TM hikes. These are two popular sites where UVR levels are very high due to latitude, altitude and environmental conditions. Acute exposure of this nature would likely result in sunburn and skin damage [42] while regular hiking at these sites would contribute to chronic exposure which is associated with harmful health effects such as skin cancer [43]. Hiking is therefore deemed a potentially high sun exposure activity and sun protection should be used. The results of this study highlight the importance of crafting appropriate public awareness campaigns on the UVR exposure-risks from excess sun exposure especially during outdoor recreational activities.

Author Contributions

C.B. oversaw spectral measurements in Saint-Denis. J.-M.C. and M.B. performed data processing. All authors analyzed the data. J.-M.C., H.B., J.D.d.P., and C.Y.W. wrote the paper.

Funding

This research was funded jointly by the CNRS (Centre National de la Recherche Scientifique) and the NRF (National Research Foundation) in the framework of the LIA ARSAIO and by the South Africa / France PROTEA Program (project No 42470VA) and the APC was funded by LACy (Laboratoire de l’Atmosphère et des Cyclones).

Acknowledgments

Authors acknowledge the French South-African PROTEA programme and the CNRS-NRF LIA ARSAIO (Atmospheric Research in Southern Africa and Indian Ocean), for supporting research activities, the Conseil Régional de la Réunion, for the PhD scholarship of Jean-Maurice Cadet, the National Research Foundation and South African Medical Research Council for providing support to Caradee Y. Wright, and the South African Weather Service (SAWS) for providing UVR data.

Conflicts of Interest

The authors declare no conflict of interest.

References

  1. Kerr, J.; Fioletov, V.; Fioletov, V. Surface ultraviolet radiation. Atmos. Ocean 2008, 46, 159–184. [Google Scholar] [CrossRef] [Green Version]
  2. Fitzpatrick, T.B. Skin Phototypes. In Proceedings of the 20th World Congress of Dermatology, Paris, France, 1–5 July 2002. [Google Scholar]
  3. Gallagher, R.P.; Lee, T.K. Adverse effects of ultraviolet radiation: A brief review. Biophys. Mol. Biol. 2016, 92, 119–131. [Google Scholar] [CrossRef]
  4. Tucker, M.A.; Shields, J.A.; Hartge, P.; Augsburger, J.; Hoover, R.N.; Fraumeni, J.F. Sunlight Exposure as Risk Factor for Intraocular Malignant Melanoma. N. Engl. J. Med. 1985, 313, 789–792. [Google Scholar] [CrossRef]
  5. Armstrong, B.K.; Kricker, A. How much melanoma is caused by sun exposure? Melanoma Res. 1993, 3, 395–402. [Google Scholar] [CrossRef] [PubMed]
  6. National Institute for Communicable Diseases. Available online: http://www.nicd.ac.za/centres/national-cancer-registry/ (accessed on 5 July 2019).
  7. Norval, M.; Kellett, P.; Wright, C.Y. The incidence and body site of skin cancers in the population groups of South Africa. Photodermatol. Photoimmunol. Photomed. 2013, 30, 262–265. [Google Scholar] [CrossRef] [PubMed]
  8. Warocquier, J.; Miquel, J.; Chirpaz, E.; Beylot-Barry, M.; Sultan-Bichat, N. Groupe de travail des dermatologues et anatomopathologistes de l’île de la Réunion; Données épidémiologiques des mélanomes cutanés à la Réunion en 2015. Ann. Dermatol. Vénéréologie 2016, 143, S313–S314. [Google Scholar] [CrossRef]
  9. Albert, M.R.; Ostheimer, K.G. The evolution of current medical and popular attitudes toward ultraviolet light exposure: Part 3. J. Am. Acad. Dermatol. 2003, 49, 1096–1106. [Google Scholar] [CrossRef]
  10. Brogniez, C.; Auriol, F.; DeRoo, C.; Arola, A.; Kujanpää, J.; Sauvage, B.; Kalakoski, N.; Pitkänen, M.R.A.; Catalfamo, M.; Metzger, J.-M.; et al. Validation of satellite-based noontime UVI with NDACC ground-based instruments: Influence of topography, environment and satellite overpass time. Atmos. Chem. Phys. Discuss. 2016, 16, 15049–15074. [Google Scholar] [CrossRef]
  11. Joint, I.S.O. CIE Standard 17166: 1999/CIE S007-1998 Erythema Reference Action Spectrum and Standard Erythema Dose; ISO: Vienna, Austria, 1999. [Google Scholar]
  12. Lamy, K.; Portafaix, T.; Brogniez, C.; Godin-Beekmann, S.; Bencherif, H.; Morel, B.; Pazmino, A.; Metzger, J.M.; Auriol, F.; DeRoo, C.; et al. Ultraviolet radiation modelling from ground-based and satellite measurements on Reunion Island, southern tropics. Atmos. Chem. Phys. Discuss. 2018, 18, 227–246. [Google Scholar] [CrossRef] [Green Version]
  13. Cadet, J.-M.; Bencherif, H.; Portafaix, T.; Lamy, K.; Ncongwane, K.; Coetzee, G.J.R.; Wright, C.Y. Comparison of Ground-Based and Satellite-Derived Solar UV Index Levels at Six South African Sites. Int. J. Environ. Res. Public Health 2017, 14, 1384. [Google Scholar] [CrossRef]
  14. Seckmeyer, G.; Bernhard, A.; Blumthaler, M.; Booth, C.; Lantz, K.; Webb, A. Instruments to Measure Solar Ultraviolet Radiation. Part 2: Broadband Instruments Measuring Erythemally Weighted Solar Irradiance; World Meteorological Organization (WMO): Geneva, Switzerland, 2005. [Google Scholar]
  15. Blumthaler, M. UV Monitoring for Public Health. Int. J. Environ. Res. Public Health 2018, 15, 1723. [Google Scholar] [CrossRef] [PubMed]
  16. de Paula Corrêa, M.; Godin-Beekmann, S.; Haeffelin, M.; Brogniez, C.; Verschaeve, F.; Saiag, P.; Pazmiño, A.; Mahé, E. Comparison between UV index measurements performed by research-grade. Photochem. Photobiol. Sci. 2010, 9, 459–463. [Google Scholar] [CrossRef]
  17. World Health Organization; International Commission on Non-Ionizing Radiation Protection. Global Solar UV Index: A practical Guide; World Health Organization: Geneva, Switzerland, 2002. [Google Scholar]
  18. Mahé, E.; de Paula Corrêa, M.; Godin-Beekmann, S.; Haeffelin, M.; Jégou, F.; Saiag, P.; Beauchet, A. Evaluation of tourists’ UV exposure in Paris. J. Eur. Acad. Dermatol. Venereol. 2013, 27, e294–e304. [Google Scholar] [CrossRef]
  19. Cede, A. Effects of clouds on erythemal and total irradiance as derived from data of the Argentine Network. Geophys. Res. Lett. 2002, 29. [Google Scholar] [CrossRef]
  20. Blumthaler, M.; Ambach, R.; Ellinger, R. Increase in solar UV radiation with altitude. Photochem. Photobiol. 1996, 39, 130–134. [Google Scholar] [CrossRef]
  21. Utrillas, M.P.; Marín, M.J.; Esteve, A.R.; Tena, F.; Cañada, J.; Estelles, V.; Martínez-Lozano, J.A.; Martínez-Lozano, J.A. Diffuse UV erythemal radiation experimental values. J. Geophys. Res. Space Phys. 2007, 112, 112. [Google Scholar] [CrossRef]
  22. Jumeaux, G.; Quetelard, H.; Roy, G. Atlas climatique de La Réunion; Météo-France Direction interrégionale de la Réunion: Sainte-Clotilde, La Réunion, 2002; ISBN 978-2-11-128623-8. [Google Scholar]
  23. Cadet, B.; Goldfarb, L.; Faduilhe, D.; Baldy, S.; Réchou, A.; Giraud, V.; Keckhut, P. A sub-tropical cirrus clouds climatology from Reunion Island (21° S, 55° E) lidar data set. Geophys. Res. Lett. 2003, 30, 1130. [Google Scholar] [CrossRef]
  24. Wright, C.Y.; Brogniez, C.; Ncongwane, K.P.; Sivakumar, V.; Coetzee, G.; Auriol, F.; DeRoo, C.; Sauvage, B.; Metzger, J.-M.; Metzger, J. Sunburn Risk Among Children and Outdoor Workers in South Africa and Reunion Island Coastal Sites. Photochem. Photobiol. 2013, 89, 1226–1233. [Google Scholar] [CrossRef]
  25. WMO (World Meteorological Organization) Assessment for Decision-Makers: Scientific Assessment of Ozone Depletion: 2014. In Global Ozone Research and Monitoring Project—Report No. 56; World Meteorological Organization: Geneva, Switzerland, 2014; p. 88. ISBN 978-9966-076-00-7.
  26. Fioletov, V.; Kerr, J.B.; Fergusson, A. The UV Index: Definition, Distribution and Factors Affecting It. Can. J. Public Health 2010, 101, I5–I9. [Google Scholar] [CrossRef]
  27. Zaratti, F.; Piacentini, R.D.; Guillén, H.A.; Cabrera, S.H.; Ben Liley, J.; McKenzie, R.L. Proposal for a modification of the UVI risk scale. Photochem. Photobiol. Sci. 2014, 13, 980–985. [Google Scholar] [CrossRef]
  28. Tarasick, D.W.; Fioletov, V.E.; Wardle, D.I.; Kerr, J.B.; McArthur, L.J.B.; McLiden, C.A. Climatology and trends of surface UV radiation: Survey article. Atmos. Ocean 2010, 42, 121–138. [Google Scholar] [CrossRef]
  29. Fountoulakis, I.; Zerefos, C.S.; Bais, A.F.; Kapsomenakis, J.; Koukouli, M.-E.; Ohkawara, N.; Fioletov, V.; De Backer, H.; Lakkala, K.; Karppinen, T.; et al. Twenty-five years of spectral UV-B measurements over Canada, Europe and Japan: Trends and effects from changes in ozone, aerosols, clouds, and surface reflectivity. Comptes Rendus Geosci. 2018, 350, 393–402. [Google Scholar] [CrossRef]
  30. Bais, A.F.; Lucas, R.M.; Bornman, J.F.; Williamson, C.E.; Sulzberger, B.; Austin, A.T.; Wilson, S.R.; Andrady, A.L.; Bernhard, G.; McKenzie, R.L.; et al. Environmental effects of ozone depletion, UV radiation and interactions with climate change: UNEP Environmental Effects Assessment Panel, update 2017. Photochem. Photobiol. Sci. 2018, 17, 127–179. [Google Scholar] [CrossRef] [PubMed]
  31. Ball, W.T.; Staehelin, J.; Haigh, J.D.; Peter, T.; Tummon, F.; Stübi, R.; Stenke, A.; Anderson, J.; Bourassa, A.; Davis, S.M.; et al. Evidence for a continuous decline in lower stratospheric ozone offsetting ozone layer recovery. Atmos. Chem. Phys. 2016, 18, 1379–1394. [Google Scholar] [CrossRef]
  32. Toihir, A.M.; Portafaix, T.; Sivakumar, V.; Bencherif, H.; Pazmino, A.; Bègue, N. Variability and trend in ozone over the southern tropics and subtropics. Ann. Geophys. 2018, 36, 381–404. [Google Scholar] [CrossRef] [Green Version]
  33. Leovy, C.; Sun, C.-R.; Hitchman, M.; Remsberg, E.; Russell, J.; Gordley, L.; Gille, J.; Lyjak, L. Transport of Ozone in the Middle Stratosphere: Evidence for Planetary Wave Breaking. J. Atmos. Sci. 1985, 42, 230–244. [Google Scholar] [CrossRef]
  34. Bencherif, H.; Portafaix, T.; Baray, J.-L.; Morel, B.; Baldy, S.; Leveau, J.; Hauchecorne, A.; Keckhut, P.; Moorgawa, A.; Michaelis, M.M.; et al. LIDAR observations of lower stratospheric aerosols over South Africa linked to large scale transport across the southern subtropical barrier. J. Atmos. Sol. Terr. Phys. 2001, 65, 707–715. [Google Scholar] [CrossRef]
  35. Bencherif, H.; Amraoui, L.E.; Kirgis, G.; Leclair de Bellevue, J.; Hauchecorne, A.; Mzé, N.; Portafaix, T.; Pazmiño, A.; Goutail, F. Analysis of a rapid increase of stratospheric ozone during late austral summer 2008 over Kerguelen (49.4° S, 70.3° E). Atmos. Chem. Phys. 2001, 11, 363–373. [Google Scholar] [CrossRef]
  36. Chepfer, H.; Noel, V.; Winker, D.; Chiriaco, M. Where and when will we observe cloud changes due to climate warming? Geophys. Res. Lett. 2014, 41, 8387–8395. [Google Scholar] [CrossRef]
  37. Fountoulakis, I.; Bais, A.F.; Fragkos, K.; Meleti, C.; Tourpali, K.; Zempila, M.M. Short and long-term variability of spectral solar UV irradiance at Thessaloniki, Greece: Effects of changes in aerosols, total ozone and clouds. Atmos. Chem. Phys. Discuss. 2016, 16, 2493–2505. [Google Scholar] [CrossRef]
  38. Cooper, O.R.; Parrish, D.D.; Ziemke, J.; Balashov, N.V.; Cupeiro, M.; Galbally, I.E.; Gilge, S.; Horowitz, L.; Jensen, N.R.; Lamarque, J.-F.; et al. Global distribution and trends of tropospheric ozone: An observation-based review. Elem. Sci. Anth. 2014, 2, 29. [Google Scholar] [CrossRef]
  39. Cesana, G.; Del Genio, A.D.; Ackerman, A.S.; Kelley, M.; Elsaesser, G.; Fridlind, A.M.; Cheng, Y.; Yao, M.-S. Evaluating models’ response of tropical low clouds to SST forcings using CALIPSO observations. Atmos. Chem. Phys. Discuss. 2019, 19, 2813–2832. [Google Scholar] [CrossRef]
  40. Koppmann, R.; Von Czapiewski, K.; Reid, J.S. A review of biomass burning emissions, part I: Gaseous emissions of carbon monoxide, methane, volatile organic compounds, and nitrogen containing compounds. Atmos. Chem. Phys. Discuss. 2005, 5, 10455–10516. [Google Scholar] [CrossRef]
  41. Forsyth, G.G.; Kruger, F.J.; Le Maitre, D.C. National Veldfire Risk Assessment: Analysis of Exposure of Social, Economic and Environmental Assets to Veldfire Hazards in South Africa; CSIR Report No: CSIR/NRE/ECO/ER/2010/0023/C; National Resources and the Environment CSIR; Fred Kruger Consulting cc: Stellenbosch, South Africa, March 2010. [Google Scholar]
  42. Young, A.R. Acute effects of UVR on human eyes and skin. Prog. Biophys. Mol. Boil. 2006, 92, 80–85. [Google Scholar] [CrossRef]
  43. Marionnet, C.; Tricaud, C.; Bernerd, F. Exposure to Non-Extreme Solar UV Daylight: Spectral Characterization, Effects on Skin and Photoprotection. Int. J. Mol. Sci. 2015, 16, 68–90. [Google Scholar] [CrossRef]
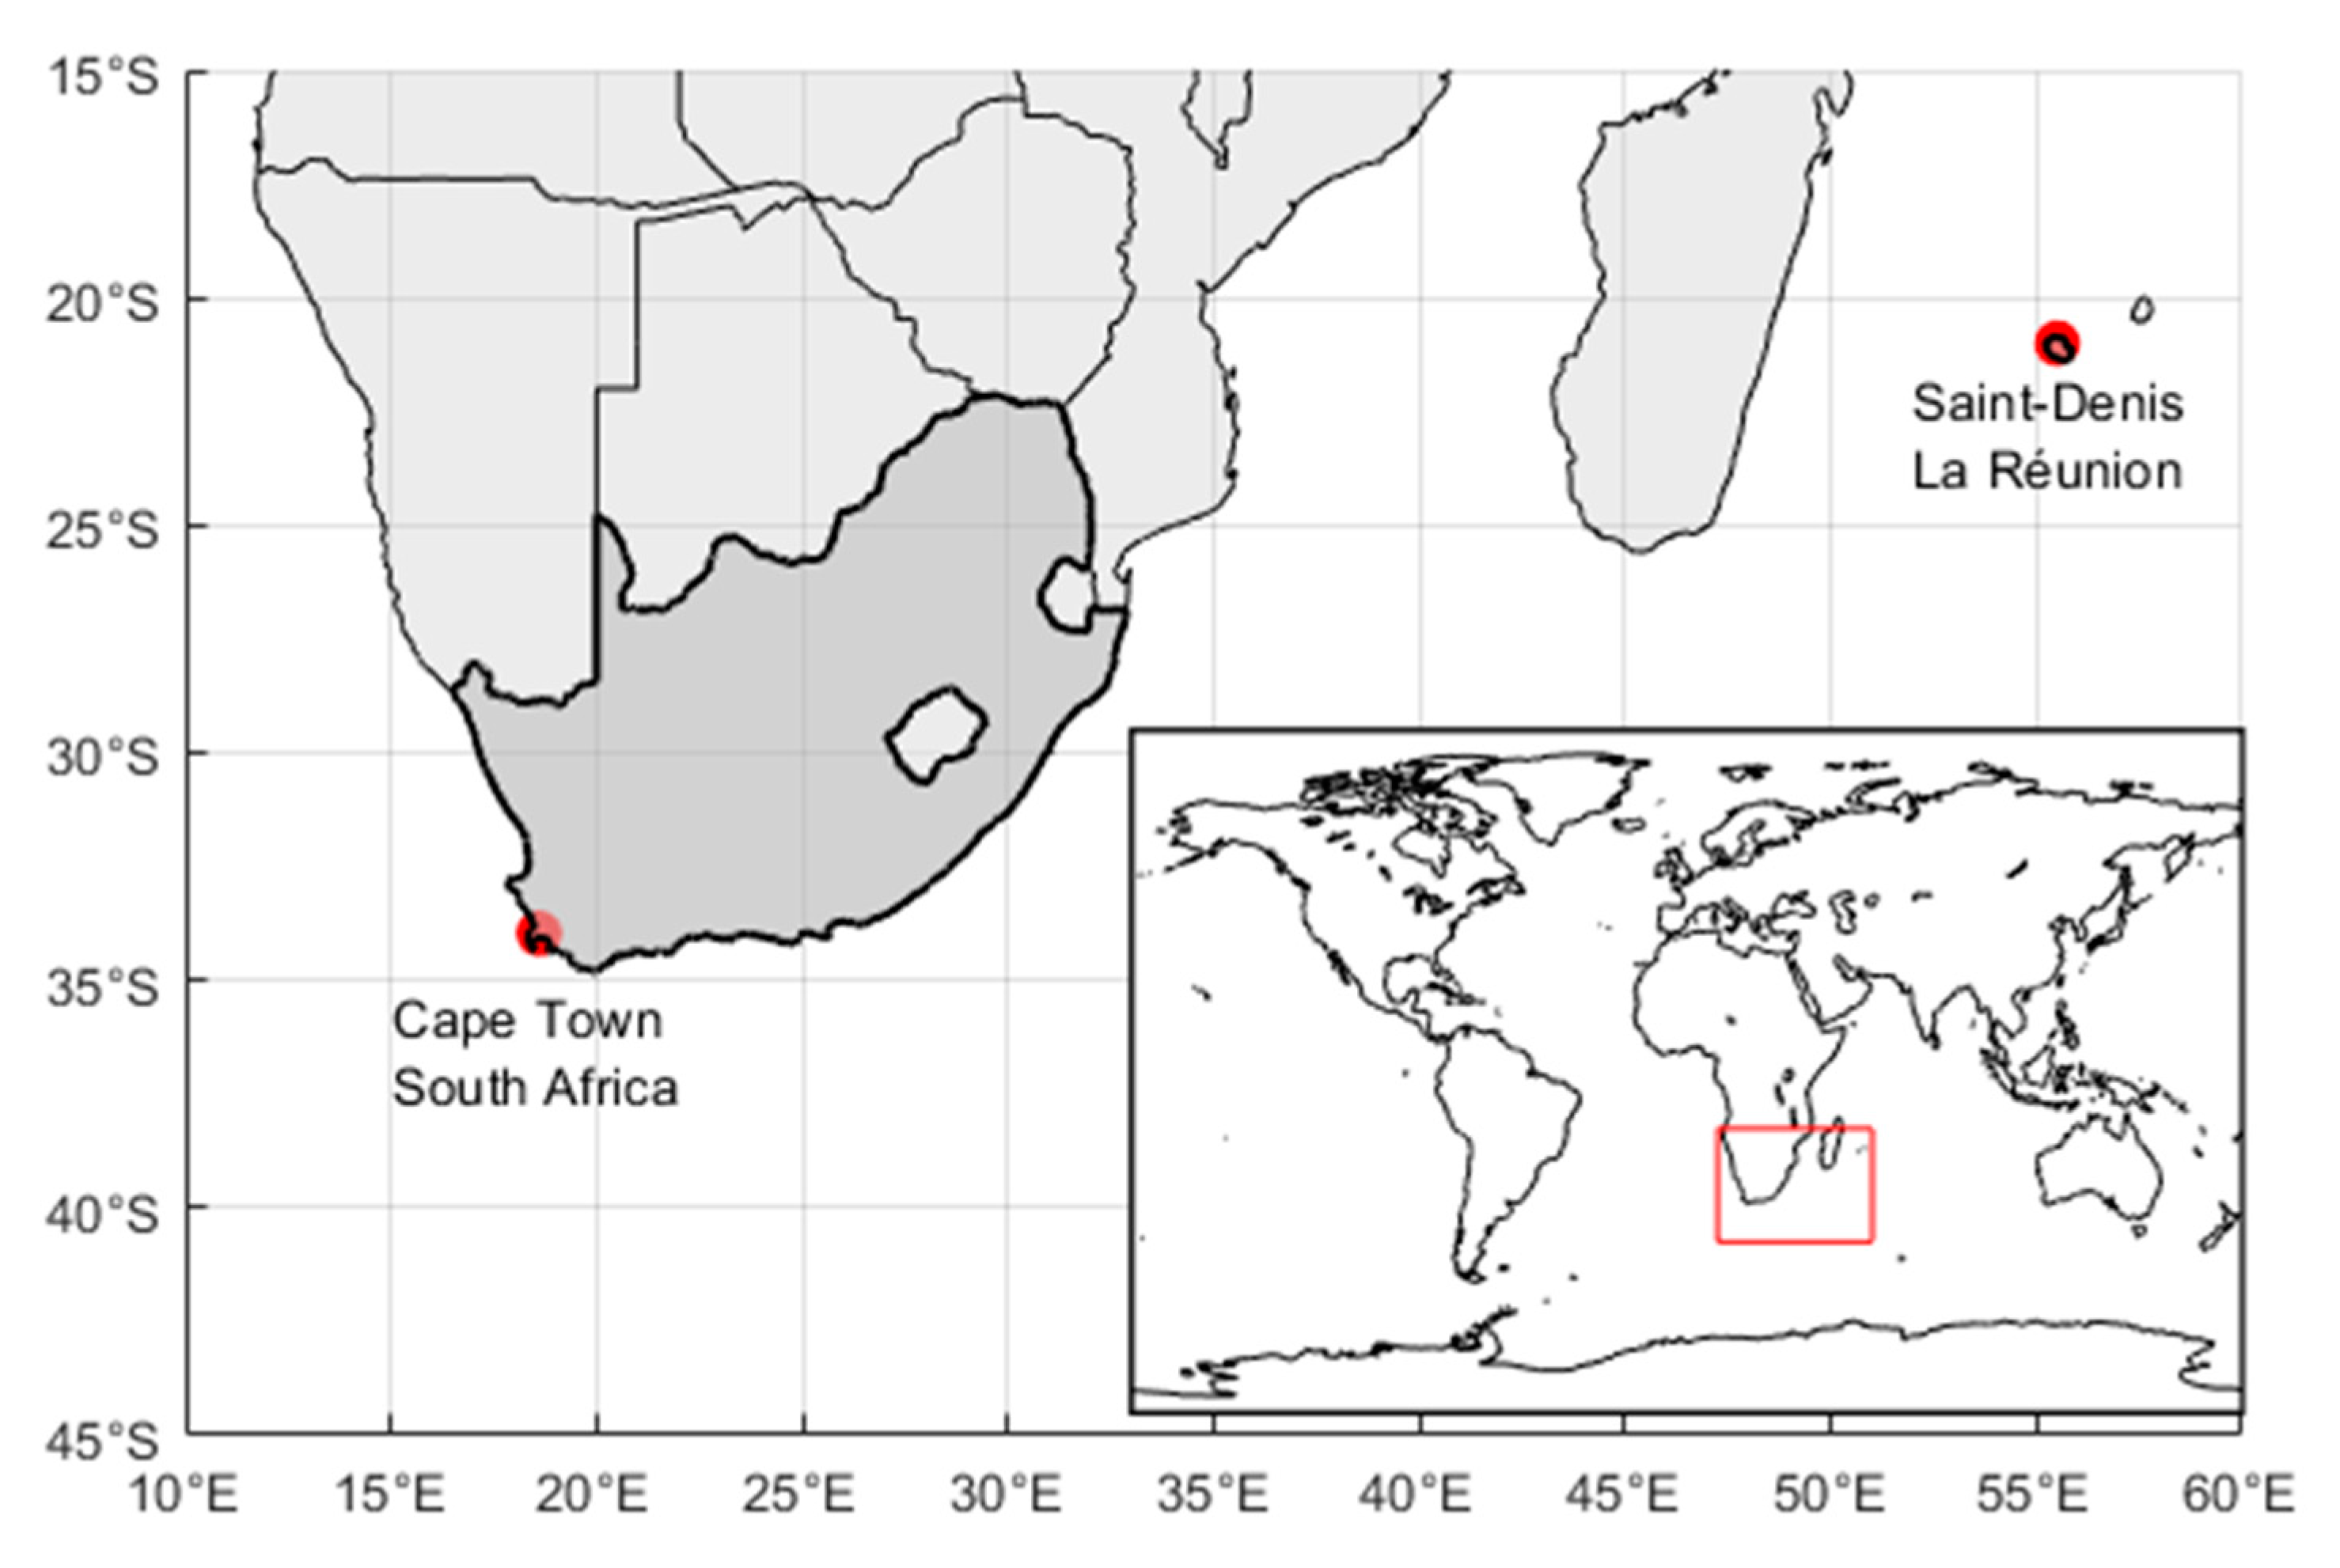
Figure 1. Geographical locations of Saint-Denis and Cape Town ground-based solar ultraviolet radiation (UVR) measurement sites.
Atmosphere 10 00589 g001
Figure 2. On the top panels, the red lines show the route of the Maïdo–Grand Bénare hike (left side) and Table Mountain hike (right side). The departure (D), intermediate (I), and arrival (A) locations are indicated as well, in addition to the direction of the hike. The lower panels present photos of the 2 sites on the days of the hikes.
Atmosphere 10 00589 g002
Figure 3. Monthly climatology of total daily erythemal dose at Saint-Denis (a) and at Cape Town (b). Box diagrams are represented in black for each month (the central value is the median, the box edge is set at 25th and 75th percentiles, the whiskers show the extreme values, excluding outliers, which is represented by single black dots). The orange line shows the monthly mean and the orange shading shows one standard deviation. Months on the X-axis have been reorganized to highlight the austral summer, which appears in the middle of the plot.
Atmosphere 10 00589 g003
Figure 4. Relative frequency of ultraviolet (UV) index thresholds (WHO) based on the half-month maximum UV Index (UVI) over the decade (2009 to 2018), (a) for Saint-Denis UV station and (b) for Cape Town UV station. Months on the X-axis have been reorganized to highlight the austral summer, which appears in the middle of the plot.
Atmosphere 10 00589 g004
Figure 5. Total daily erythemal doses at Saint-Denis (a) and Cape Town (b). The grey dots represent all daily values recorded from 2009 to 2018. The blue and red dots highlight data from 2009 and 2018, respectively. The horizontal lines show the threshold for one dose to sunburn (Table 1) as a function of skin phototype. Months on the X-axis have been reorganized to highlight the austral summer, which appears in the middle of the plot.
Atmosphere 10 00589 g005
Figure 6. Total daily erythemal dose trend estimates in Saint-Denis (a) and Cape Town (b). The grey dots represent the relative difference from the monthly mean of daily doses to the climatological monthly mean of daily doses. The histogram shows the numbers of days with data available in each month. The black solid line represents a linear fit and the black dashed lines the 90% confidence interval.
Atmosphere 10 00589 g006
Figure 7. UV index recorded at Maïdo–Grand Bénare hike (a) and Table Mountain hike (b). The colors on the histogram represent also the UV index following the standard UV index color scale. The grey surface at the bottom of the figure shows environmental effects affecting UV radiation, mainly cloud cover or shade. The corresponding cumulative doses at Maïdo-Grand Bénare hike (c) and Table Mountain hike (d). The black line represents the cumulated dose. The horizontal lines show the threshold for 1 dose to sunburn (Table 1) as function of skin phototype.
Atmosphere 10 00589 g007
Table 1. Skin phototype classification [1].
PhototypeCharacteristicsHistory of SunburnMinimal Dose to Elicit Sunburn (SED)
IIvory white skin, light eyesBurns easily2–3
IIWhite skin, hazel/brown eyesBurns easily2.5–3
IIIWhite skin, brown eyesBurns moderately3–5
IVLightly skin, dark eyesBurns minimally4.5–6
VModerate brown skin, dark eyesRarely Burns6–20
VIStrong brown/black skin, dark eyesNever burns6–20
Table 2. Annual and seasonal UV trend estimates (in percentages) computed from daily total doses (SED) as derived from UVI observations at Saint-Denis in Reunion Island and Cape Town in South Africa.
SitesSeasonal Trends (%)Annual Trend (%)
DJFMAMJJASON
Saint-Denis20.9°S, 55.5°E, 85 m ASL+4.5+6.3+1.7+1.9+3.7
Cape Town33.9°S, 18.6°E, 42 m ASL−5.0−5.7+1.0−4.2−3.6