Article

The Intensification of Hurricane Maria 2017 in the Antilles

1
Physics Department, University of Puerto Rico Mayagüez, Mayagüez 00681, Puerto Rico
2
Geography Department, University of Zululand, KwaDlangezwa 3886, South Africa
3
Meteorology and Climate Science, San Jose State University, San Jose, CA 95192, USA
4
Laboratory for Research in Geosciences and Energy (LARGE), University of French West Indies, Pointe-à-Pitre 97157, Guadeloupe
*
Authors to whom correspondence should be addressed.
Atmosphere 2019, 10(10), 590; https://doi.org/10.3390/atmos10100590
Submission received: 21 August 2019 / Revised: 22 September 2019 / Accepted: 24 September 2019 / Published: 1 October 2019
(This article belongs to the Special Issue Dynamics of Orographic Effects on Tropical Cyclones)

Abstract

:
Environmental influences on Hurricane Maria in the Antilles Islands are analyzed at the large-scale (1–25 September) and at the meso-scale (17–20 September 2017). The storm intensified rapidly prior to landfall in Dominica, going from category 1 to 5 in 15 h. As the storm progressed toward Puerto Rico (PR), its NE flank entrained air from seas cooled by the earlier passage of two hurricanes, and strengthened on its SW flank. Operational model forecasts tended to delay intensification until west of the Antilles Islands, thus motivating two independent weather research and forecasting (WRF) simulations. These gave minimal track errors at 1- to 3-day lead time. The simulation for landfall at Dominica on 19 September 2017 showed that a static nest with 0.8 km resolution using a Holland-type synthetic vortex and Yonsei University (YSU)/Kain-Fritsch schemes performed better; with a track error of 8 km and intensity error of 10 m/s. Our PR-area simulation of central pressure lagged 30 hPa behind observation; and caught up with reality by landfall in PR. The simulated rainband structure corresponded with Cloudsat observations over PR. Maria’s intensification occurred in an area of thermodynamic gradients included cooler SST in the right side of the track, so operational models with right-track bias were late in predicting intensification. Category-2 forecasts prior to 18 September 2017 left many Antilles islanders unprepared for the disaster that ensued.

1. Introduction

More than 15% of all Atlantic hurricanes make landfall in the Caribbean Antilles Islands during August–September. The most probable track is between Dominica (15 N, 61W) and Puerto Rico (18 N, 66 W). Destructive impacts are unavoidable on small islands exposed to high winds, flash-floods, landslides, and nowhere to evacuate. Anomalous warm sea surface temperatures (SST) and weak upper easterly winds promote intensification, amongst other factors [1,2,3]. Hurricane Maria (2017) was a prime example of rapid intensification—going from a category 1 to 5 in just 15 h.
Operational research has found increasing skill in hurricane forecasts at multi-day lead times when evaluated against persistence and climatology [4,5]. Track forecast errors in the Atlantic basin have decreased 1% a year since 1980 [6,7], while hurricane intensity errors declined 0.5% a year [8] except in the formative stage. It is well known that track is influenced by the large-scale environment whose forecasts benefit from steady progress in weather data assimilation. In contrast, hurricane intensity depends on how the inner-core thermodynamics and vorticity interact with the surrounding environment [9]. Although mesoscale structure can be resolved in numerical models with a horizontal resolution <4 km [10], the inner-core convective heating and vortex Rossby waves are seldom adequate. Thus, forecasts of rapid intensification remain a challenging task for numerical models in operational use today [11,12,13].
Recent research on hurricane intensity and size forecasts are reviewed in [14] as well as [15]. The unpredictable nature of rapid intensification is related to non-linear interactions between the regional circulation and atmospheric thermodynamics, the upper ocean influences and convective processes in the inner core of tropical cyclones (TCs). Key differences in TCs that underwent RI were identified by [16] including: (i) Situated over regions of above average sea surface temperature (SST) and mid-tropospheric moisture, and (ii) moving into regions with low wind shear and upper divergence. Positive feedback between large-scale vorticity and inner-core convection that amplified the diameter and intensity of maximum winds were suggested by [17,18].
TCs that deepen rapidly just before landfall, have significant socio-economic consequences for residents on the western edge of tropical ocean basins. These storms can intensify within hours and bring heavy rainfall and storm surge that cause severe property damage and casualties. One reason for rapid intensification of TCs is an increase in precipitation efficiency, which controls heat transport [19]. If a landfalling TC is under-represented in forecast models, emergency managers may be less vocal in urging public safety precautions against flooding and wind damage.
The 2017 Atlantic Hurricane season was the most active in terms of storm number, intensity, and US landfalls since 2005. There were six major hurricanes with four achieving category 4 or 5 status. The main focus of this work is a single hurricane in a busy season: Maria 2017 [20]. Maria formed from a tropical wave that moved westward off the coast of Africa from 12 to 15 September 2017. Although initially disorganized, a vortex developed east of Barbados by 16 September, as the storm entered a region of ample mid-level moisture, very low vertical shear, and high ocean heat content. Maria turned west-northwest and intensified rapidly into a hurricane by 17 September, for reasons that we will investigate here. As it neared Dominica on 19 September the storm had maximum winds of 72 m/s and a minimum pressure of 922 hPa. Maria was forecasted to be a category 2 or 3 hurricane before landfall on Dominica. However it passed over the island as category 5. After weakening 18 hPa due to the 1430 m volcanoes of Dominica, Maria entered the northeastern Caribbean Sea. It re-intensified to 75 m/s with a pressure of 908 mb on 20 September, near St. Croix. Maria experienced an eyewall replacement cycle before striking Puerto Rico (PR) at Yabucoa with a storm surge of 3 m. Maria continued west-northwestward across PR, as the eye closed. The hurricane re-emerged in the Atlantic on 21 September, after weakening over PR with winds of 50 m/s. 48 hr forecasts issued from 16 to 18 September by the NHC, based on a variety of models, contained median track errors 30 km to the right, and median intensity errors 2 categories too low; whereafter errors diminished.
High-resolution hurricane forecast models used in the North Atlantic Basin (in 2018) include: the Naval Research Laboratory (NRL)-COAMPS CTCX [21], the basin scale version of hurricane weather research and forecast system HWRF [22], and the hurricane in a multi-scale ocean coupled non-hydrostatic model HMON [23]. The physics parametrizations and grid nesting system of these hurricane forecast models are updated continuously based on the yearly performance verification, and configurations also change according to the ocean basin. During the North Atlantic 2017 season, the CTCX included moving double nested grids (4–12 km scale) with 40 vertical levels and a coupling with the navy coastal ocean model NCOM [24]. HWRF and HMON had triple nested grids (2-6-18 km scale) with respectively 43 and 75 vertical levels [23] and were coupled with the Princeton ocean model POM and the wave model WaveWatch3 WW3.
This study aims to investigate hurricane Maria’s evolution across the Eastern Caribbean islands from 17 to 20 September 2017. While those factors discussed above are necessary for development, it is also important to understand small-scale processes such as convective heating and its effect on storm structure and rapid intensification, so as to further our understanding and reduce intensity forecast errors. Here we address three questions: What environmental conditions affected the formation and track of hurricane Maria 2017 in the eastern Antilles? What induced its rapid intensification near 60 W from 16 to 18 September 2017? and how did prior hurricanes Irma (5 September) and Jose (9 September) affect the marine environment and consequently the circulation of Maria? In Section 2 the data and methods are outlined. Section 3 depicts the results, and a concluding discussion is given in Section 4.

2. Data and Methods

The National Hurricane Center (NHC) records on hurricane track and intensity formed the initial basis for our research [25] and [20]. Hourly to daily rainfall estimates derived from: CMORPH (CPC MORPHing technique) and GPM-merged multi-satellite [26,27], and ECMWF-5 reanalysis [28]. Large-scale features were described by MERRA-2 atmospheric reanalysis [29] latent heat flux, convective available potential energy (CAPE), 925 hPa potential vorticity, 500 hPa specific humidity, 300 and 150 hPa winds, 150 hPa ozone and 100 hPa air temperature. Sea surface temperature was described using the NOAA satellite IR and MW measurements blended with in situ data [30]. Upper ocean conditions were described by HYCOM reanalysis [31]: Temperature, salinity, and currents that characterize upper ocean heating. Detailed wind analyses derived from the Ascat scatterometer [32] and in situ sensors on the National Data Buoy Center (NDBC) [33] moored buoy west of Guadeloupe (#42060) and at a coastal site (Arecibo harbor, PR). Sea surface height observations were extracted at the NOAA gauge [34] in Yabucoa harbor, PR. Estimated wave heights during hurricane transit were obtained from Wave-watch-3 reanalysis [35]. Weather radar reflectivity maps at Martinique, Guadeloupe and PR were obtained from MeteoFrance-Antilles and the US National Weather Service. A CloudSat reflectivity slice [36] was obtained during landfall over PR. USGS MODIS satellite vegetation fraction data [37] were analyzed for changes before and after the hurricane. USGS lake level data for Guayo, PR were analyzed and a back-trajectory analysis was performed using HYSPLIT in NOAA-Ready-ARL. Hurricane data from COAMPS-TC [21] were employed to inter-compare track and intensity forecasts, initialization data and observations. Similar comparisons using the FV-GFS model are available in [38]. The prior effect of hurricanes Irma and Jose on regional ocean conditions was analyzed over 5–15 September 2017 using latent heat flux anomalies and 925 hPa potential vorticity. Hourly time series 17–19 September 2017 from CFSr2 reanalysis [39,40] averaged over the intensification area east of Dominica, are given in the Appendix A.
For regional-scale PR-area simulations, the advanced research weather research and forecasting (WRF-ARW) v3.9 was configured with two nested grids covering the southeastern Caribbean at 3 km resolution (Appendix B), and PR at 1 km resolution with 39 vertical sigma levels from surface to 50 hPa, as suggested in [41]. The simulation was initialized using operational ECMWF system-5 fields at 9 km horizontal resolution, starting at 0Z 17 September 2017. The simulation utilized the WRF Single-Moment 6-class (WSM6) cloud microphysics scheme [42]. Other sub-model components include the Yonsei University (YSU) scheme for the planetary boundary layer [43], the Noah scheme for land surface physics, and the rapid radiative transfer model (RRTMG) scheme for radiation physics [44]. Forecast outputs included: Sea level air pressure, surface wind, and convection reflectivity, at lead times from 36 to 96 h. Hurricane resolving forecasts were compared with CIRA-NHC wind maps based on multi-satellite and aircraft reconnaissance data [45] in the period 17–20 September 2017.
A second independent modeling effort was conducted to simulate the intensification of Maria near Dominica in the period 18 00Z to at 19 00Z. These ‘Dominica-area’ experiments used two-way downscaling involving both static and moving nesting. The static nests (FIX) had three domains with respective resolutions of 7.5, 2.5, and 0.8 km (Appendix B). The moving nests (MOV) were similar, but followed the vortex with 15 min update. Two cumulus schemes were tested: KF [46] and NSAS [47]; and two boundary layer schemes were tested: YSU and MYNN [48]. After evaluation of 7.5 and 2.5 km resolution results, the optimal schemes were used in the 0.8 km resolution static nest experiment (FIX-YSU-KF). In all Dominica simulations the hurricane was initialized at 00Z 18 September with hybrid ETKF-3DVAR data assimilation [49] and a parametric Holland vortex [50,51]. As in the PR-area simulations described above, the outer domain of the Dominica simulation was initialized using operational 9 km ECMWF system-5 atmospheric fields and SSTs derived from NCEP-RTG. The WRF-ARW v4 model was configured from surface to 30 hPa, with 99 vertical levels in a logarithmic resolution that is finer in lower levels. The other physics parameterizations used here included the Monin–Obukhov similarity scheme with a strong wind Donelan–Garratt surface flux option [52], the RRTMG radiation scheme, and the WSM6 microphysics scheme.
Results were provided in sequence as large-scale precursor atmosphere and ocean conditions (2–30 N, 80–35 W), local conditions during intensification of hurricane Maria (10–22 N, 69–57 W), and observed and simulated hurricane structure on landfall in Dominica and PR and some impacts that followed. Our work followed a chronological format similar to the NHC report of [20], and provided additional insights on upper air and ocean influences, and model forecasts of hurricane intensity.

3. Results

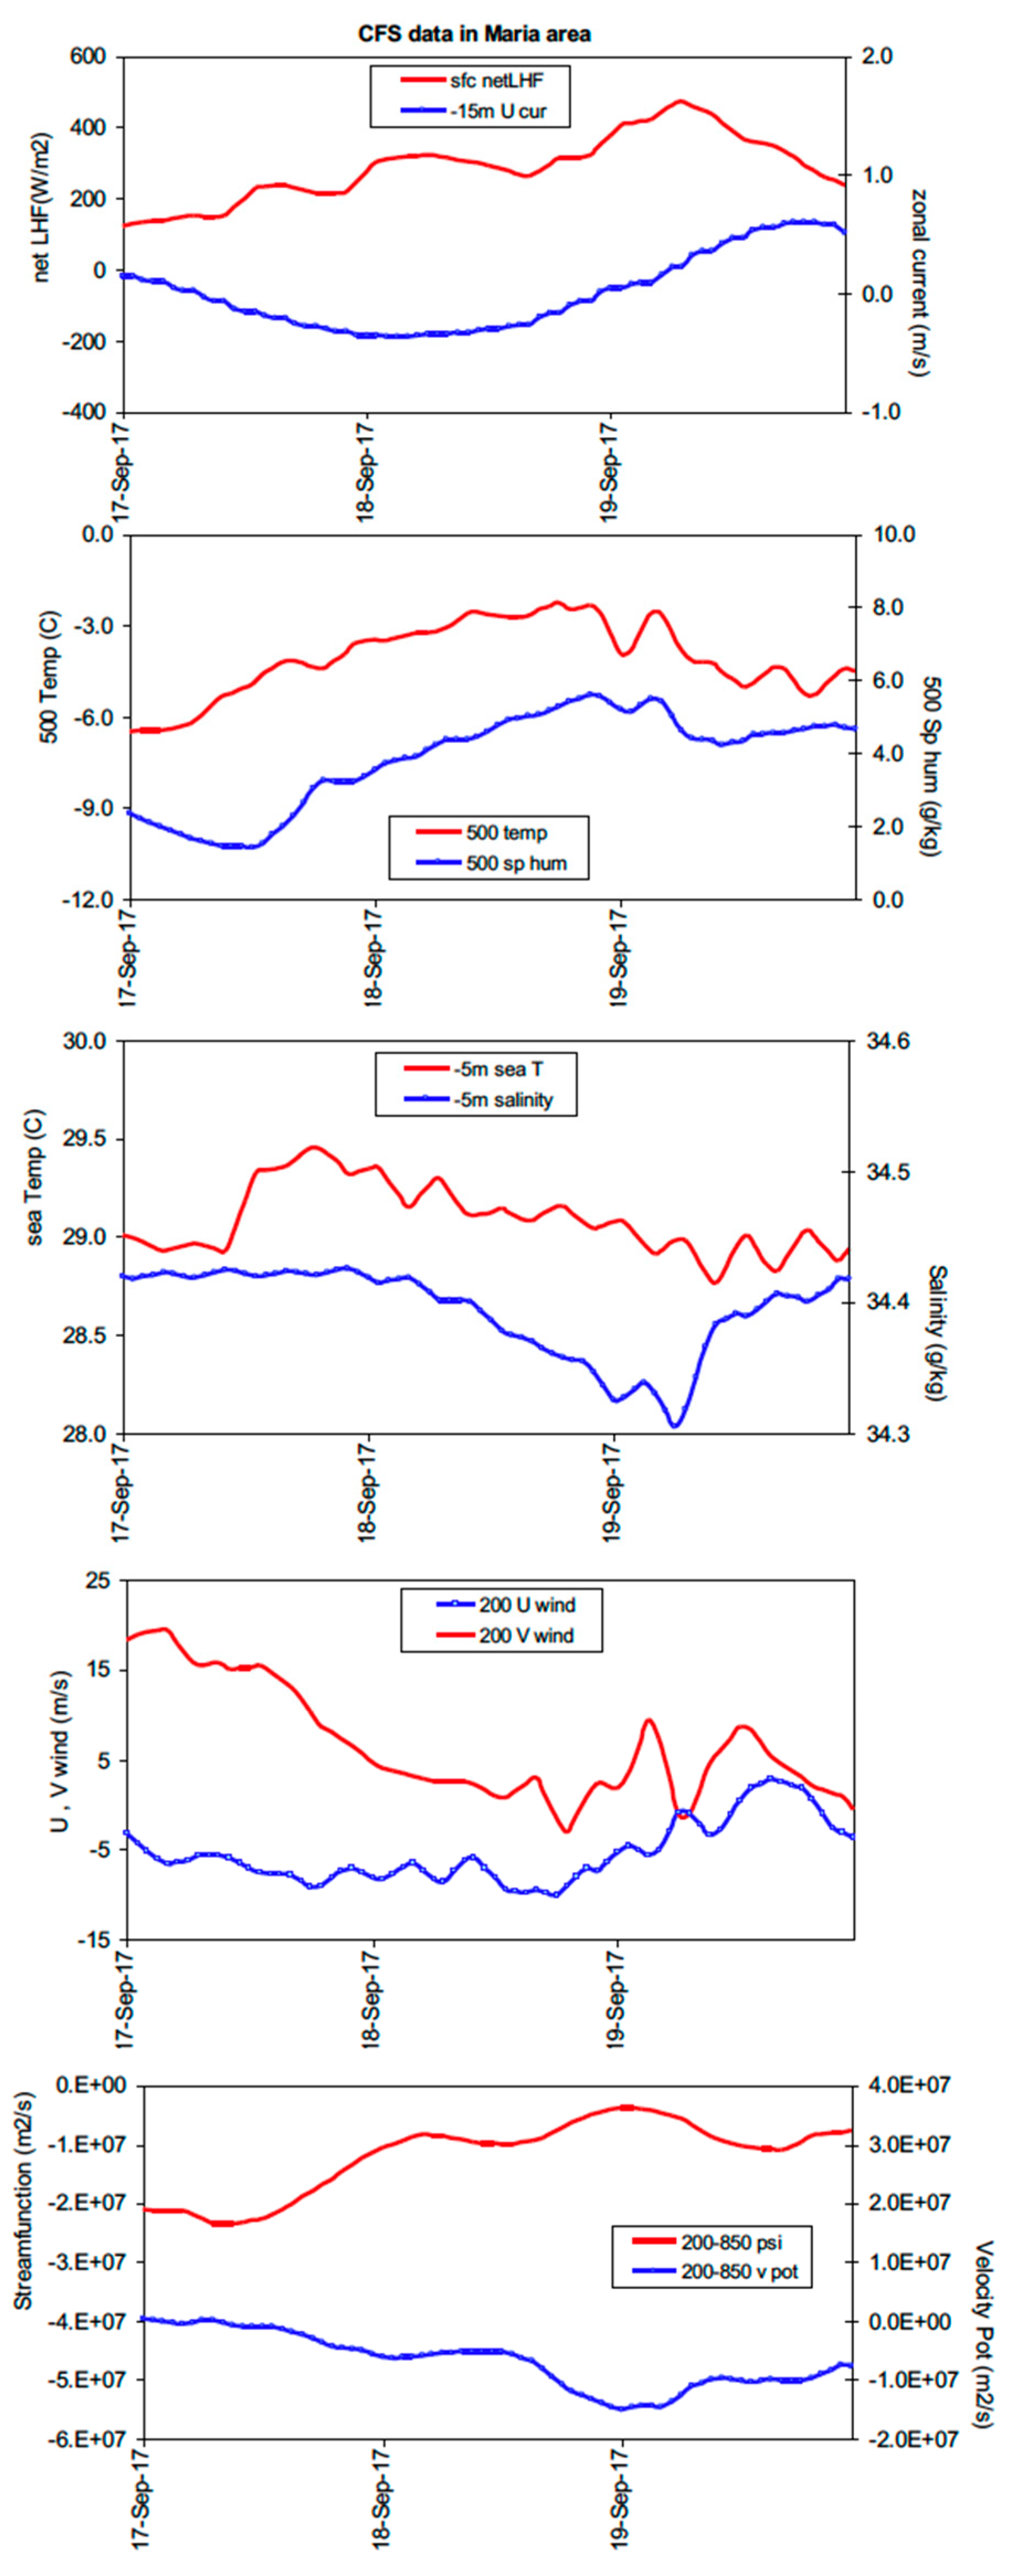
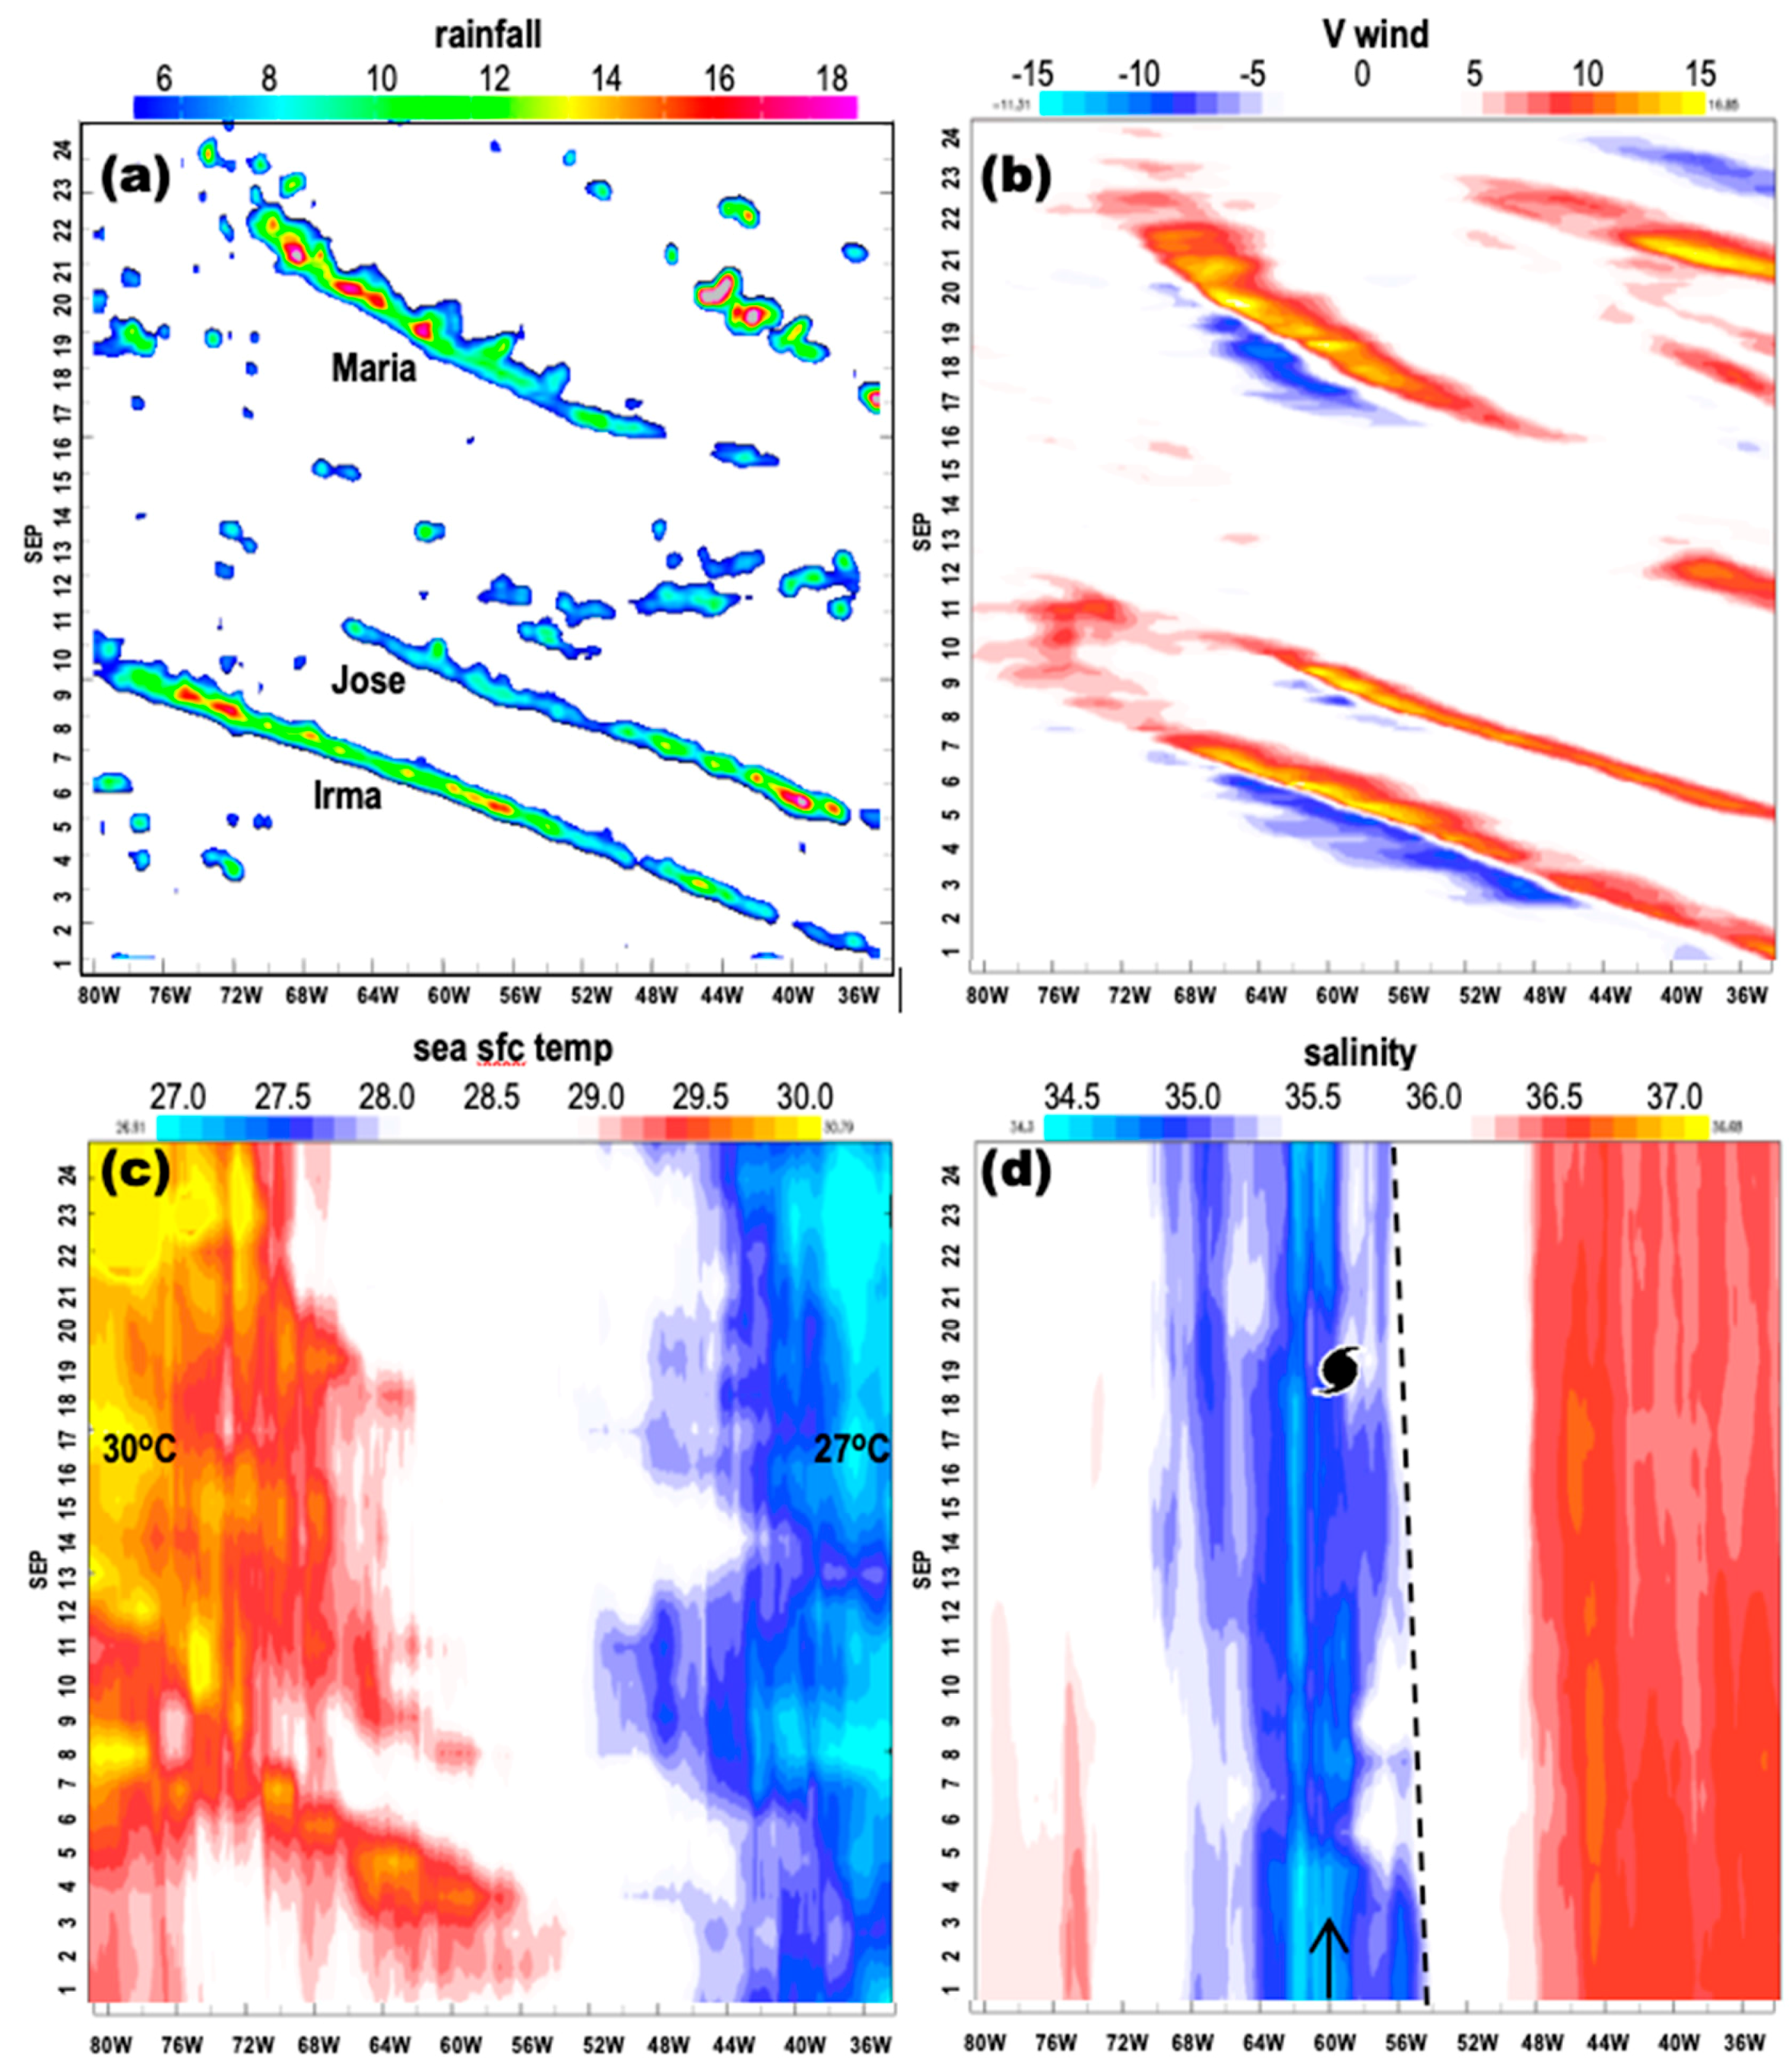
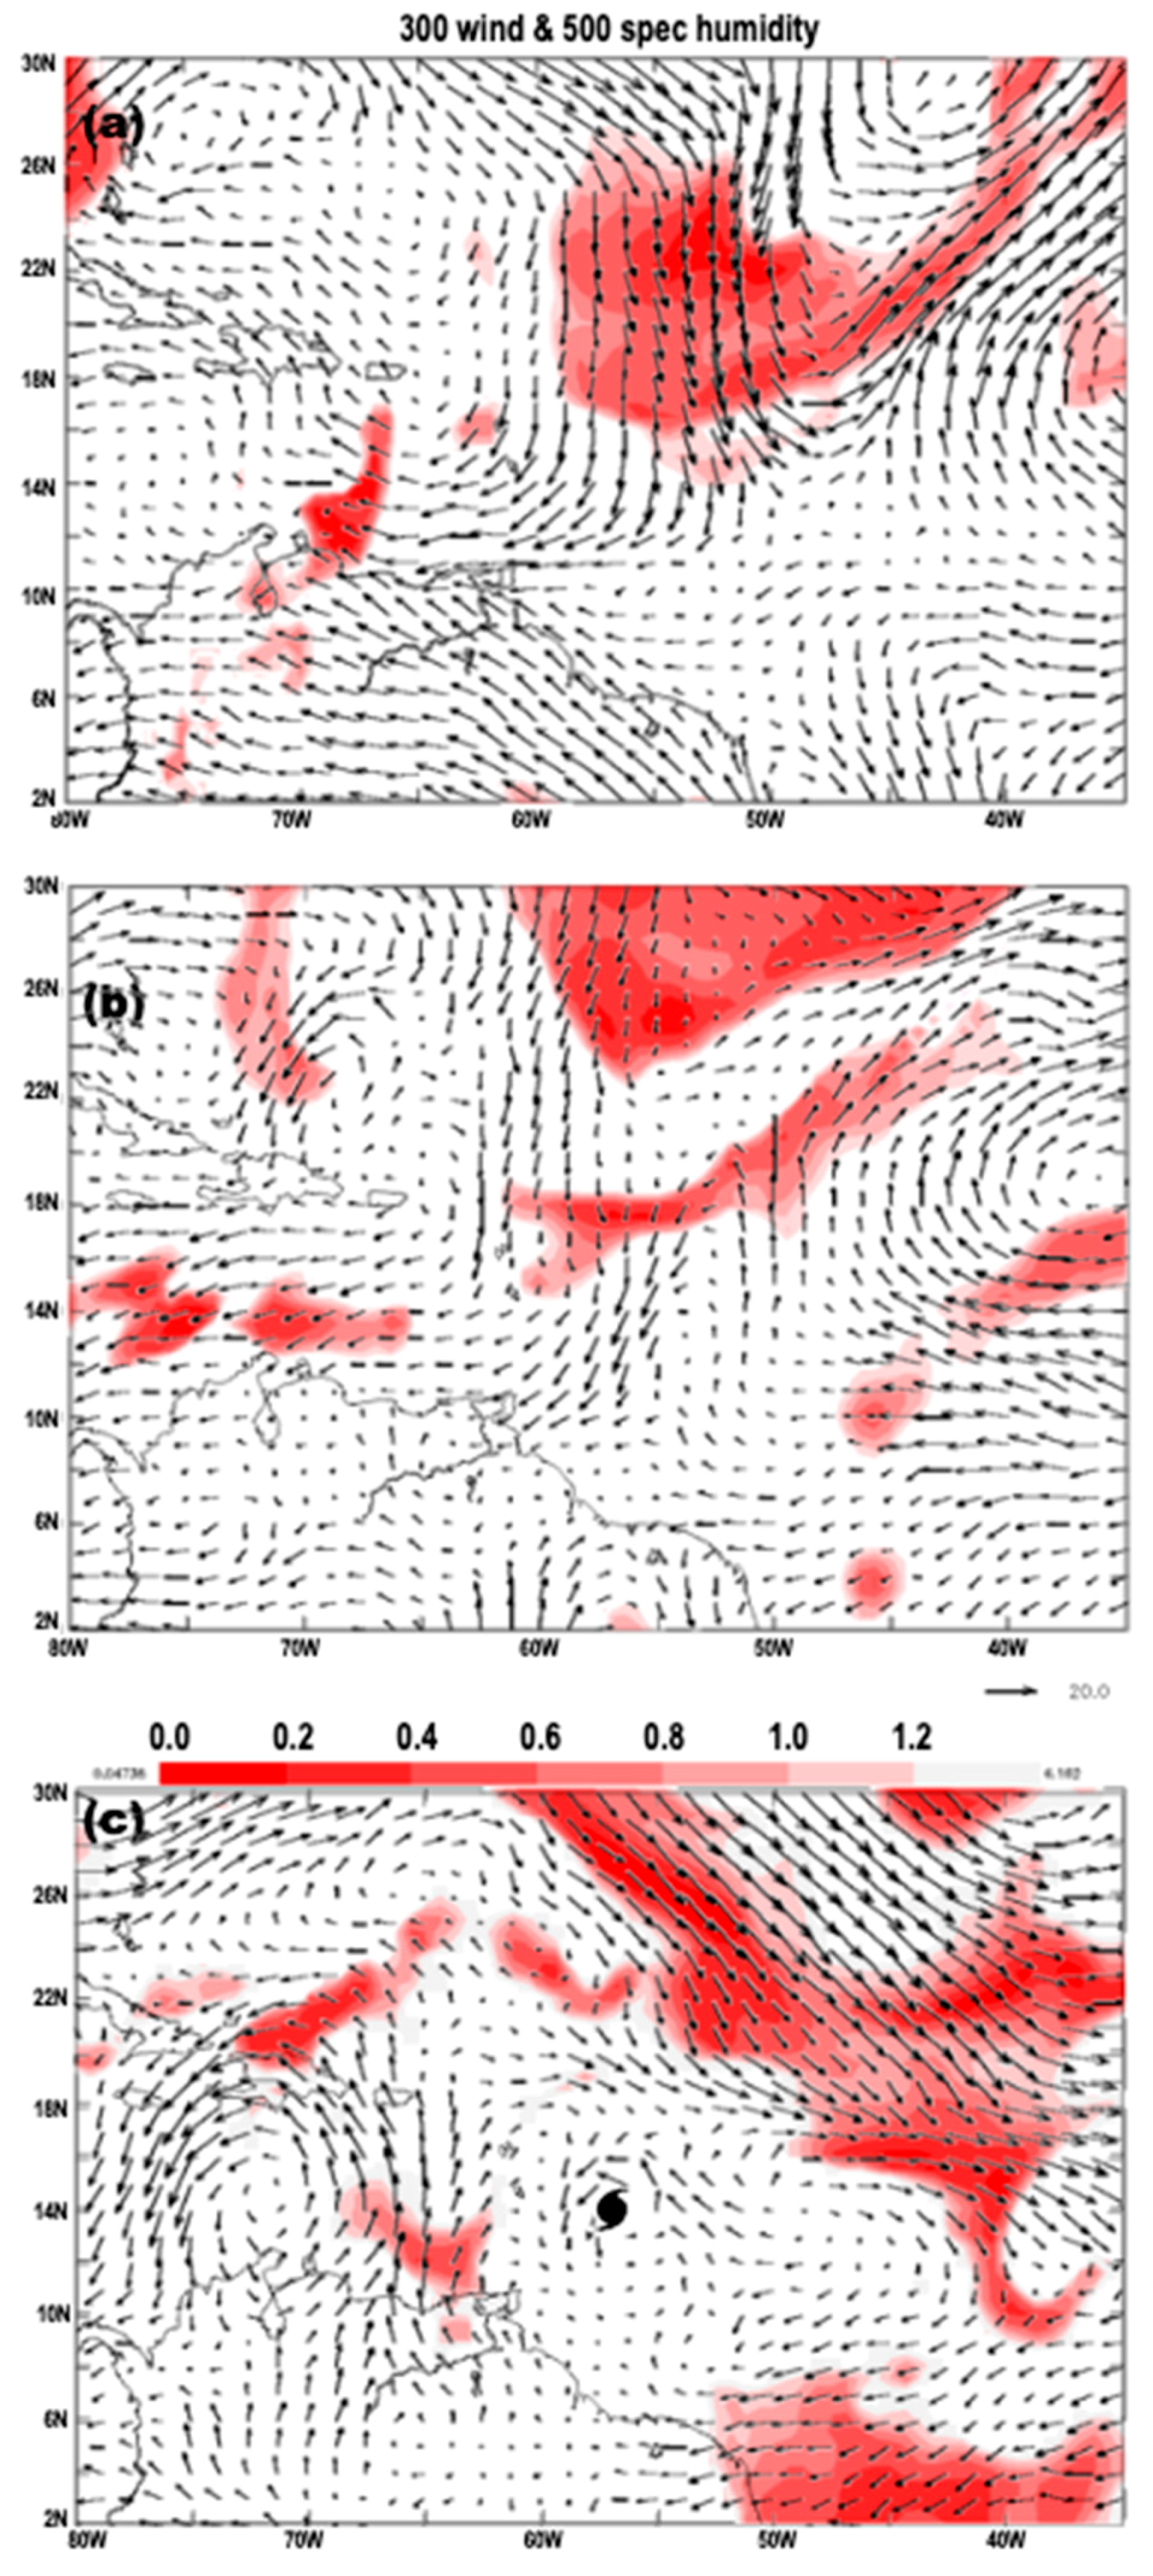
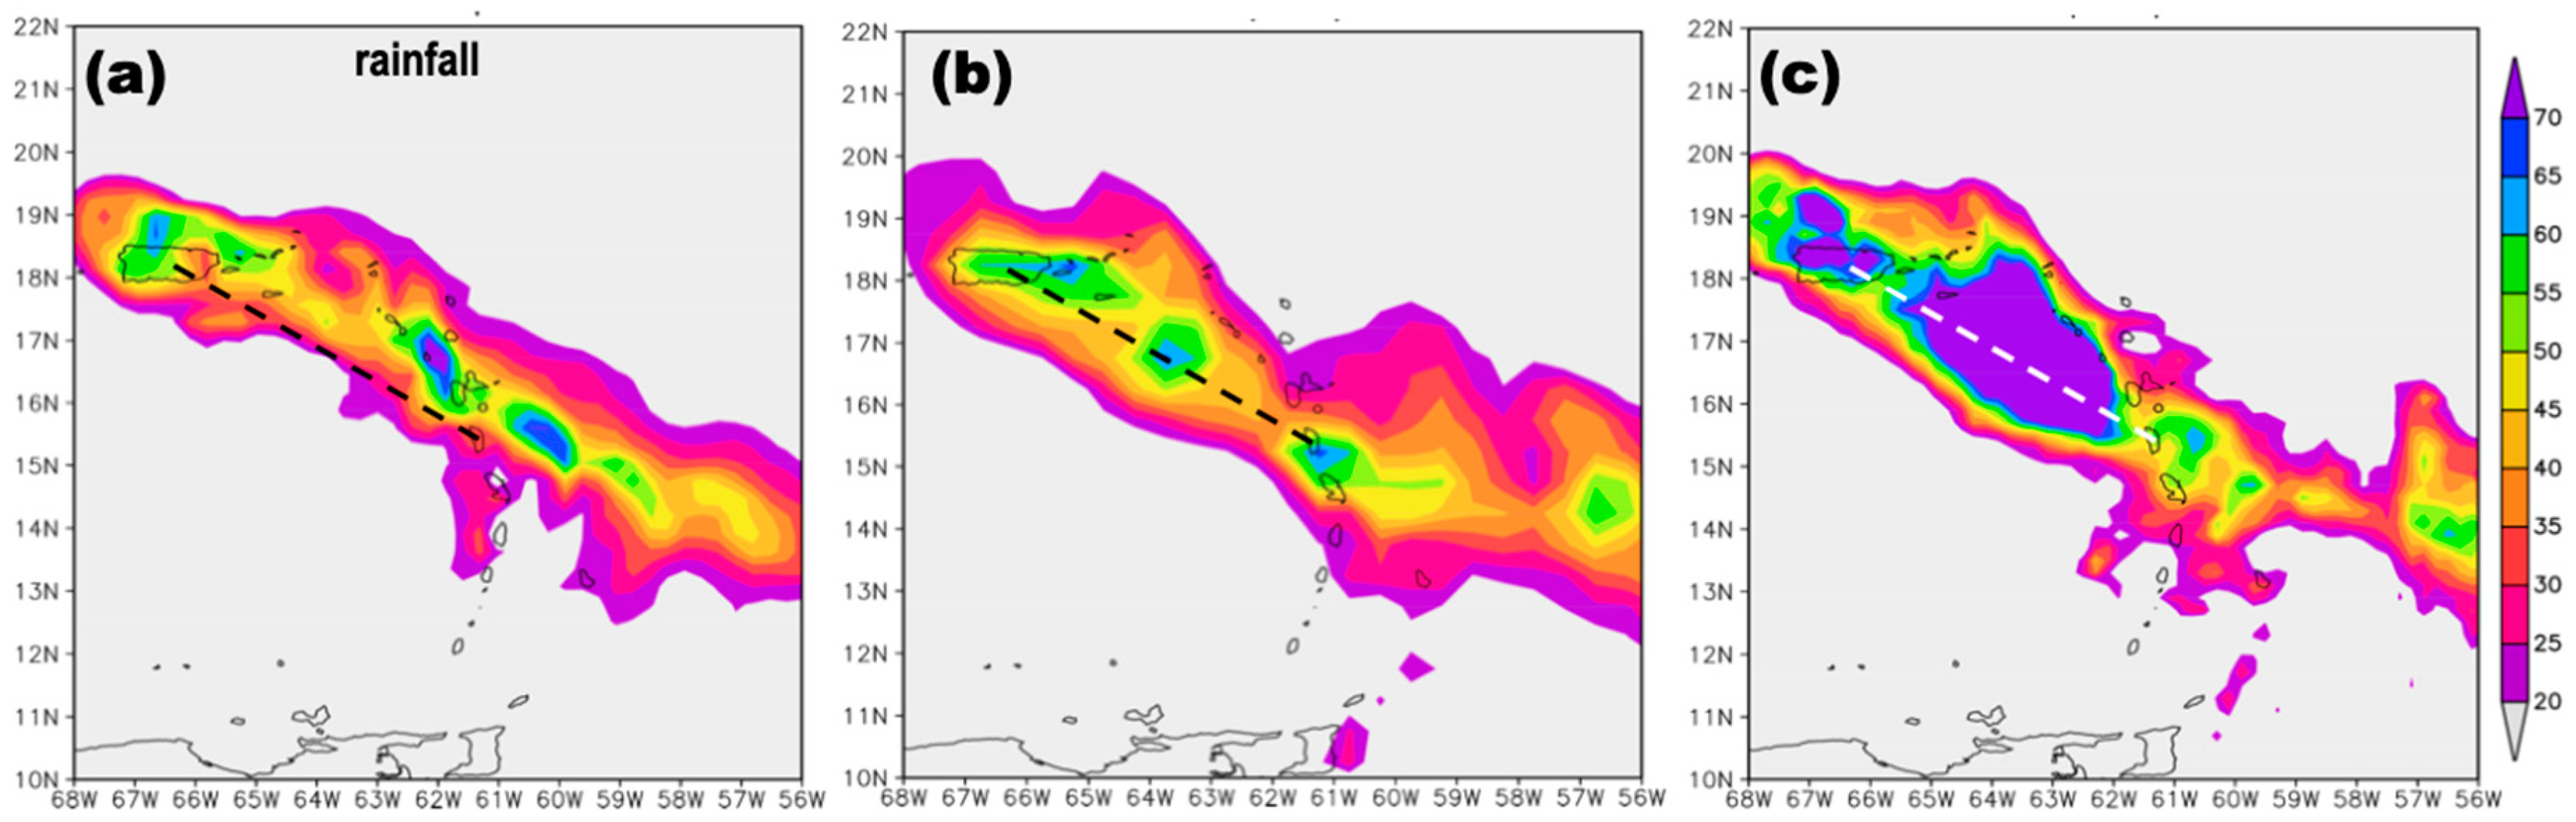
3.1. Observations of the Regional Environment

Hurricane Maria data on track and intensity in Table 1, commenced on 0Z 17 September 2017 two days prior to landfall in Dominica. The storm moved from 12.4° N, 53° W to 15.3° N, 61.1° W from 17 to 19 September while deepening from 1002 to 925 hPa. The track was close to climatology (290°), but the storm intensified rapidly to the east of the Antilles, not to the west—as initially expected.
Hovmoller plots in the 12–18° N band 1–25 September 2017 (Figure 1a–d) provided useful context on the regional environment. The rainfall and 850 V wind plots identified prior hurricanes Irma and Jose passing steadily westward in the first half of the month. Maria on the other hand, developed further west and had declining speed. The marine environment was dominated by warm SST and low salinity to the west of 55° W. The zonal gradient of SST was 27–30 °C from 40 to 70° W, and the area of low salinity shifted slowly westward from 1 to 25 September 2017. It is apparent in Figure 1c that the (right) flank of each hurricane induced (cooler) SST due to evaporation and the vertical motion induced by surface wind stress.
The ‘pre-Maria’ marine environment was analyzed with maps and sections of sea temperature, salinity, and currents averaged 5–15 September (Figure 2a–d). The SST field exhibited a >30 °C warm NW-SE axis in the Caribbean, coincident with lower salinity from the river plumes. SST north of the Antilles were <28 °C as a result of prior cooling by hurricanes Irma and Jose. The Antilles sections revealed a warm fresh layer from 0 to 40 m deep in latitudes 14–16 N. The ocean circulation was near climatology except for retroflection of the North Brazil Current. The Amazon discharge tended to disperse eastward, so fresh water in the Antilles was mainly sourced from the Orinoco plume. Considerable thermal energy was available for the rapid intensification of Maria, mainly in the SW quadrant as seen in Figure 3.
Conditions prior to Maria formation were altered by the latent heat flux and wind vorticity from earlier hurricanes Irma and Jose (Figure 3a,b). Large swaths of thermal energy were lost along the NE edge of the Antilles in the period 5–15 September 2017. The anomalous evaporation swath was wider than the cyclonic vorticity swath. In contrast, there was negative evaporation anomalies and weak anticyclonic vorticity to the west of the Antilles that contributed to above normal SST and CAPE >3000 J/kg (Figure 3c,d). During the intensification of Hurricane Maria on 18 September 2017, back-trajectories spiraled inward toward the system from the SE. Yet many trajectories arrived from the NE quadrant characterized by negative SST anomalies and CAPE <1500 J/kg. As will be seen later, operational models with right-track bias entrained air from the low CAPE zone previously cooled by Irma and Jose.
The regional atmospheric environment prior to hurricane formation is illustrated in Figure 4a–c using 300 hPa wind and 500 hPa humidity maps on 12, 15, and 18 September 2017. On the 12th, upper level winds show a cold front had penetrated into the tropical Atlantic with a divergent northerly flow that was particularly dry. By 15 September, the frontal air mass had dissipated eastward, leaving remnants of low humidity in the mid-troposphere. Yet on 18 September the upper westerly trough re-established in the sub-tropical North Atlantic, so the zone of low wind shear was quite narrow in the vicinity of hurricane Maria.
Upper tropospheric conditions during hurricane intensification were analyzed in Figure 5a–c using 150 hPa winds and the ozone, and 100 hPa temperatures. A warm cyclonic circulation was established over the Caribbean on 17 September, and there was no low ozone signal at 150 hPa. By 20 September the warm-core upper cyclone had receded into the western Caribbean. A strong divergent circulation developed over the area of intensification, with marked westward and eastward branches by 20 September. Ozone values at 150 hPa dropped below 50 ppb as the hurricane intensified, and 100 hPa temperatures declined <190 K; an indication of radiation cooling of cloud tops produced by deep convection.

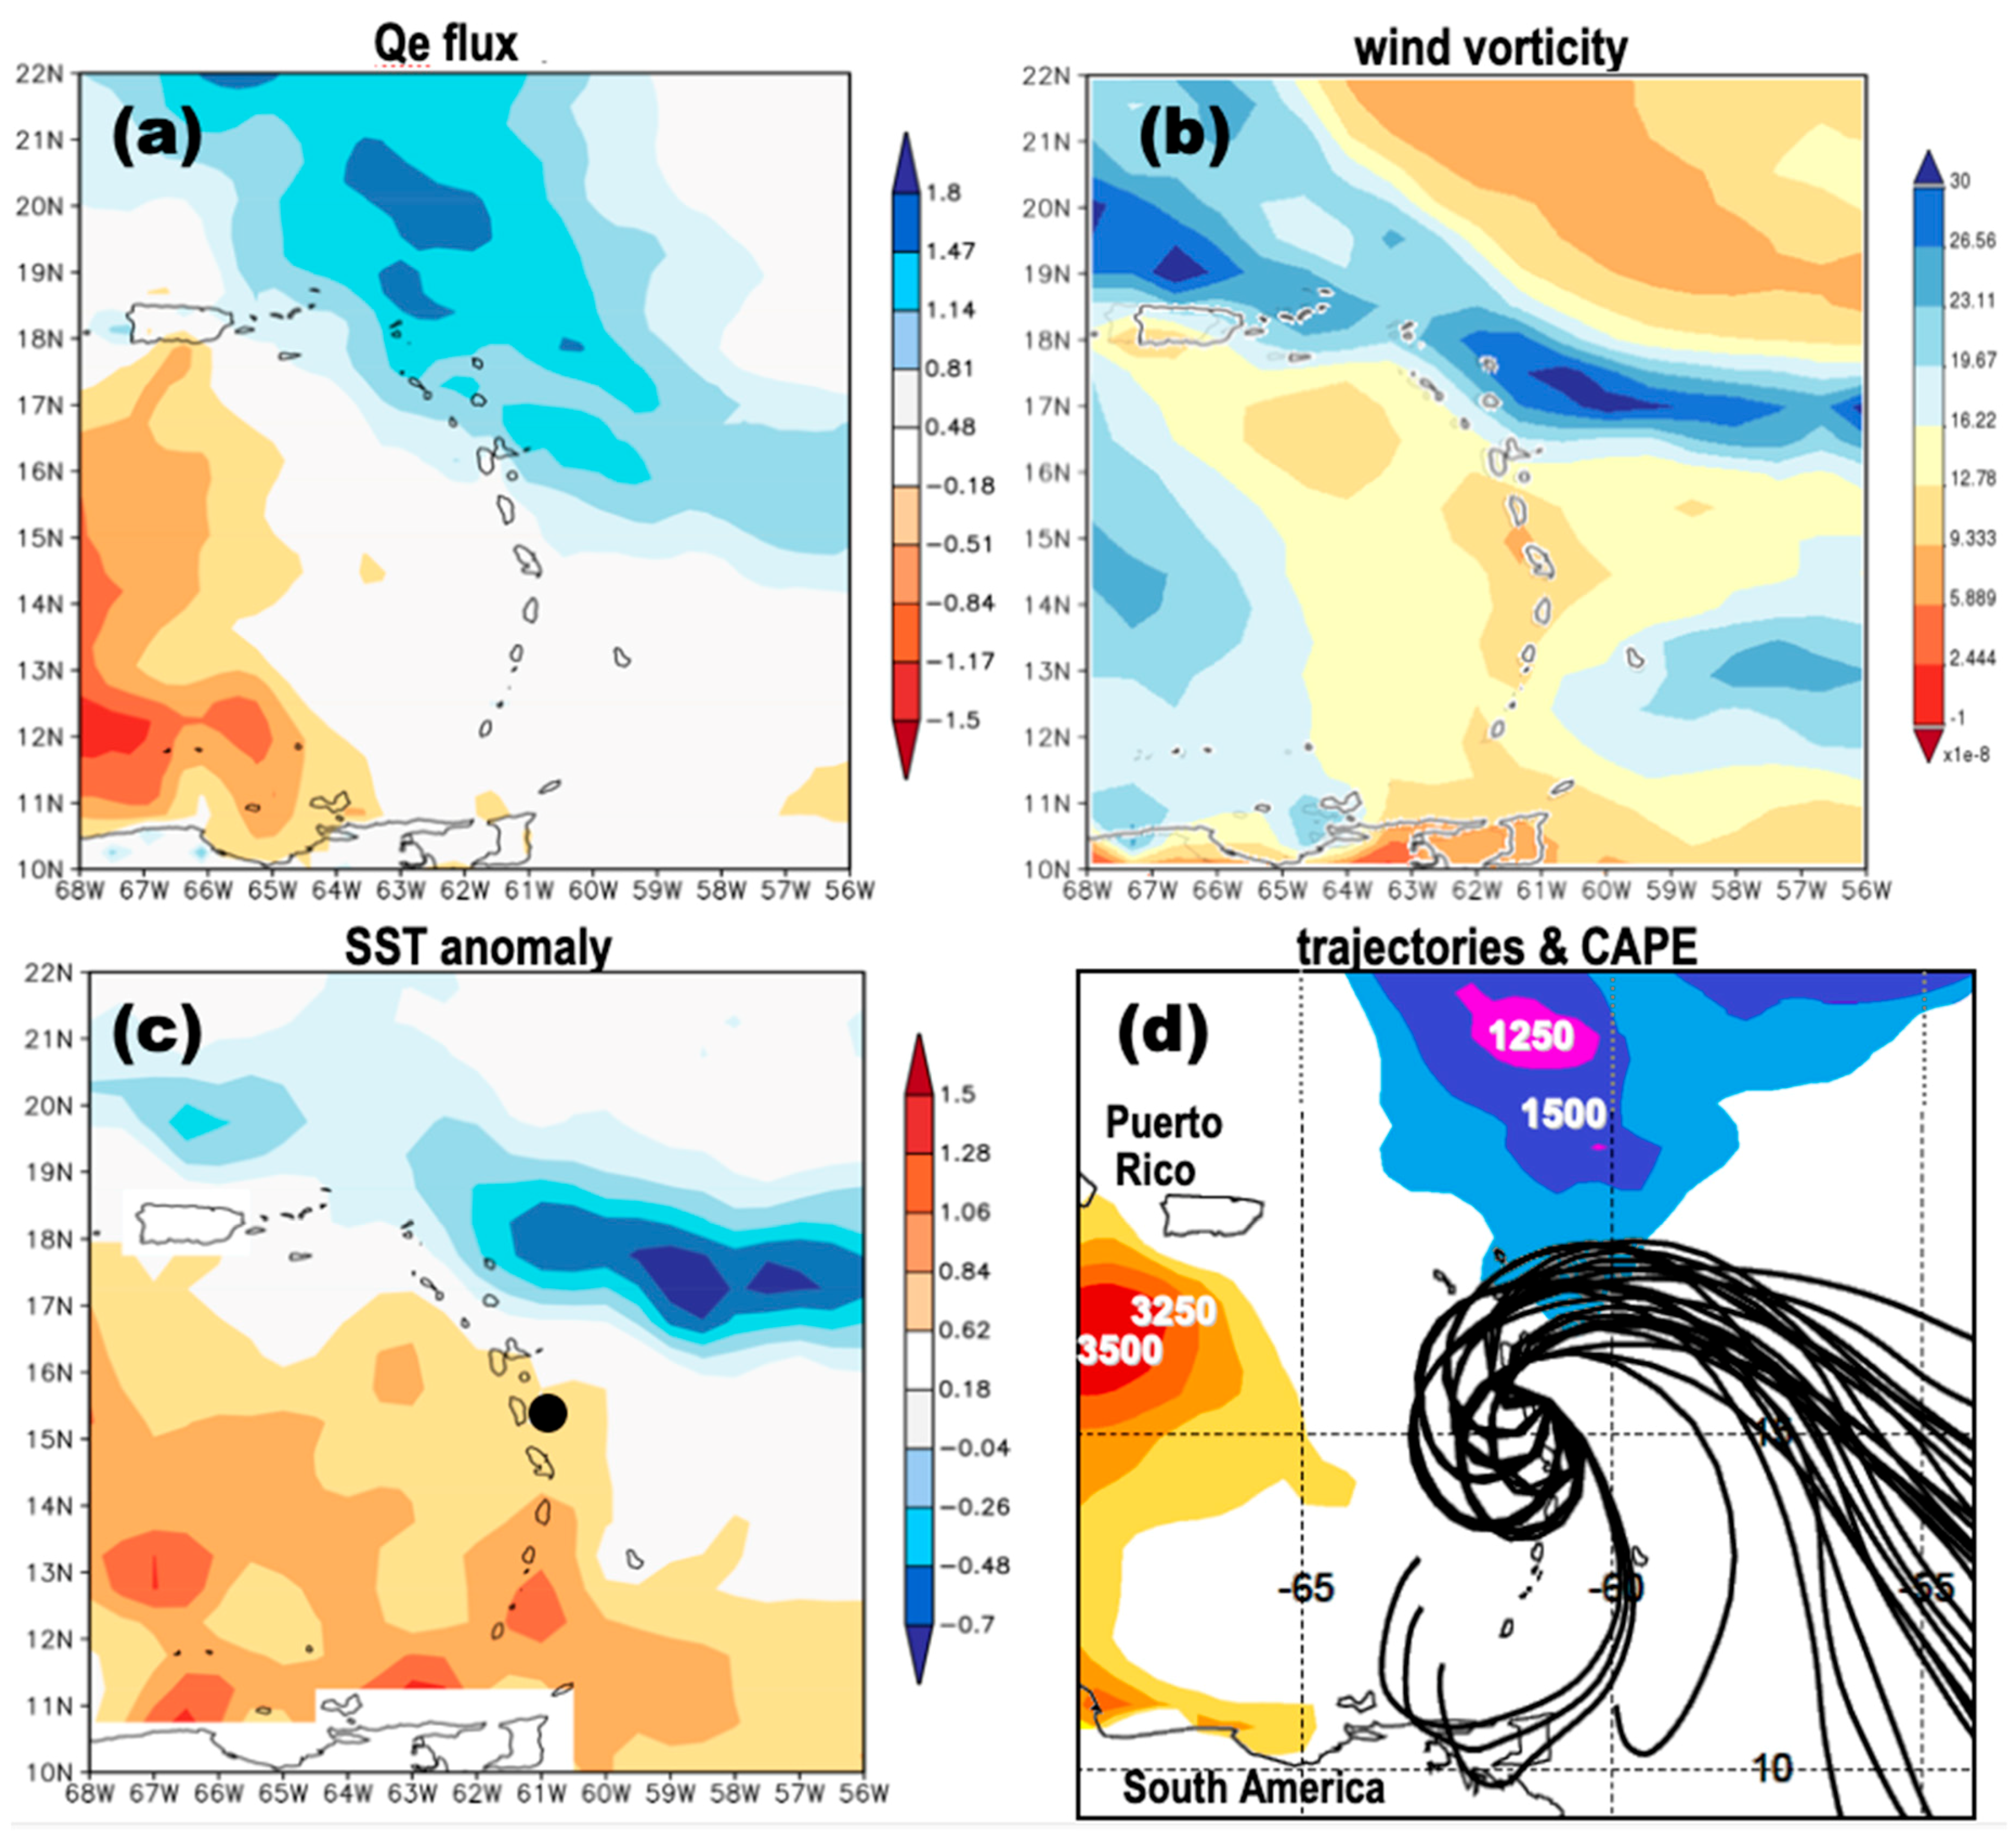
3.2. Observations of Conditions in the Eastern Antilles

Rainfall estimates from one model and two satellite products averaged 17–20 September (Figure 6a–c) indicate fluctuations in intensity related to moisture convergence and spiral bands joining the hurricane. CMORPH shows pulsing along the track, while most ECMWF5 rainfall lies on the northern flank. The GPM product exhibits a large area of intense rainfall between Dominica and PR. In general, the rainfall estimates exceed 50 mm/day over a width of ~200 km, except for CMORPH, which was narrower.
Wind scatterometer maps are given in Figure 7a,b during Maria passage over the eastern Antilles on 19 September. Storm winds had a circular shape with steady intensity and slightly greater radius in the NE quadrant as expected. Wave heights reached 10 m (Figure 7c) and pounded the southern shore of Guadeloupe during passage. Winds at the NOAA buoy west of Guadeloupe (Figure 7d) reached 45 m/s rather symmetrically. The WRF simulated and MeteoFrance observed radar reflectivity (Figure 7e,f) show intense spiral bands on the hurricane’s northern flank hitting Dominica. The simulated central pressure was 976 hPa regional (3 km resolution without synthetic vortex assimilation)/962 hPa local (0.8 km resolution with synthetic vortex assimilation) in versus 924 hPa observed (at 00Z 19 September 2017).

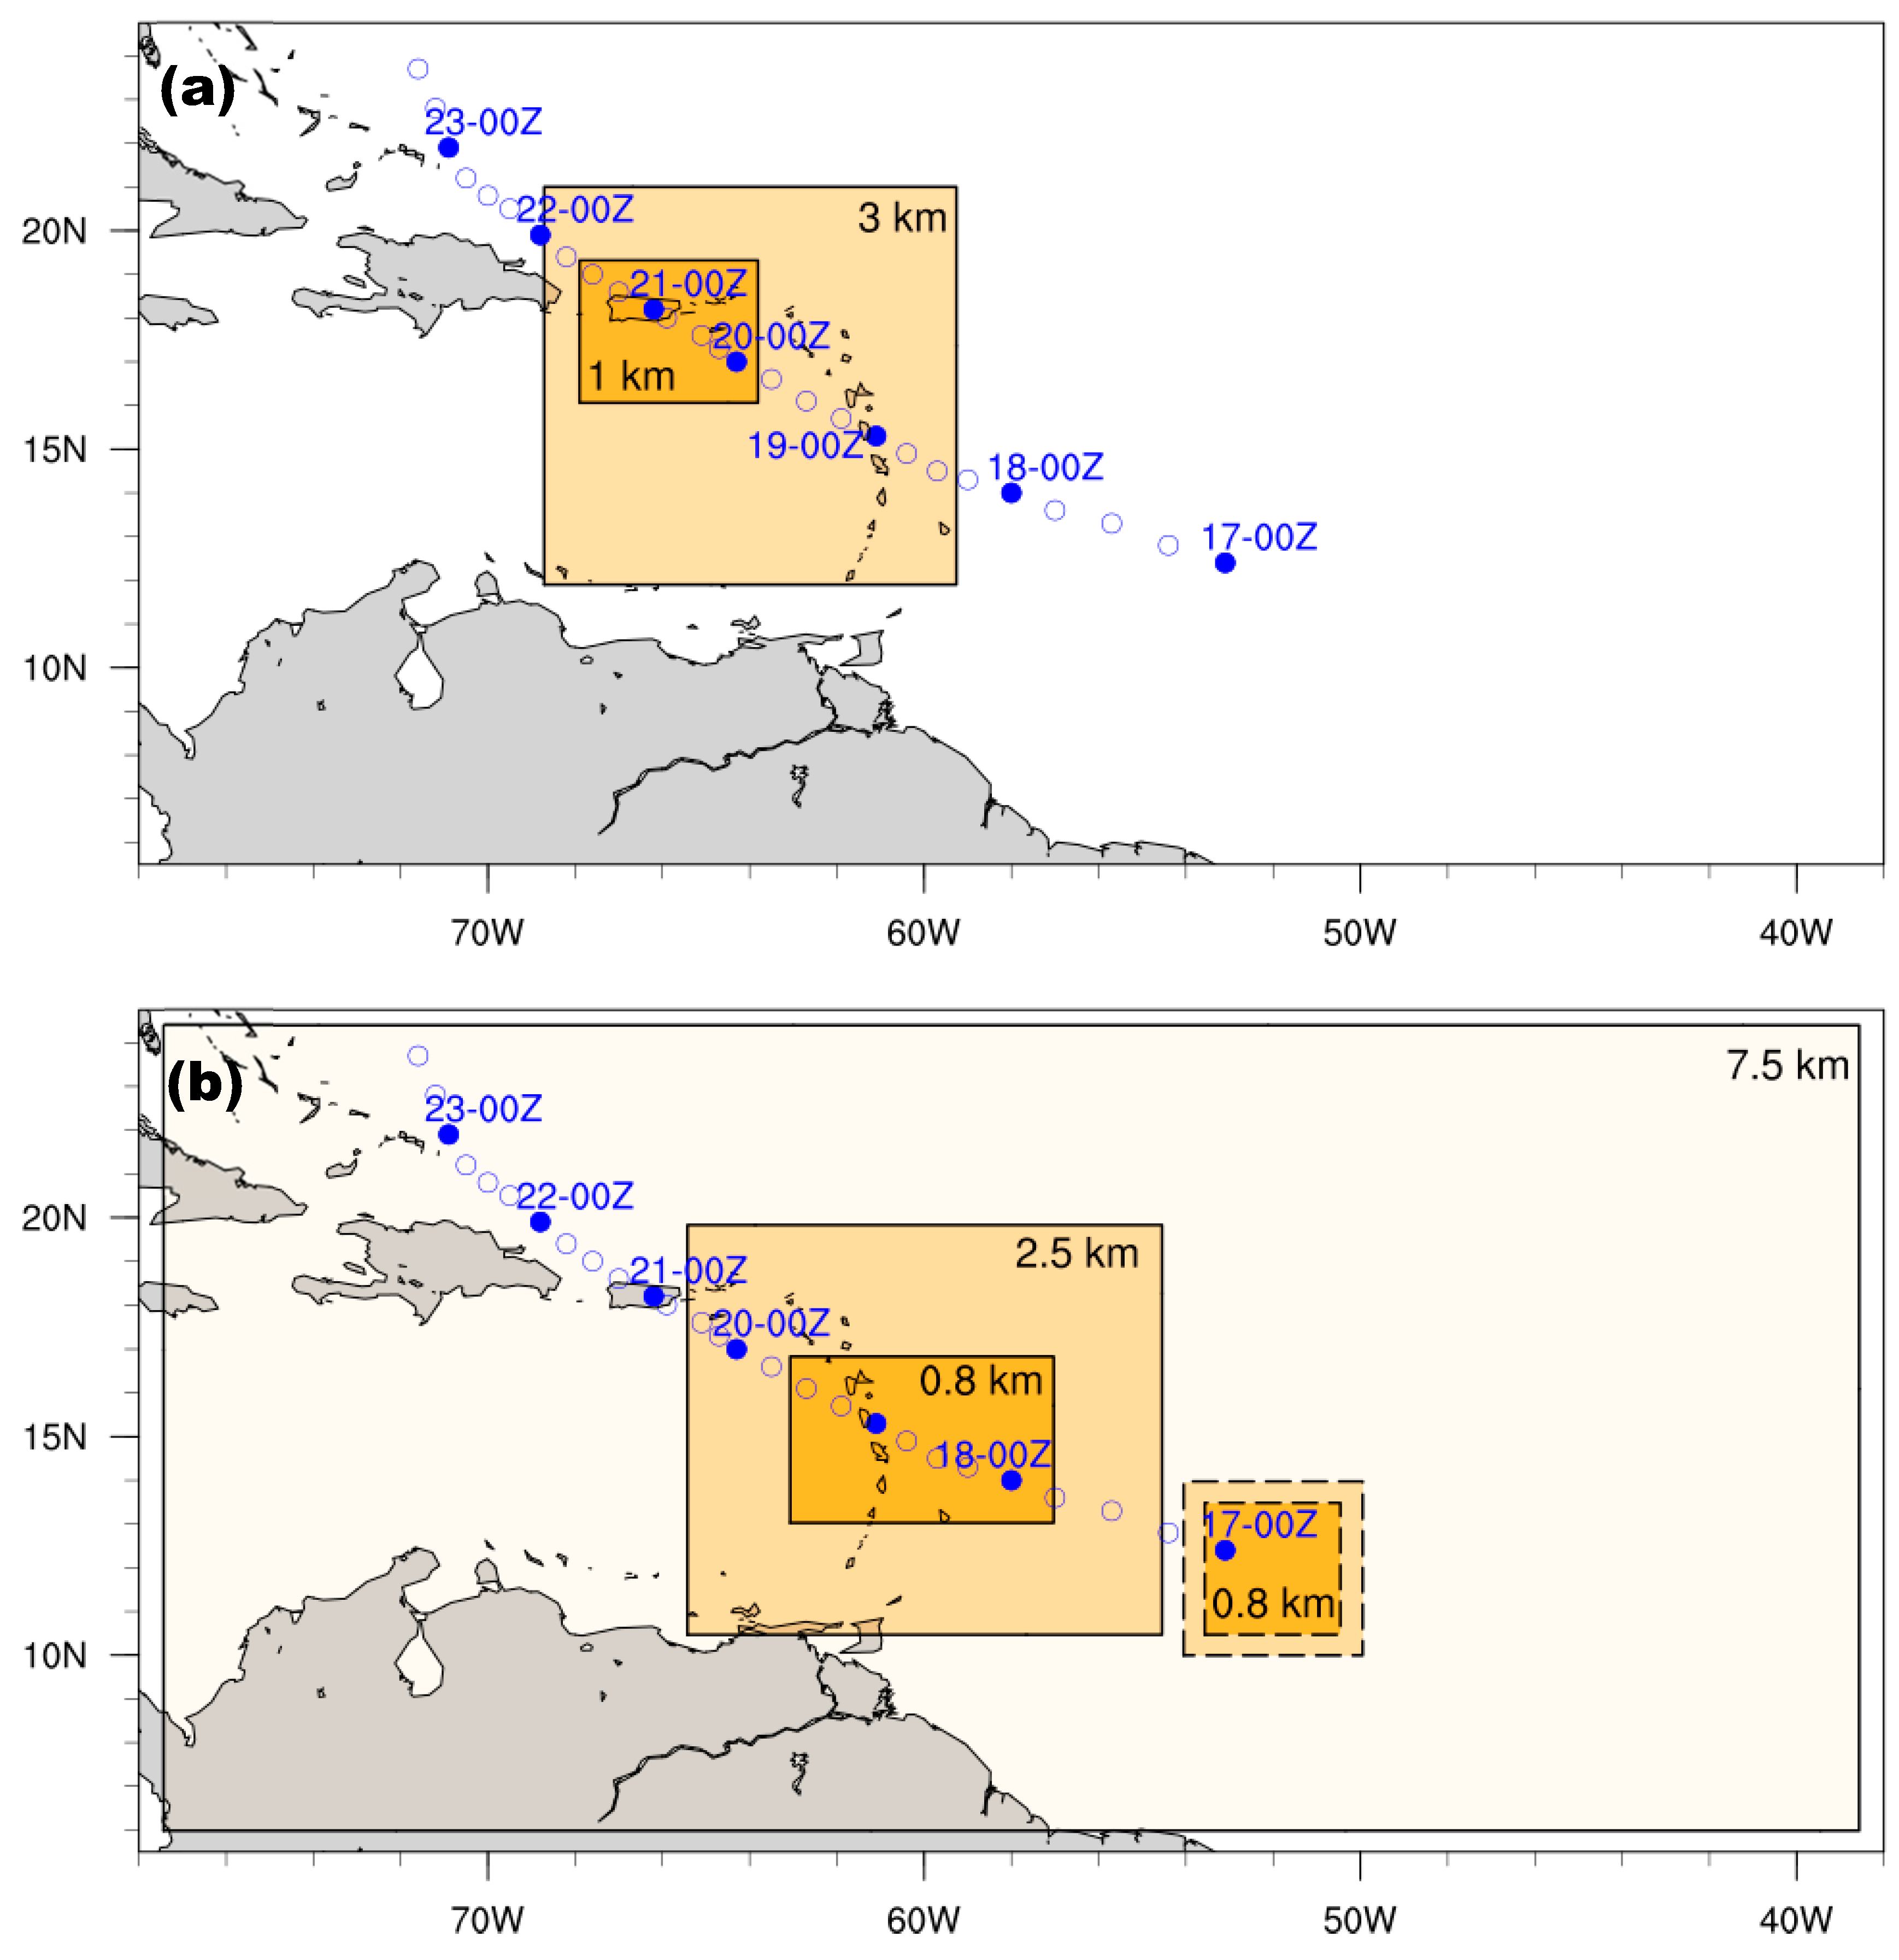
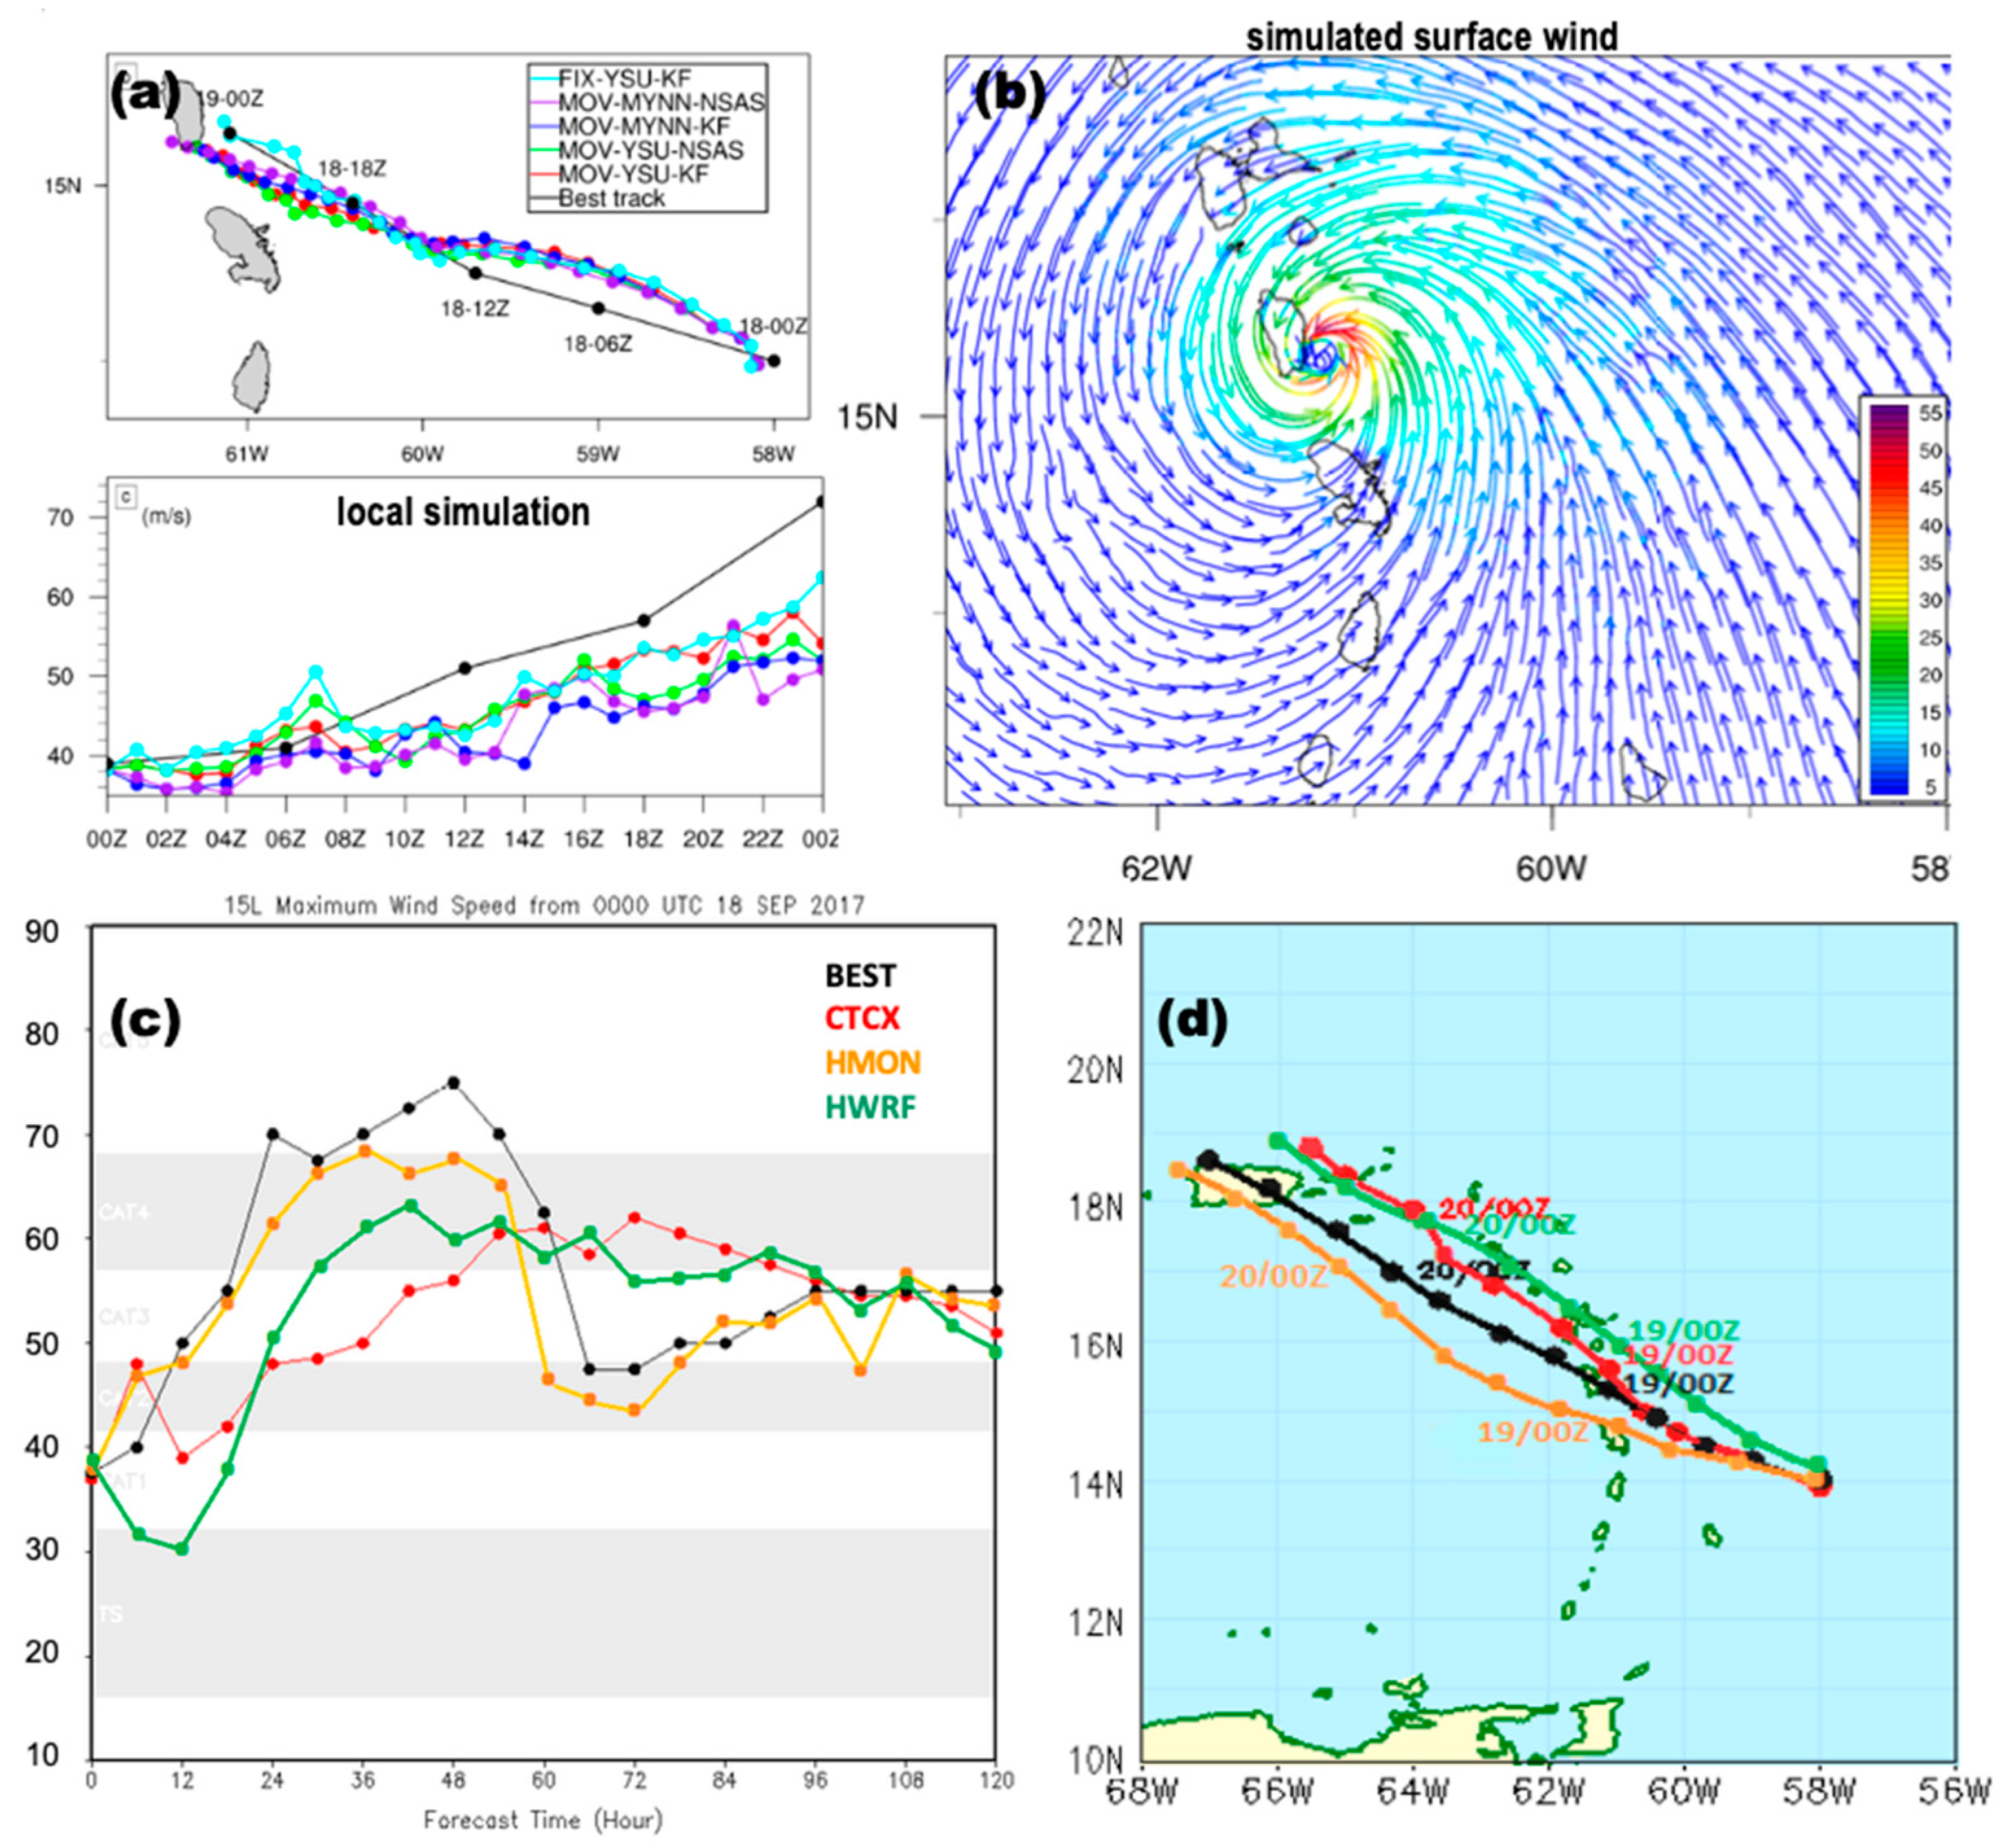
3.3. Dominica Simulation and Forecasts

The Dominica area WRF model experiments show good agreement with NOAA NHC best track during the 24 h of simulation from 00Z 18 to 19 September 2017. The simulated hurricane wandered north then south of track (Figure 8a, Table 2) and under-estimated the intensification of Maria. The static nest with YSU-KF schemes gave strongest winds at the Dominica landfall (Figure 8b, 63 m/s). We also examined forecasts from three operational models (Figure 8c,d) initialized at 00Z 18 September 2017. The HMON intensity forecast valid for 00Z 19 September 2017 (+24 h) had category 4 winds (62 m/s) followed by HWRF (51 m/s). Differences in performance related to north vs. south track bias and the SST gradient (Figure 3c). Landfall was predicted by HWRF (HMON) for Guadeloupe (Martinique), so disaster preparations became uncertain.
Table 3 lists key features of COAMPS initialization data from 17 to 20 September 2017. Storm positions and intensities followed NHC best track (Table 1) but the heading wandered ~10° more than observed. The zonal wind shear changed from +7.3 m/s on 12Z 17 September to −4.5 m/s by 00Z 19 September. The SST and 850 relative vorticity dipped to 28.6 °C and −2 × 10⁻⁵ s−1 on 17 September, suggesting dissipation of storm energy near waters cooled by earlier hurricanes. The SST initialization values were ~1 °C below observed (Figure 2a,c) and contributed to delayed intensification forecasts (Figure 8c). In contrast, precipitable water and 200 hPa divergence remained steady. Cross-correlations between the time series of initialization data (N = 14) reveal that maxWind, SLPmin and 850 vorticity are sensitive to small changes in SST (r = +0.83, −0.85, and +0.82, respectively).

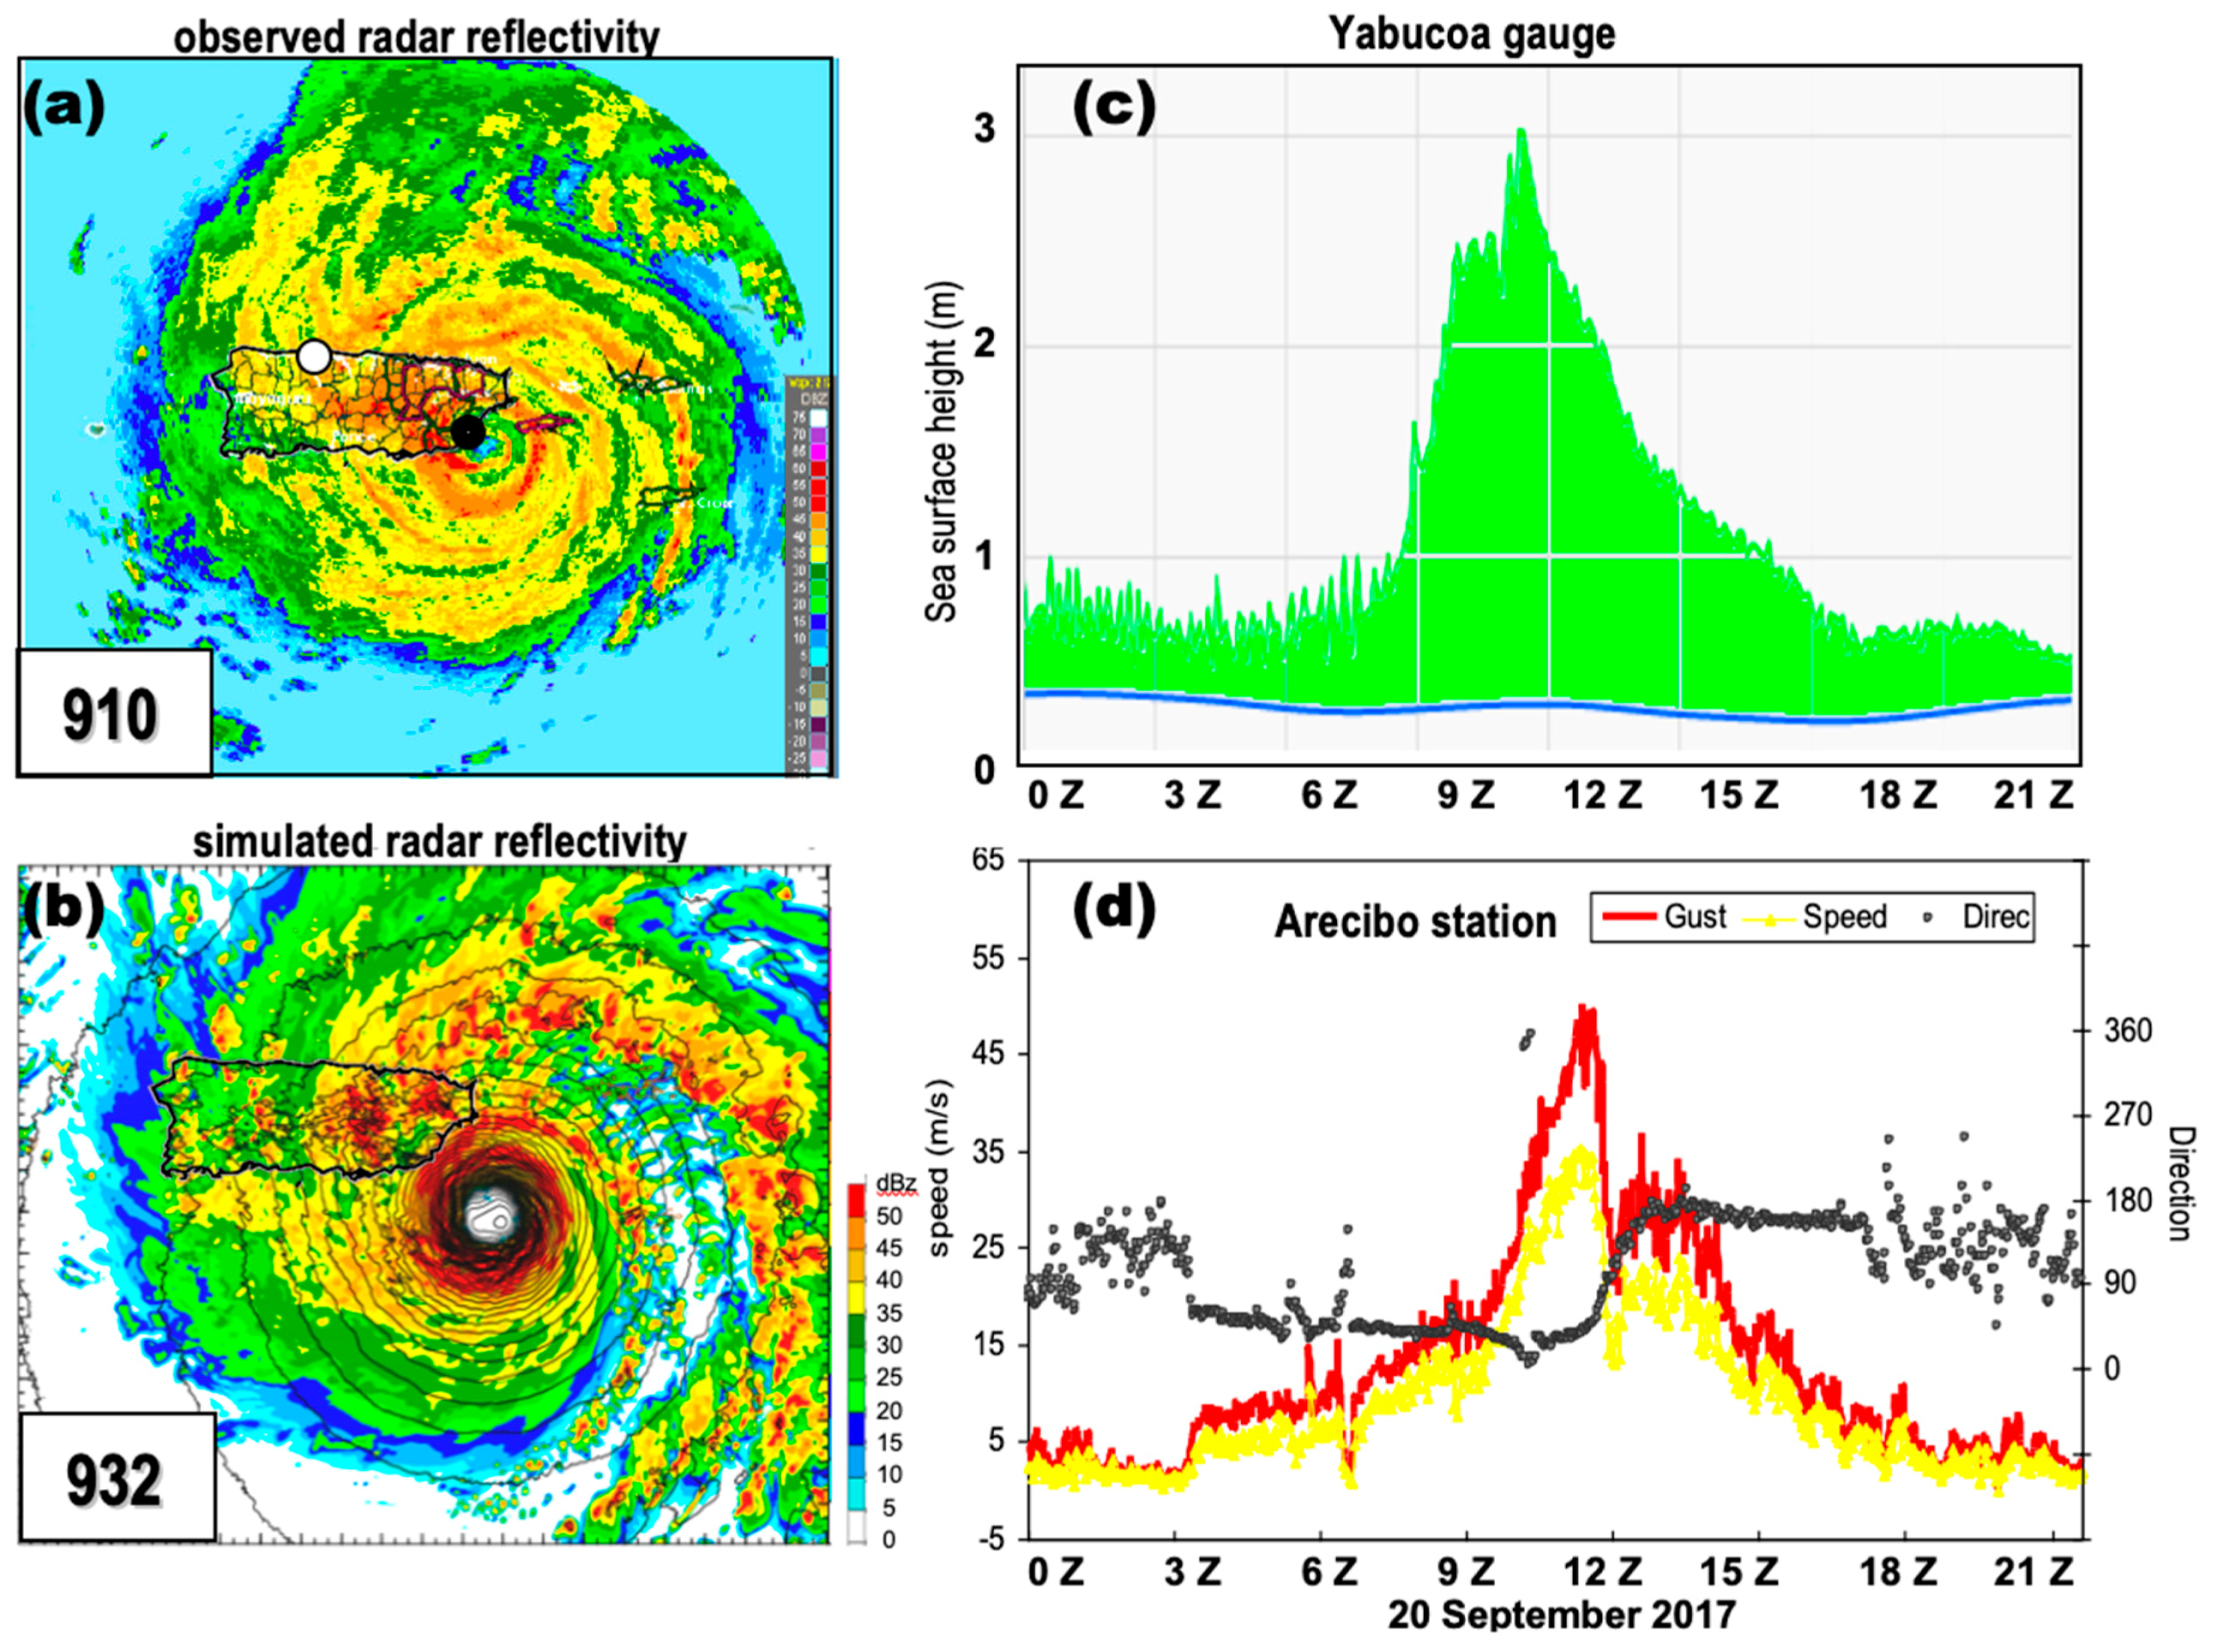
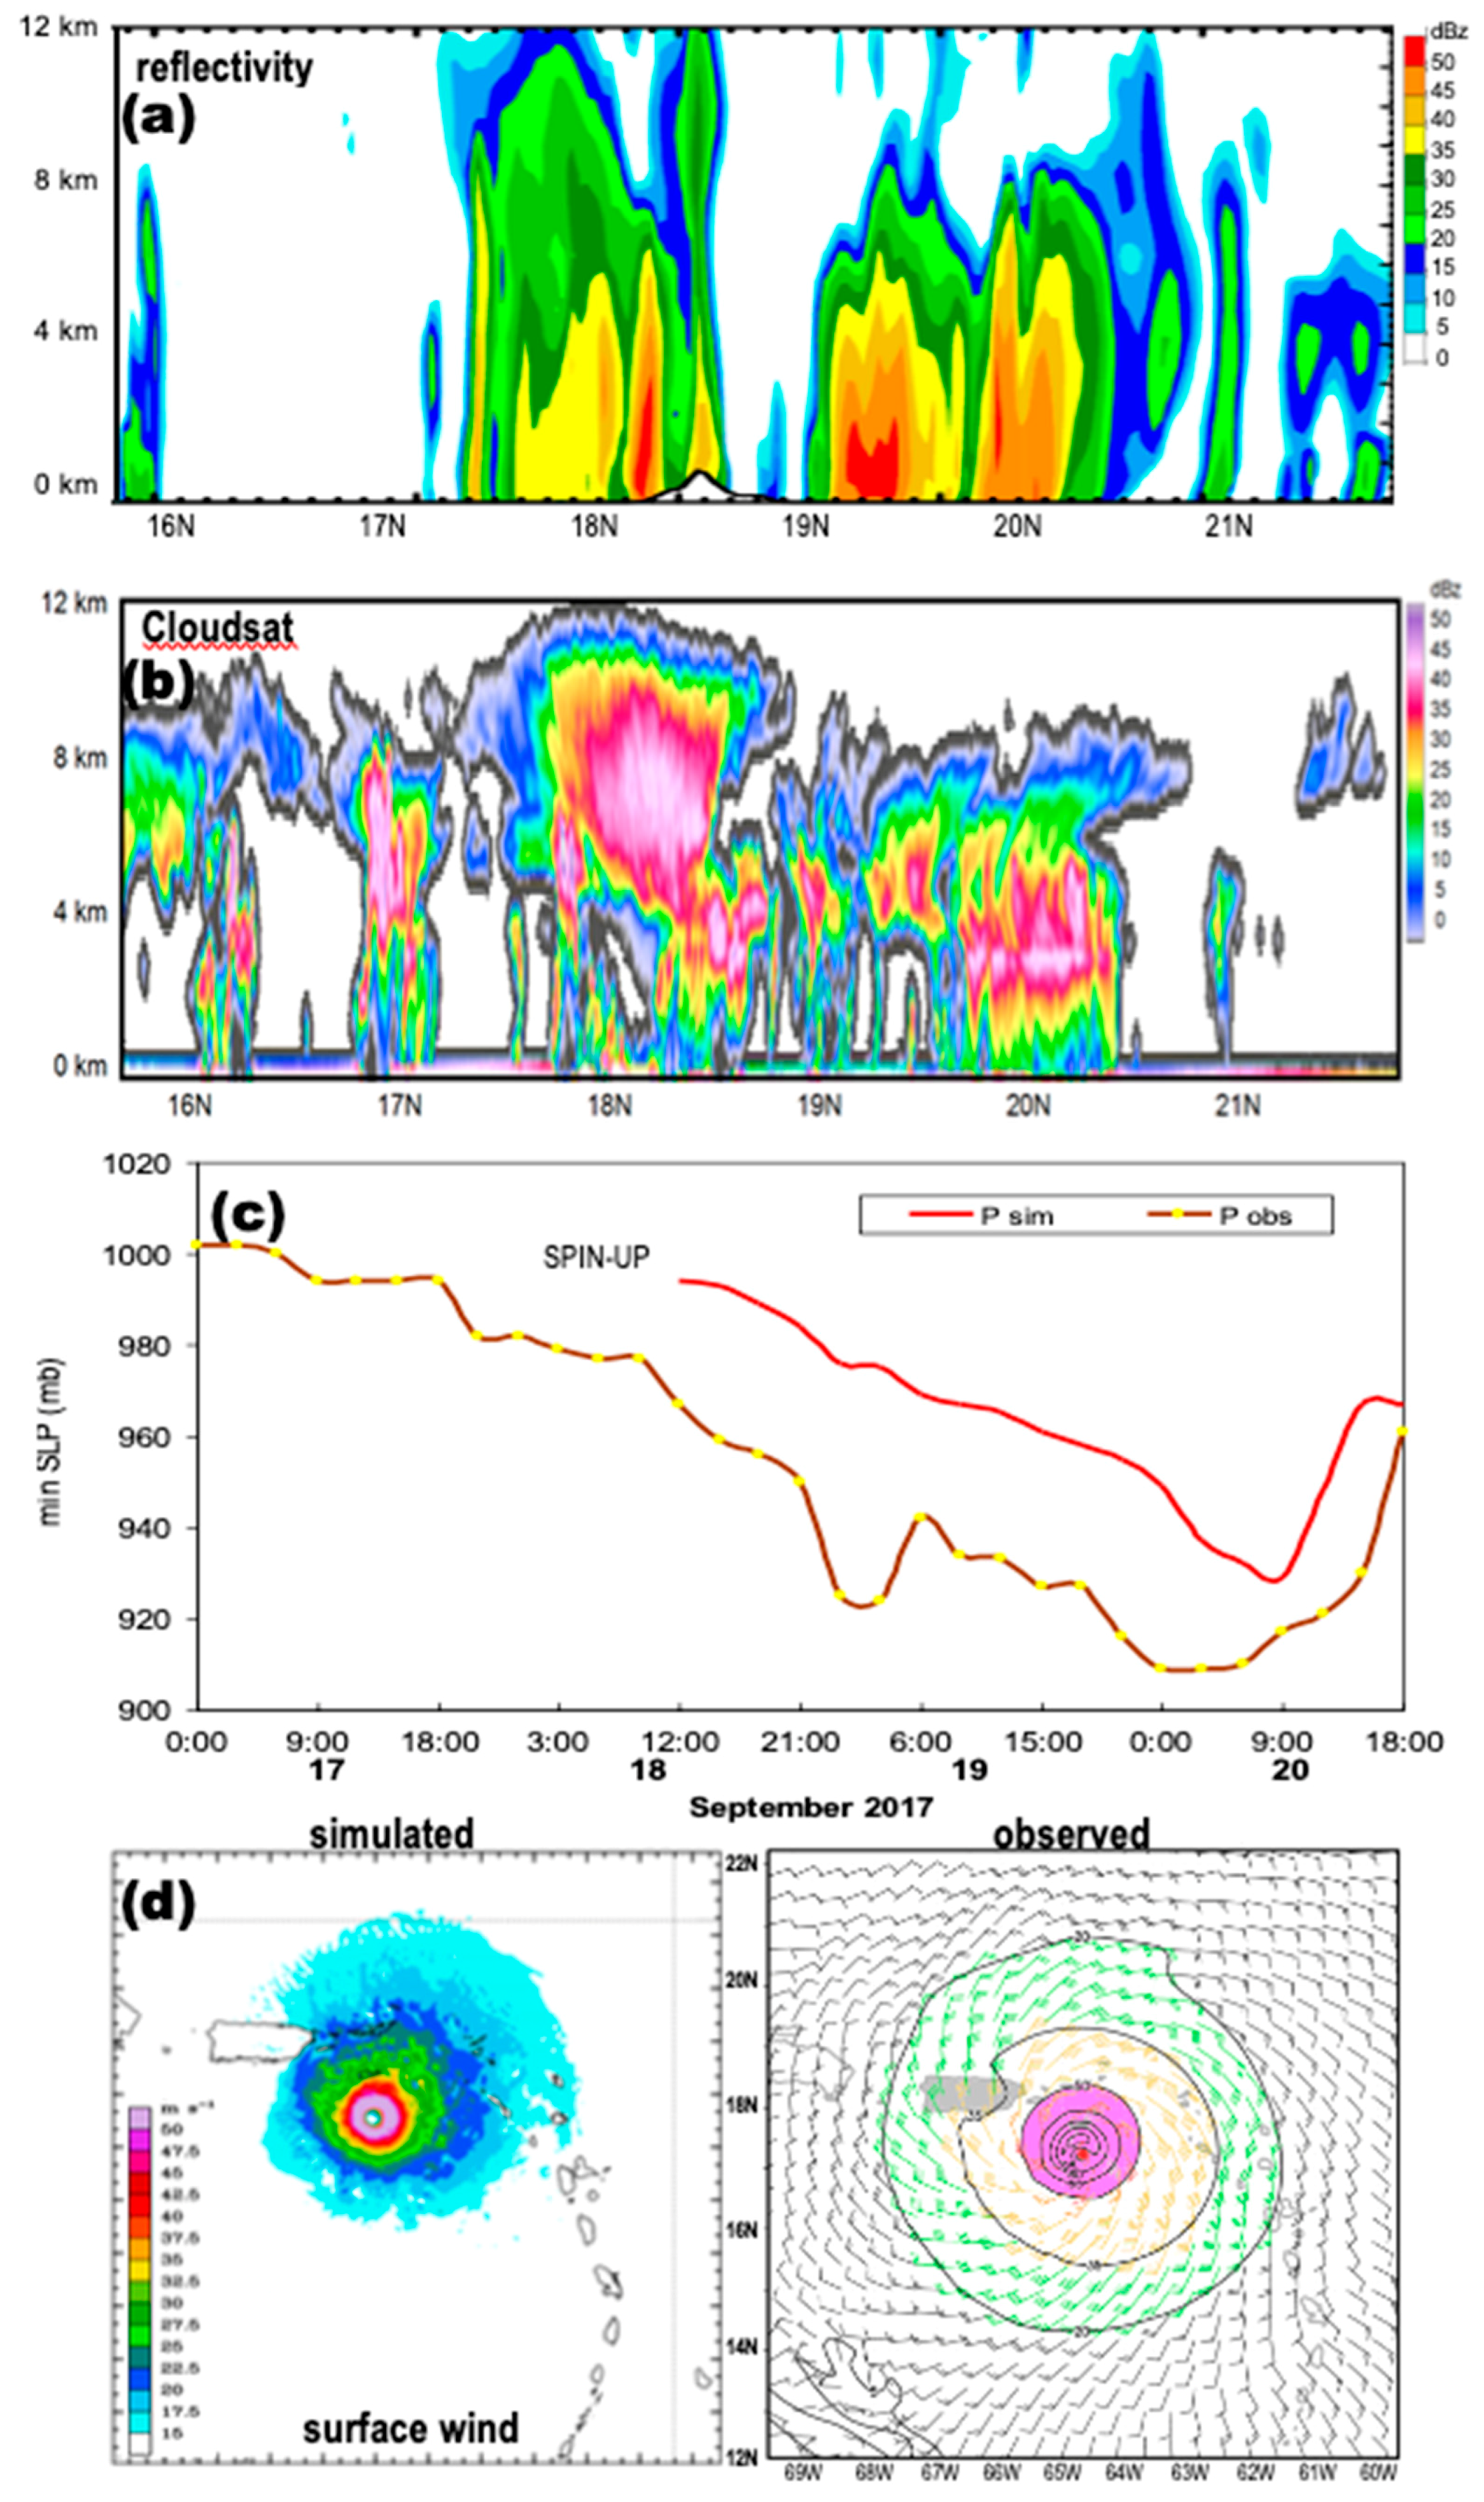
3.4. Structure at PR Landfall

Conditions at landfall in PR (Figure 9a–d) indicate the hurricane had grown in size and intensity. Simulated and observed radar reflectivity show at least two sets of circular cloud bands, consistent with eyewall replacement. 10 m waves and a 3 m storm surge pounded the eastern shore of the island. Winds on the north coast of PR exceeded 45 m/s and indicated the storm remained intense after landfall. The simulated vs. observed central pressure at landfall in PR was 932 hPa vs. 913 hPa, hence the 3-day forecast intensity was still weak but the track was good.
Hurricane Maria’s structure was analyzed by cross sections on 66.5 W at 18Z 20 September (Figure 10a,b). The PR-area WRF forecast radar reflectivity had a deep convection associated with the expanded eyewall after the PR landfall. Cloudsat radar reflectivity measured the deepest convection (>12 km) on the Caribbean (south) side of the hurricane. A noteworthy feature was the discrepancy in the level of maximum reflectivity where WRF had it mostly in the rain areas while CloudSat had it in the upper clouds, probably near sub-freezing. It is suspected that the simulation may not produce enough graupel in the upper clouds, even though the WSM6 scheme included graupel. [53] used satellite microwave sounders to measure Hurricane Maria’s warm core anomaly and found upper tropospheric values of 8–12 °C from 19 to 25 September 2017.

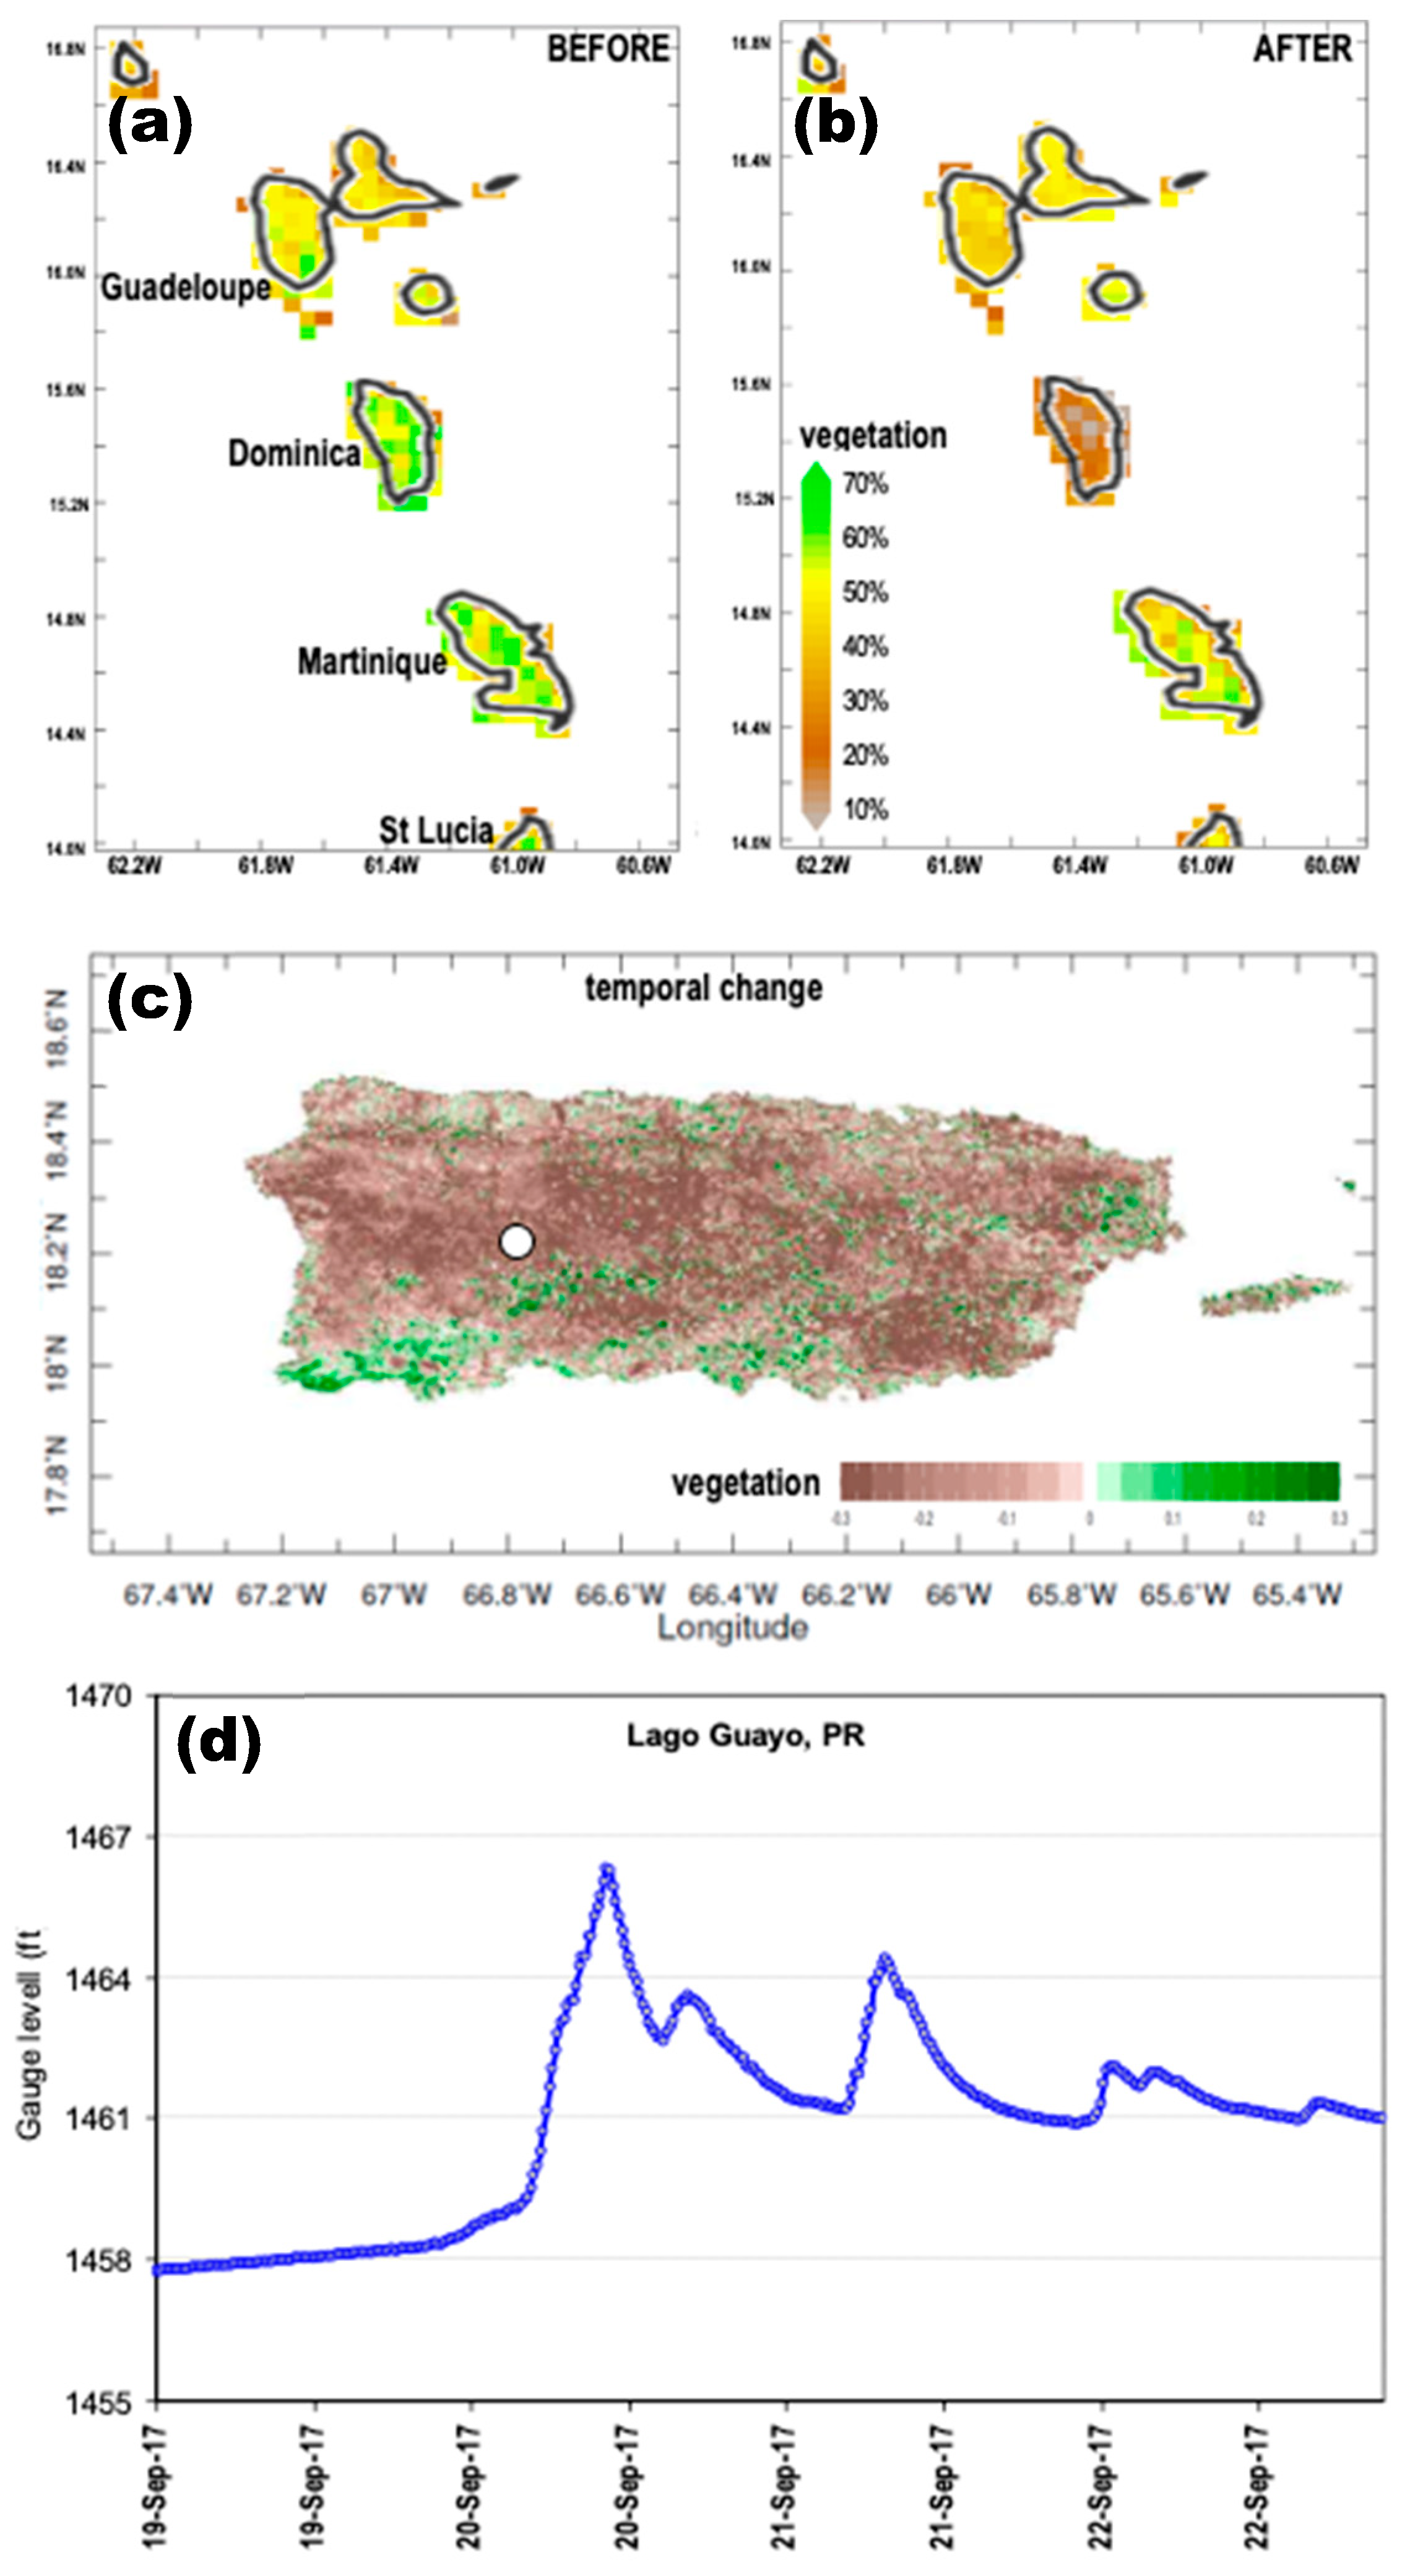
3.5. PR-Area Simulation and Impacts

As mentioned above, 48 h forecasts issued from 16 to 18 September based on a variety of models [20], contained track errors ~30 km to the right, and intensity errors two categories too low. The ECMWF model had the left-most track but lacked intensity. HWRF forecasts caught up with the observed intensity at St Croix VI, with right-of-track errors and strongest winds in the NE quadrant.
Our PR-area WRF simulation with ECMWF initialization at 00Z 17 September 2017 compared with NHC central pressure (Figure 10c) under-predicted the hurricane intensification. The rate of deepening followed observed but central pressure was +30 hPa high. Just before landfall in PR (03Z 20 September) the WRF simulated winds reached 50 m/s, but the diameter was 50% below the CIRA-NHC hindcast (Figure 10d).
The satellite measured vegetation color fraction before and after hurricane passage in Dominica and PR illustrates a 30–50% reduction (Figure 11a–c), due to wind defoliation and uprooting. The change in NDVI (normalized difference vegetation index) appears to quantify hurricane damage rather well. Rainfall accumulated over the central mountains, where USGS measured lake levels and streamflows rose to unprecedented heights (Figure 11d). Landslides exceeded 25 /km2 across half of PR [20], causing a loss of communication, water supply and electricity to ~1 million people for ~3 months, ~3000 deaths, and ~300,000 homes rendered uninhabitable [54].

4. Conclusions

Environmental influences on hurricane Maria in the Antilles Islands have been analyzed at large-scale in the precursor period 1–25 September 2017 and at meso-scale during intensification and landfall 17–20 September 2017. The under-predicted deepening before landfall in Dominica was related to low SST and CAPE on the NE flank, and rapid decline in upper-tropospheric wind shear (Figure 2, Figure 3, Figure 4 and Figure 5, Table 2, Appendix A). As the storm passed St Croix, there was a sudden jump in rain rate (Figure 6c). As shown in SST anomalies, a considerable thermal energy was available near Dominica (~60 W), which was mainly in the SW quadrant of Maria during 18–19 September 2017. Apparently, it was a positive factor that contributed to the rapid intensification of Maria. Hurricane Maria had a deep convection on its southern flank (Figure 10a,b), as destructive winds cut a swath across PR (Figure 11c).
PR-area WRF simulations and operational models contained minimal track errors at multi-day lead times, as expected for a 295° heading close to climatology. Most intensity forecasts lagged 20–30 hPa behind reality (Figure 10c), reaching category 5 by landfall in PR instead of Dominica. Given the delay, multiple experiments were conducted using different initializations, local domains with higher resolution, and alternative model physics. By assimilating a synthetic vortex in a static nest at 0.8 km resolution with YSU/KF schemes, we reduced forecast errors of central pressure on landfall in Dominica by 14 hPa as compared to the 3 km simulation without synthetic vortex initialization. Our key findings pertain to thermodynamic gradients on Maria’s NE flank due to earlier hurricanes Irma and Jose, and rapid evolution of the upper circulation. HWRF (HMON) landfall was predicted for Guadeloupe (Martinique) at one-day lead time, whereas Dominica suffered the impacts. Our WRF simulations had good track but lacked intensity. Category-2 forecasts prior to 18 September 2017 left many Antilles islanders unprepared for the disaster that ensued.

Author Contributions

conceptualization, methodology, M.R.J., S.C., R.C.; validation, M.R.J.; resources, M.R.J., S.C., R.C.; writing—original draft preparation, M.R.J.; writing—review and editing, M.R.J., S.C. and R.C.

Funding

This research was partly funded by the NASA/MUREP NNX15AQ02A and NSF/OAC 1626645.

Acknowledgments

The lead author gained first-hand experience of hurricane Maria impacts in PR. On-going funding from the South African Dept of Education is acknowledged. Data analysis was supported in websites: Univ Hawaii APDRC, Climate Explorer KNMI, COAMPS-TC, ASCAT-Manati, IRI Climate Data Library, NOAA-Ready-ARL (HYSPLIT); local data were provided by the National Weather Service, National Data Buoy Center, and Meteo-France Antilles. Dominica WRF simulations utilized the Intensive Computing Center of Univ French W Indies.

Conflicts of Interest

The authors declare no conflict of interest.

Appendix A

Figure A1. Time series of CFSr2 hourly data averaged in the intensification area (box in Figure 5c) over the period 17–19 September 2017 (top-down): Net LHF and −15 m current, 500 hPa temp and spec hum., −5 m sea temp and salinity, 200 hPa U and V wind, 200–850 hPa (difference) streamfunction, and velocity potential.
Atmosphere 10 00590 g0a1

Appendix B

Figure A2. The WRF simulations for the (a) PR-area: Two nested grids covering the southeastern Caribbean at 3 km and Puerto Rico at 1 km resolution, and (b) Dominica-area: Three domains nested with resolutions of 7.5, 2.5, and 0.8 km, and vortex-following moving nested domains (dashed-lines), respectively. Blue dots represent the best track of Maria.
Atmosphere 10 00590 g0a2

References

  1. Emanuel, K.A. Increasing destructiveness of tropical cyclones over the past 30 years. Nature 2005, 436, 686–688. [Google Scholar] [CrossRef] [PubMed]
  2. Webster, P.J.; Holland, G.J.; Curry, J.A.; Chang, H.-R. Changes in tropical cyclone number, duration, and intensity in a warming environment. Science 2005, 309, 1844–1846. [Google Scholar] [CrossRef] [PubMed]
  3. Aiyyer, A.R.; Thorncroft, C. Climatology of vertical wind shear over the tropical Atlantic. J. Clim. 2006, 19, 2969–2983. [Google Scholar] [CrossRef]
  4. Franklin, J.L.; McAdie, C.J.; Lawrence, M.B. Trends in track forecasting for tropical cyclones threatening the United States, 1970–2001. Bull. Am. Meteorol. Soc. 2003, 84, 1197–1203. [Google Scholar] [CrossRef]
  5. DeMaria, M.; Mainelli, M.; Shay, L.K.; Knaff, J.A.; Kaplan, J. Further improvements to the statistical hurricane intensity prediction scheme (SHIPS). Weather Forecast. 2005, 20, 531–543. [Google Scholar] [CrossRef]
  6. Goerss, J. Tropical cyclone track forecasts using an ensemble of dynamical models. Mon. Weather Rev. 2000, 128, 1187–1193. [Google Scholar] [CrossRef]
  7. Powell, M.D.; Aberson, S.D. Accuracy of United States tropical cyclone landfall forecasts in the Atlantic basin, 1976–2000. Bull. Am. Meteorol. Soc. 2001, 82, 2749–2767. [Google Scholar] [CrossRef]
  8. DeMaria, M.; Knaff, J.A.; Sampson, C. Evaluation of long-term trends in tropical cyclone intensity forecasts. Meteor. Atmos. Phys. 2007, 97, 19–28. [Google Scholar] [CrossRef]
  9. Davis, C.; Wang, W.; Chen, S.S.; Chen, Y.; Corbosiero, K.; DeMaria, M.; Dudhia, J.; Holland, G.; Klemp, J.; Michalakes, J.; et al. Prediction of landfalling hurricanes with the Advanced WRF model. Mon. Weather Rev. 2008, 136, 1990–2005. [Google Scholar] [CrossRef]
  10. Davis, C.; Wang, W.; Dudhia, J.; Torn, R. Does increased horizontal resolution improve hurricane wind forecasts? Weather Forecast. 2010, 25, 1826–1841. [Google Scholar] [CrossRef]
  11. Sitkowski, M.; Kossin, J.P.; Rozoff, C.M. Intensity and structure changes during hurricane eyewall replacement cycles. Mon. Weather Rev. 2011, 139, 3829–3847. [Google Scholar] [CrossRef]
  12. Zhou, X.; Wang, B. Mechanism of concentric eyewall replacement cycles and associated intensity change. J. Atmos. Sci. 2011, 68, 972–988. [Google Scholar] [CrossRef]
  13. Stern, D.P.; Vigh, J.L.; Nolan, D.S.; Zhang, F. Revisiting the relationship between eyewall contraction and intensification. J. Atmos. Sci. 2015, 72, 1283–1306. [Google Scholar] [CrossRef]
  14. Rappaport, E.N.; Jiing, J.G.; Landsea, C.W.; Murillo, S.T.; Franklin, J.L. The Joint Hurricane Testbed—Its first decade of tropical cyclone research-to-operations activities revisited. Bull. Am. Meteorol. Soc. 2012, 93, 371–380. [Google Scholar] [CrossRef]
  15. Cangialosi, J.P.; Landsea, C.W. An examination of model and official National Hurricane Center tropical cyclone size forecasts. Weather Forecast. 2016, 31, 1293–1300. [Google Scholar] [CrossRef]
  16. Kaplan, J.; DeMaria, M.; Knaff, J.A. A revised tropical cyclone rapid intensification index for the Atlantic and eastern North Pacific basins. Weather Forecast. 2010, 25, 220–241. [Google Scholar] [CrossRef]
  17. Wang, H.; Wang, Y. A numerical study of Typhoon Megi (2010): Part I: Rapid intensification. Mon. Weather Rev. 2014, 124, 29–48. [Google Scholar] [CrossRef]
  18. Rogers, R.; Reasor, P.; Lorsolo, S. Airborne Doppler observations of the inner-core structural differences between intensifying and steady-state tropical cyclones. Mon. Weather Rev. 2013, 141, 2970–2991. [Google Scholar] [CrossRef]
  19. Fovell, R.G.; Corbosiero, K.L.; Kuo, H.C. Cloud microphysics impact on hurricane track as revealed in idealized experiments. J. Atmos. Sci. 2009, 66, 1764–1778. [Google Scholar] [CrossRef]
  20. Pasch, R.J.; Penny, A.B.; Berg, R. Hurricane Maria 2017; Tropical Cyclone Report; National Hurricane Center: Miami, FL, USA, 5 April 2018; p. 48. Available online: www.nhc.noaa.gov/data/tcr/AL152017_Maria.pdf (accessed on 20 August 2019).
  21. Jin, H.; Peng, M.S.; Jin, Y.; Doyle, J.D. An evaluation of the impact of horizontal resolution on tropical cyclone predictions using COAMPS-TC. Weather Forecast. 2014, 29, 252–270. [Google Scholar] [CrossRef]
  22. Alaka, G.J.; Zhang, X.; Gopalakrishnan, S.G.; Goldenberg, S.B.; Marks, F.D. Performance of basin-scale HWRF tropical cyclone track forecasts. Weather Forecast. 2017, 32, 1253–1271. [Google Scholar] [CrossRef]
  23. Doyle, J.D.; Moskaitis, J.; Hodur, R.; Chen, S.; Jin, H.; Jin, Y.; Komaromi, W.; Reinecke, A.; Wang, S. COAMPS-TC Status and Future Plans. In Proceedings of the 2018 Tropical Cyclone Operations and Research Forum (TCORF)/72nd Interdepartmental Hurricane Conference (IHC), Miami, FL, USA, 13–15 March 2018. [Google Scholar]
  24. Liu, B.; Mehra, A.; Zhang, Z.; Abarca, S.; Dong, J.; Iredell, D.; Kim, H.-S.; Liu, Q.; Ma, Z.; Sheinin, D.; et al. Verification of 2017 HWRF and HMON performances. In Proceedings of the HFIP Annual Review Meeting, Miami, FL, USA, 8 November 2017. [Google Scholar]
  25. Landsea, C.W.; Franklin, J.L. Atlantic hurricane database uncertainty and presentation of a new database format. Mon. Weather Rev. 2013, 141, 3576–3592. [Google Scholar] [CrossRef]
  26. Joyce, R.J.; Janowiak, J.E.; Arkin, P.A.; Xie, P. CMORPH: A method that produces global precipitation estimates from passive microwave and infrared data at high spatial and temporal resolution. J. Hydrometeor. 2004, 5, 487–503. [Google Scholar] [CrossRef]
  27. Huffman, G.; Bolvin, D.T.; Braithwaite, D.; Hsu, K.; Joyce, R.; Kidd, C.; Nelkin, E.J.; Sorooshian, S.; Tan, J.; Xie, P. NASA Global Precipitation Measurement (GPM) Integrated Multi-Satellite Retrievals V5; Theoretical Basis Document; GSFC: Washington, DC, USA, 7 February 2018; p. 95. Available online: https://pmm.nasa.gov/resources/documents/gpm-integrated-multi-satellite-retrievals-gpm-imerg-algorithm-theoretical-basis- (accessed on 20 August 2019).
  28. Dee, D.P.; Uppala, S.M.; Simmons, A.J.; Berrisford, P.; Poli, P.; Kobayashi, S.; Andrae, U.; Balmaseda, M.A.; Balsamo, G.; Bauer, D.P.; et al. The ERA-interim reanalysis: Configuration and performance of the data assimilation system. Q. J. R. Meteorol. Soc. 2011, 137, 553–597. [Google Scholar] [CrossRef]
  29. Gelaro, R.; McCarty, W.; Suárez, M.J.; Todling, R.; Molod, A.; Takacs, L.; Randles, C.A.; Darmenov, A.; Bosilovich, M.G.; Reichle, R.; et al. The Modern-era retrospective analysis for research and applications, version 2 (MERRA2). J. Clim. 2017, 30, 5419–5454. [Google Scholar] [CrossRef]
  30. Reynolds, R.W.; Smith, T.M.; Liu, C.; Chelton, D.B.; Casey, K.S.; Schlax, M.G. Daily high-resolution-blended analyses for sea surface temperature. J. Clim. 2007, 20, 5473–5496. [Google Scholar] [CrossRef]
  31. Chassignet, E.P.; Hurlburt, H.E.; Metzger, E.J.; Smedstad, O.M.; Cummings, J.A.; Halliwell, G.R.; Bleck, R.; Baraille, R.; Wallcraft, A.J.; Lozano, C.; et al. US GODAE: Global ocean prediction with the Hybrid coordinate ocean model (Hycom). Oceanography 2009, 22, 64–75. [Google Scholar] [CrossRef]
  32. Wilson, J.J.W.; Anderson, C.; Baker, M.A.; Bonekamp, H.; Saldana, J.F.; Dyer, R.G.; Lerch, J.A.; Kayal, G.; Gelsthorpe, R.V.; Brown, M.A.; et al. Radiometric calibration of the advanced wind scatterometer radar ASCAT carried onboard the METOP-A satellite. IEEE Trans. Geosci. Remote Sens. 2010, 48, 3236–3255. [Google Scholar] [CrossRef]
  33. NOAA. The Meteorological Buoy and Coastal Marine Automated Network for the United States; National Academy Press: Washington, DC, USA, 1998; pp. 13–24.
  34. IOC. The Global Sea-Level Observing System (GLOSS): Implementation Plan; Technical Series 100; UNESCO: Paris, France, 2012; p. 48. Available online: unesdoc.unesco.org/images/0021/002178/217832e.pdf (accessed on 20 August 2019).
  35. Tolman, H.L. User Manual and System Documentation of WAVEWATCH-III; Technical Note; NCEP: Washington, DC, USA, 2002; p. 139.
  36. Stephens, G.L.; Vane, D.G.; Boain, R.J.; Mace, G.G.; Sassen, K.; Wang, Z.; Illingworth, A.J.; O’connor, E.J.; Rossow, W.B.; Durden, S.L.; et al. The Cloudsat mission and the A-train: A new dimension of space-based observations of clouds and precipitation. Bull. Am. Meteorol. Soc. 2002, 83, 1771–1790. [Google Scholar] [CrossRef]
  37. Tucker, C.J.; Pinzon, J.E.; Brown, M.E.; Slayback, D.A.; Pak, E.W.; Mahoney, R.; Vermote, E.F.; El Saleous, N. An extended AVHRR 8 km NDVI dataset compatible with MODIS and SPOT vegetation data. Int. J. Remote Sens. 2005, 26, 4485–4498. [Google Scholar] [CrossRef]
  38. Hazelton, A.T.; Bender, M.; Morin, M.; Harris, L.; Lin, S. 2017 Atlantic Hurricane Forecasts from a high-resolution version of the GFDL fvGFS model: Evaluation of track, intensity, and structure. Weather Forecast. 2018, 33, 1317–1337. [Google Scholar] [CrossRef]
  39. Saha, S.; Moorthi, S.; Pan, H.L.; Wu, X.; Wang, J.; Nadiga, S.; Tripp, P.; Kistler, R.; Woollen, J.; Behringer, D.; et al. The NCEP Climate Forecast System reanalysis. Bull. Am. Meteorol. Soc. 2010, 91, 1015–1057. [Google Scholar] [CrossRef]
  40. Saha, S.; Moorthi, S.; Wu, X.; Wang, J.; Nadiga, S.; Tripp, P.; Behringer, D.; Hou, Y.T.; Chuang, H.Y.; Iredell, M.; et al. The NCEP Climate Forecast System version 2. J Clim. 2014, 27, 2185–2208. [Google Scholar] [CrossRef]
  41. Davis, C.; Wang, W.; Cavallo, S.; Done, J.; Dudhia, J.; Fredrick, S.; Michalakes, J.; Caldwell, G.; Engel, T.; Ghosh, S.; et al. 2010: High-resolution Hurricane Forecasts. Comput. Sci. Eng. 2011, 13, 22, CISESI-2010-03-0023. [Google Scholar] [CrossRef]
  42. Hong, S.; Lim, J. The WRF Single-Moment 6-Class Microphysics Scheme (WSM6). J. Korean Meteorol. Soc. 2006, 42, 129–151. [Google Scholar]
  43. Hong, S.-Y.; Noh, Y.; Dudhia, J. A new vertical diffusion package with an explicit treatment of entrainment processes. Mon. Weather Rev. 2006, 134, 2318–2341. [Google Scholar] [CrossRef]
  44. Iacono, M.J.; Delamere, J.S.; Mlawer, E.J.; Shephard, M.W.; Clough, S.A.; Collins, W.D. Radiative forcing by long-lived greenhouse gases: Calculations with the AER radiative transfer models. J. Geophys. Res. 2008, 113, D13103. [Google Scholar] [CrossRef]
  45. Knaff, J.A.; Longmore, S.P.; DeMaria, R.T.; Molenar, D.A. Improved tropical-cyclone flight-level wind estimates using routine infrared satellite reconnaissance. J. Appl. Meteorol. Clim. 2015, 54, 463–478. [Google Scholar] [CrossRef]
  46. Kain, J.S. The Kain–Fritsch convective parameterization: An update. J. Appl. Meteorol. 2004, 43, 170–181. [Google Scholar] [CrossRef]
  47. Han, J.; Pan, H. Revision of convection and vertical diffusion schemes in the NCEP global forecast system. Weather Forecast. 2011, 26, 520–533. [Google Scholar] [CrossRef]
  48. Nakanishi, M.; Niino, H. An improved Mellor–Yamada level-3 model: Its numerical stability and application to a regional prediction of advection fog. Bound. Layer Meteorol. 2006, 119, 397–407. [Google Scholar] [CrossRef]
  49. Wang, X.; Barker, D.M.; Snyder, C.; Hamill, T.N. A hybrid ETKF–3DVAR data assimilation scheme for the WRF model. part I: Observing system simulation experiment. Mon. Weather Rev. 2008, 136, 5116–5131. [Google Scholar] [CrossRef]
  50. Holland, G.J. An analytic model of the wind and pressure profiles in hurricanes. Mon. Weather Rev. 1980, 108, 1212–1218. [Google Scholar] [CrossRef]
  51. Krien, Y.; Arnaud, G.; Cécé, R.; Ruf, C.; Belmadani, A.; Khan, J.; Bernard, D.; Islam, A.; Durand, F.; Testut, L.; et al. Can we improve parametric cyclonic wind fields using recent satellite remote sensing data? Remote Sens. 2018, 10, 1963. [Google Scholar] [CrossRef]
  52. Green, B.W.; Zhang, F. Impacts of air–sea flux parameterizations on the intensity and structure of tropical cyclones. Mon. Weather Rev. 2013, 141, 2308–2324. [Google Scholar] [CrossRef]
  53. Tian, X.; Zou, X. Capturing size and intensity changes of Hurricanes Irma and Maria (2017) from polar-orbiting satellite microwave radiometers. J. Atmos. Sci. 2018, 75, 2509–2522. [Google Scholar] [CrossRef]
  54. George Washington University. Ascertainment of the Estimated Excess Mortality from Hurricane Maria in Puerto Rico; George Washington University: Washington, DC, USA, 2018; p. 69. [Google Scholar]
Figure 1. Hovmoller plots 1–25 September 2017 averaged 12–18N of: (a) CMORPH rainfall (mm/hr), (b) 850 hPa meridional wind (m/s), (c) HYCOM sea surface temperature (SST; °C), and (d) surface salinity (ppt). In (d): Dominica longitude (arrow), edge of low salinity zone (dashed), and hurricane Maria (icon); time goes up.
Atmosphere 10 00590 g001
Figure 2. Pre-hurricane 5–15 September 2017 averaged: (a) Satellite SST and hurricane Maria 12-h positions from 00Z 18 September to 00Z 20 September (dots); (b) surface salinity and currents (vector) with arrow for N-S depth section on 60 W: (c) Sea temperature, and (d) salinity with meridional circulation (vector) from HYCOM reanalysis.
Atmosphere 10 00590 g002
Figure 3. Pre-hurricane 5–15 September 2017 averaged: (a) Latent heat flux anomaly (W m−2), (b) 925 hPa wind potential vorticity (PVU), and (c) satellite SST anomalies (°C). (d) Back-trajectories arriving at 500 m, 15.5 N, 61 W (dot in c) in a 36 h period, from 18Z 17 September to 06Z 19 September 2017; and CAPE (shaded, J/kg).
Atmosphere 10 00590 g003
Figure 4. MERRA2 reanalysis fields at (a) 0 Z 12 September, (b) 15 September 2017, and (c) 18 September 2017, of 500 hPa specific humidity (shaded <1.4 g/kg), and 300 hPa wind (vector). Hurricane labeled in (c).
Atmosphere 10 00590 g004
Figure 5. Maps of (a) 150 hPa winds, (b) 100 hPa temperature, and (c) 150 hPa ozone mixing ratio (shaded <0.06 ppm), (upper) 0Z 17 September and (lower) 00Z 20 September 2017. Island labels and Maria intensification area shown by box in (c) upper. CFSr2 time series appear in the Appendix A.
Atmosphere 10 00590 g005
Figure 6. Intercomparison of rainfall estimates averaged 17–20 September from (a) ECMWF S-5, (b) CMORPH, and (c) GPM merged; all with the same scale mm/day. Dashed line connects Dominica and PR for reference.
Atmosphere 10 00590 g006
Figure 7. Scatterometer winds on (a) 0Z and (b) 12Z 19 September 17 of Maria passing the Antilles. (c) 17–20 September 2017 averaged maximum Wavewatch3 reanalysis wave height. (d) Temporal record of winds at W. Guadeloupe NDBC buoy. (e) WRF simulated and (f) MeteoFrance observed radar reflectivity at 00Z 19 September 2017, with central pressure values inset.
Atmosphere 10 00590 g007
Figure 8. Dominica area WRF 0.8 km simulations from 00Z 18 September initialization: (a) Track map and (lower) maximum wind for five experiments with inner nest-3 vs. NHC observed, (b) WRF simulated wind (m/s) at 00Z 19 September 2017 for FIX-YSU-KF. Operational model forecasts from 00 Z 18 September 2017 vs. NHC observed: (c) Maximum wind speed (m/s) and (d) track map.
Atmosphere 10 00590 g008
Figure 9. Maria Puerto Rico (PR) landfall 10Z 20 September 2017 maps of: (a) National Weather Service (NWS) radar reflectivity with central pressure labeled, (b) PR-area WRF simulated radar reflectivity and isobars (contour). Temporal records: (c) Sea surface height at Yabucoa harbor (closed dot in a), and (d) wind at Arecibo harbor (open dot in a); both with the same time axis.
Atmosphere 10 00590 g009
Figure 10. Vertical N-S sections on 66.5W longitude at 18Z September 20 2017 of (a) PR-area WRF +84 h forecast radar reflectivity, and (b) Cloudsat reflectivity (scales vary). (c) PR-area WRF simulated and NHC observed minimum pressure (cf. Table 1). (d) Surface wind maps at 03Z 20 September: PR-area WRF simulation (left) and CIRA-NHC hindcasts (>50 m/s pink shaded).
Atmosphere 10 00590 g010
Figure 11. Comparison of satellite vegetation color fraction (NDVI) around Dominica: (a) Aug 2017 and (b) Oct 2017. (c) Same but NDVI change over PR: 1–15 Oct 2017 minus 1–15 September 2017. (d) USGS lake level record at Guayo, PR (dot in (c)).
Atmosphere 10 00590 g011
Table 1. Hurricane Maria National Hurricane Center (NHC) data, rapid intensification in bold. reg P sim = PR-area weather research and forecasting (WRF) simulation initialized 00Z 17 September 2017.
Day
(September)
Time (Z)LatLonWind
(kt)
P obs
(mb)
RegP sim
(mb)
170:0012.453.1451002
176:0012.854.455994
1712:0013.355.760990
1718:0013.657.065986
180:0014.058.075979
186:0014.359.080977
1812:0014.559.7100967994
1818:0014.960.4110956989
190:0015.361.1145924976
196:0015.761.9135940969
1912:0016.162.7140931965
1918:0016.663.5145920958
200:0017.064.3150909949
206:0017.665.1140913932
2012:0018.266.2115935948
2018:0018.667.095959967
Table 2. Model results for the Dominica landfall experiments.
MOV-MYNN-NSASMOV-MYNN- KFMOV-YSU-NSASMOV-YSU-KFFIX-YSU- KF
24H-MEAN TRACK ERROR (KM)2520201921
00Z 19 TRACK ERROR (KM)362022188
24H-MEAN INTENSITY BIAS (M/S)−9−9−7−6−4
00Z 19 INTENSITY BIAS (M/S)−21−20−20−18−10
Table 3. Storm-following initialization data employed in COAMPS-CTCX forecasts. Bold numbers refer to low values of SST and 850 hPa vorticity.
Initialization Data17-Sep06Z12Z18Z18-Sep06Z12Z18Z19-Sep06Z12Z18Z20-Sep06Z
LAT (deg)12.112.713.213.513.914.314.414.815.215.81616.516.917.5
LON (deg)−53.2−54.3−55.7−57−58−59−59.7−60.4−61.1−62.1−62.7−63.6−64.3−65.1
maxWind (knot)40555464747897107136130135140145135
Radius (km)564997100969912111914596118143138143
SLP_min (hPa)1008996997987978974955944916921917910903914
Shear U (knot)0.64.07.35.06.55.61.6−3.2−4.5−1.2−1.9−3.9−1.53.6
H_spd (knot)91012710885759799
H_hdg (deg)285301291276288281299301297309304300304300
SST (degC)29.128.628.728.828.928.72929.429.429.429.429.529.529.5
Prec Wtr (mm)5757585858585960585858595757
850 vort (e5/sec)190−2142217721232127404762
200 div (e5/sec)48463959554754103928279645840

