Age-Related Alterations Affecting the Chondrogenic Differentiation of Synovial Fluid Mesenchymal Stromal Cells in an Equine Model


Abstract
1. Introduction
2. Materials and Methods
2.1. Isolation of Equine SfMSCs
2.2. mRNA Expression of Mesenchymal and Self-Renewal Markers by RT-PCR and Real-Time PCR
2.3. BrdU Proliferation Assay
2.4. Cell Cycle Analysis
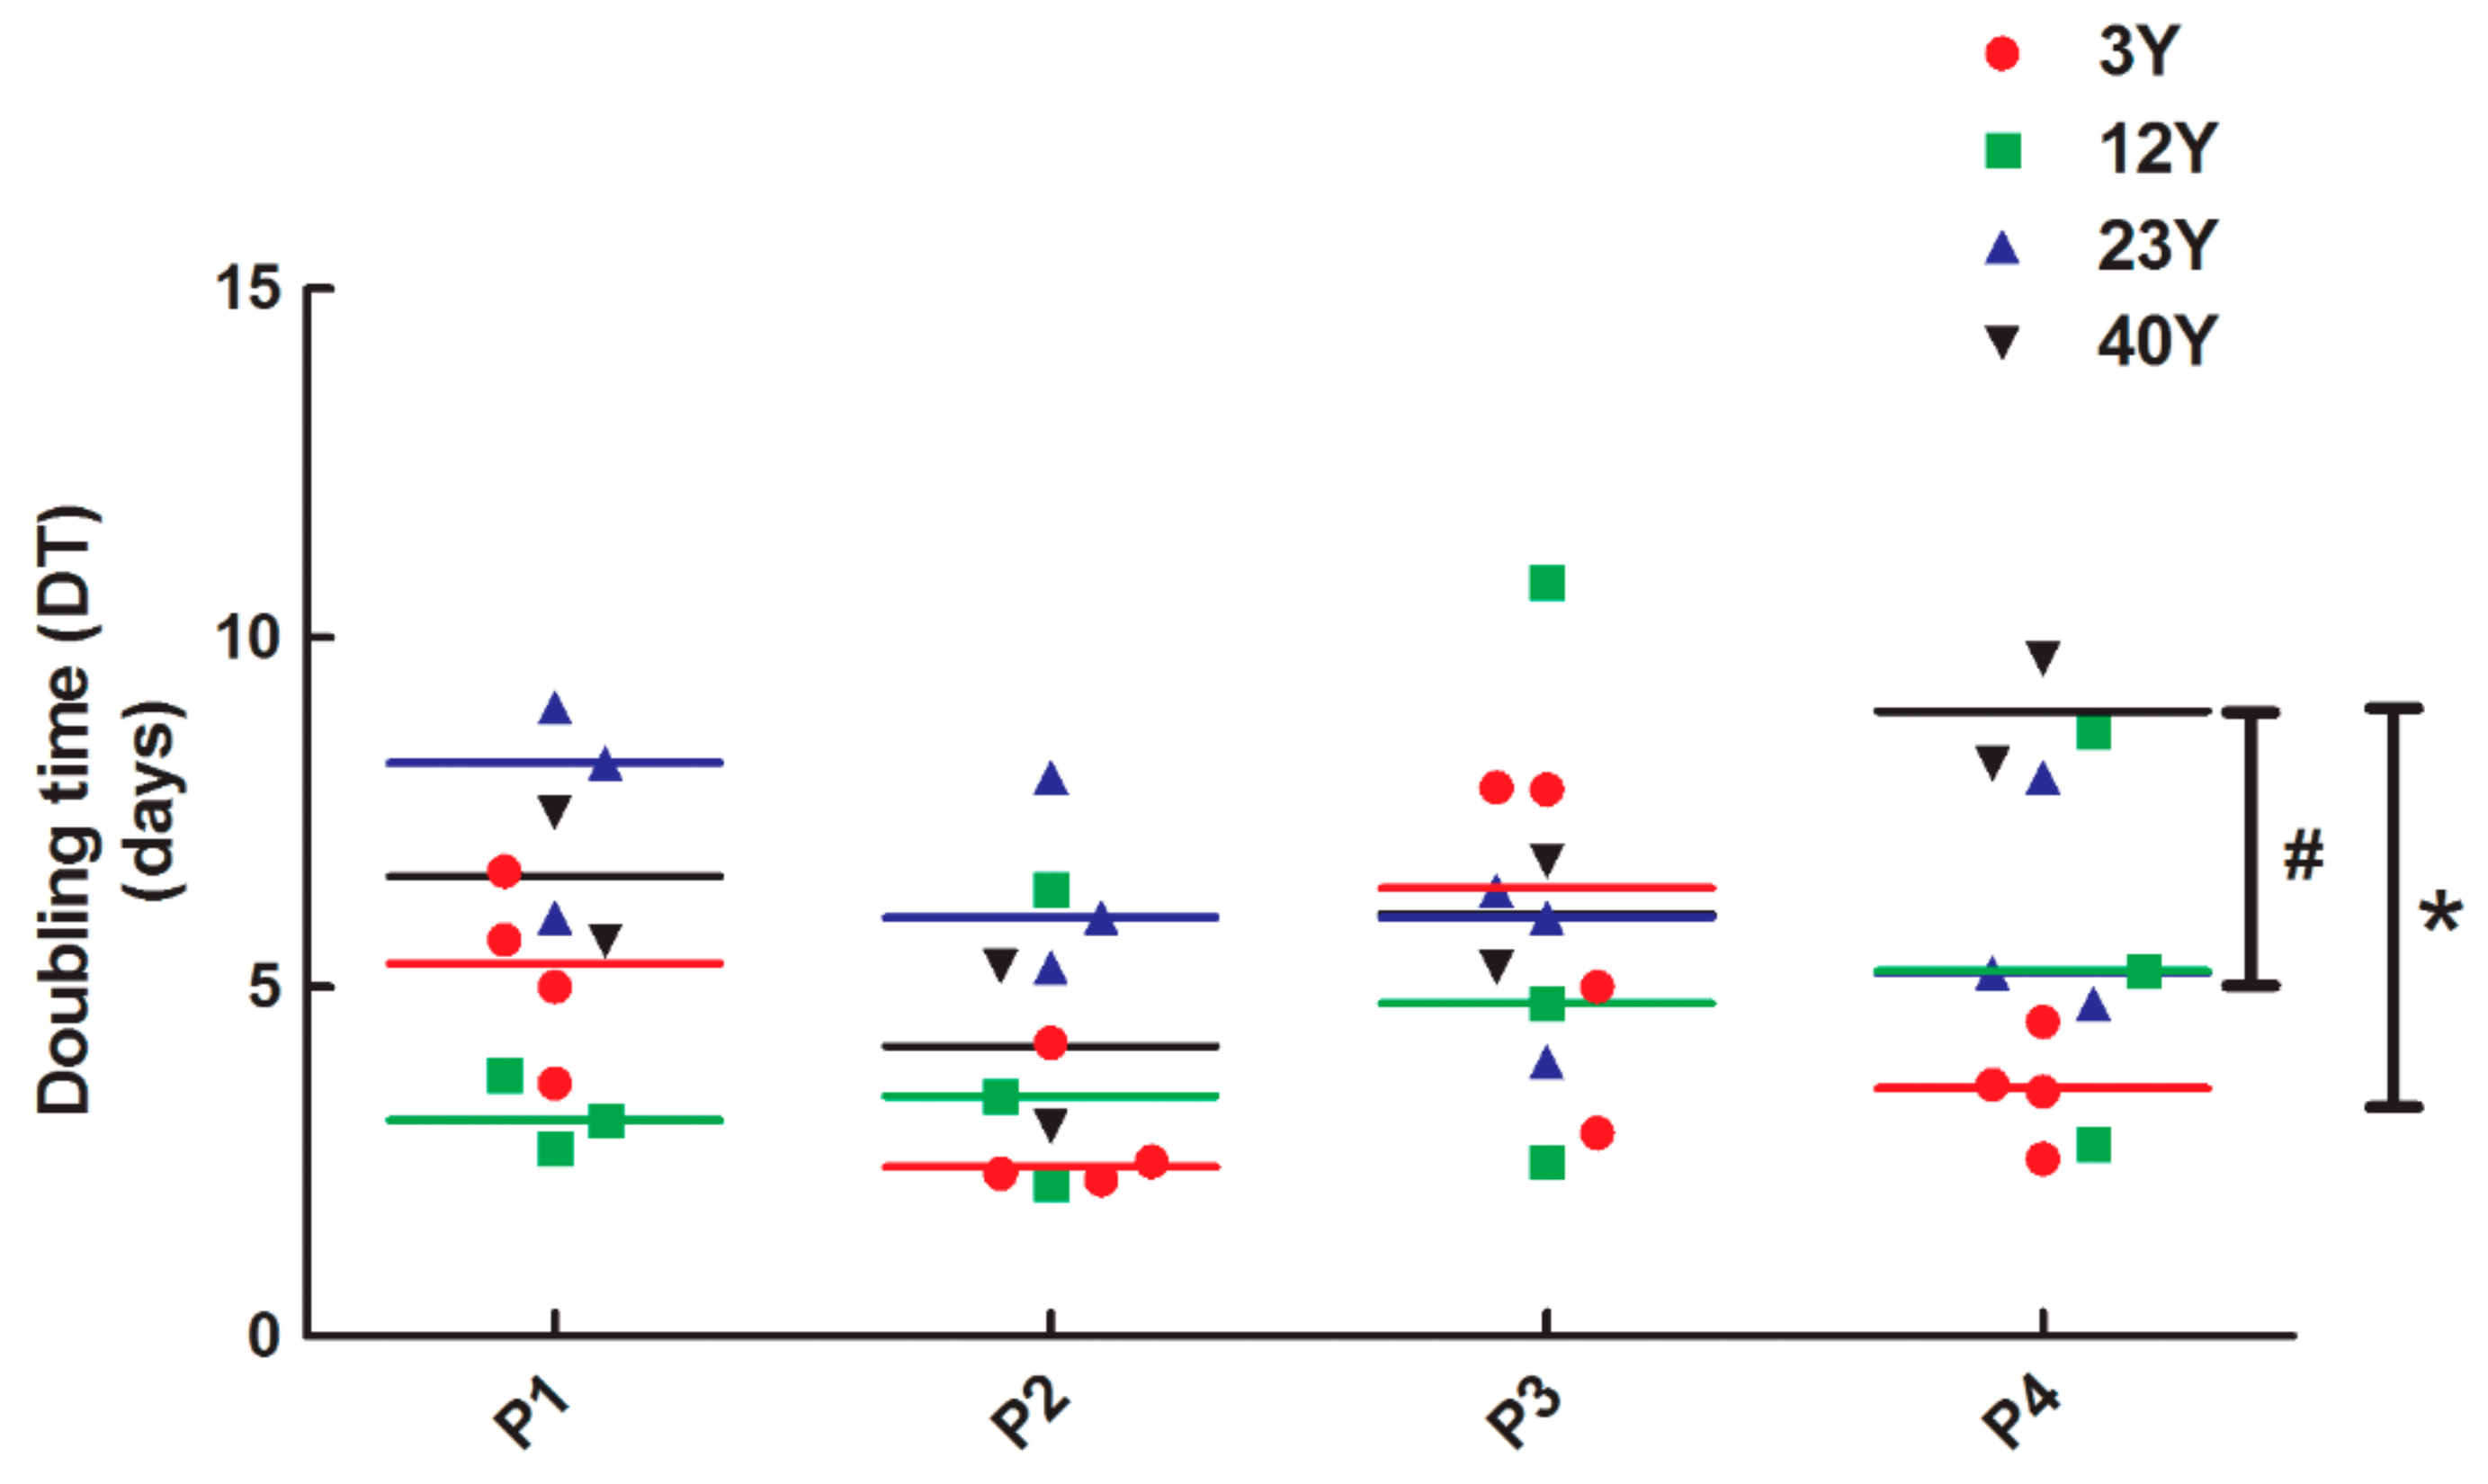
2.5. Doubling Time Assay
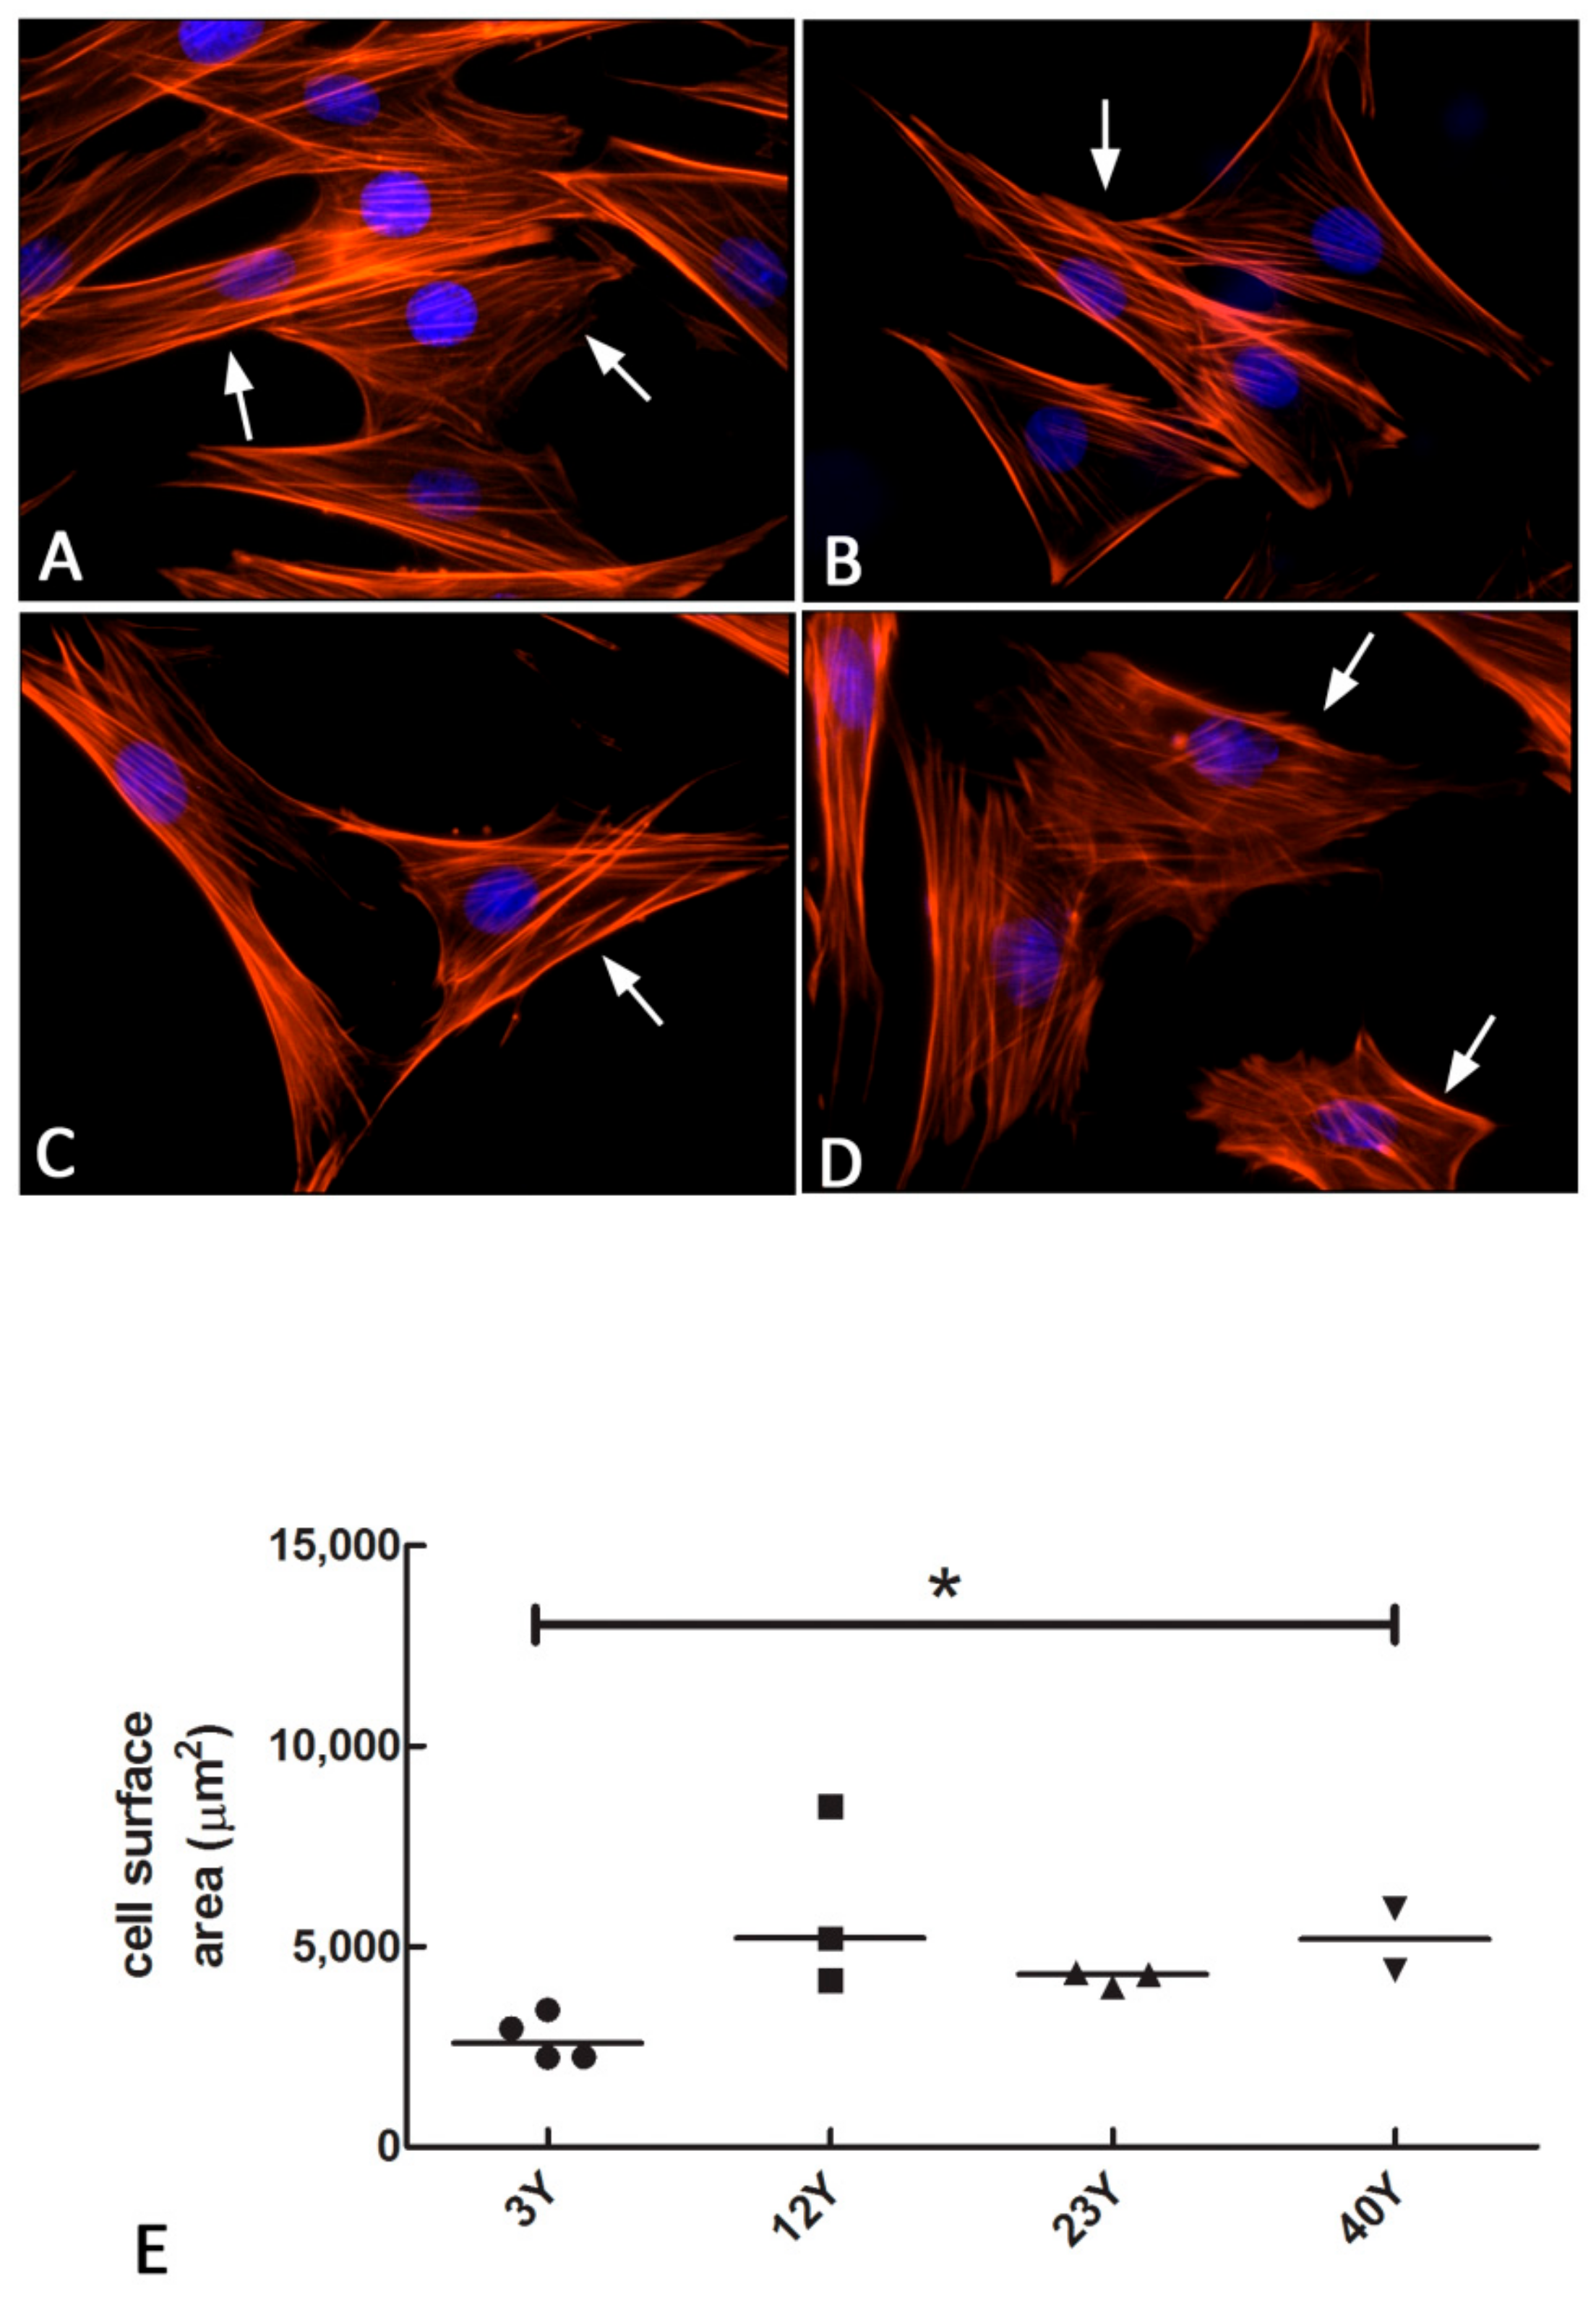
2.6. F-Actin Staining
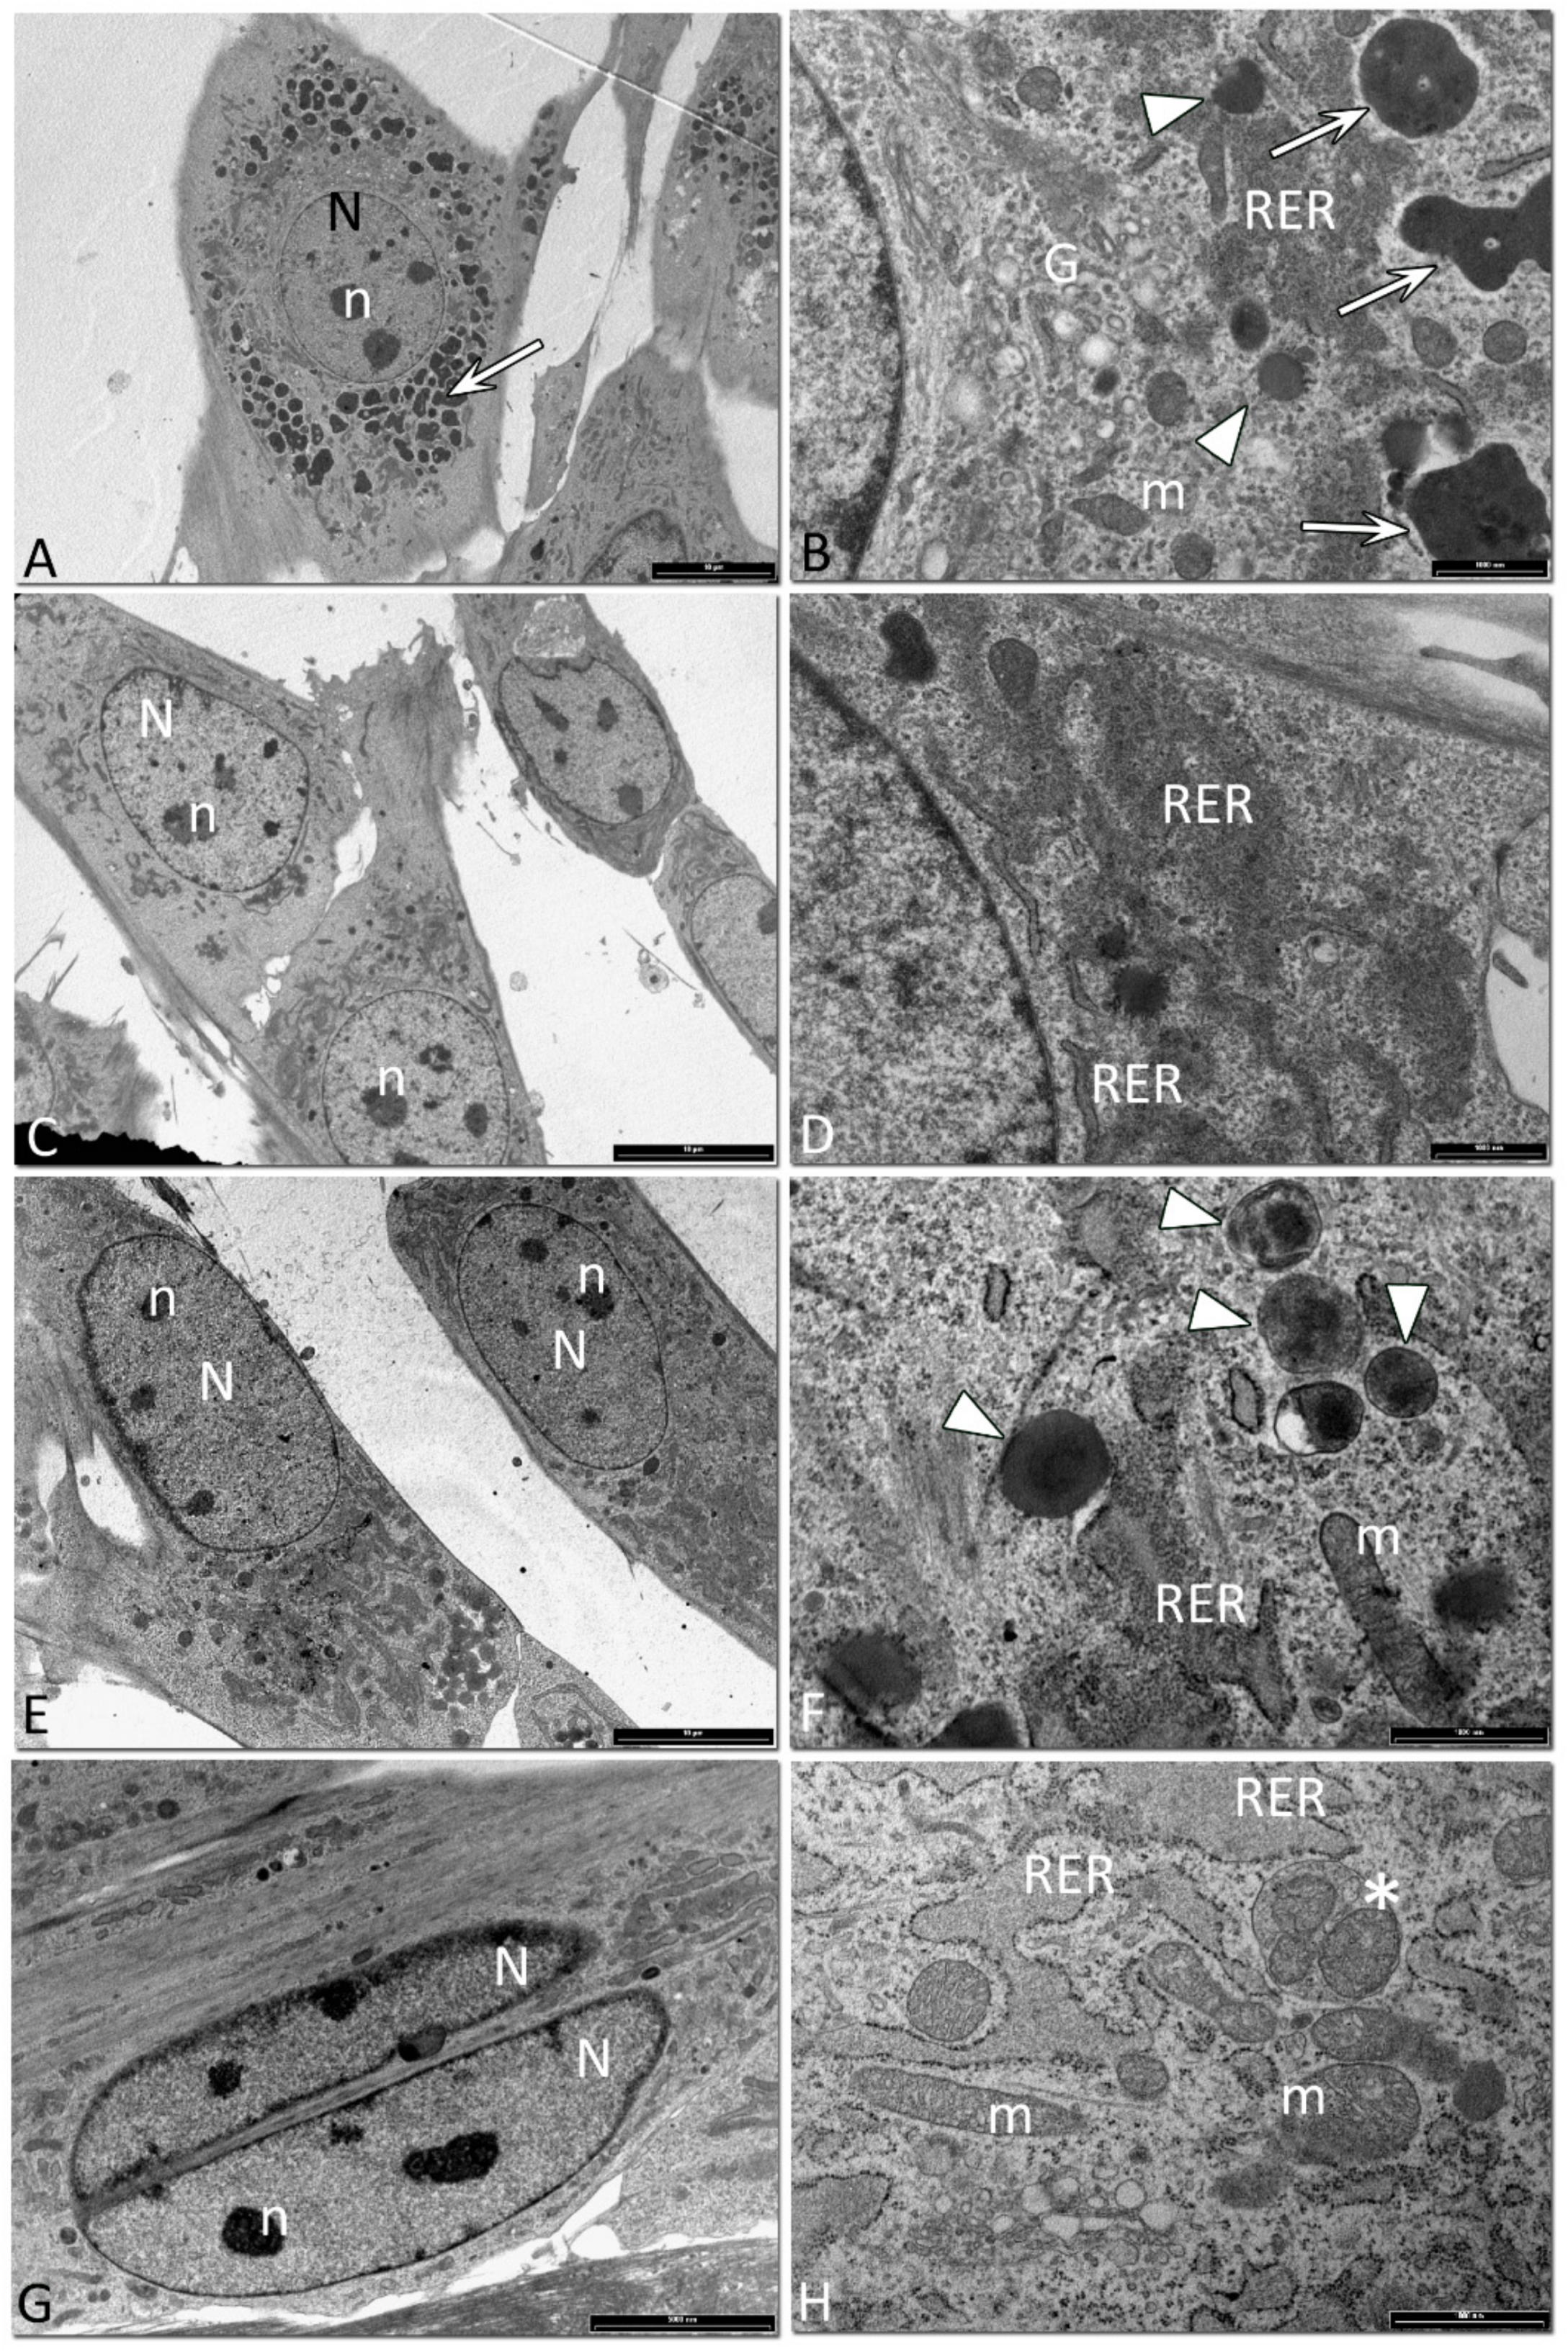
2.7. TEM Analysis
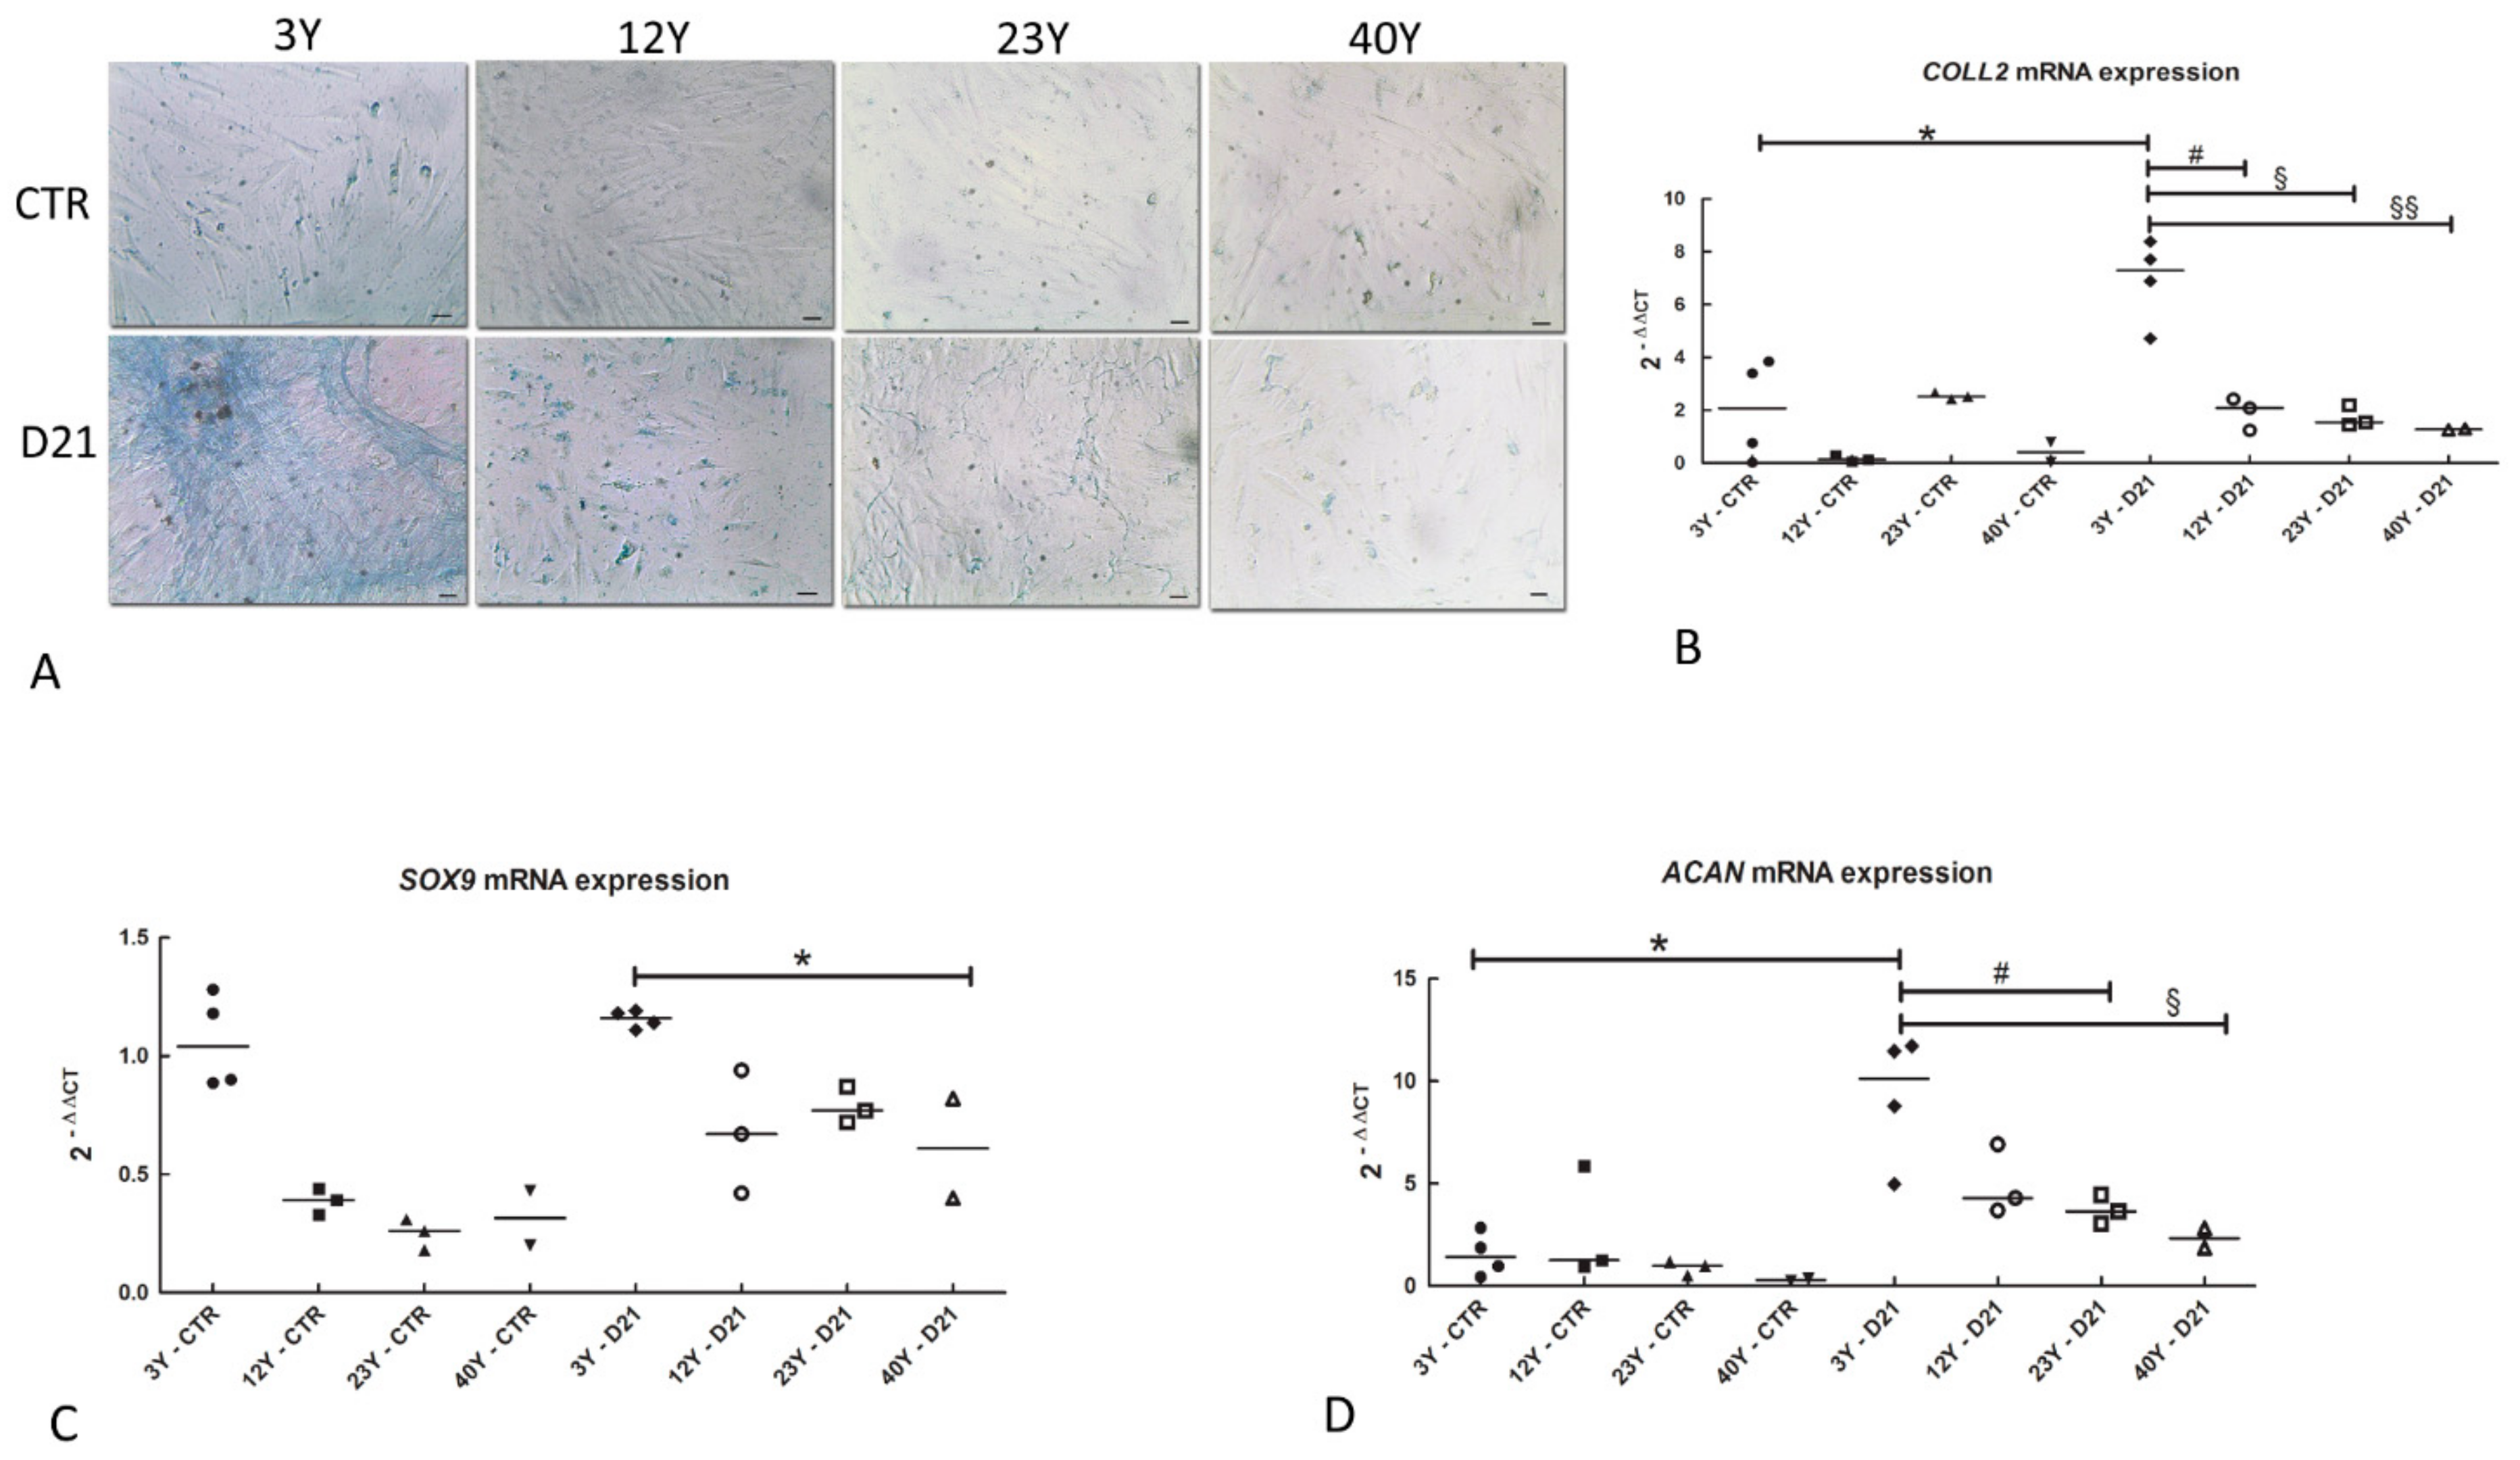
2.8. Alcian Blue
2.9. Chondrogenic Differentiation
2.10. Real-Time PCR
2.11. Statistical Analysis
3. Results
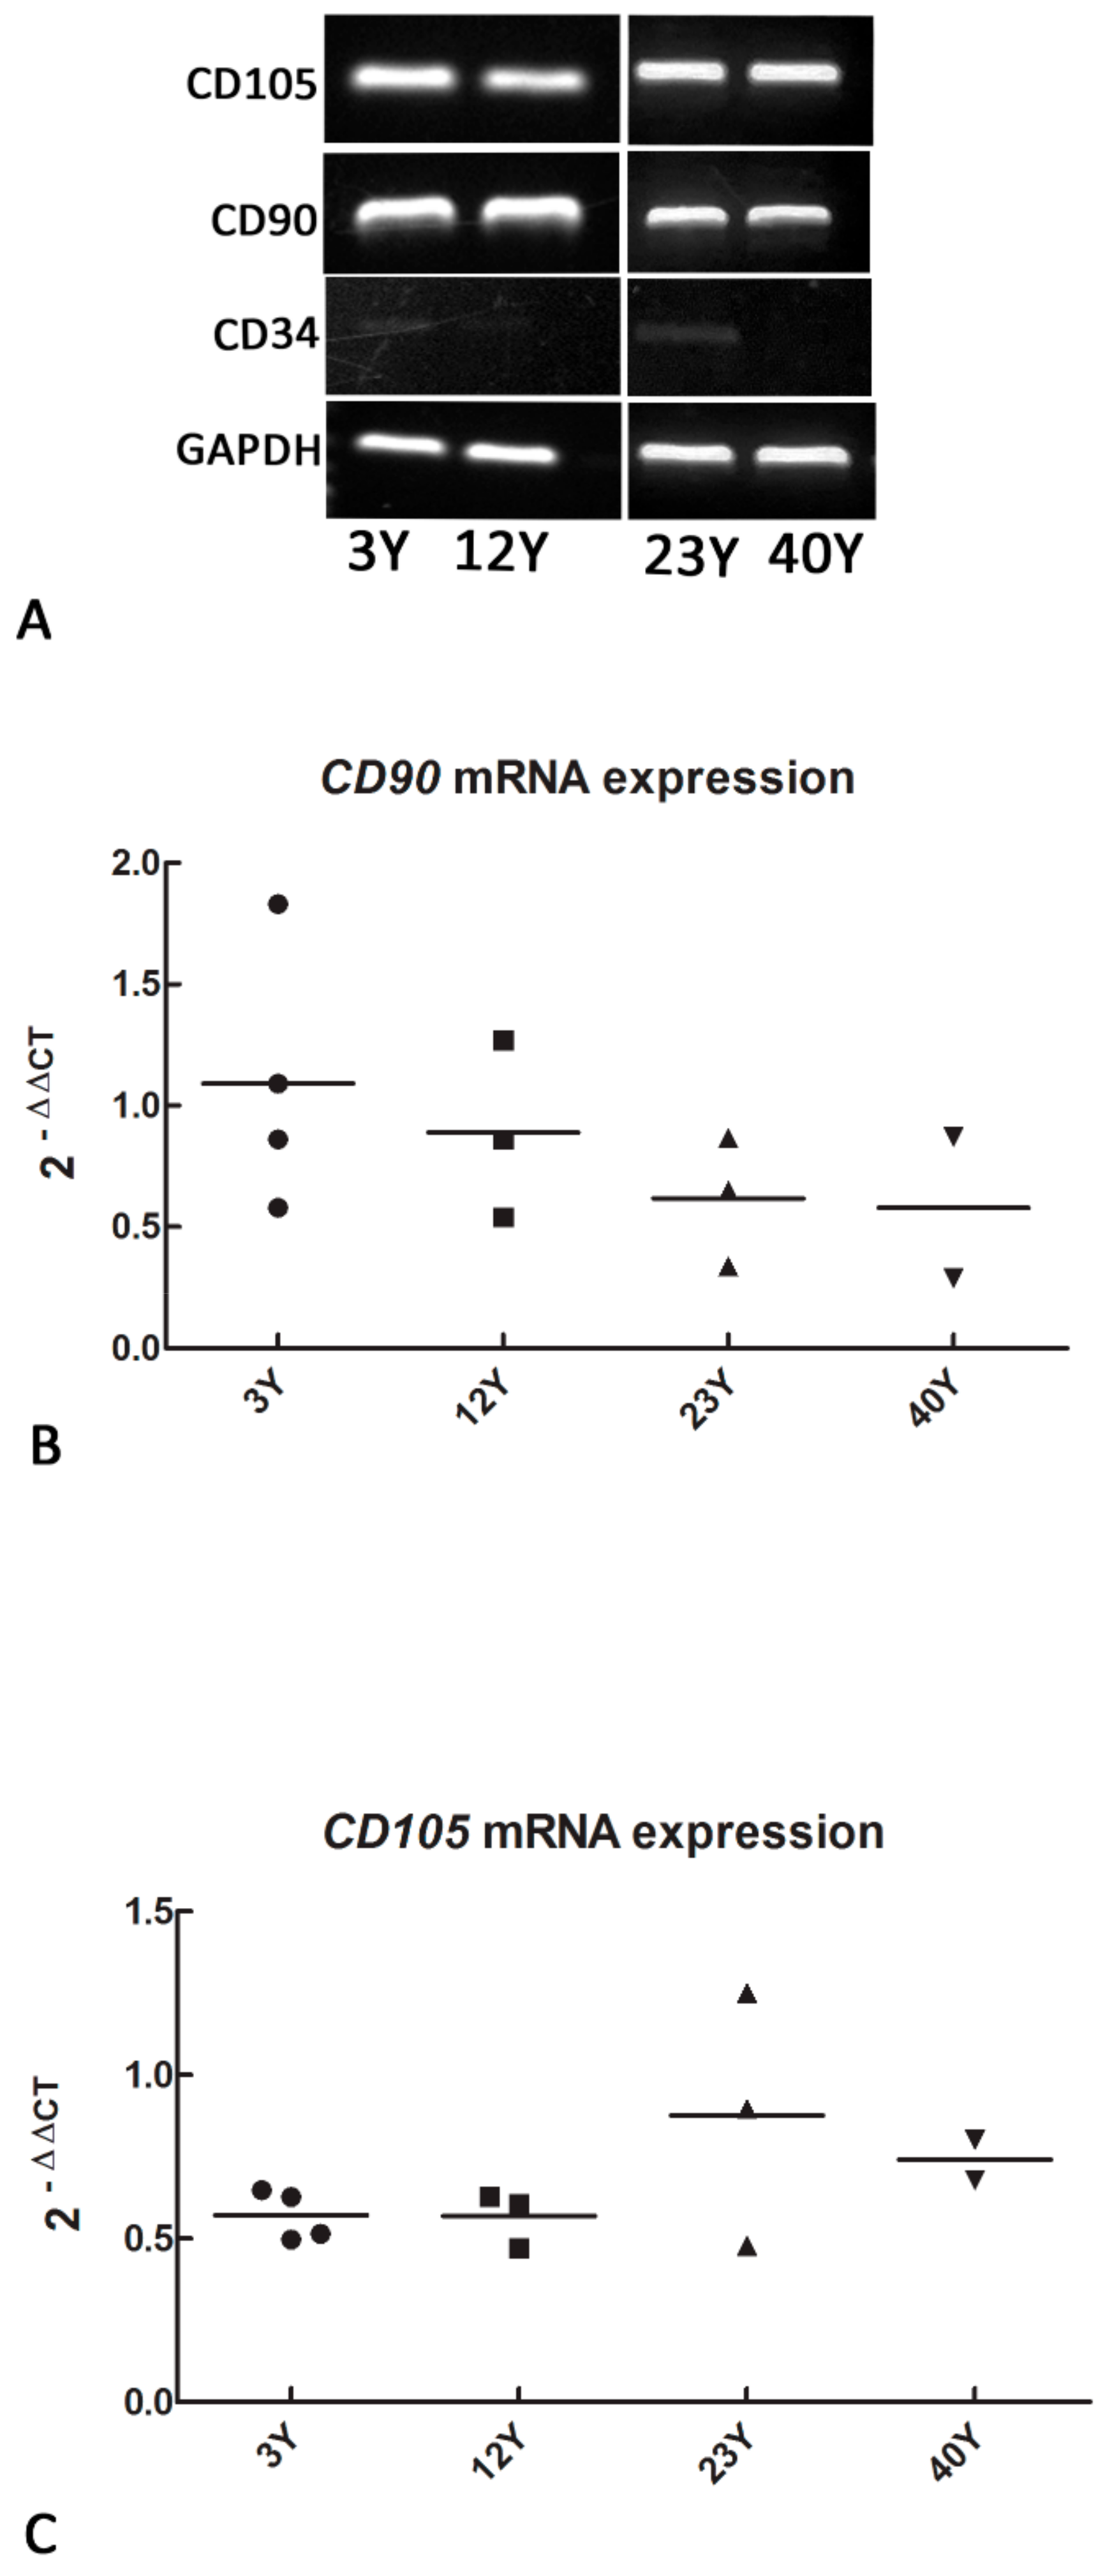
3.1. Mesenchymal and Self-Renewal Expression Markers
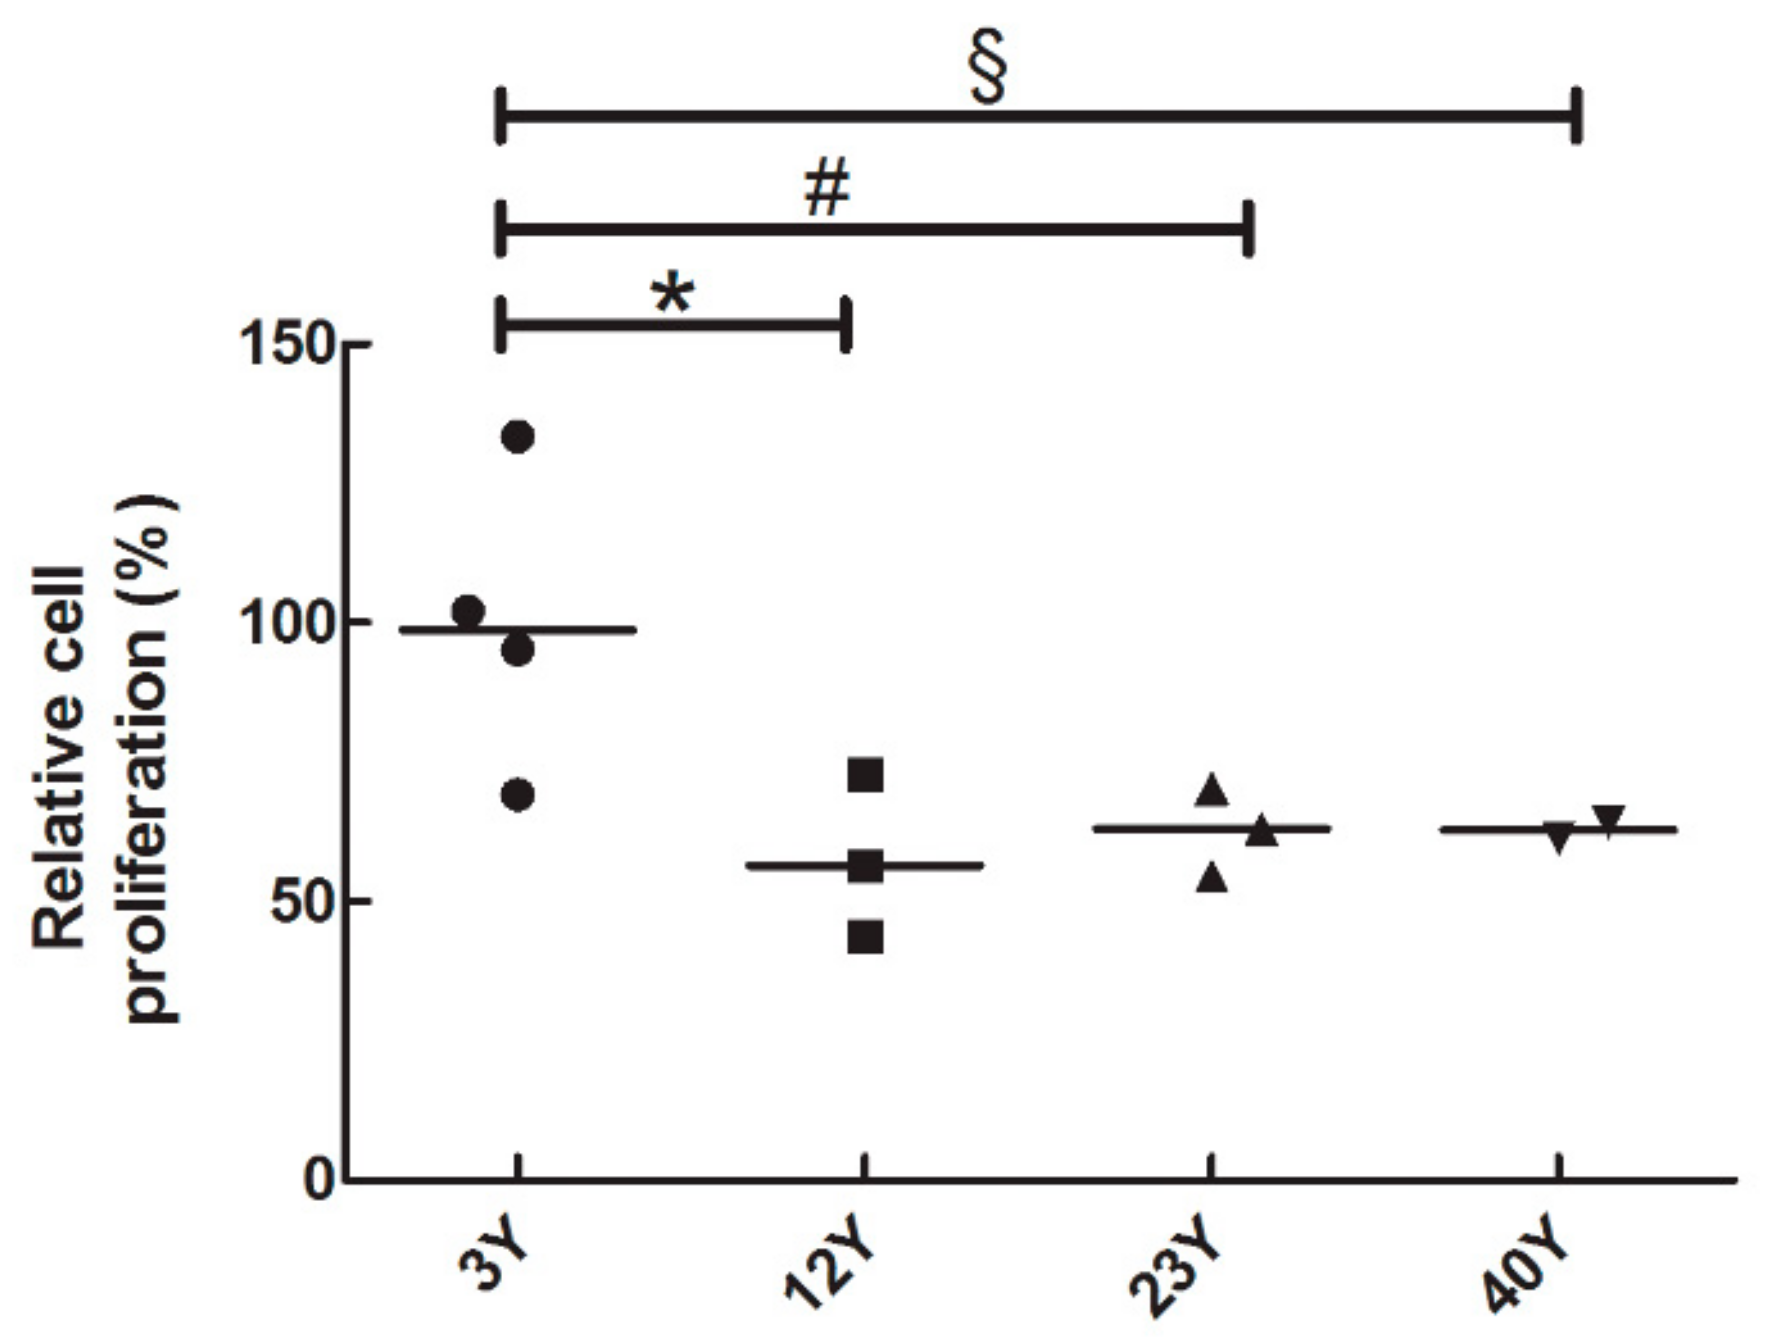
3.2. SfMSCs Proliferation Assay
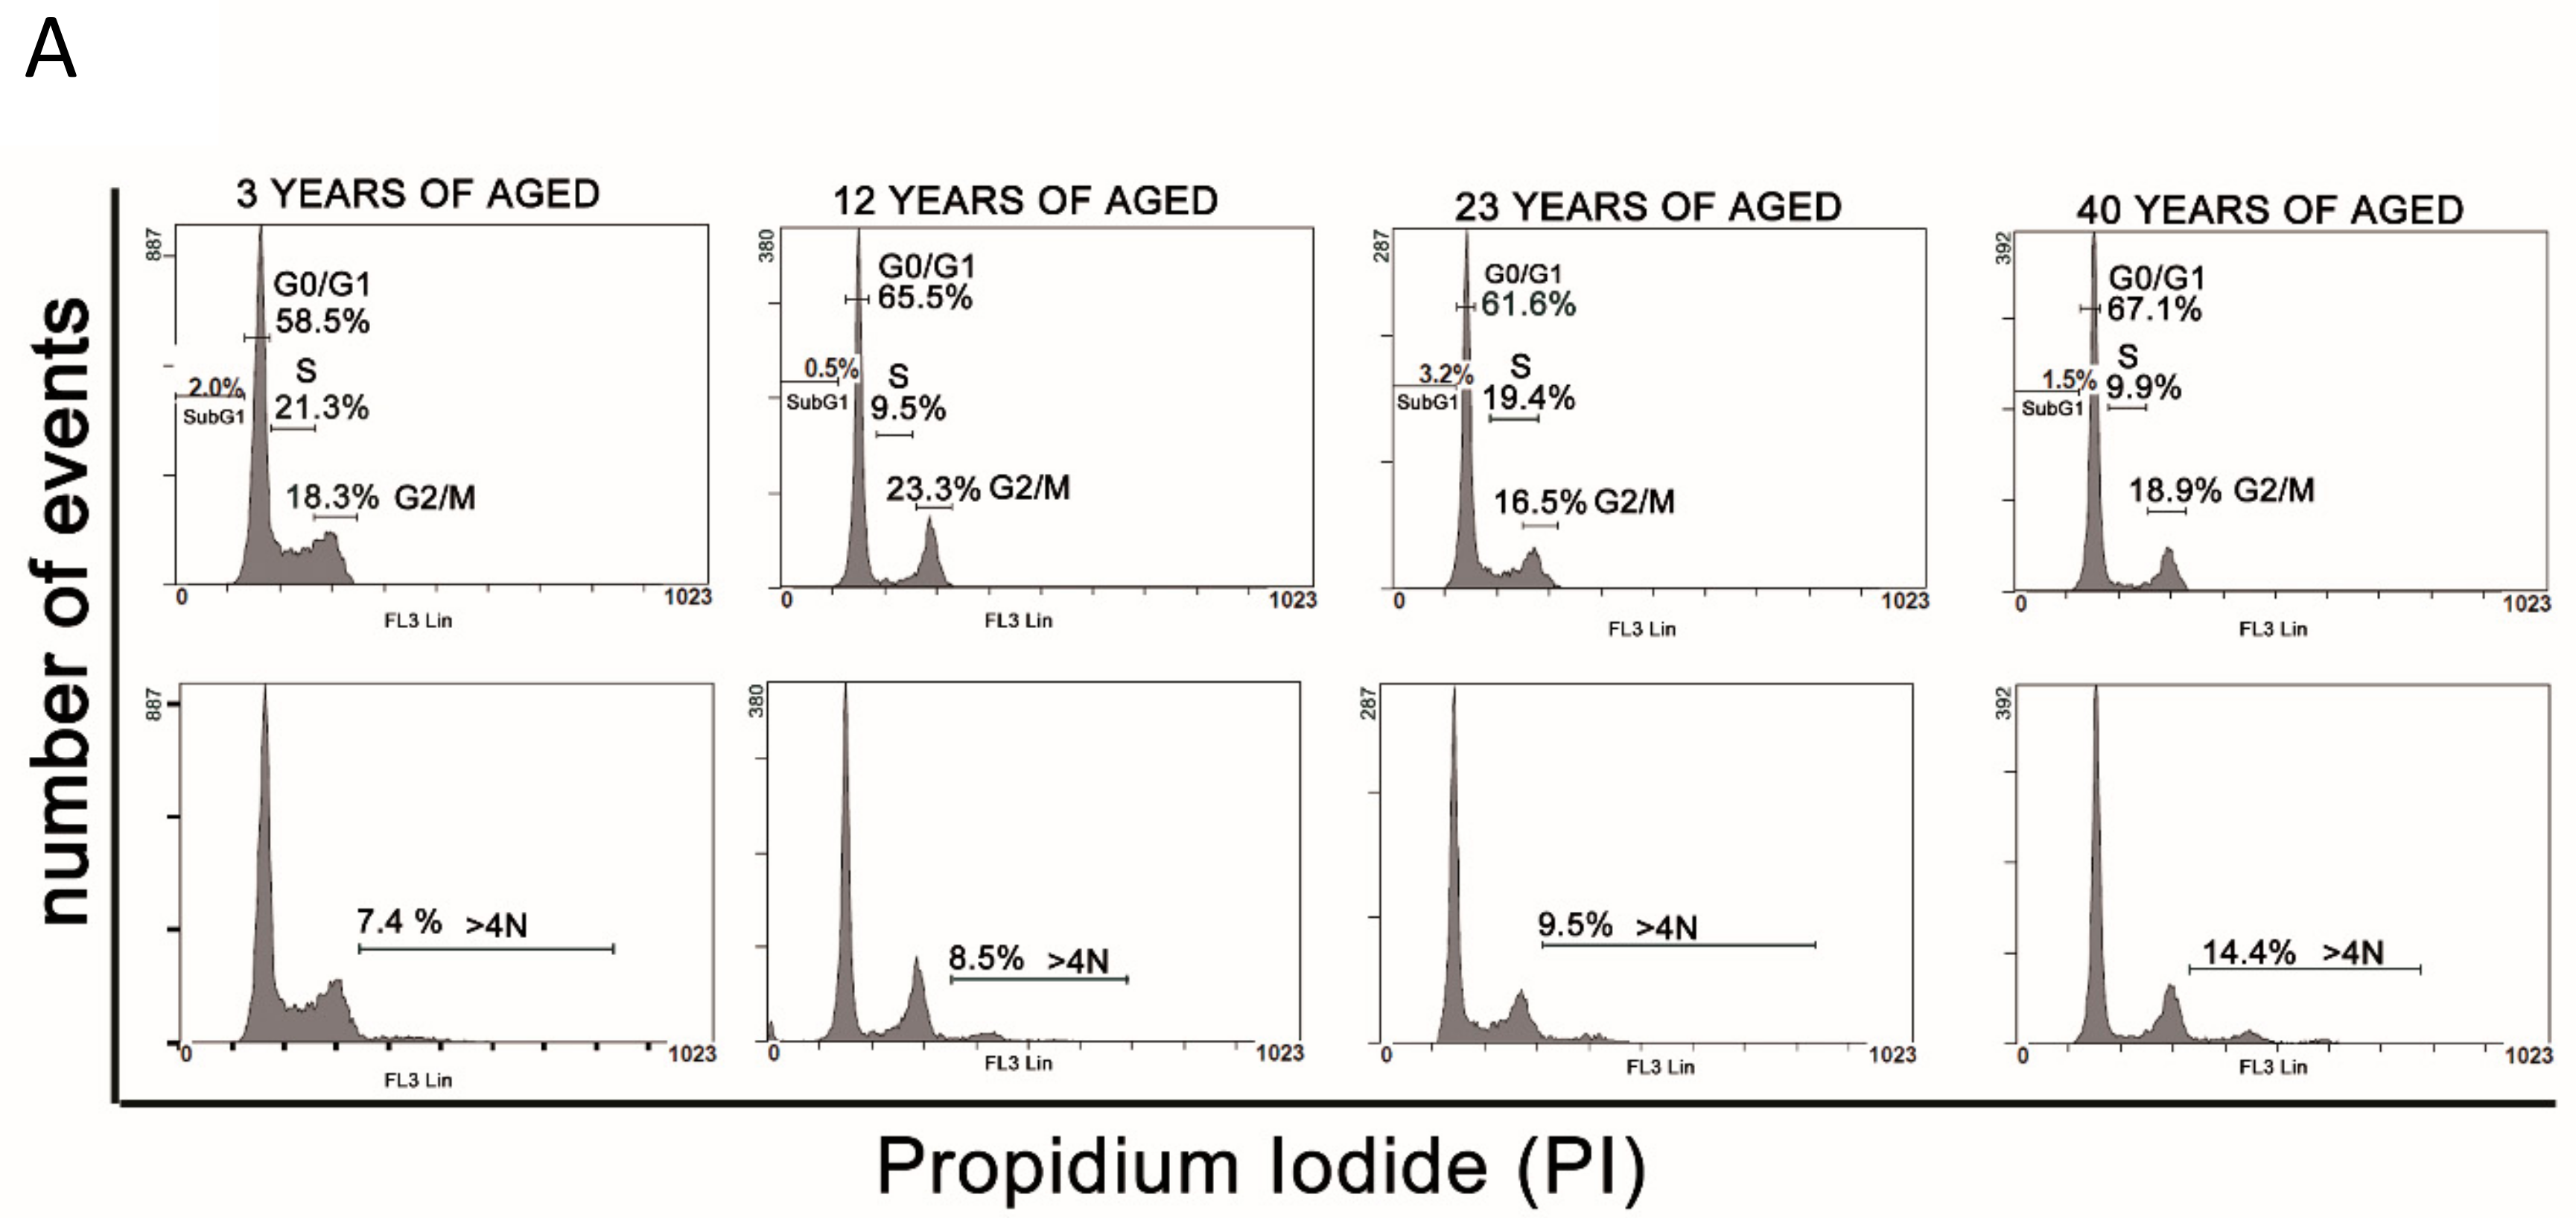
3.3. Cell Cycle Analysis
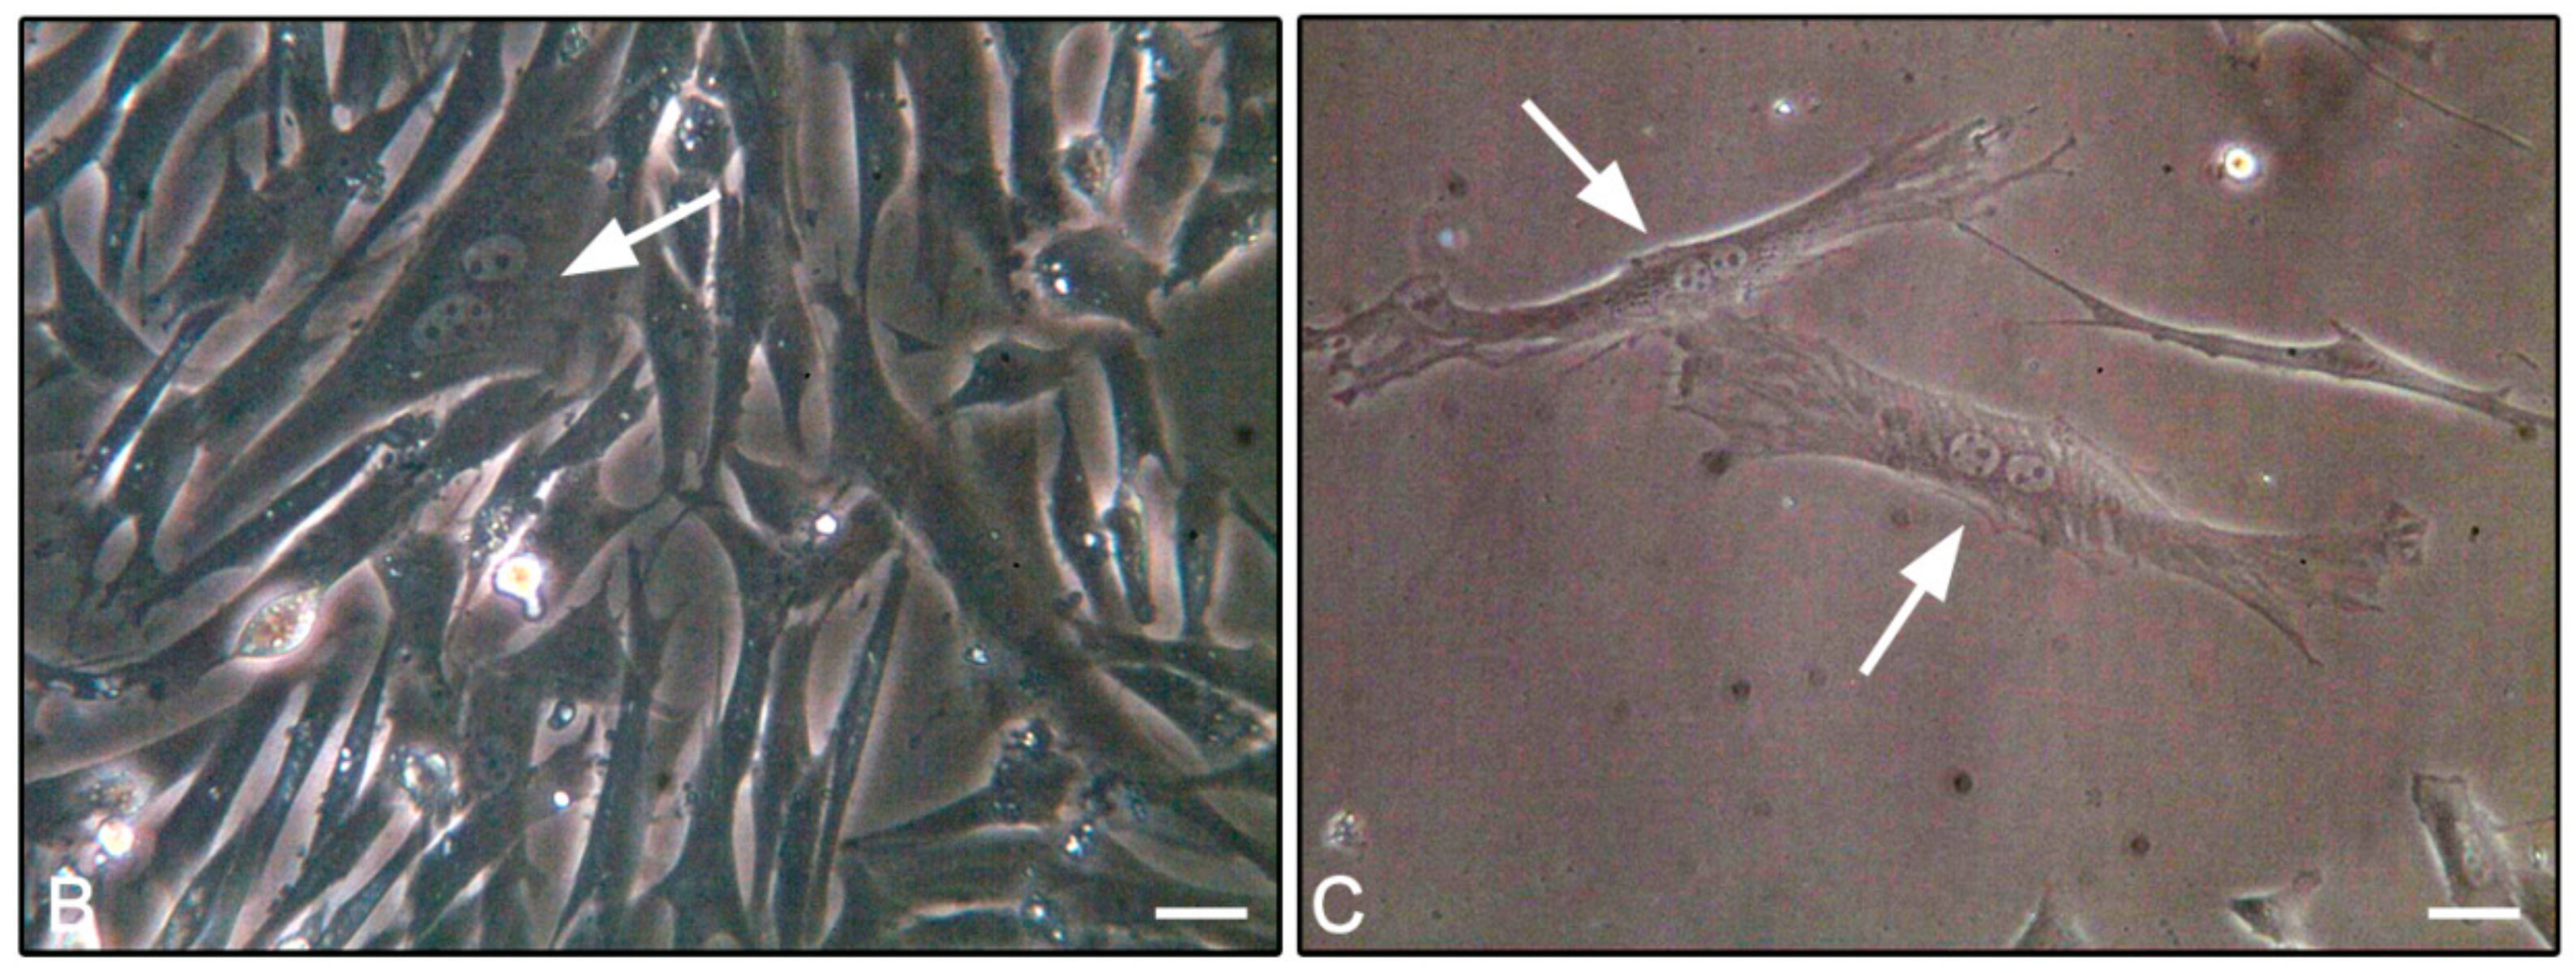
3.4. F-Actin Staining
3.5. Ultrastructural Analysis of Equine SfMSCs
3.6. Chondrogenic Differentiation
4. Discussion
5. Conclusion
Author Contributions
Funding
Conflicts of Interest
References
- Huang, Z.Y.; Xie, H.Q.; Silini, A.; Parolini, O.; Zhang, Y.; Deng, L.; Huang, Y.C. Mesenchymal tem/Progenitor Cells Derived from Articular Cartilage, Synovial Membrane and Synovial Fluid for Cartilage Regeneration: Current Status and Future Perspectives. Stem Cell Rev. 2017, 13, 575–586. [Google Scholar] [CrossRef] [PubMed]
- Berebichez-Fridman, R.; Montero-Olvera, P.R. Sources and Clinical Applications of Mesenchymal Stem Cells: State-of-the-Art Review. Sultan Qaboos Univ. Med. J. 2018, 18, e264–e277. [Google Scholar] [CrossRef] [PubMed]
- Fitzsimmons, R.E.B.; Mazurek, M.S.; Soos, A.; Simmons, C.A. Mesenchymal Stromal/Stem Cells in Regenerative Medicine and Tissue Engineering. Stem Cells Int. 2018, 2018, 1–16. [Google Scholar] [CrossRef] [PubMed]
- Teti, G.; Cavallo, C.; Grigolo, B.; Giannini, S.; Facchini, A.; Mazzotti, A.; Falconi, M. Ultrastructural Analysis of Human Bone Marrow Mesenchymal Stem Cells During In Vitro Osteogenesis and Chondrogenesis. Microsc. Res. Tech. 2012, 75, 596–604. [Google Scholar] [CrossRef]
- Focaroli, S.; Teti, G.; Salvatore, V.; Durante, S.; Belmonte, M.M.; Giardino, R.; Mazzotti, A.; Bigi, A.; Falconi, M. Chondrogenic Differentiation of Human Adipose Mesenchimal Stem Cells: Influence of a Biomimetic Gelatin Genipin Crosslinked Porous Scaffold. Microsc. Res. Tech. 2014, 77, 928–934. [Google Scholar] [CrossRef] [PubMed]
- Focaroli, S.; Teti, G.; Salvatore, V.; Orienti, I.; Falconi, M. Calcium/Cobalt Alginate Beads as Functional Scaffolds for Cartilage Tissue Engineering. Stem Cells Int. 2016, 2016, 2030478. [Google Scholar] [CrossRef]
- Teti, G.; Salvatore, V.; Focaroli, S.; Durante, S.; Mazzotti, A.; Dicarlo, M.; Mattioli-Belmonte, M.; Orsini, G. In Vitro osteogenic and odontogenic differentiation of human dental pulp stem cells seeded on carboxymethyl cellulose-hydroxyapatite hybrid hydrogel. Front. Physiol. 2015, 6, 297. [Google Scholar] [CrossRef]
- Teti, G.; Focaroli, S.; Salvatore, V.; Mazzotti, E.; Ingra, L.; Mazzotti, A.; Falconi, M. The Hypoxia-Mimetic Agent Cobalt Chloride Differently Affects Human Mesenchymal Stem Cells in Their Chondrogenic Potential. Stem Cells Int. 2018, 2018, 3237253. [Google Scholar] [CrossRef]
- Bunnell, B.A.; Flaat, M.; Gagliardi, C.; Patel, B.; Ripoll, C. Adipose-derived Stem Cells: Isolation, Expansion and Differentiation. Methods 2008, 45, 115–120. [Google Scholar] [CrossRef]
- Minguell, J.J.; Erices, A.; Conget, P. Mesenchymal Stem Cells. Exp. Biol. Med. 2001, 226, 507–520. [Google Scholar] [CrossRef]
- So, W.K.; Cheung, T.H. Molecular Regulation of Cellular Quiescence: A Perspective from Adult Stem Cells and Its Niches. Methods Mol. Biol. 2018, 1686, 1–25. [Google Scholar]
- Friedenstein, A.J.; Gorskaja, J.F.; Kulagina, N.N. Fibroblast Precursors in Normal and Irradiated Mouse Hematopoietic Organs. Exp. Hematol. 1976, 4, 267–274. [Google Scholar]
- Conget, P.A.; Allers, C.; Minguell, J.J. Identification of a Discrete Population of Human Bone Marrow-Derived Mesenchymal Cells Exhibiting Properties of Uncommitted Progenitors. J. Hematotherapy Stem Cell Res. 2001, 10, 749–758. [Google Scholar] [CrossRef]
- Zuk, P.A.; Zhu, M.; Ashjian, P.; De Ugarte, D.A.; Huang, J.I.; Mizuno, H.; Alfonso, Z.C.; Fraser, J.K.; Benhaim, P.; Hedrick, M.H. Human Adipose Tissue Is a Source of Multipotent Stem Cells. Mol. Biol. Cell 2002, 13, 4279–4295. [Google Scholar] [CrossRef]
- Dong, Q.; Wang, Y.; Mohabatpour, F.; Zheng, L.; Papagerakis, S.; Chen, D.; Papagerakis, P. Dental Pulp Stem Cells: Isolation, Characterization, Expansion, and Odontoblast Differentiation for Tissue Engineering. Methods Mol. Biol. 2019, 1922, 91–101. [Google Scholar]
- Ferretti, C.; Borsari, V.; Falconi, M.; Gigante, A.; Lazzarini, R.; Fini, M.; Di Primio, R.; Mattioli-Belmonte, M.; Primio, R. Human Periosteum-Derived Stem Cells for Tissue Engineering Applications: The Role of VEGF. Stem Cell Rev. 2012, 8, 882–890. [Google Scholar] [CrossRef]
- Mattioli-Belmonte, M.; Teti, G.; Salvatore, V.; Focaroli, S.; Orciani, M.; Dicarlo, M.; Fini, M.; Orsini, G.; Di Primio, R.; Falconi, M. Stem cell origin differently affects bone tissue engineering strategies. Front. Physiol. 2015, 6, 266. [Google Scholar] [CrossRef]
- Lu, L.-L.; Liu, Y.-J.; Yang, S.-G.; Zhao, Q.-J.; Wang, X.; Gong, W.; Han, Z.-B.; Xu, Z.-S.; Lu, Y.-X.; Liu, D.; et al. Isolation and characterization of human umbilical cord mesenchymal stem cells with hematopoiesis-supportive function and other potentials. Haematologica 2006, 91, 1017–1026. [Google Scholar]
- Merlo, B.; Teti, G.; Mazzotti, E.; Ingrà, L.; Salvatore, V.; Buzzi, M.; Cerqueni, G.; Dicarlo, M.; Lanci, A.; Castagnetti, C.; et al. Wharton’s Jelly Derived Mesenchymal Stem Cells: Comparing Human and Horse. Stem Cell Rev. 2018, 14, 574–584. [Google Scholar] [CrossRef]
- De Bari, C.; Dell’Accio, F.; Tylzanowski, P.; Luyten, F.P. Multipotent Mesenchymal Stem Cells from Adult Human Synovial Membrane. Arthritis Rheum. 2001, 44, 1928–1942. [Google Scholar] [CrossRef]
- Harvanova, D.; Tothova, T.; Sarissky, M.; Amrichova, J.; Rosocha, J. Isolation and Characterization of Synovial Mesenchymal Stem Cells. Folia Biol. 2011, 57, 119–124. [Google Scholar]
- Jones, E.A.; English, A.; Henshaw, K.; Kinsey, S.E.; Markham, A.F.; Emery, P.; McGonagle, D. Enumeration and Phenotypic Characterization of Synovial Fluid Multipotential Mesenchymal Progenitor Cells in Inflammatory and Degenerative Arthritis. Arthritis Rheum. 2004, 50, 817–827. [Google Scholar] [CrossRef]
- Morito, T.; Muneta, T.; Hara, K.; Ju, Y.J.; Mochizuki, T.; Makino, H.; Umezawa, A.; Sekiya, I. Synovial Fluid-Derived Mesenchymal Stem Cells Increase after Intra-Articular Ligament Injury in Humans. Rheumatology 2008, 47, 1137–1143. [Google Scholar] [CrossRef]
- Sekiya, I.; Ojima, M.; Suzuki, S.; Yamaga, M.; Horie, M.; Koga, H.; Tsuji, K.; Miyaguchi, K.; Ogishima, S.; Tanaka, H.; et al. Human Mesenchymal Stem Cells in Synovial Fluid Increase in the Knee with Degenerated Cartilage and Osteoarthritis. J. Orthop. Res. 2012, 30, 943–949. [Google Scholar] [CrossRef]
- Pei, M.; He, F.; Boyce, B.M.; Kish, V.L. Repair of Full-Thickness Femoral Condyle Cartilage Defects Using Allogeneic Synovial Cell-Engineered Tissue Constructs. Osteoarthr. Cartil. 2009, 17, 714–722. [Google Scholar] [CrossRef]
- Hunziker, E.B.; Rosenberg, L.C. Repair of Partial-Thickness Defects in Articular Cartilage: Cell Recruitment from the Synovial Membrane. J. Bone Jt. Surg. Am. 1996, 78, 721–733. [Google Scholar] [CrossRef]
- Murata, D.; Miyakoshi, D.; Hatazoe, T.; Miura, N.; Tokunaga, S.; Fujiki, M.; Nakayama, K.; Misumi, K. Multipotency of Equine Mesenchymal Stem Cells Derived from Synovial Fluid. Vet. J. 2014, 202, 53–61. [Google Scholar] [CrossRef]
- Yu, K.R.; Kang, K.S. Aging-Related Genes in Mesenchymal Stem Cells: A Mini-Review. Gerontology 2013, 59, 557–563. [Google Scholar] [CrossRef]
- Yang, Y.K. Aging of Mesenchymal Stem Cells: Implication in Regenerative Medicine. Regen. Ther. 2018, 9, 120–122. [Google Scholar] [CrossRef]
- Zaim, M.; Karaman, S.; Cetin, G.; Isik, S. Donor Age and Long-Term Culture Affect Differentiation and Proliferation of Human Bone Marrow Mesenchymal Stem Cells. Ann. Hematol. 2012, 91, 1175–1186. [Google Scholar] [CrossRef]
- Choudhery, M.S.; Badowski, M.; Muise, A.; Pierce, J.; Harris, D.T. Donor Age Negatively Impacts Adipose Tissue-Derived Mesenchymal Stem Cell Expansion and Differentiation. J. Transl. Med. 2014, 12, 8. [Google Scholar] [CrossRef]
- Lorenzini, A.; Maier, A.B. Influence of donor age and species longevity on replicative cellular senescence. In Cellular Ageing and Replicative Senescence; Ruttan, S.I.S., Hayflick, L., Eds.; Springer: Cham, Switzerland, 2016; pp. 49–70. [Google Scholar]
- Moran, C.J.; Ramesh, A.; Brama, P.A.; O’Byrne, J.M.; O’Brien, F.J.; Levingstone, T.J. The benefits and limitations of animal models for translational research in cartilage repair. J. Exp. Orthop. 2016, 3, 1. [Google Scholar] [CrossRef]
- Lonetti, A.; Cappellini, A.; Bertaina, A.; Locatelli, F.; Pession, A.; Buontempo, F.; Evangelisti, C.; Orsini, E.; Zambonin, L.; Neri, L.M.; et al. Improving Nelarabine Efficacy in T Cell Acute Lymphoblastic Leukemia by Targeting Aberrant Pi3k/Akt/Mtor Signaling Pathway. J. Hematol. Oncol. 2016, 9, 114. [Google Scholar] [CrossRef]
- Dominici, M.; le Blanc, K.; Mueller, I.; Slaper-Cortenbach, I.; Marini, F.; Krause, D.; Deans, R.; Keating, A.; Prockop, D.; Horwitz, E. Minimal Criteria for Defining Multipotent Mesenchymal Stromal Cells. The International Society for Cellular Therapy Position Statement. Cytotherapy 2006, 8, 315–317. [Google Scholar] [CrossRef]
- Dzobo, K.; Turnley, T.; Wishart, A.; Rowe, A.; Kallmeyer, K.; van Vollenstee, F.A.; Thomford, N.E.; Dandara, C.; Chopera, D.; Pepper, M.S.; et al. Fibroblast-Derived Extracellular Matrix Induces Chondrogenic Differentiation in Human Adipose-Derived Mesenchymal Stromal/Stem Cells In Vitro. Int. J. Mol. Sci. 2016, 17, 1259. [Google Scholar] [CrossRef]
- Lopez-Otin, C.; Blasco, M.A.; Partridge, L.; Serrano, M.; Kroemer, G. The Hallmarks of Aging. Cell 2013, 153, 1194–1217. [Google Scholar] [CrossRef]
- Hou, A.; Chen, P.; Tang, H.; Meng, H.; Cheng, X.; Wang, Y.; Zhang, Y.; Peng, J. Cellular Senescence in Osteoarthritis and Anti-Aging Strategies. Mech. Ageing Dev. 2018, 175, 83–87. [Google Scholar] [CrossRef]
- Lim, J.E.; Son, Y. Endogenous Stem Cells in Homeostasis and Aging. Tissue Eng. Regen. Med. 2017, 14, 679–698. [Google Scholar] [CrossRef]
- Mak, J.; Jablonski, C.L.; Leonard, C.A.; Dunn, J.F.; Raharjo, E.; Matyas, J.R.; Biernaskie, J.; Krawetz, R.J. Intra-Articular Injection of Synovial Mesenchymal Stem Cells Improves Cartilage Repair in a Mouse Injury Model. Sci. Rep. 2016, 6, 23076. [Google Scholar] [CrossRef]
- Neybecker, P.; Henrionnet, C.; Pape, E.; Mainard, D.; Galois, L.; Loeuille, D.; Gillet, P.; Pinzano, A. In Vitro and In Vivo Potentialities for Cartilage Repair from Human Advanced Knee Osteoarthritis Synovial Fluid-Derived Mesenchymal Stem Cells. Stem Cell Res. Ther. 2018, 9, 329. [Google Scholar] [CrossRef]
- Janes, J.G.; Kennedy, L.A.; Garrett, K.S.; Engiles, J.B. Common Lesions of the Distal End of the Third Metacarpal/Metatarsal Bone in Racehorse Catastrophic Breakdown Injuries. J. Vet. Diagn. Investig. 2017, 29, 431–436. [Google Scholar] [CrossRef]
- De Schauwer, C.; Meyer, E.; van de Walle, G.R.; van Soom, A. Markers of Stemness in Equine Mesenchymal Stem Cells: A Plea for Uniformity. Theriogenology 2011, 75, 1431–1443. [Google Scholar] [CrossRef]
- Fossett, E.; Khan, W.S.; Pastides, P.; Adesida, A.B. The Effects of Ageing on Proliferation Potential, Differentiation Potential and Cell Surface Characterisation of Human Mesenchymal Stem Cells. Curr. Stem Cell Res. Ther. 2012, 7, 282–286. [Google Scholar] [CrossRef]
- Tsai, C.C.; Hung, S.C. Functional roles of pluripotency transcription factors in mesenchymal stem cells. Cell Cycle 2012, 11, 3711–3712. [Google Scholar] [CrossRef]
- Davoli, T.; de Lange, T. The Causes and Consequences of Polyploidy in Normal Development and Cancer. Annu. Rev. Cell Dev. Biol. 2011, 27, 585–610. [Google Scholar] [CrossRef]
- Ullah, Z.; Kohn, M.J.; Yagi, R.; Vassilev, L.T.; DePamphilis, M.L. Differentiation of Trophoblast Stem Cells into Giant Cells Is Triggered by P57/Kip2 Inhibition of Cdk1 Activity. Genes Dev. 2008, 22, 3024–3036. [Google Scholar] [CrossRef]
- Ravid, K.; Lu, J.; Zimmet, J.M.; Jones, M.R. Roads to Polyploidy: The Megakaryocyte Example. J. Cell. Physiol. 2002, 190, 7–20. [Google Scholar] [CrossRef]
- Celton-Morizur, S.; Desdouets, C. Polyploidization of Liver Cells. Adv. Exp. Med. Biol. 2010, 676, 123–135. [Google Scholar]
- Vignery, A. Osteoclasts and Giant Cells: Macrophage-Macrophage Fusion Mechanism. Int. J. Exp. Pathol. 2000, 81, 291–304. [Google Scholar] [CrossRef]
- Liu, Z.; Yue, S.; Chen, X.; Kubin, T.; Braun, T. Regulation of Cardiomyocyte Polyploidy and Multinucleation by CyclinG1. Circ. Res. 2010, 106, 1498–1506. [Google Scholar] [CrossRef]
- Hixon, M.L.; Gualberto, A. Vascular Smooth Muscle Polyploidization from Mitotic Checkpoints to Hypertension. Cell Cycle 2003, 2, 105–110. [Google Scholar] [CrossRef][Green Version]
- Gorla, G.R.; Malhi, H.; Gupta, S. Polyploidy Associated with Oxidative Injury Attenuates Proliferative Potential of Cells. J. Cell Sci. 2001, 114, 2943–2951. [Google Scholar]
- Estrada, J.C.; Torres, Y.; Benguria, A.; Dopazo, A.; Roche, E.; Carrera-Quintanar, L.; Perez, R.A.; Enríquez, J.A.; Torres, R.; Ramírez, J.C.; et al. Human Mesenchymal Stem Cell-Replicative Senescence and Oxidative Stress Are Closely Linked to Aneuploidy. Cell Death Dis. 2013, 4, e691. [Google Scholar] [CrossRef]
- Hwang, E.S.; Yoon, G.; Kang, H.T. A Comparative Analysis of the Cell Biology of Senescence and Aging. Cell Mol. Life Sci. 2009, 66, 2503–2524. [Google Scholar] [CrossRef]
- Wang, E.; Gundersen, D. Increased Organization of Cytoskeleton Accompanying the Aging of Human Fibroblasts in Vitro. Exp. Cell Res. 1984, 154, 191–202. [Google Scholar] [CrossRef]
- Revuelta, M.; Matheu, A. Autophagy in Stem Cell Aging. Aging Cell 2017, 16, 912–915. [Google Scholar] [CrossRef]
- Rubinsztein, D.C.; Marino, G.; Kroemer, G. Autophagy and Aging. Cell 2011, 146, 682–695. [Google Scholar] [CrossRef]
- Garcia-Prat, L.; Martinez-Vicente, M.; Perdiguero, E.; Ortet, L.; Rodriguez-Ubreva, J.; Rebollo, E.; Ruiz-Bonilla, V.; Gutarra, S.; Ballestar, E.; Serrano, A.L.; et al. Autophagy Maintains Stemness by Preventing Senescence. Nature 2016, 529, 37–42. [Google Scholar] [CrossRef]
- Lee, W.S.; Yoo, W.H.; Chae, H.J. ER Stress and Autophagy. Curr. Mol. Med. 2015, 15, 735–745. [Google Scholar] [CrossRef]
- Taylor, R.C. Aging and the UPR (ER). Brain Res. 2016, 1648, 588–593. [Google Scholar] [CrossRef]
- Lemasters, J.J. Variants of Mitochondrial Autophagy: Types 1 and 2 Mitophagy and Micromitophagy (Type 3). Redox Biol 2014, 2, 749–754. [Google Scholar] [CrossRef]
- Szychlinska, M.A.; Stoddart, M.J.; D’Amora, U.; Ambrosio, L.; Alini, M.; Musumeci, G. Mesenchymal Stem Cell-Based Cartilage Regeneration Approach and Cell Senescence: Can We Manipulate Cell Aging and Function? Tissue Eng. Part B Rev. 2017, 23, 529–539. [Google Scholar] [CrossRef]
- Matjusaitis, M.; Chin, G.; Sarnoski, E.A.; Stolzing, A. Biomarkers to Identify and Isolate Senescent Cells. Ageing Res. Rev. 2016, 29, 1–12. [Google Scholar] [CrossRef]


| Breed | Age (Years) | Gender | Donor’s Number | |
|---|---|---|---|---|
| 1 | Standardbred | 3 | M | 4 |
| 2 | Standardbred | 12 | F | 2 |
| 3 | Pleasure riding horse | 12 | M | 1 |
| 4 | Standardbred | 23 | F | 3 |
| 5 | Pleasure riding horse | 40 | M | 2 |
| Name | Forward | Reverse | bp |
|---|---|---|---|
| CD90 | 5′-ATGAGAATACCACCGCCACA-3′ | 5′-AGTTTGTCTCGGAGCACAGA-3′ | 262 |
| CD105 | 5′-TCAGGTCCCCAACACTAACC-3′ | 5′-AGTCTTGTTCGTGCTGAGGA-3′ | 148 |
| CD34 | 5′-CCTTGCCCAGTCTGAGGTTA-3′ | 5′-GTCTTGCGGGAATAGTGCTG-3′ | 172 |
| SOX9 | 5′-GAACAGCCCGTCTACACACA-3′ | 5′-GCCACTGATTCGCAACAAGG-3′ | 235 |
| COLL2 | 5′-CTGGCAAGCAAGGAGACAGA-3′ | 5′-CCATTAGCGCCATCTTTGCC-3′ | 292 |
| ACAN | 5′-TCATCTAGAGCCCACTGCCT-3′ | 5′-AGTCCACCGAGGTCCTCTAC-3′ | 234 |
| NANOG | 5′-TCTCTCCTCTGCCTTCCTCC -3′ | 5′-TCTGCTGGAGGCTGAGGTAT-3′ | 225 |
| OCT4 | 5′-GGTACGAGTGTGGTTCTGCA-3′ | 5′-ACCGAGGAGTACAGCGTAGT-3′ | 192 |
| SOX2 | 5′-GCCCTGCAGTACAACTCCAT-3′ | 5′-GACTTGACCACCGAACCCAT-3′ | 128 |
| GAPDH | 5′-TGCCCCAATGTTTGTGATGG-3′ | 5′-CACTGTGGTCATGAGTCCCT-3′ | 154 |
| G0/G1 (%) | S Phase (%) | G2/M (%) | 4N (%) | |
|---|---|---|---|---|
| 3Y Group | ||||
| Donor 1 | 56.6 ± 1.2 | 5.3 ± 2.6 | 28.6 ± 1.4 | 8.6 ± 1.2 a |
| Donor 2 | 58.0 ± 1.1 | 9.7 ± 1.4 | 26.9 ± 1.6 | 7.5 ± 0.9 a |
| Donor 3 | 58.5 ± 1.4 | 21.3 ± 0.9 | 18.3 ± 1.1 | 7.4 ± 0.9 a |
| Donor 4 | 48.6 ± 0.8 | 15.0 ± 0.5 | 28.2 ± 0.9 | 7.6 ± 0.3 a |
| 12Y Group | ||||
| Donor 1 | 64.1 ± 1.6 | 10.1 ± 1.1 | 23.3 ± 1.4 | 12.0 ± 1.2 |
| Donor 2 | 65.6 ± 1.6 | 9.5 ± 1.5 | 23.3 ± 1.1 | 8.5 ± 0.9 |
| Donor 3 | 59.9 ± 1.7 | 9.0 ± 1.6 | 22.6 ± 1.2 | 8.2 ± 0.5 |
| 23Y Group | ||||
| Donor 1 | 68.7 ± 1.6 | 4.9 ± 0.9 | 25.5 ± 1.4 | 10.5 ± 0.6 |
| Donor 2 | 61.6 ± 0.5 | 9.4 ± 0.2 | 16.5 ± 0.6 | 9.5 ± 0.3 |
| Donor 3 | 84.7 ± 0.8 | 7.8 ± 0.3 | 5.2 ± 0.7 | 10.7 ± 0.3 |
| 40Y Group | ||||
| Donor 1 | 67.1 ± 1.1 | 9.9 ± 1.5 | 18.9 ± 1.2 | 14.4 ± 0.7 |
| Donor 2 | 74.3 ± 1.2 | 8.1 ± 2.4 | 16.1 ± 1.5 | 18.5 ± 1.1 |
© 2019 by the authors. Licensee MDPI, Basel, Switzerland. This article is an open access article distributed under the terms and conditions of the Creative Commons Attribution (CC BY) license (http://creativecommons.org/licenses/by/4.0/).
Share and Cite
Mazzotti, E.; Teti, G.; Falconi, M.; Chiarini, F.; Barboni, B.; Mazzotti, A.; Muttini, A. Age-Related Alterations Affecting the Chondrogenic Differentiation of Synovial Fluid Mesenchymal Stromal Cells in an Equine Model. Cells 2019, 8, 1116. https://doi.org/10.3390/cells8101116
Mazzotti E, Teti G, Falconi M, Chiarini F, Barboni B, Mazzotti A, Muttini A. Age-Related Alterations Affecting the Chondrogenic Differentiation of Synovial Fluid Mesenchymal Stromal Cells in an Equine Model. Cells. 2019; 8(10):1116. https://doi.org/10.3390/cells8101116
Chicago/Turabian StyleMazzotti, Eleonora, Gabriella Teti, Mirella Falconi, Francesca Chiarini, Barbara Barboni, Antonio Mazzotti, and Aurelio Muttini. 2019. "Age-Related Alterations Affecting the Chondrogenic Differentiation of Synovial Fluid Mesenchymal Stromal Cells in an Equine Model" Cells 8, no. 10: 1116. https://doi.org/10.3390/cells8101116
APA StyleMazzotti, E., Teti, G., Falconi, M., Chiarini, F., Barboni, B., Mazzotti, A., & Muttini, A. (2019). Age-Related Alterations Affecting the Chondrogenic Differentiation of Synovial Fluid Mesenchymal Stromal Cells in an Equine Model. Cells, 8(10), 1116. https://doi.org/10.3390/cells8101116