Effect of Fermentation on Enhancing the Nutraceutical Properties of Arthrospira platensis (Spirulina)


Abstract

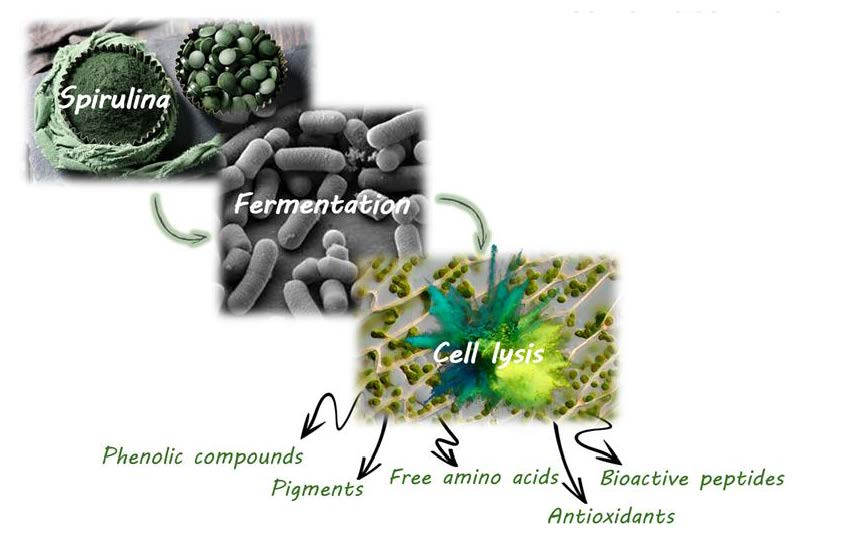
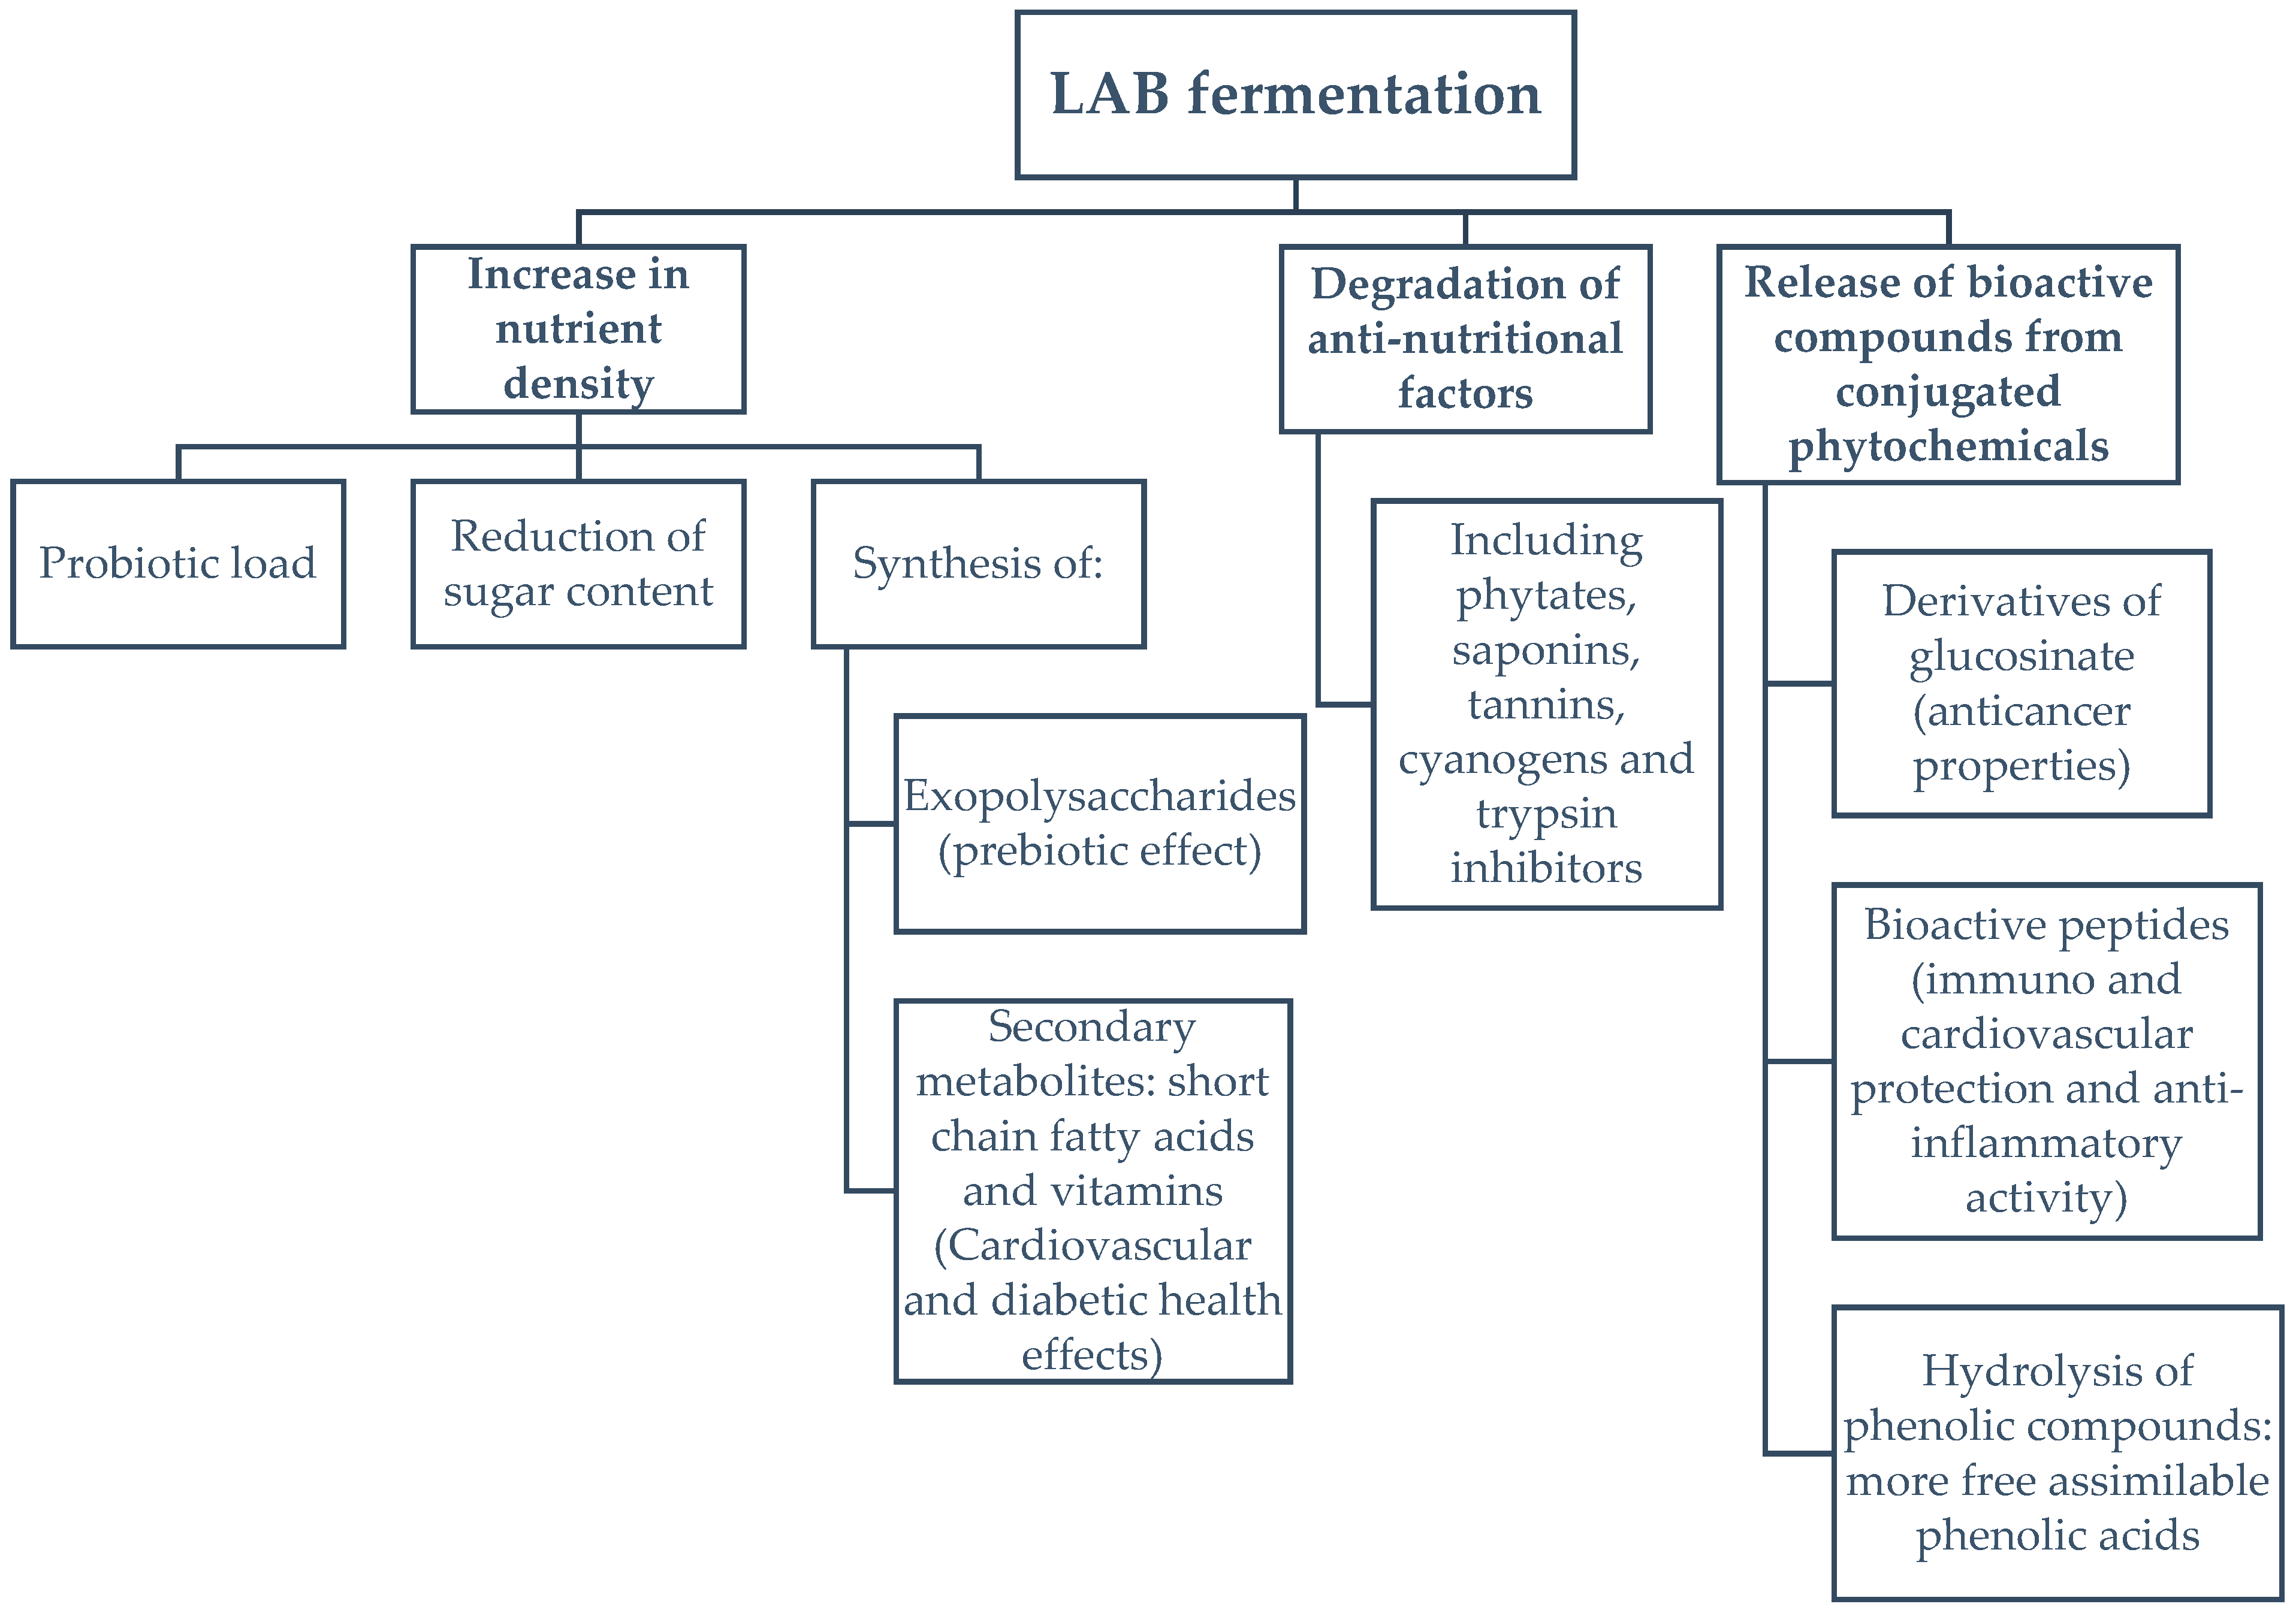
1. Introduction
2. Materials and Methods
2.1. Preparation of the Lactobacillus plantarum Stock
2.2. Spirulina Fermentation
2.3. Total Phenolic Content (TPC) Determination
2.4. C-phycocyanin Determination
2.5. DPPH Assay
2.6. Ferric Reducing Antioxidant Power (FRAP) Assay
2.7. Oxygen Radical Absorbance Capacity (ORAC) Assay
2.8. Protein Fragmentation Using SDS-PAGE
2.9. Free Methionine Content Determination
2.10. Statistical Analyses
3. Results
3.1. pH and Colour Variation during Fermentation
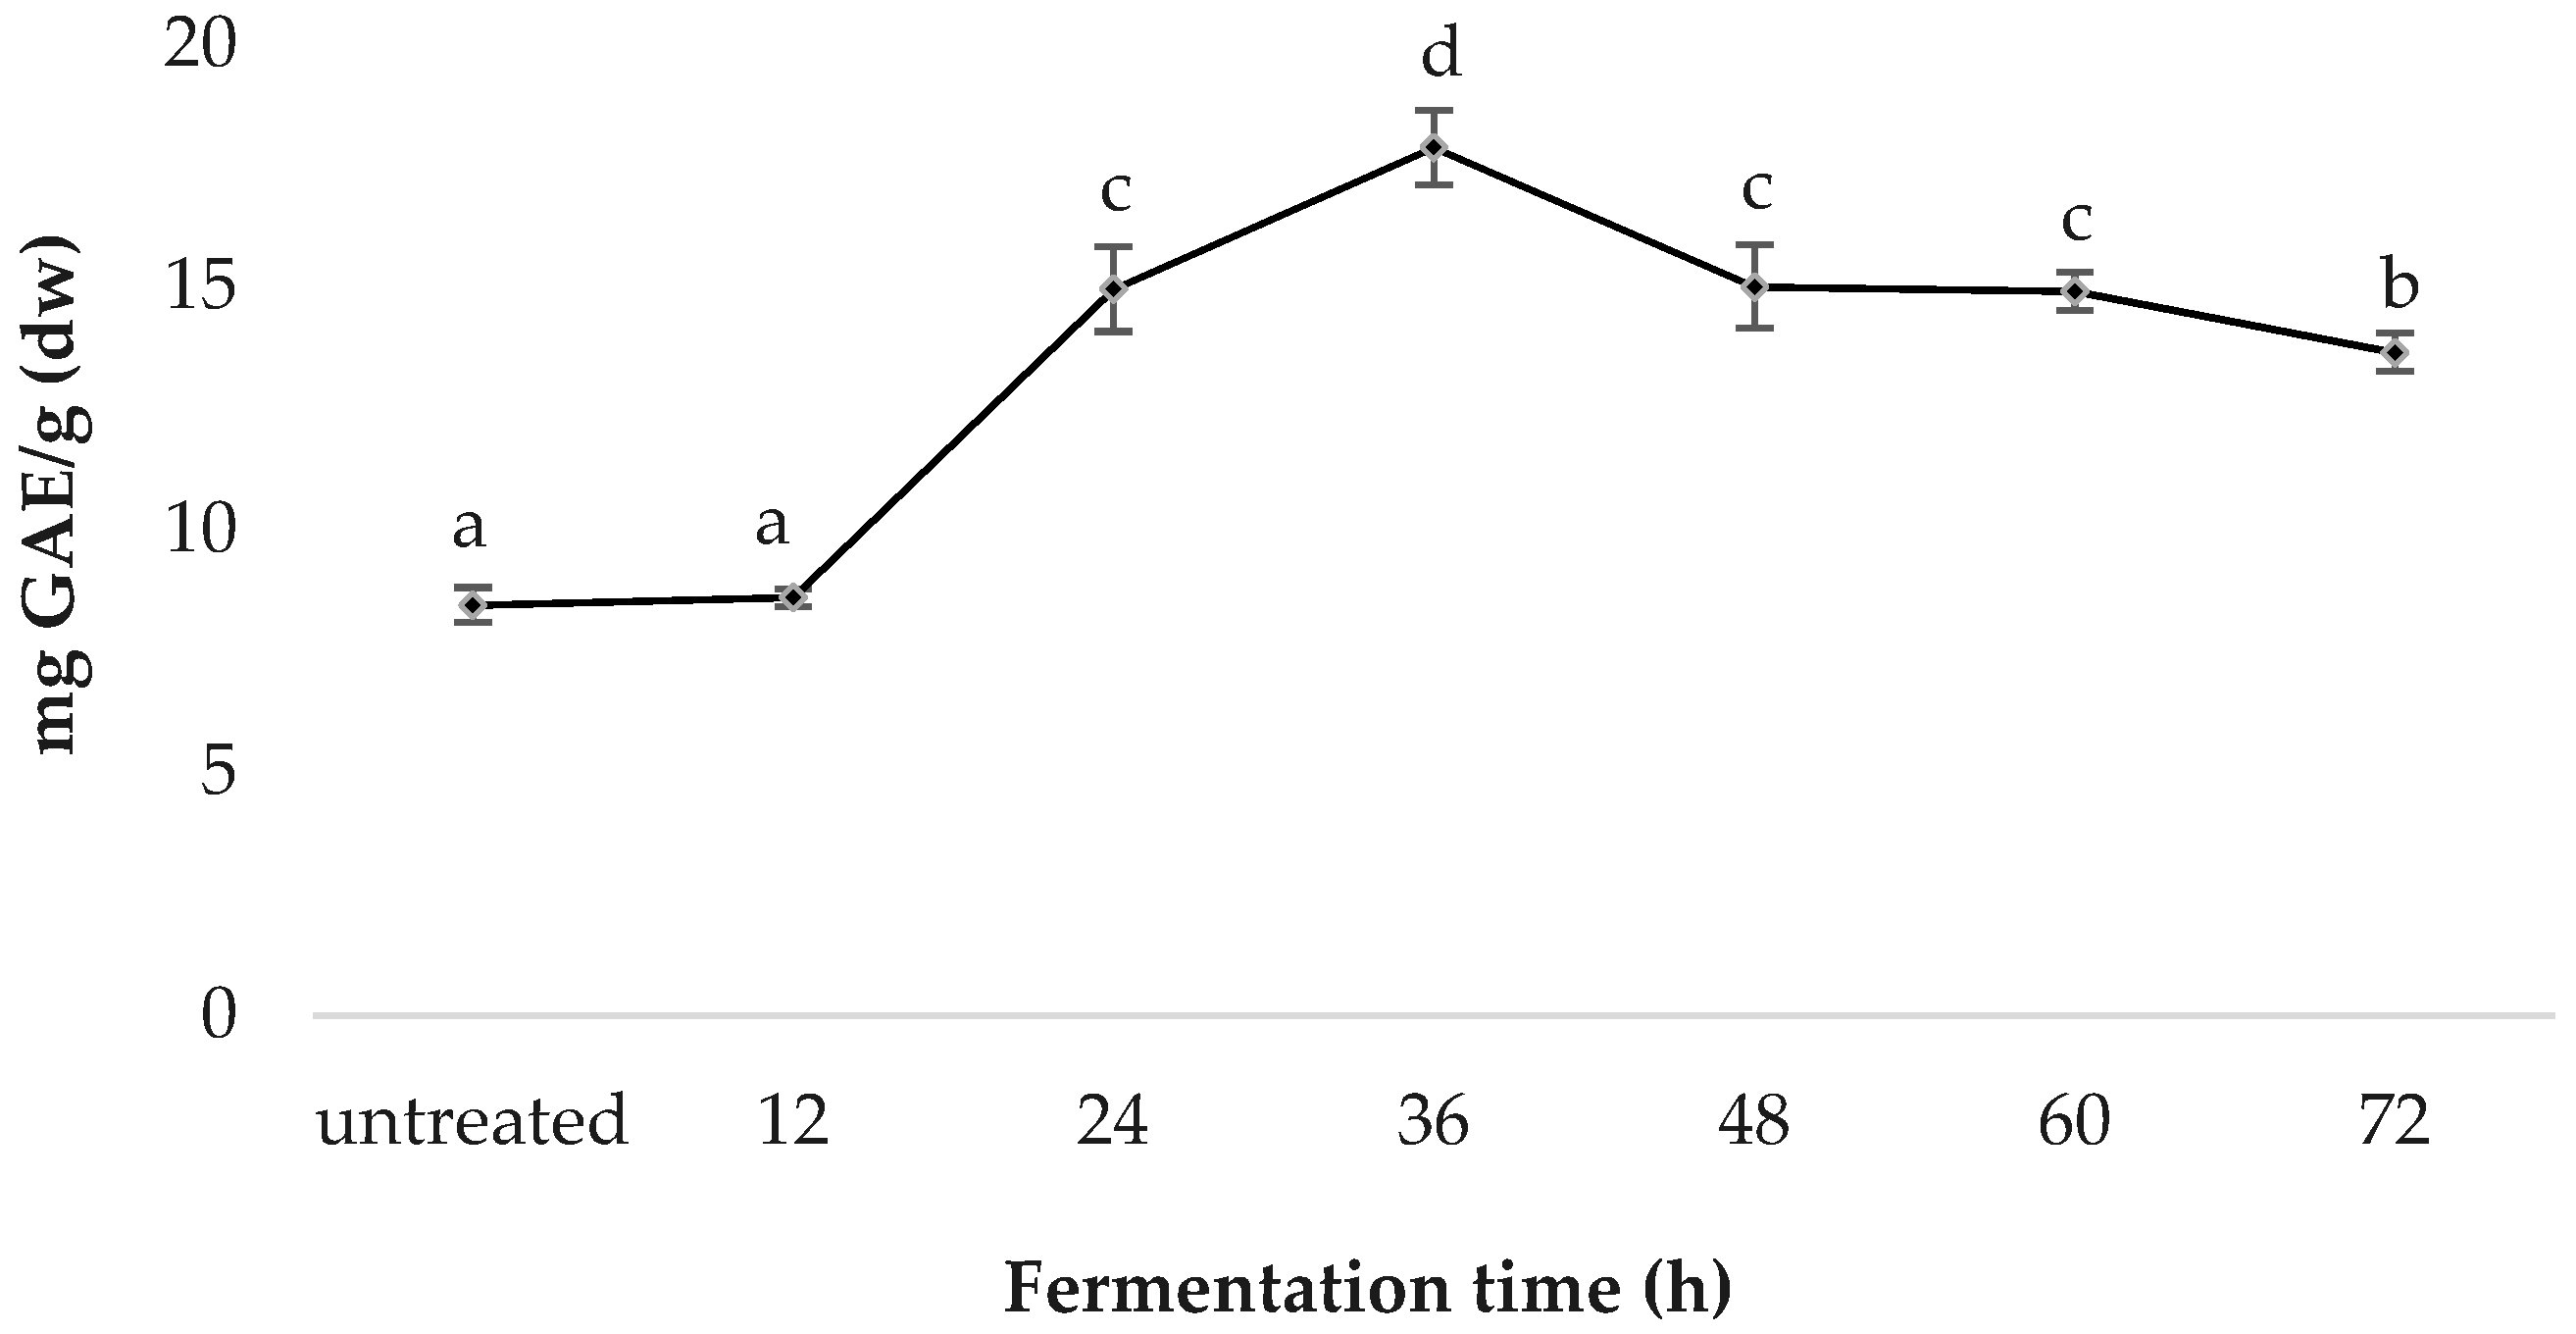
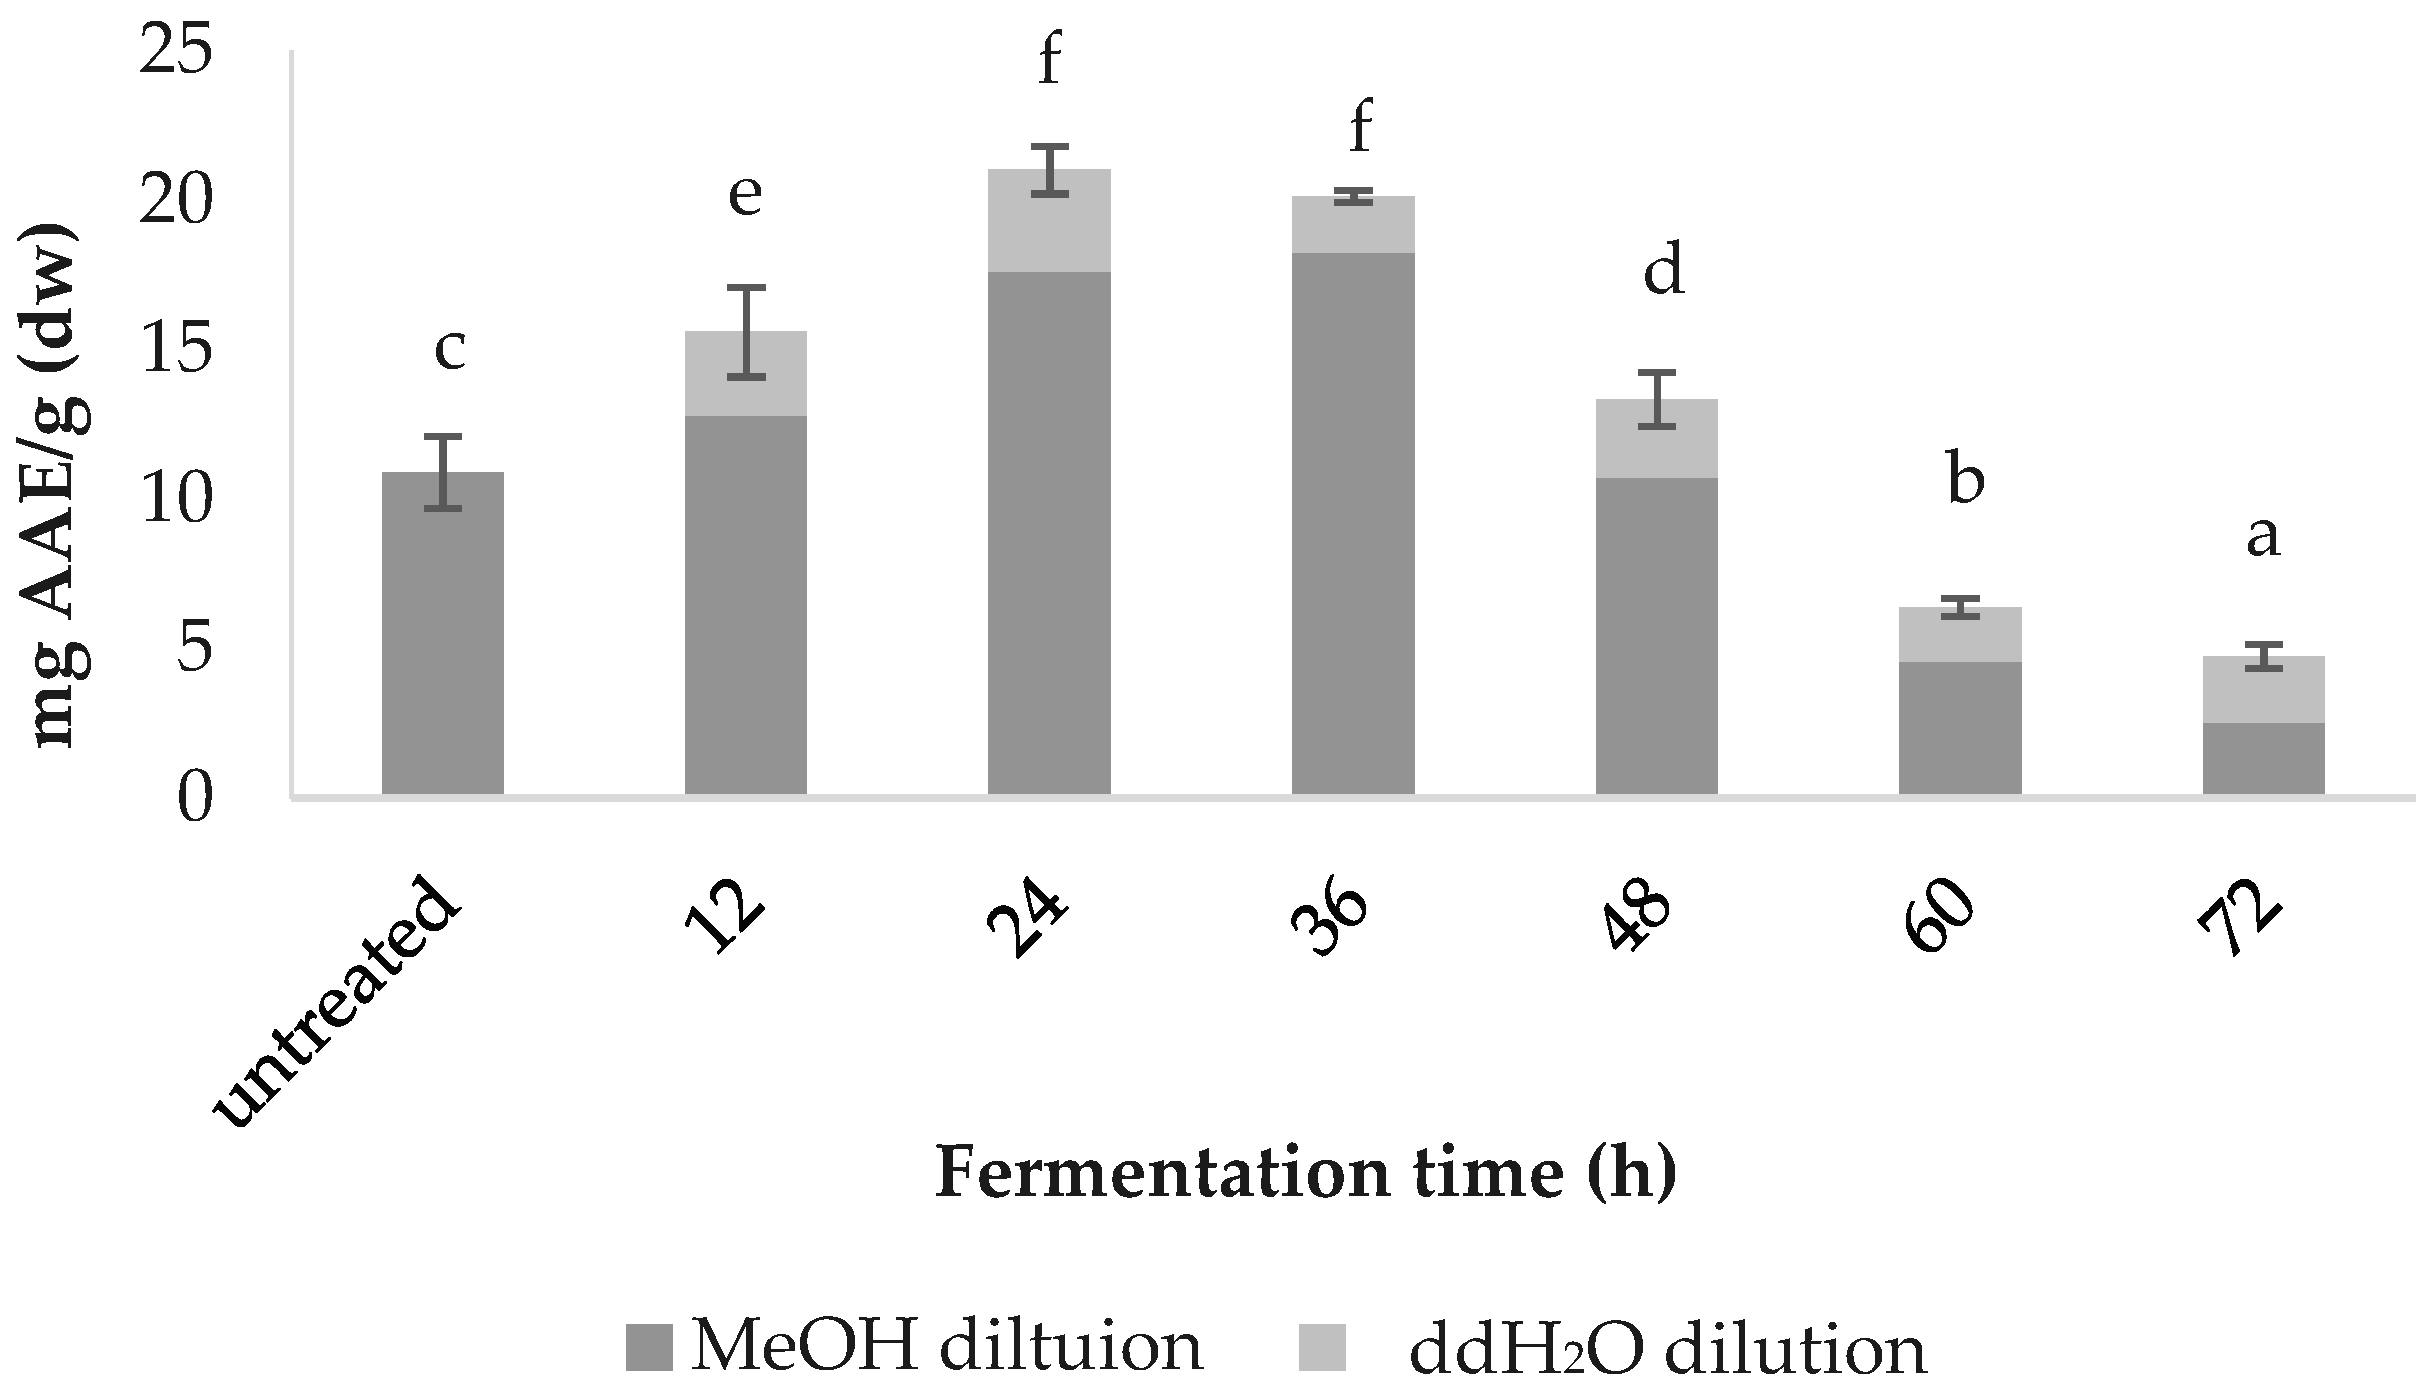
3.2. Total Phenolic Content (TPC)
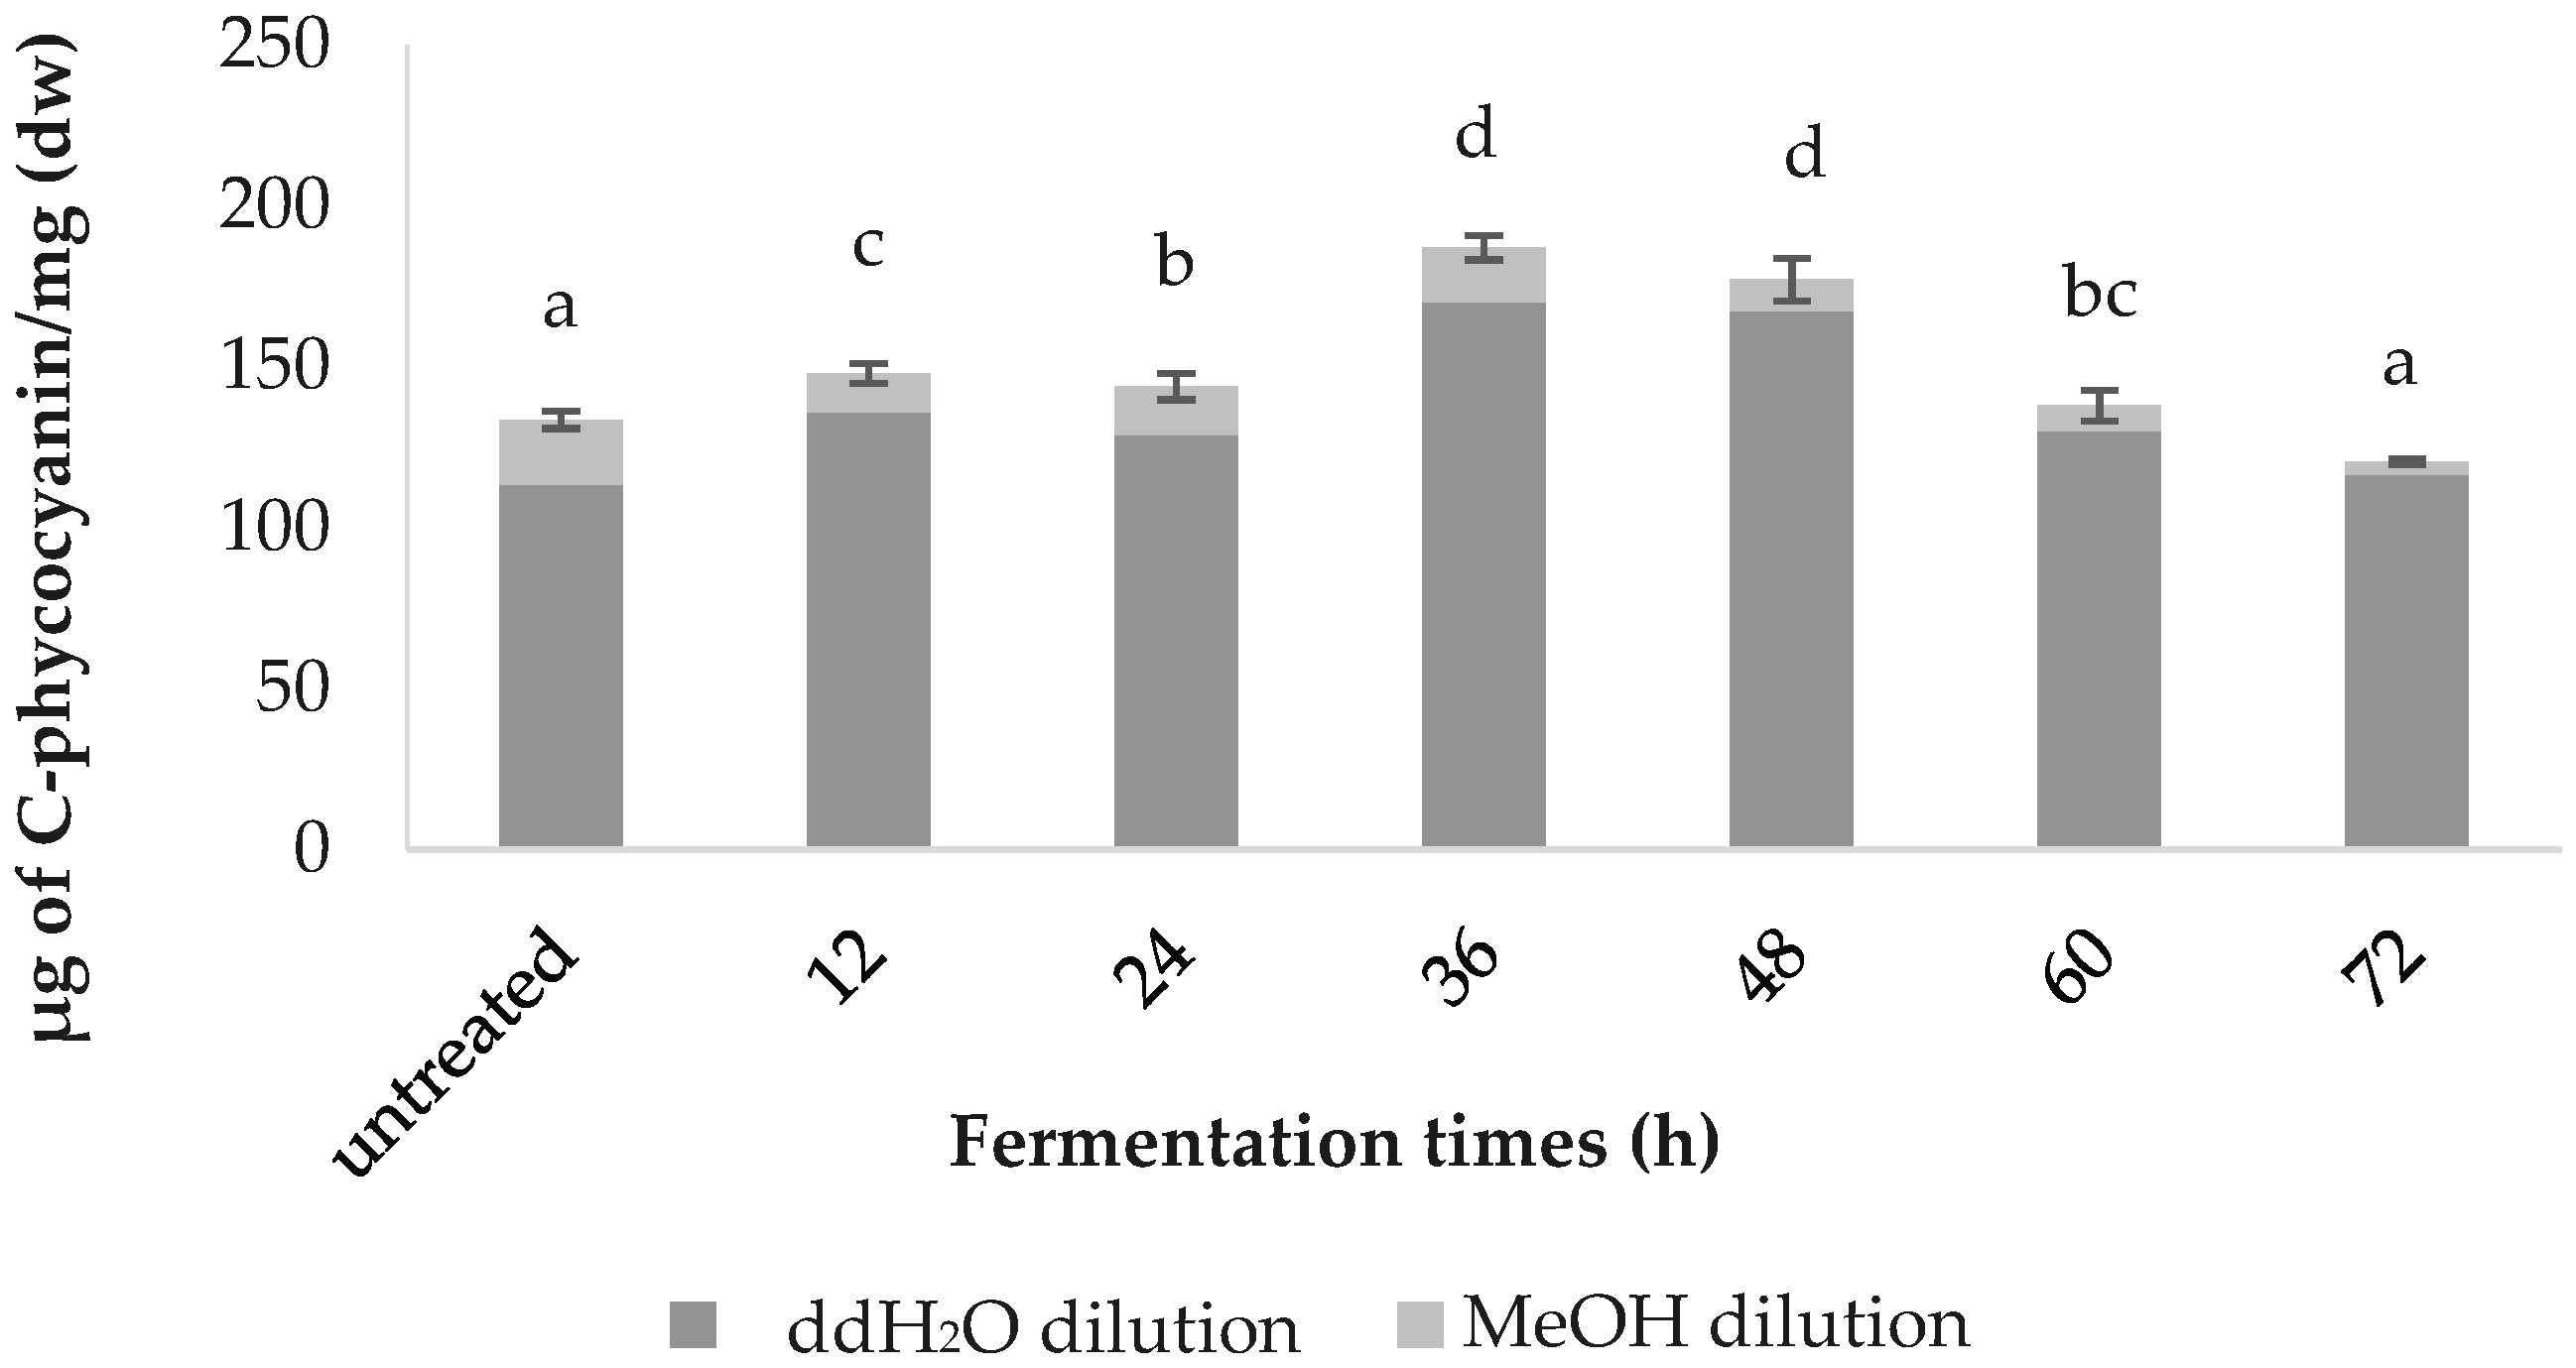
3.3. C-phycocyanin Content
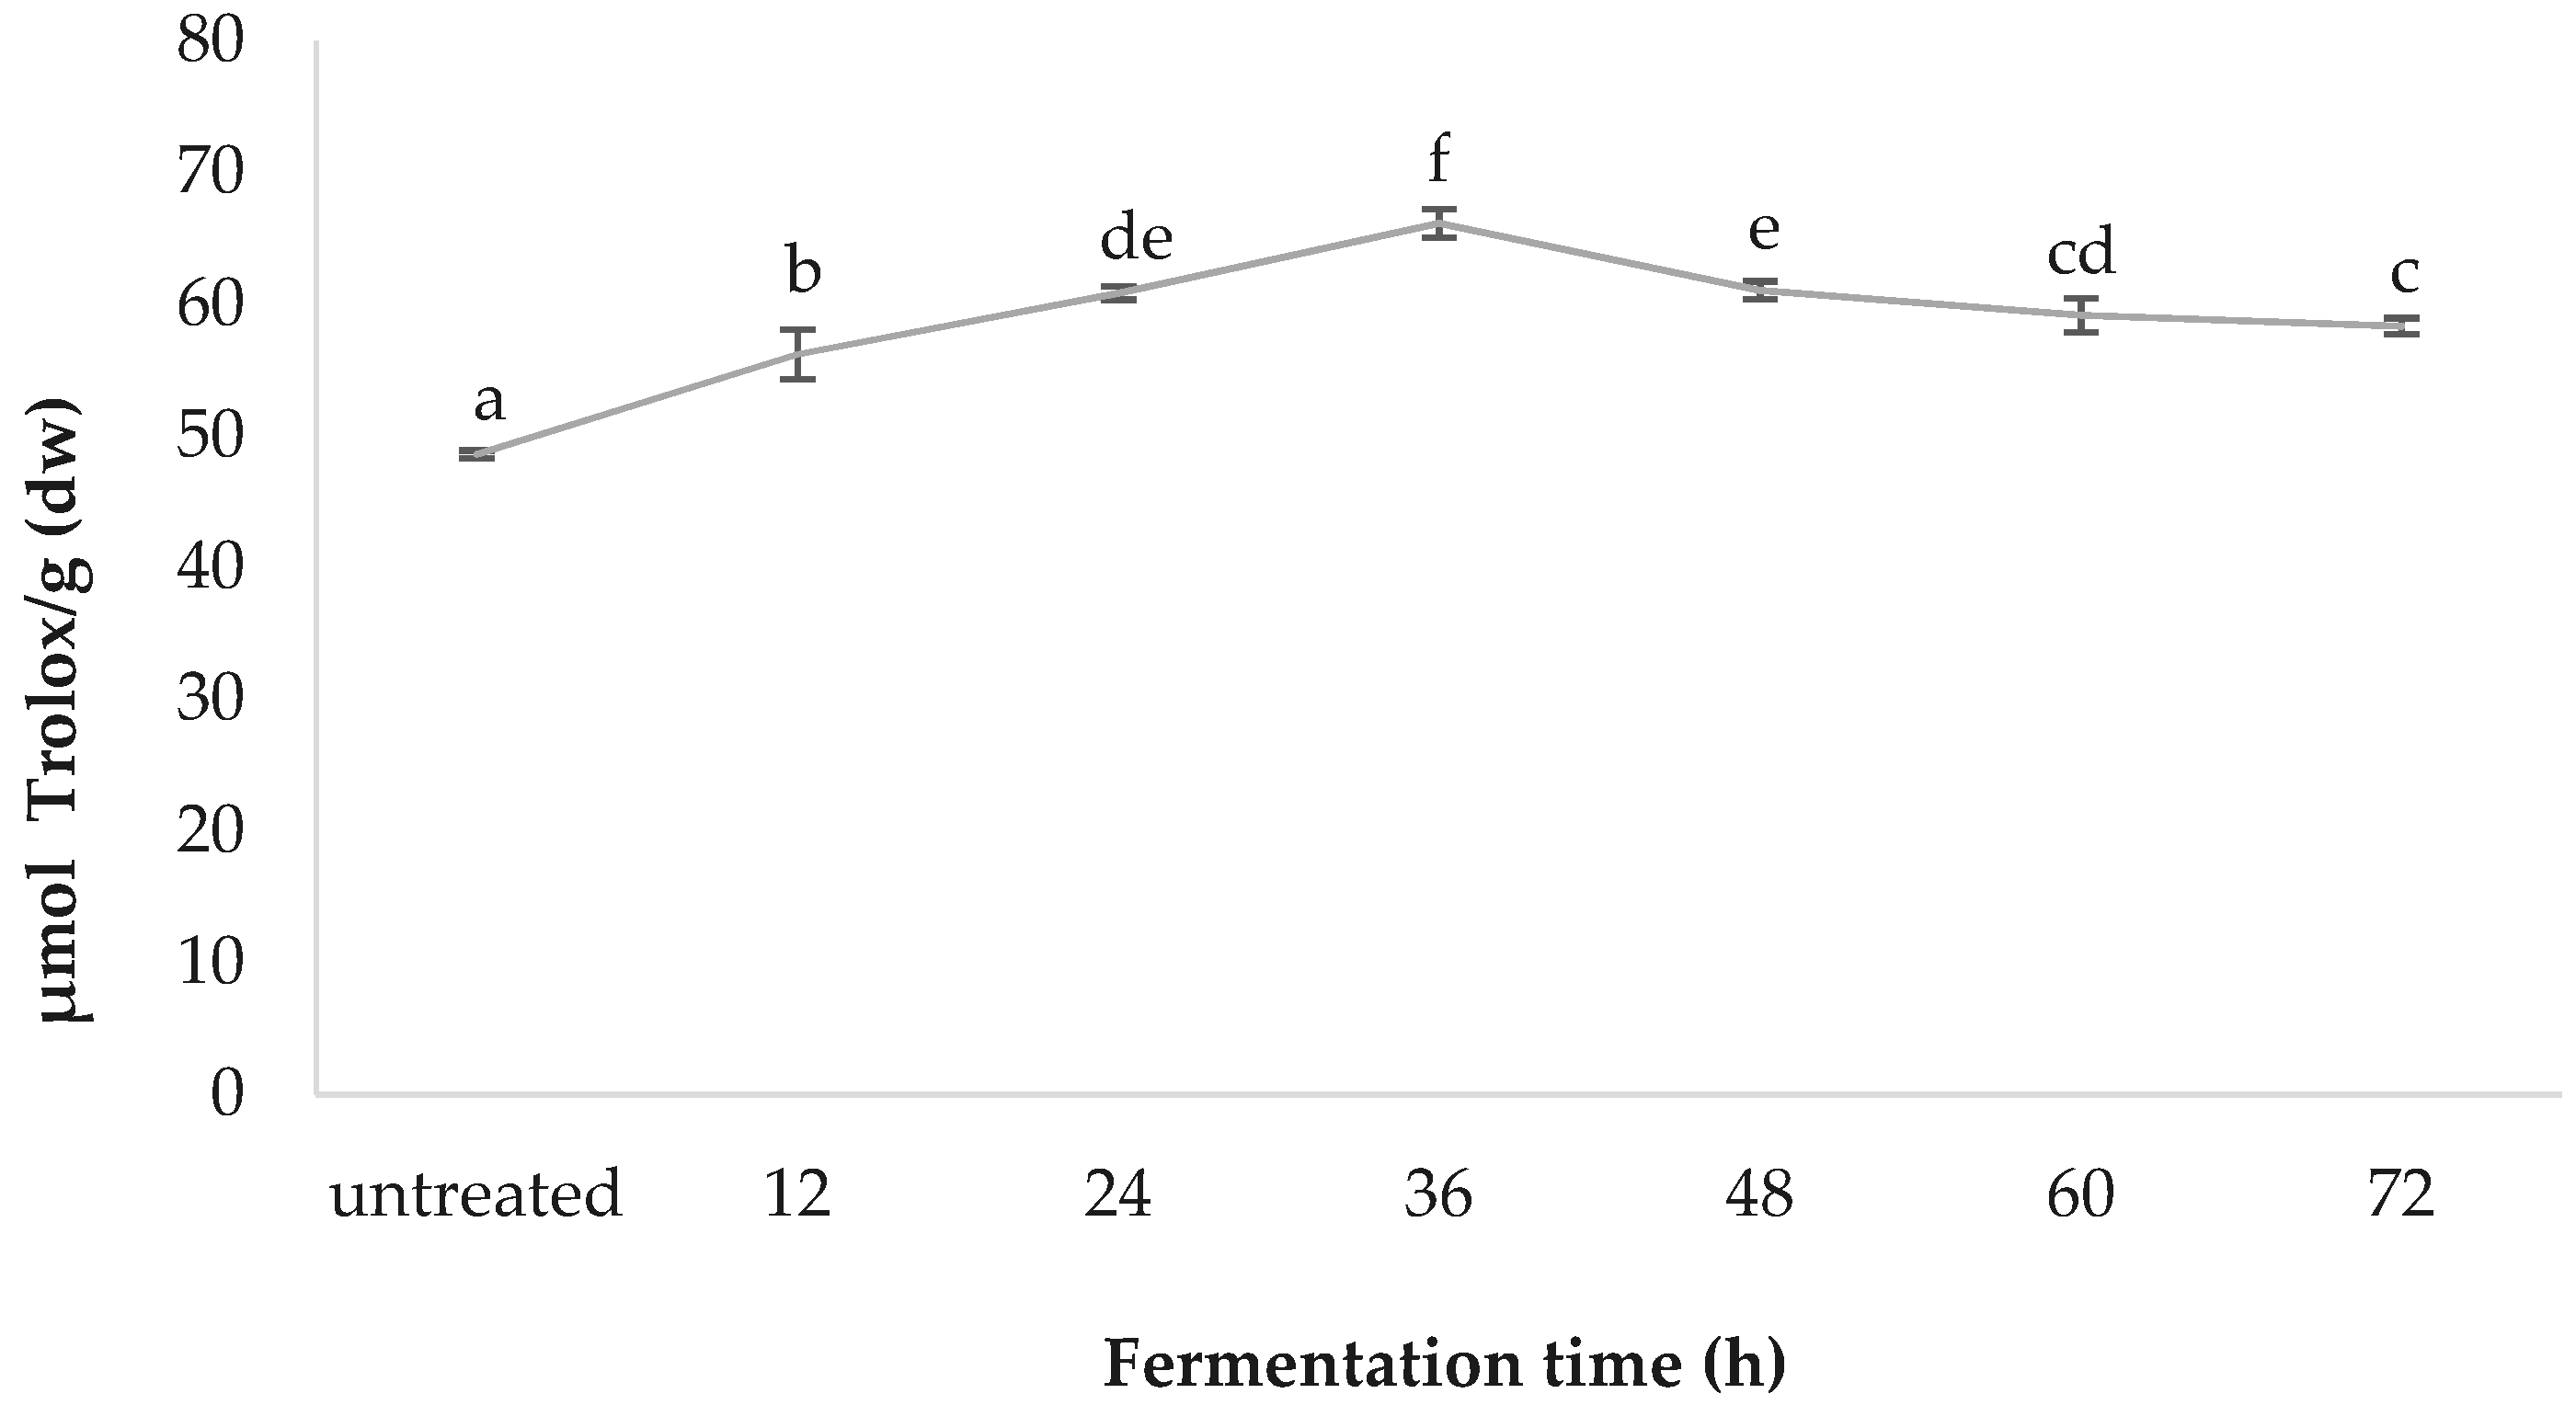
3.4. DPPH Radical Scavenging Capacity
3.5. FRAP Values
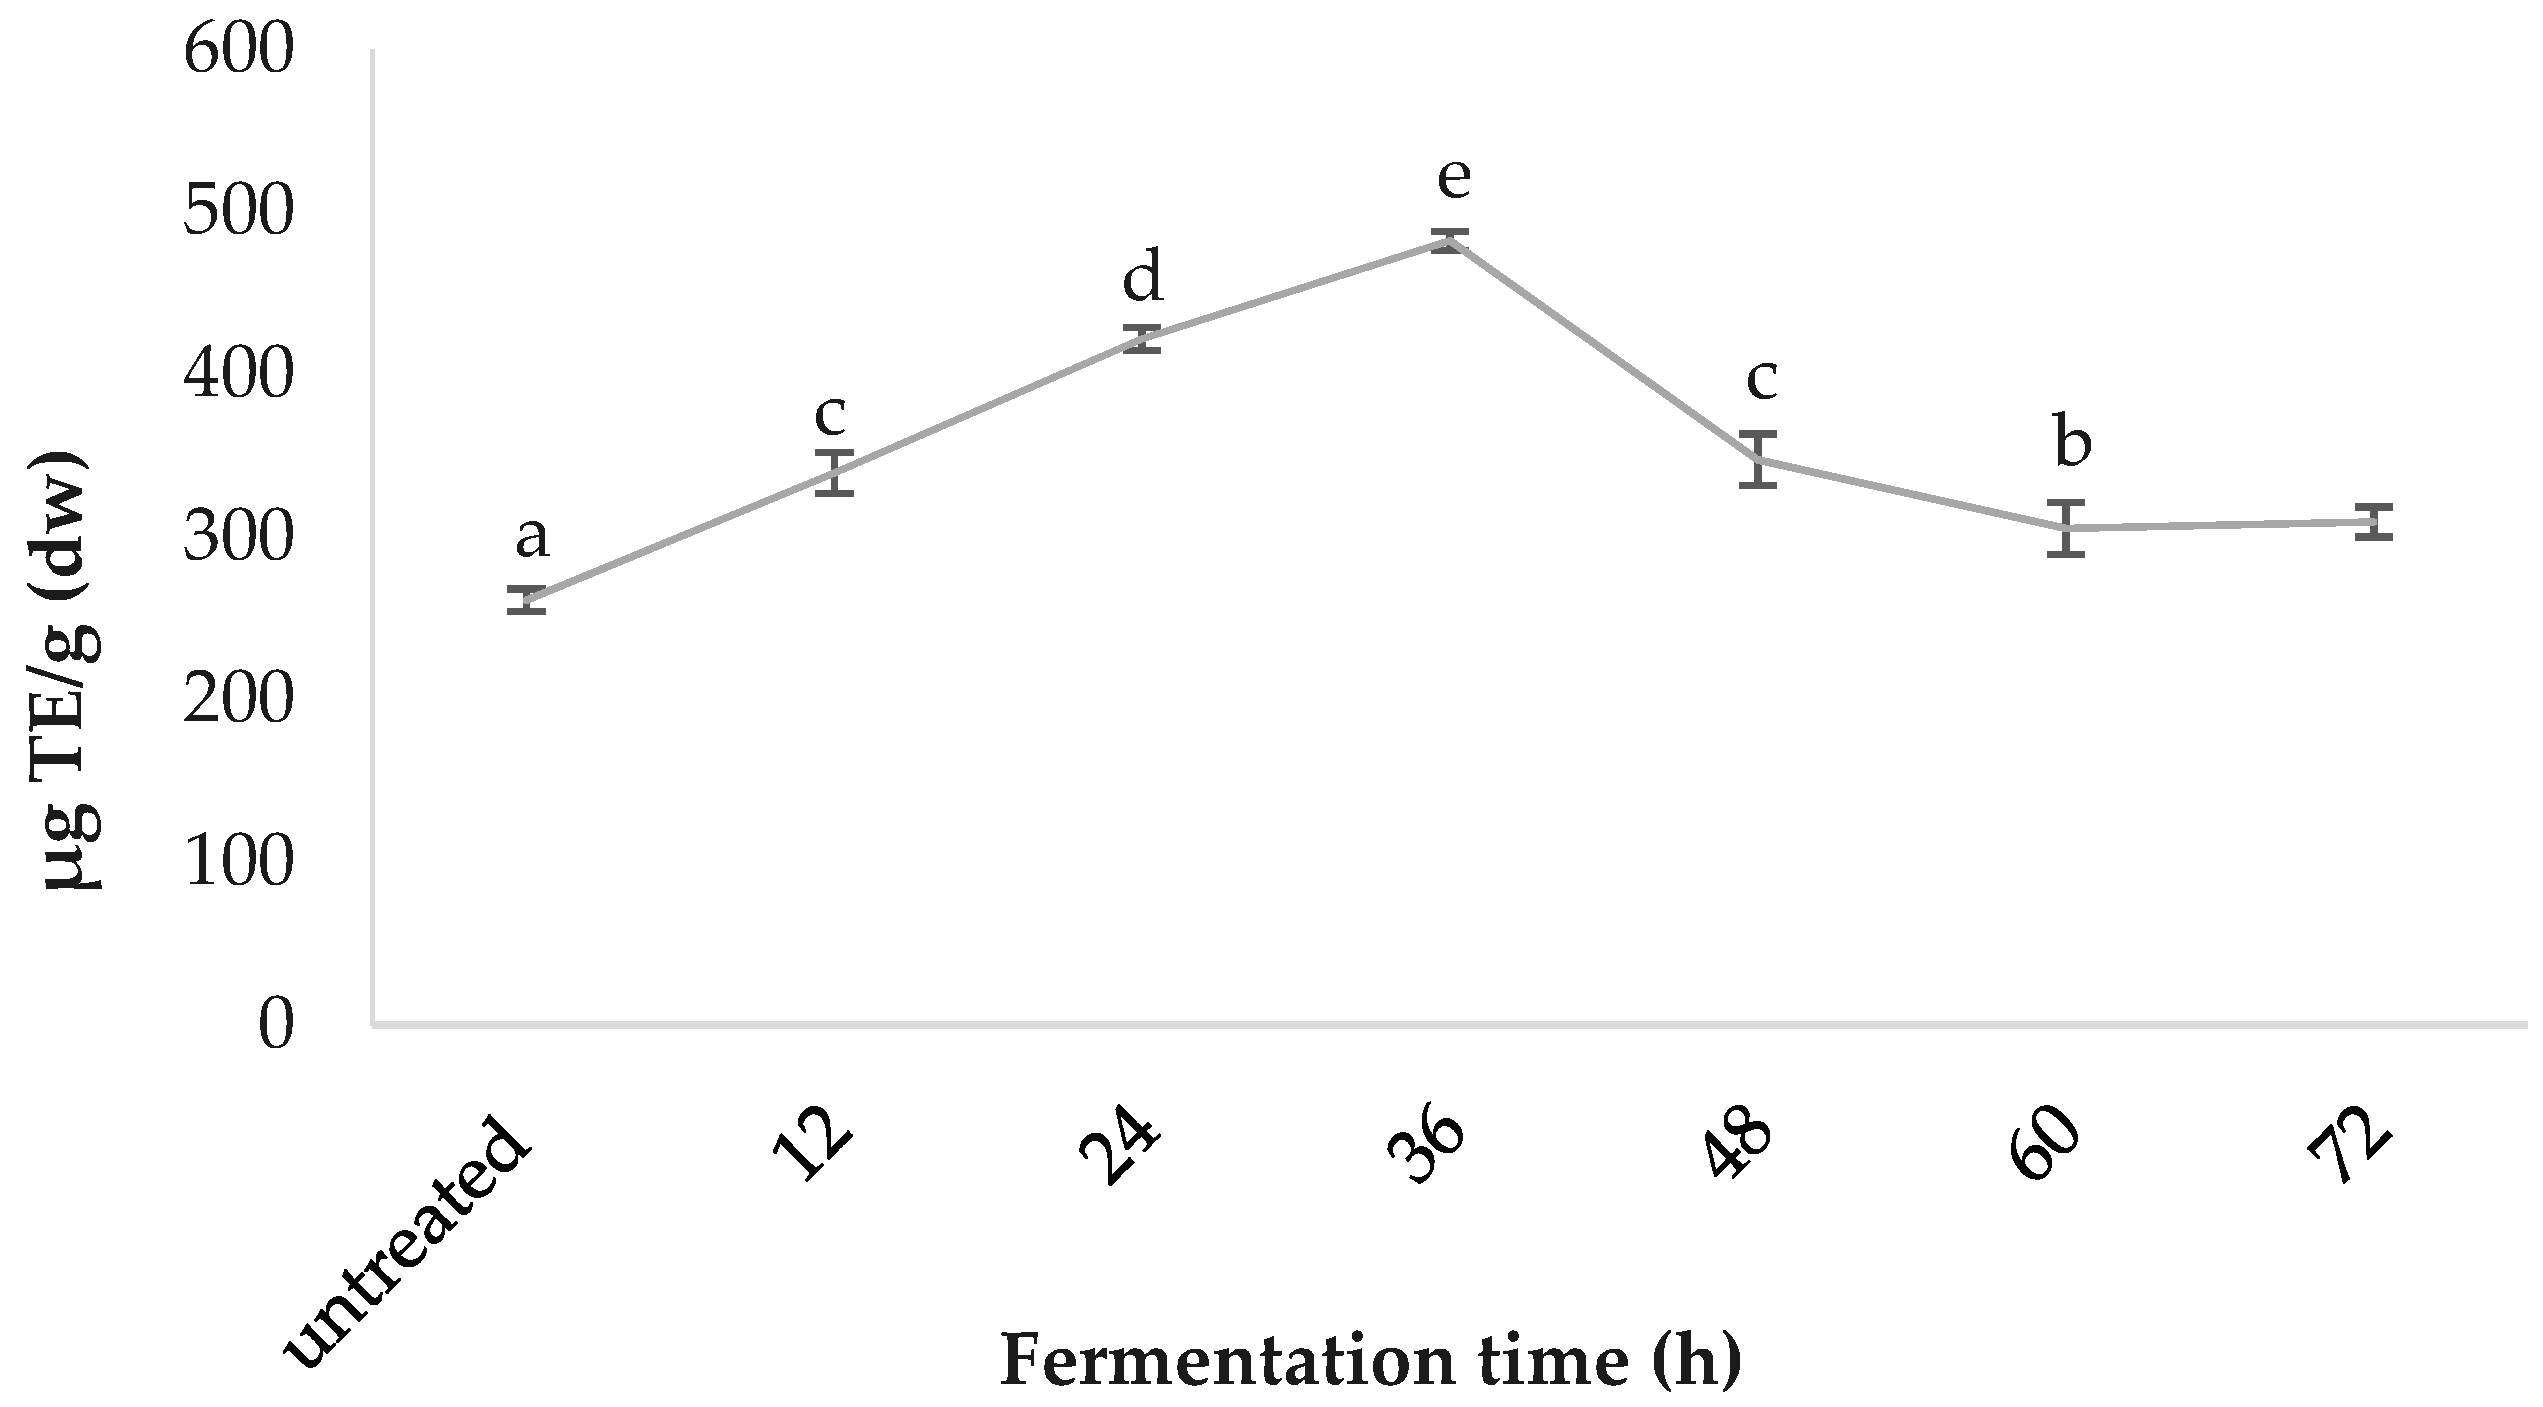
3.6. ORAC
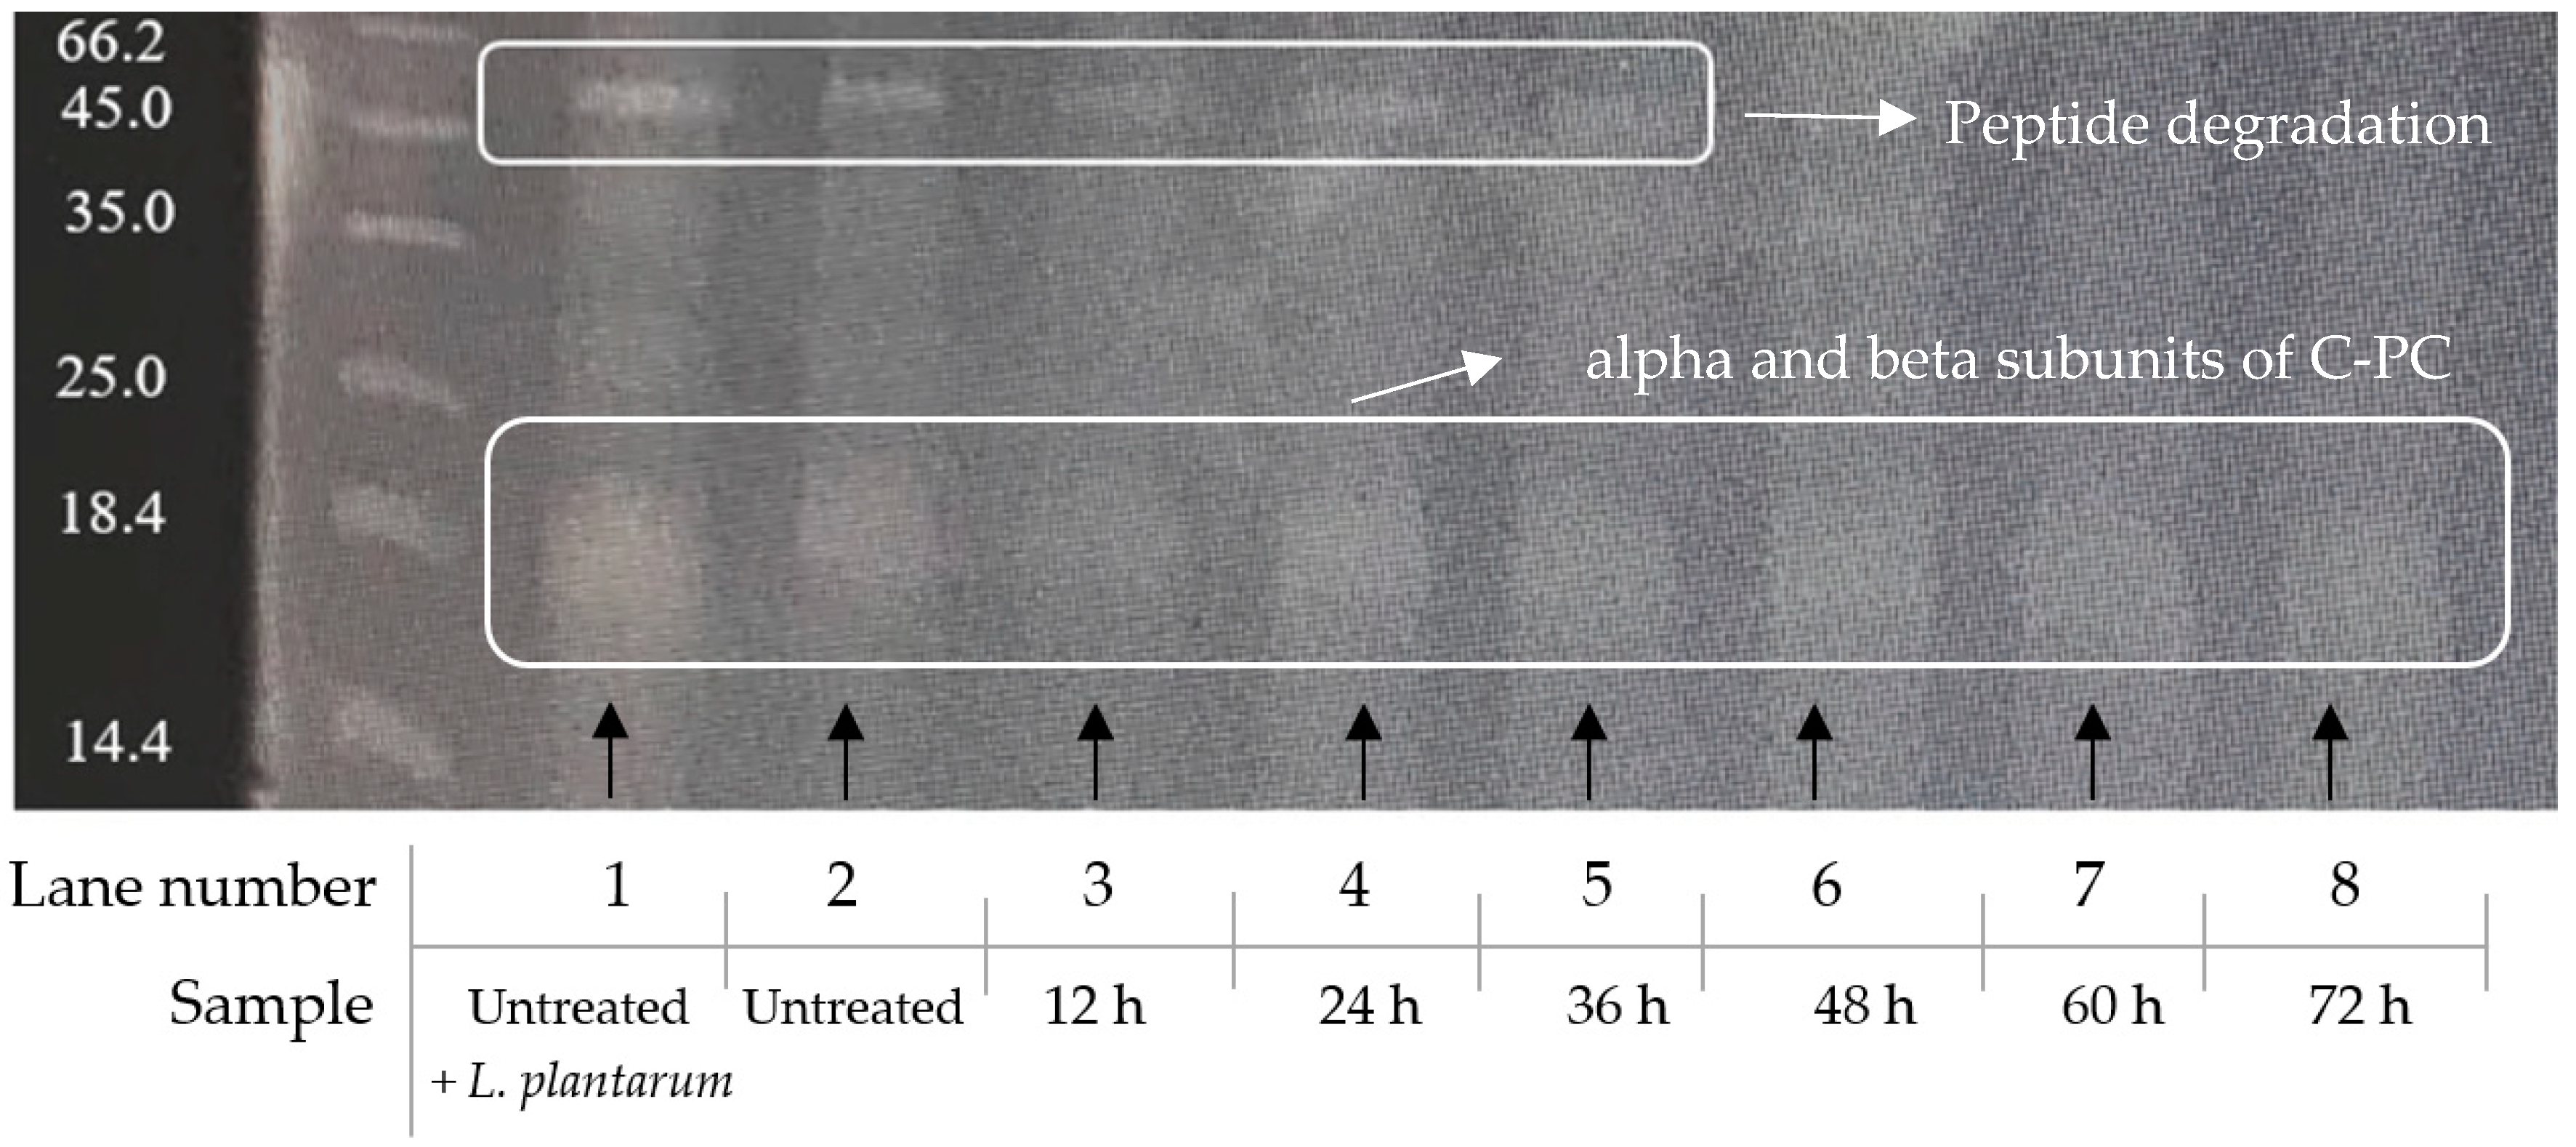
3.7. Protein Fragmentation
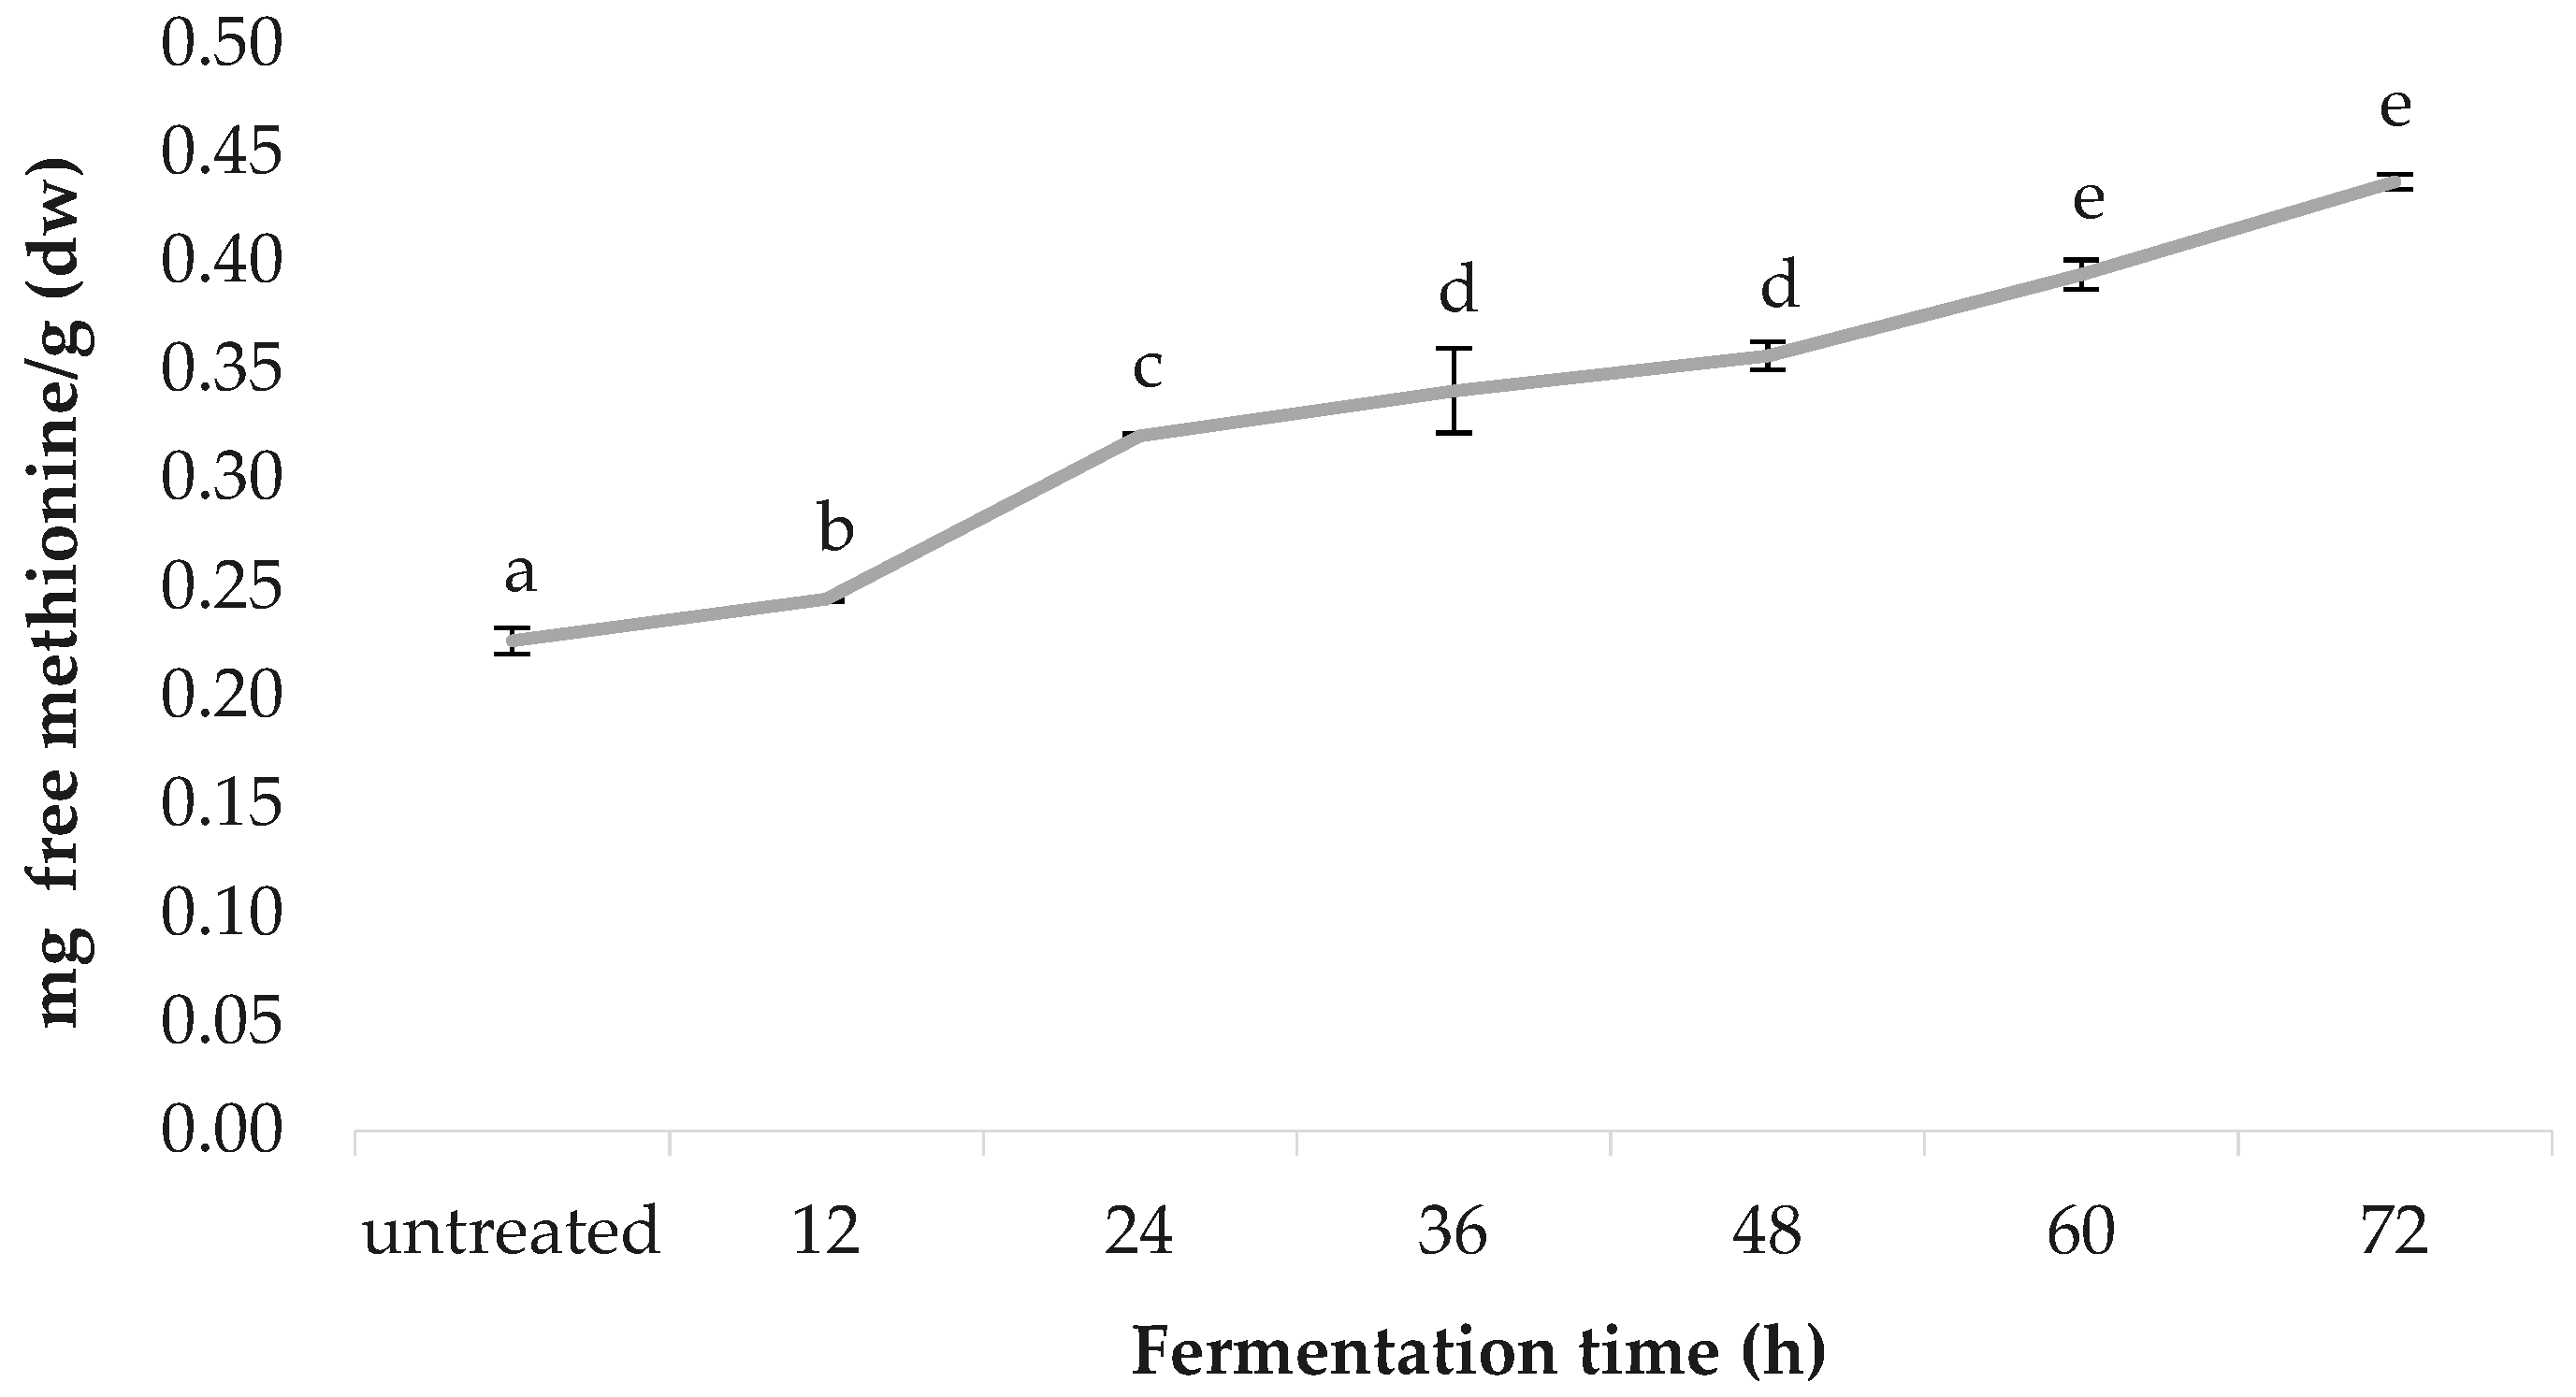
3.8. Free Methionine Content
4. Discussion
4.1. Effect of Fermentation on Spirulina
4.2. Correlation between pH as an Indicator of Fermentation Status and Results Trend
4.3. Benefits of the ORAC Assay Versus other Traditional TAC Assays
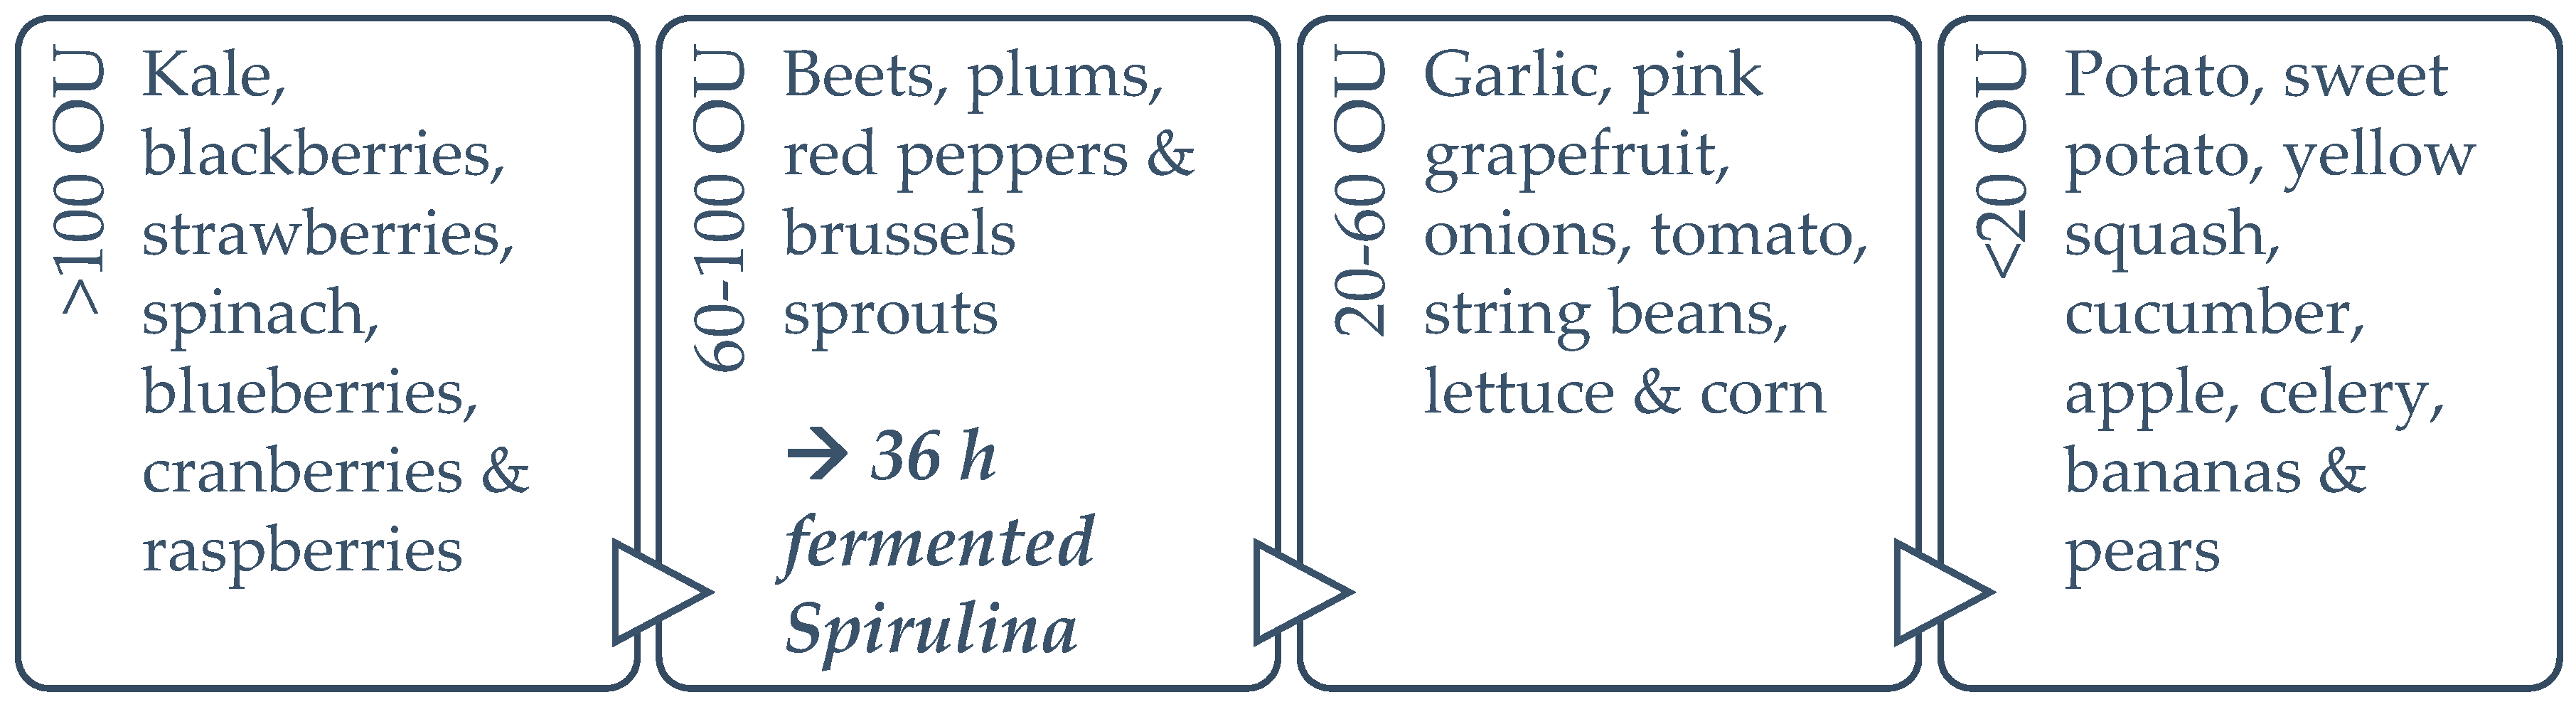
4.4. Potential Application of Spirulina Fermentation
5. Conclusions
Author Contributions
Funding
Acknowledgments
Conflicts of Interest
References
- Sapp, J. The prokaryote-eukaryote dichotomy: Meanings and mythology. J. Mol. Biol. 2005, 69, 292–305. [Google Scholar] [CrossRef] [PubMed]
- Borowitzka, M.A. Commercial production of microalgae: Ponds, tanks, tubes and fermenters. J. Biotechnol. 1999, 70, 313–321. [Google Scholar] [CrossRef]
- Miranda, M.; Cintra, R.; Barros, S.; Mancini-Filho, J. Antioxidant activity of the microalga Spirulina maxima. Braz. J. Med. Biol. Res. 1998, 31, 1075–1079. [Google Scholar] [CrossRef] [PubMed]
- Bishop, W.M.; Zubeck, H.M. Evaluation of microalgae for use as nutraceuticals and nutritional supplements. J. Nutr. Food Sci. 2012, 2, 147–153. [Google Scholar] [CrossRef]
- Boussiba, S.; Richmond, A.E. Isolation and characterization of phycocyanins from the blue-green alga Spirulina platensis. Arch. Microbiol. 1979, 120, 155–159. [Google Scholar] [CrossRef]
- Khan, Z.; Bhadouria, P.; Bisen, P. Nutritional and therapeutic potential of Spirulina. Curr. Pharm. Biotechnol. 2005, 6, 373–379. [Google Scholar] [CrossRef]
- Belay, A.; Ota, Y.; Miyakawa, K.; Shimamatsu, H. Current knowledge on potential health benefits of Spirulina. J. Appl. Phycol. 1993, 5, 235–241. [Google Scholar] [CrossRef]
- Ramamoorthy, A.; Premakumari, S. Effect of supplementation of Spirulina on hypercholesterolemic patients. J. Food Sci. Technol. 1996, 33, 124–128. [Google Scholar]
- Layam, A.; Reddy, C. Antidiabetic property of spirulina. Diabetol. Croat. 2006, 35, 29–33. [Google Scholar]
- Konícková, R.; Vanková, K.; Vaníková, J.; Vánová, K.; Muchová, L.; Subhanová, I.; Zadinová, J.; Zelenka, D.A.; Kolár, M.; Strnad, H.; et al. Anti-cancer effects of blue-green alga Spirulina platensis, a natural source of bilirubin-like tetrapyrrolic compounds. Ann. Hepatol. 2014, 13, 273–283. [Google Scholar]
- Cheong, S.; Kim, M.; Sok, D.; Hwang, S.; Kim, J.; Kim, H.; Lee, J.; Kim, Y.; Kim, M. Spirulina prevents atherosclerosis by reducing hypercholesterolemia in rabbits fed a high-cholesterol diet. J. Nutr. Sci. Vitaminol. 2010, 56, 34–40. [Google Scholar] [CrossRef] [PubMed]
- Nicoletti, M. Microalgae nutraceuticals. Foods 2016, 5, 54. [Google Scholar] [CrossRef] [PubMed]
- Christaki, E.; Florou-Paneri, P.; Bonos, E. Microalgae: A novel ingredient in nutrition. Int. J. Food Sci. Nutr. 2011, 62, 794–799. [Google Scholar] [CrossRef] [PubMed]
- Batista, A.P.; Bandarra, N.; Raymundo, A.; Gouveia, L. Food Chemistry Research Development, Chapter 2; Nova Science Publishers, Inc.: New York, NY, USA, 2008; pp. 1–36. [Google Scholar]
- Intergovernmental Institution for the Use of Micro Algae Spirulina against Malnutrition (IIMSAM). Available online: https://www.who.int/pmnch/about/members/database/iimsam/en/ (accessed on 11 November 2018).
- Holman, B.; Malau-Aduli, A. Spirulina as a livestock supplement and animal feed. J. Anim. Physiol. Anim. Nutr. 2012, 97, 615–623. [Google Scholar] [CrossRef] [PubMed]
- Deng, R.; Chow, T. Hypolipidemic, antioxidant, and anti-inflammatory activities of microalgae Spirulina. Cardiovasc. Ther. 2010, 28, 33–45. [Google Scholar] [CrossRef]
- Sanjukta, S.; Rai, A. Production of bioactive peptides during soybean fermentation and their potential health benefits. Trends Food Sci. Technol. 2016, 50, 1–10. [Google Scholar] [CrossRef]
- Rai, A.K.; Jeyaram, K. Health Benefits of Functional Proteins in Fermented Foods, 1st ed.; Tamang, J.P., Ed.; CRC Press: Boca Raton, FL, USA, 2015; Volume 1, pp. 455–474. [Google Scholar]
- Limón, R.; Peñas, E.; Torino, M.; Martínez-Villaluenga, C.; Dueñas, M.; Frias, J. Fermentation enhances the content of bioactive compounds in kidney bean extracts. Food Chem. 2015, 172, 343–352. [Google Scholar] [CrossRef]
- Hur, S.; Lee, S.; Kim, Y.; Choi, I.; Kim, G. Effect of fermentation on the antioxidant activity in plant-based foods. Food Chem. 2014, 160, 346–356. [Google Scholar] [CrossRef]
- Rodríguez, H.; Curiel, J.A.; Landete, J.M.; de las Rivas, B.; de Felipe, F.L.; Gómez- Cordovés, C. Food phenolics and lactic acid bacteria. Int. J. Food Microbiol. 2009, 132, 79–90. [Google Scholar] [CrossRef]
- Ricci, I.; Artacho, R.; Olalla, M. Milk protein peptides with angiotensin I- converting enzyme inhibitory (ACEI) activity. Crit. Rev. Food Sci. Nutr. 2010, 50, 390–402. [Google Scholar] [CrossRef]
- Septembre-Malaterre, A.; Remize, F.; Poucheret, P. Fruits and vegetables, as a source of nutritional compounds and phytochemicals: Changes in bioactive compounds during lactic fermentation. Food Res. Int. 2017, 51, 128–136. [Google Scholar] [CrossRef]
- Crowley, S.; Mahony, J.; Van Sinderen, D. Current perspectives on antifungal lactic acid bacteria as natural bio-preservatives. Trends Food Sci. Technol. 2013, 33, 93–109. [Google Scholar] [CrossRef]
- Gupta, S.; Abu-Ghannam, N.; Scannell, A.G. Growth and kinetics of Lactobacillus plantarum in the fermentation of edible Irish brown seaweeds. Food Bioprod. Process. 2011, 89, 346–355. [Google Scholar] [CrossRef]
- Jaiswal, A.K.; Rajauria, G.; Abu-Ghannam, N.; Gupta, S. Effect of different solvents on polyphenolic content, antioxidant capacity and antibacterial activity of Irish York cabbage. J. Food Biochem. 2012, 36, 344–358. [Google Scholar] [CrossRef]
- Bennett, A.; Bogorad, L. Complimentary chromatic adaptation in a filamentous blue-green alga. J. Cell Biol. 1973, 58, 419. [Google Scholar] [CrossRef] [PubMed]
- Jaiswal, A.K.; Abu-Ghannam, N. Degradation kinetic modelling of color, texture, polyphenols and antioxidant capacity of York cabbage after microwave processing. Food Res. Int. 2013, 53, 125–133. [Google Scholar] [CrossRef]
- Benzie, I.F.F.; Strain, J.J. The ferric reducing ability of plasma (FRAP) as a measure of “antioxidant power”: The FRAP assay. Anal. Biochem. 1996, 239, 70–76. [Google Scholar] [CrossRef]
- Huang, D.; Ou, B.; Hampsch-Woodill, M.; Flanagan, J.; Prior, R. High-throughput assay of oxygen radical absorbance capacity (ORAC) using a multichannel liquid handling system coupled with a microplate fluorescence reader in 96-well format. J. Agric. Food Chem. 2002, 50, 4437–4444. [Google Scholar] [CrossRef]
- Cao, G.H.; Alessio, H.M.; Cutler, R.G. Oxygen-radical absorbance capacity assay for antioxidants. Free Radic. Biol. Med. 1993, 14, 303–311. [Google Scholar] [CrossRef]
- Varzaru, I.; Untea, A.E.; Martura, T.; Olteanu, M.O.; Panaite, T.D.; Schitea, M.S.; Van, I. Development and validation of an RP-HPLC method for methionine, cystine and lysine separation and determination in corn samples. Rev. Chim. Buchar. 2013, 64, 673–679. [Google Scholar]
- Prior, R.L.; Cao, G. Analysis of botanicals and dietary supplements for antioxidant capacity: A review. AOAC Int. 2000, 83, 950–956. [Google Scholar]
- Lawton, W.R. Heat Sensitive Recording Composition Containing a Complexed Phenolics and a Spiropyran or Leuco Lactone. U.S. Patent 4,097,288, 27 June 1978. [Google Scholar]
- Al-Dhabi, N.; Valan Arasu, M. Quantification of phytochemicals from commercial Spirulina products and their antioxidant activities. Evid.-Based Complement. Altern. Med. 2016, 58, 1–13. [Google Scholar] [CrossRef] [PubMed]
- El-Baky, H.H.A.; El Baz, F.K.; El-Baroty, G.S. Characterization of nutraceutical compounds in blue green alga Spirulina maxima. J. Med. Plants Res. 2008, 2, 292–300. [Google Scholar]
- Shukla, V.; Vashistha, M.; Singh, S.N. Evaluation of antioxidant profile and activity of amalaki (Emblica officinalis), spirulina and wheat grass. Indian J. Clin. Biochem. 2009, 24, 70–75. [Google Scholar] [CrossRef]
- Hajimahmoodi, M.; Faramarzi, M.A.; Mohammadi, N.; Soltani, N.; Oveisi, M.R.; Nafissi-Varcheh, N. Evaluation of antioxidant properties and total phenolic contents of some strains of microalgae. J. Phycol. 2010, 22, 43–50. [Google Scholar] [CrossRef]
- Tawaha, K.; Alali, F.Q.; Gharaibeh, M.; Mohammad, M.; El-Elimat, T. Antioxidant activity and total phenolic content of selected Jordanian plant species. Food Chem. 2007, 104, 1372–1378. [Google Scholar] [CrossRef]
- Cai, Y.; Luo, Q.; Sun, M.; Corke, H. Antioxidant activity and phenolic compounds of 112 traditional Chinese medicinal plants associated with anticancer. Life Sci. 2004, 74, 2157–2184. [Google Scholar] [CrossRef]
- Jimenez-Escrig, A.; Jimenez-Jimenez, I.; Pulido, R.; Saura-Calixto, F. Antioxidant activity of fresh and processed edible seaweeds. J. Sci. Food Agric. 2001, 81, 530–534. [Google Scholar] [CrossRef]
- Zheng, W.; Wang, S.Y. Antioxidant activity and phenolic compounds in selected herbs. J. Agric. Food Chem. 2001, 49, 5165–5170. [Google Scholar] [CrossRef]
- Dudonné, S.; Vitrac, X.; Coutière, P.; Woillez, M.; Mérillon, J.M. Comparative study of antioxidant properties and total phenolic content of 30 plant extracts of industrial interest using DPPH, ABTS, FRAP, SOD, and ORAC assays. J. Agric. Food Chem. 2009, 57, 1768–1774. [Google Scholar] [CrossRef]
- Li, H.B.; Cheng, K.W.; Wong, C.C.; Fan, K.W.; Chen, F.; Jiang, Y. Evaluation of antioxidant capacity and total phenolic content of different fractions of selected microalgae. Food Chem. 2007, 102, 771–776. [Google Scholar] [CrossRef]
- Apak, R.; Özyürek, M.; Güçlü, K.; Çapanoğlu, E. Antioxidant activity/capacity measurement. 1. Classification, physicochemical principles, mechanisms, and electron transfer (ET)-based assays. J. Agric. Food Chem. 2016, 64, 997–1027. [Google Scholar] [CrossRef] [PubMed]
- Alzahrani, M.A.J.; Perera, C.O.; Hemar, Y. Production of bioactive proteins and peptides from the diatom Nitzschia laevis and comparison of their in vitro antioxidant activities with those from Spirulina platensis and Chlorella vulgaris. Int. J. Food Sci. Techonol. 2017, 29, 128–130. [Google Scholar] [CrossRef]
- Sarada, R.M.G.P.; Pillai, M.G.; Ravishankar, G.A. Phycocyanin from Spirulina sp: Influence of processing of biomass on phycocyanin yield, analysis of efficacy of extraction methods and stability studies on phycocyanin. Proc. Biochem. 1999, 34, 795–801. [Google Scholar] [CrossRef]
- Boussiba, S.; Richmond, A.E. C-phycocyanin as a storage protein in the blue-green alga Spirulina platensis. Arch. Microbiol. 1980, 125, 143–147. [Google Scholar] [CrossRef]
- Carmichael, W.W.; Stukenberg, M. Blue-Green Algae (Cyanobacteria). In Encyclopedia of Dietary Supplements, 1st ed.; Informa Healthcare: London, UK, 2006; Volume 1. [Google Scholar]
- Patel, A.; Mishra, S.; Pawar, R.; Ghosh, P. Purification and characterization of C-Phycocyanin from cyanobacterial species of marine and freshwater habitat. Protein Express. Purif. 2005, 40, 248–255. [Google Scholar] [CrossRef] [PubMed]
- Tarko, T.; Duda-Chodak, A.; Kobus, M. Influence of growth medium composition on synthesis of bioactive compounds and antioxidant properties of selected strains of Arthrospira cyanobacteria. Czech J. Food Sci. 2012, 30, 258–267. [Google Scholar] [CrossRef]
- Zaid, A.; Hammad, D.; Sharaf, E. Antioxidant and anticancer activity of Spirulina platensis water extracts. Int. J. Pharm. 2015, 11, 846–851. [Google Scholar] [CrossRef]
- Chu, W.; Lim, Y.; Radhakrishnan, A.; Lim, P. Protective effect of aqueous extract from Spirulina platensis against cell death induced by free radicals. BMC Complement. Altern. Med. 2010, 10, 112–119. [Google Scholar] [CrossRef]
- Madhyastha, H.; Vatsala, T.M. Cysteine rich cyanopeptide β2 from Spirulina fussiformis exhibits plasmid DNA pBR322 scission prevention and cellular antioxidant activity. Indian J. Exp. Biol. 2010, 48, 486–493. [Google Scholar]
- Madhyastha, H.K.; Sivashankari, S.; Vatsala, T.M. C-phycocyanin from Spirulina fussiformis exposed to blue light demonstrates higher efficacy of in vitro antioxidant activity. Biochem. Eng. J. 2009, 43, 221–224. [Google Scholar] [CrossRef]
- Cao, G.; Booth, S.L.; Sadowski, J.A.; Prior, R.L. Increases in human plasma antioxidant capacity after consumption of controlled diets high in fruit and vegetables. Am. J. Clin. Nutr. 1998, 68, 1081–1087. [Google Scholar] [CrossRef] [PubMed]
- Prior, R.L.; Cao, G.; Martin, A.; Sofic, E.; McEwen, J.; O’Brien, C.; Lischner, N.; Ehlenfeldt, M.; Kalt, W.; Krewer, G.; et al. Antioxidant capacity as influenced by total phenolic and anthocyanin content, maturity, and variety of Vaccinium species. J. Agric. Food Chem. 1998, 46, 2686–2693. [Google Scholar] [CrossRef]
- Cao, G.; Sofic, E.; Prior, R.L. Antioxidant capacity of tea and common vegetables. J. Agric. Food Chem. 1996, 44, 3426–3431. [Google Scholar] [CrossRef]
- Wang, H.; Cao, G.; Prior, R.L. Total antioxidant capacity of fruits. J. Agric. Food Chem. 1996, 44, 701–705. [Google Scholar] [CrossRef]
- Prior, R.L.; Hoang, H.A.; Gu, L.; Wu, X.; Bacchiocca, M.; Howard, L.; Hampsch-Woodill, M.; Huang, D.; Ou, B.; Jacob, R. Assays for hydrophilic and lipophilic antioxidant capacity (oxygen radical absorbance capacity (ORACFL)) of plasma and other biological and food samples. J. Agric. Food Chem. 2003, 51, 3273–3279. [Google Scholar] [CrossRef] [PubMed]
- Kumar, D.; Dhar, D.W.; Pabbi, S.; Kumar, N.; Walia, S. Extraction and purification of C-phycocyanin from Spirulina platensis (CCC540). Indian J. Plant Physiol. 2014, 19, 184–188. [Google Scholar] [CrossRef] [PubMed]
- Gibbs, B.F.; Zougman, A.; Masse, R.; Mulligan, C. Production and characterization of bioactive peptides from soy hydrolysate and soy-fermented food. Food Res. Int. 2004, 37, 123–131. [Google Scholar] [CrossRef]
- Vo, T.S.; Ryu, B.; Kim, S.K. Purification of novel anti-inflammatory peptides from enzymatic hydrolysate of the edible microalgal Spirulina maxima. J. Funct. Foods 2013, 5, 1336–1346. [Google Scholar] [CrossRef]
- Harnedy, P.A.; FitzGerald, R.J. Bioactive peptides from marine processing waste and shellfish: A review. J. Funct. Foods 2012, 4, 6–24. [Google Scholar] [CrossRef]
- Ngo, D.H.; Vo, T.S.; Ngo, D.N.; Wijesekara, I.; Kim, S.K. Biological activities and potential health benefits of bioactive peptides derived from marine organisms. Int. J. Biol. Macromol. 2012, 51, 378–383. [Google Scholar] [CrossRef] [PubMed]
- Aneiros, A.; Garateix, A. Bioactive peptides from marine sources: Pharmacological properties and isolation procedures. J. Chromatogr. A 2004, 803, 41–53. [Google Scholar] [CrossRef] [PubMed]
- Kim, S.K.; Wijesekara, I. Development and biological activities of marine-derived bioactive peptides: A review. J. Funct. Foods 2010, 2, 1–9. [Google Scholar] [CrossRef]
- Murray, B.A.; FitzGerald, R.J. Angiotensin converting enzyme inhibitory peptides derived from food proteins: Biochemistry, bioactivity and production. Curr. Pharm. Des. 2007, 13, 773–791. [Google Scholar] [CrossRef] [PubMed]
- Tokuşoglu, Ö.; Üunal, M.K. Biomass nutrient profiles of three microalgae: Spirulina platensis, Chlorella vulgaris, and Isochrisis galbana. J. Food Sci. 2003, 68, 1144–1148. [Google Scholar] [CrossRef]
- Hristov, A.N.; Ropp, J.K.; Zaman, S.; Melgar, A. Effects of essential oils on in vitro ruminal fermentation and ammonia release. Anim. Feed Sci. Technol. 2008, 144, 55–64. [Google Scholar] [CrossRef]
- Foti, M.C.; Daquino, C.; Geraci, C. Electron-transfer reaction of cinnamic acids and their methyl esters with the DPPH• radical in alcoholic solutions. J. Org. Chem. 2004, 69, 2309–2314. [Google Scholar] [CrossRef]
- Bondet, V.; Brand-Williams, W.; Berset, C. Kinetics and mechanisms of antioxidant activity using the DPPH free radical method. LWT Food Sci. Technol. 1997, 30, 609–615. [Google Scholar] [CrossRef]
- Huang, D.; Ou, B.; Prior, R. The chemistry behind antioxidant capacity assays. J. Agric. Food Sci. 2005, 53, 1841–1856. [Google Scholar] [CrossRef]
- Wu, X.; Beecher, G.R.; Holden, J.M.; Haytowitz, D.B.; Gebhardt, S.E.; Prior, R.L. Lipophilic and hydrophilic anti- oxidant capacities of common foods in the United States. J. Agric. Food Chem. 2004, 52, 4026–4037. [Google Scholar] [CrossRef]
- Radakovits, R.; Jinkerson, R.; Darzins, A.; Posewitz, M. Genetic engineering of algae for enhanced biofuel production. J. Eukaryot Cell 2010, 9, 486–501. [Google Scholar] [CrossRef] [PubMed]
- Siro, I.; Kápolna, E.; Kápolna, B.; Lugasi, A. Functional food. Product development, marketing and consumer acceptance—A review. J. Appet. 2008, 51, 456–467. [Google Scholar] [CrossRef] [PubMed]
- Gutiérrez-Salmeán, G.; Fabila-Castillo, L.; Chamorro-Cevallos, G. Nutritional and toxicological aspects of Spirulina (Arthrospira). Nutr. Hosp. 2015, 32, 34–40. [Google Scholar] [PubMed]
- Richmond, A. Microalgal biotechnology. J. Chem. Technol. Biochem. 1988, 47, 181–182. [Google Scholar]
- Makkar, H.P.; Tran, G.; Heuzé, V.; Giger-Reverdin, S.; Lessire, M.; Lebas, F.; Ankers, P. Seaweeds for livestock diets: A review. Anim. Feed Sci. Technol. 2016, 212, 1–17. [Google Scholar] [CrossRef]
- Ikeda, M. Amino acid production processes. In Microbial Production of L-Amino Acids; Robert, F., Jugen, T., Bathe, V.G., Debabov, S., Eds.; Springer: Berlin/Heidelberg, Germany, 2003; pp. 1–35. [Google Scholar]
- Kumar, D.; Gomes, J. Methionine production by fermentation. Biotechnol. Adv. 2005, 23, 41–47. [Google Scholar] [CrossRef]
- Niccolai, A.; Shannon, E.; Abu-Ghannam, N.; Biondi, N.; Rodolfi, L.; Tredici, M.R. Lactic acid fermentation of Arthrospira platensis (spirulina) biomass for probiotic-based products. J. Appl. Phycol. 2018, 1–7. [Google Scholar] [CrossRef]
- Bao, J.; Zhang, X.; Zheng, J.H.; Ren, D.F.; Lu, J. Mixed fermentation of Spirulina platensis with Lactobacillus plantarum and Bacillus subtilis by random-centroid optimization. Food Chem. 2018, 264, 64–72. [Google Scholar] [CrossRef]
- Liu, J.G.; Hou, C.W.; Lee, S.Y.; Chuang, Y.; Lin, C.C. Antioxidant effects and UVB protective activity of Spirulina (Arthrospira platensis) products fermented with lactic acid bacteria. Proc. Biochem. 2011, 46, 1405–1410. [Google Scholar] [CrossRef]
- Choi, W.; Kang, D.; Heo, S.J.; Lee, H. Enhancement of the neuroprotective effect of fermented Spirulina maxima associated with antioxidant activities by ultrasonic extraction. Appl. Sci. 2018, 8, 2469. [Google Scholar] [CrossRef]


| Lyophilised Spirulina (2 mg/mL) | |||||||
|---|---|---|---|---|---|---|---|
| Fermentation treatment | none | 12 h | 24 h | 36 h | 48 h | 60 h | 72 h |
| Supernatant colour |  |  |  |  |  |  |  |
© 2019 by the authors. Licensee MDPI, Basel, Switzerland. This article is an open access article distributed under the terms and conditions of the Creative Commons Attribution (CC BY) license (http://creativecommons.org/licenses/by/4.0/).
Share and Cite
de Marco Castro, E.; Shannon, E.; Abu-Ghannam, N. Effect of Fermentation on Enhancing the Nutraceutical Properties of Arthrospira platensis (Spirulina). Fermentation 2019, 5, 28. https://doi.org/10.3390/fermentation5010028
de Marco Castro E, Shannon E, Abu-Ghannam N. Effect of Fermentation on Enhancing the Nutraceutical Properties of Arthrospira platensis (Spirulina). Fermentation. 2019; 5(1):28. https://doi.org/10.3390/fermentation5010028
Chicago/Turabian Stylede Marco Castro, Elena, Emer Shannon, and Nissreen Abu-Ghannam. 2019. "Effect of Fermentation on Enhancing the Nutraceutical Properties of Arthrospira platensis (Spirulina)" Fermentation 5, no. 1: 28. https://doi.org/10.3390/fermentation5010028
APA Stylede Marco Castro, E., Shannon, E., & Abu-Ghannam, N. (2019). Effect of Fermentation on Enhancing the Nutraceutical Properties of Arthrospira platensis (Spirulina). Fermentation, 5(1), 28. https://doi.org/10.3390/fermentation5010028